LIGO- G020309-00-Z Beyond the PSD: Discovering hidden nonlinearity Tiffany Summerscales Penn State...
10
LIGO-G020309-00-Z Beyond the PSD: Discovering hidden nonlinearity Tiffany Summerscales Penn State University
-
Upload
neal-hines -
Category
Documents
-
view
221 -
download
1
Transcript of LIGO- G020309-00-Z Beyond the PSD: Discovering hidden nonlinearity Tiffany Summerscales Penn State...

LIGO-G020309-00-Z
Beyond the PSD:Discovering hidden nonlinearity
Tiffany Summerscales
Penn State University
August 21, 2002 Penn State University 2
LIGO-G020309-00-Z
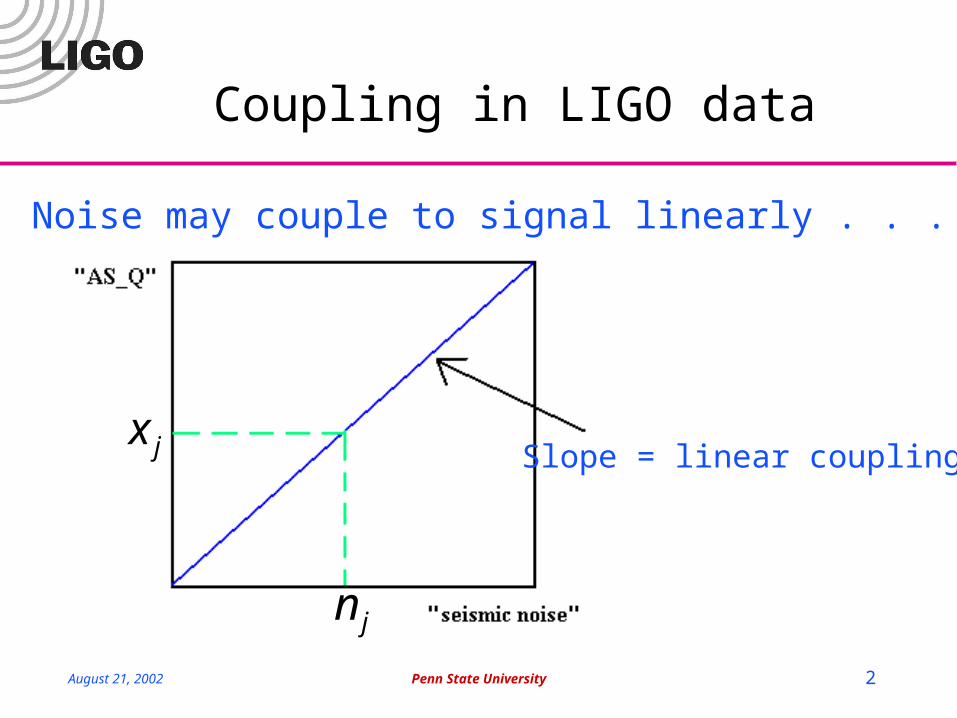
Slope = linear couplingjx
jn
Noise may couple to signal linearly . . .
Coupling in LIGO data

August 21, 2002 Penn State University 3
LIGO-G020309-00-Z
Gain =
jx
jn
Or non-linearly: e.g., hysteresis
)1( kjn
: nonlinearity parameter
)1( kjjj nnx
Coupling in LIGO data
August 21, 2002 Penn State University 4
LIGO-G020309-00-Z
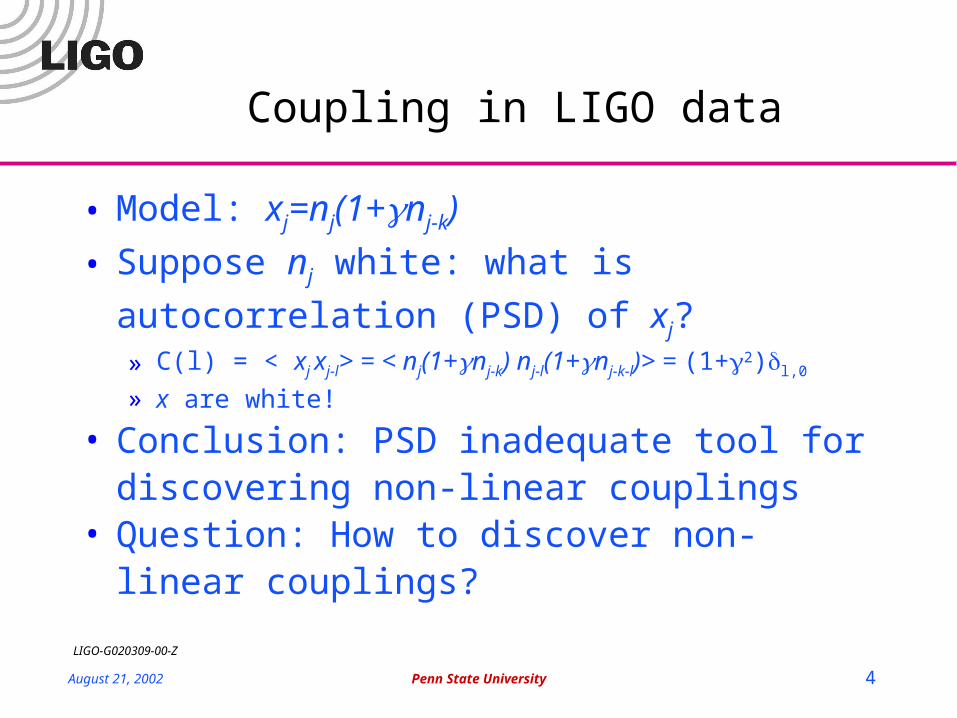
• Model: xj=nj(1+nj-k)
• Suppose nj white: what is autocorrelation
(PSD) of xj?» C(l) = < xj xj-l> = < nj(1+nj-k) nj-l(1+nj-k-l)> = (1+2)l,0
» x are white!
• Conclusion: PSD inadequate tool for discovering non-linear couplings
• Question: How to discover non-linear couplings?
Coupling in LIGO data
August 21, 2002 Penn State University 5
LIGO-G020309-00-Z
Non-linear couplings lead to correlations in time
• Correlations still present, just non-linear and, so, hidden from linear tools» xj=nj(1+nj-k): Signal now depends on noise now, and noise earlier
• Uncorrelated signals lead to Poisson distributed events» Event? Sample above a threshold
• Correlated signals lead to non-Poissonian distribution» Clustering or anti-clustering in time
• Discovery tool: test for Poisson distribution of event data

August 21, 2002 Penn State University 6
LIGO-G020309-00-Z
Test for non-linear coupling
• Identify events» Set a threshold and classify above-threshold data points as “events”
– events for non-correlated data will be Poisson distributed in time
– events for data with correlations will be “bunched” and not be Poisson distributed
• Test for Poisson distribution» Poisson distribution of events in interval T equivalent to exponential
distribution of interval t between successive events» Bin intervals between events
– Find mean rate
– Choose bins with exponentially increasing width so that - for Poisson data - expected number of events in each bin is same
» Evaluate 2 fit to exponential distribution– Degrees of freedom ? Number of bins less 2 (loose one d.o.f. because we
calculated mean rate from data)
» Non-linear coupling? / statistically different from unity
August 21, 2002 Penn State University 7
LIGO-G020309-00-Z
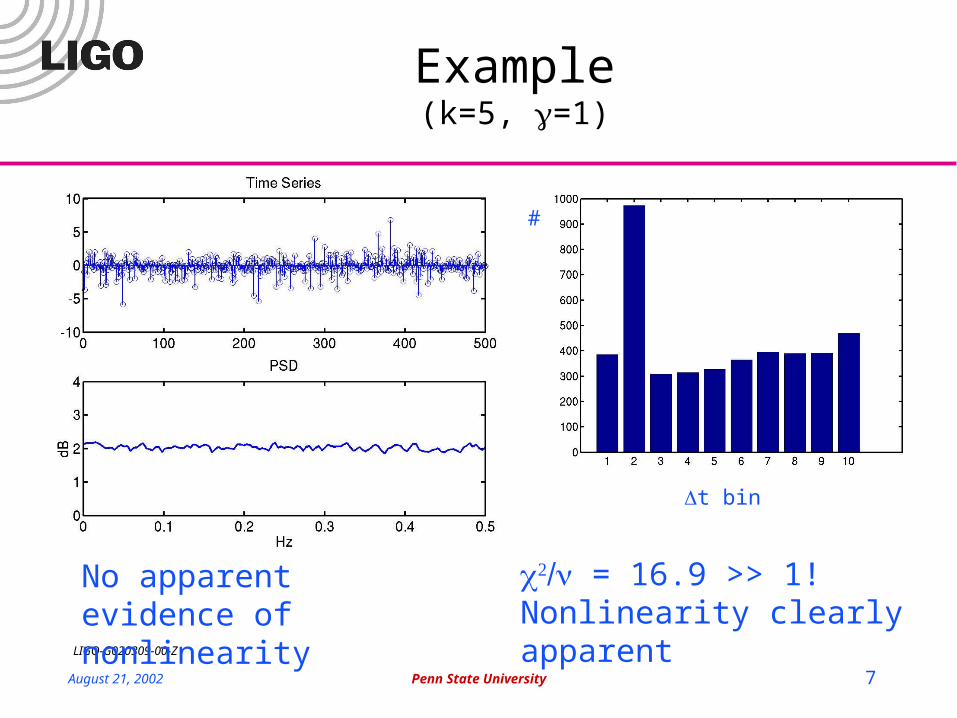
No apparent evidence of nonlinearity
Example(k=5, =1)
#
t bin
= 16.9 >> 1!Nonlinearity clearly apparent
August 21, 2002 Penn State University 8
LIGO-G020309-00-Z
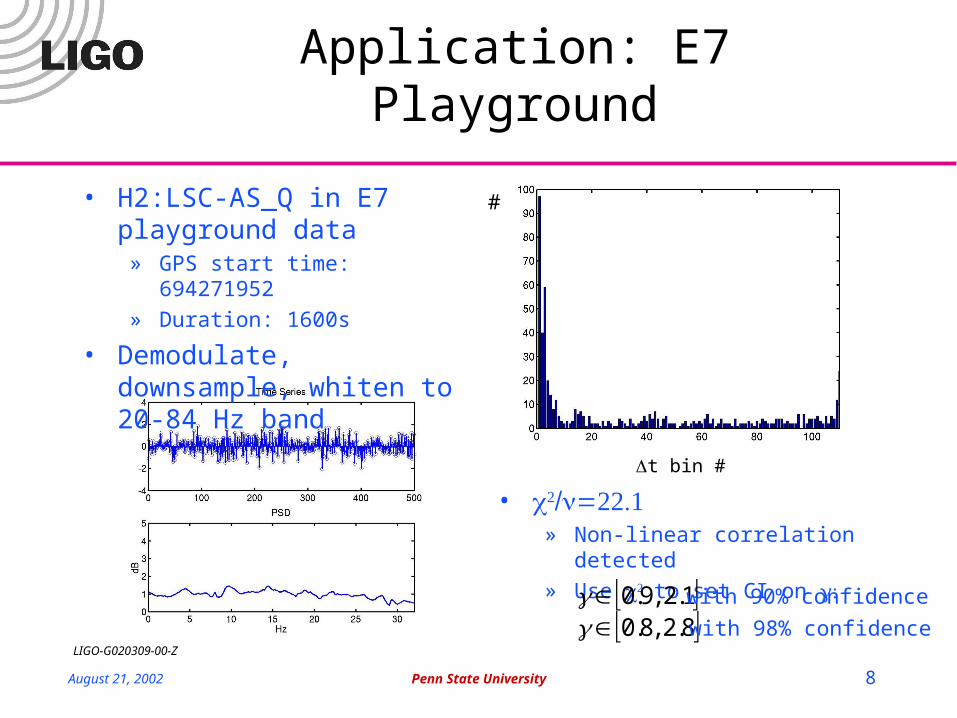
Application: E7 Playground
• H2:LSC-AS_Q in E7 playground data
» GPS start time: 694271952» Duration: 1600s
• Demodulate, downsample, whiten to 20-84 Hz band
t bin #
#
• » Non-linear correlation detected» Use to set CI on
1.2,9.0 8.2,8.0
with 90% confidence
with 98% confidence
August 21, 2002 Penn State University 9
LIGO-G020309-00-Z
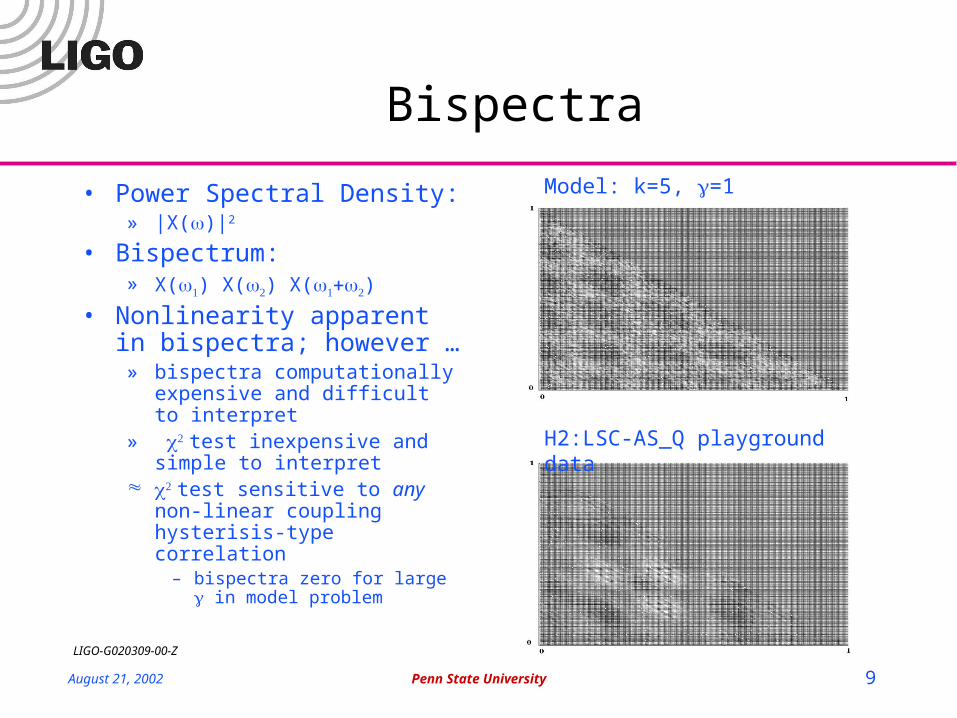
Real part of Bispectrum
Bispectra
• Power Spectral Density:» |X()|2
• Bispectrum:» X() X() X()
• Nonlinearity apparent in bispectra; however …
» bispectra computationally expensive and difficult to interpret
» test inexpensive and simple to interpret
test sensitive to any non-linear coupling hysterisis-type correlation
– bispectra zero for large in model problem
H2:LSC-AS_Q playground data
Model: k=5, =1
August 21, 2002 Penn State University 10
LIGO-G020309-00-Z
What’s Next?
• Investigate S1 data» Study data in sub-bands looking for frequency dependent non-
couplings
• DMT Monitor» Currently matlab tool