Light-induced c-Fos Expression in the Mouse ... · day elicit neither c-Fos nor phase shifts....
11
European Journal of Neuroscience, Vol. 9, pp. 1950-1960, 1997 0 European Neuroscience Association Light-induced c-Fos Expression in the Mouse Suprachiasmatic Nucleus: I mmunoelectron Microscopy Reveals Co-localization in Multiple Cell Types Mona Castell, Michael Belenkyl, Shulamith Cohen', Shlomo Wagne6 and William J. Schwartz3 'Department of Cell and Animal Biology and 2Department of Neurobiology, Silberman Institute of Life Sciences, Hebrew University of Jerusalem, Jerusalem 91904, tsrael 3Departmentof Neurology, University of Massachusetts Medical School, Worcester, MA, USA Keywords: circadian clock, dual immunocytochemical labelling, immediate early gene, Sabra mouse Abstract Although light is known to regulate the level of c-fos gene expression in the suprachiasmatic nucleus (SCN), the site of an endogenous circadian clock, little is known about the identities of the photically activated cells. We used light-microscopicimmunocytochemistry and immunoelectron microscopy to detect c-Fos protein in the SCN of Sabra mice exposed to brief nocturnal tight pulses at zeitgeber time 15-16. Stimulation with light pulses that saturated the phase-shifting response of the circadian locomotor rhythm revealed an upper limit to the number of photo-inducible c-Fos cells at about one-fifth of the estimated total SCN cell population. This functionally defined set was morphologically and phenotypically heterogeneous. About 24% could be labelled for vasoactive intestinal polypeptide, 13% for vasopressin-neurophysin, and 7% for glial fibrillary acidic protein. The remaining 56% of c-Fos-positive cells were largely of unknown phenotype, although many were presumptive interneurons, some of which were imrnunoreactive for nitric oxide synthase. Introduction Daily behavioural, physiological and hormonal rhythms in mammals are governed by an endogenous circadian clock located in the suprachiasmatic nucleus (SCN) of the hypothalamus (for review see Klein et al., 1991). Visual input to the SCN serves to synchronize the phases and periods of these rhythms to the environmental day- night cycle. Although the molecular mechanisms for such photic entrainment are unknown, activation of immediate-early genes in the SCN probably plays a role (for reviews see Kornhauser et al., 1993; Abe and Rusak, 1994; Hastings et al., 1995; Schwartz et al., 1995). The most intensively studied of these genes, c-fos, encodes a sequence-specific DNA-binding protein that alters the expression of target genes by regulating their transcription (for review see Morgan and Curran, 1991). Levels of c-fos mRNA and immunoreactive c- Fos protein in the retinorecipient zone of the rodent SCN are dramatically elevated (from essentially undetectable levels) by light. The threshold, magnitude and phase-dependenceof this photic activa- tion correlate with photically induced phase shifts of overt circadian rhythmicity. Light pulses, administered during the dark phase of the light-dark cycle or during the subjective night in constant darkness, evoke c-Fos (as well as delaying or advancing phase shifts of overt rhythms), whereas light pulses delivered during most of the subjective day elicit neither c-Fos nor phase shifts. Furthermore, in the hamster, pharmacological agents that block behavioural phase shifts also block the photic stimulation of c-Fos in specific regions of the SCN. Light- induced phase delays of the rat locomotor rhythm are prevented by intracerebroventricular injections of antisense phosphorothioate oligodeoxynucleotidesto both c-fos and junB (Wollnik et al., 1995). These findings have led to the idea that transcriptionalmechanisms in general, and c-Fos in particular, are involved in the photic entrainment of circadian rhythmicity. Among the critical issues that need to be addressed are the elucidation of the signal transduction pathways for the photic activation of c-Fos and the target gene candidates for transcriptional regulation by c-Fos. Establishing the identity of the SCN cells that express c-Fos should contribute to addressing these questions, and attempts have been made to co- localize the immunoreactive c-Fos protein to known peptidergic neurons in the rat SCN (Daikoku et aL, 1992; Earnest et al., 1993; Mikkelsen et al., 1994; Romijn et al., 1996; Speh and Moore, 1996). Photically induced c-Fos has also been co-localized to a subpopulation of calmodulin-containing cells in the hamster SCN (Silver et al., 1996). However, it is noteworthy that only a minority of the entire c-Fos nuclear population in the SCN has thus far been attributed to any one identified neuronal phenotype, which has prompted the suggestion that some c-Fos-positive cells may be glial (Bennett and Schwartz, 1994). Much of this previous work was inconclusive partly because the small size and high packing density of double-labelled cells in the SCN make their identification uncertain at the light microscope level. Correspondence to: Prof. Mona Castel, as above Received 29 August 1996, revised 19 March 1997, accepted I4 April 1997
-
Upload
nguyentuyen -
Category
Documents
-
view
222 -
download
0
Transcript of Light-induced c-Fos Expression in the Mouse ... · day elicit neither c-Fos nor phase shifts....
European Journal of Neuroscience, Vol. 9, pp. 1950-1960, 1997 0 European Neuroscience Association
Light-induced c-Fos Expression in the Mouse Suprachiasmat ic Nucleus: I mm unoelect ron Microscopy Reveals Co-localization in Multiple Cell Types
Mona Castell, Michael Belenkyl, Shulamith Cohen', Shlomo Wagne6 and William J. Schwartz3 'Department of Cell and Animal Biology and 2Department of Neurobiology, Silberman Institute of Life Sciences, Hebrew University of Jerusalem, Jerusalem 91904, tsrael 3Department of Neurology, University of Massachusetts Medical School, Worcester, MA, USA
Keywords: circadian clock, dual immunocytochemical labelling, immediate early gene, Sabra mouse
Abstract
Although light is known to regulate the level of c-fos gene expression in the suprachiasmatic nucleus (SCN), the site of an endogenous circadian clock, little is known about the identities of the photically activated cells. We used light-microscopic immunocytochemistry and immunoelectron microscopy to detect c-Fos protein in the SCN of Sabra mice exposed to brief nocturnal tight pulses at zeitgeber time 15-16. Stimulation with light pulses that saturated the phase-shifting response of the circadian locomotor rhythm revealed an upper limit to the number of photo-inducible c-Fos cells at about one-fifth of the estimated total SCN cell population. This functionally defined set was morphologically and phenotypically heterogeneous. About 24% could be labelled for vasoactive intestinal polypeptide, 13% for vasopressin-neurophysin, and 7% for glial fibrillary acidic protein. The remaining 56% of c-Fos-positive cells were largely of unknown phenotype, although many were presumptive interneurons, some of which were imrnunoreactive for nitric oxide synthase.
Introduction
Daily behavioural, physiological and hormonal rhythms in mammals are governed by an endogenous circadian clock located in the suprachiasmatic nucleus (SCN) of the hypothalamus (for review see Klein et al., 1991). Visual input to the SCN serves to synchronize the phases and periods of these rhythms to the environmental day- night cycle. Although the molecular mechanisms for such photic entrainment are unknown, activation of immediate-early genes in the SCN probably plays a role (for reviews see Kornhauser et al., 1993; Abe and Rusak, 1994; Hastings et al., 1995; Schwartz et al., 1995).
The most intensively studied of these genes, c-fos, encodes a sequence-specific DNA-binding protein that alters the expression of target genes by regulating their transcription (for review see Morgan and Curran, 1991). Levels of c-fos mRNA and immunoreactive c- Fos protein in the retinorecipient zone of the rodent SCN are dramatically elevated (from essentially undetectable levels) by light. The threshold, magnitude and phase-dependence of this photic activa- tion correlate with photically induced phase shifts of overt circadian rhythmicity. Light pulses, administered during the dark phase of the light-dark cycle or during the subjective night in constant darkness, evoke c-Fos (as well as delaying or advancing phase shifts of overt rhythms), whereas light pulses delivered during most of the subjective day elicit neither c-Fos nor phase shifts. Furthermore, in the hamster, pharmacological agents that block behavioural phase shifts also block the photic stimulation of c-Fos in specific regions of the SCN. Light-
induced phase delays of the rat locomotor rhythm are prevented by intracerebroventricular injections of antisense phosphorothioate oligodeoxynucleotides to both c-fos and junB (Wollnik et al., 1995).
These findings have led to the idea that transcriptional mechanisms in general, and c-Fos in particular, are involved in the photic entrainment of circadian rhythmicity. Among the critical issues that need to be addressed are the elucidation of the signal transduction pathways for the photic activation of c-Fos and the target gene candidates for transcriptional regulation by c-Fos. Establishing the identity of the SCN cells that express c-Fos should contribute to addressing these questions, and attempts have been made to co- localize the immunoreactive c-Fos protein to known peptidergic neurons in the rat SCN (Daikoku et aL, 1992; Earnest et al., 1993; Mikkelsen et al., 1994; Romijn et al., 1996; Speh and Moore, 1996). Photically induced c-Fos has also been co-localized to a subpopulation of calmodulin-containing cells in the hamster SCN (Silver et al., 1996). However, it is noteworthy that only a minority of the entire c-Fos nuclear population in the SCN has thus far been attributed to any one identified neuronal phenotype, which has prompted the suggestion that some c-Fos-positive cells may be glial (Bennett and Schwartz, 1994).
Much of this previous work was inconclusive partly because the small size and high packing density of double-labelled cells in the SCN make their identification uncertain at the light microscope level.
Correspondence to: Prof. Mona Castel, as above
Received 29 August 1996, revised 19 March 1997, accepted I 4 April 1997

Immuno-ultrastructural localization of c-Fos protein in the SCN 1951
lmrnunocytochemistry After photic stimulation, mice were deeply anaesthetized by i.p. injection of Nembutal under a dark-red safelight, and their eyes were covered with black insulation tape. Prior to perfusion, -50 pl heparin (5000 IU/ml; Choay, Paris, France) was injected into the left cardiac ventricle. The circulation was perfused with PBS, then with freshly prepared fixative containing 4% p-formaldehyde, 0.1% glutaraldehyde (Electron Microscopy Sciences, Fort Washington, PA, USA) and 0.2% picric acid in 0.1 M phosphate buffer at pH 7.0. Brains were then removed and immersed in fixative for 2-3 h at room temperature, after which they were cut as 50 pm serial coronal sections on a vibratome into Tris-buffered saline (TBS), pH 7.0. Each mouse brain provided about eight to ten serial sections containing the SCN, of which alternate sections were taken for light and electron microscope immunocytochemistry or for cresyl violet staining.
Two different affinity-purified, polyclonal anti-Fos antibodies gen- erated in rabbits were used, one directed against a synthetic Fos peptide (amino acids 128-153 of rat c-Fos) conjugated to keyhole limpet haemocyanin (1:400; kindly supplied by Dr Michael Iadarola, National Institutes of Health, Bethesda, MD) and a second directed against a different peptide (amino acids 4-17 of human c-Fos) (1:150; Ab-2; Oncogene Science, Cambridge, MA, USA). Also used were polyclonal anti-VIP (Incstar, Stillwater, MN, USA), monoclonal anti- VP-NP (Ben-Barak et aL, 1985) and rabbit polyclonal antiserum to GFAP raised against an antigen purified from human brain (Biomakor, Rehovot, Israel). Three rabbit antisera for NOS were used against neuronal NOS (NOS-I), macrophage NOS (iNOS) and endothelial NOS (eNOS), all obtained from Affiniti Research Products, Minehead, EX, UK.
Moreover, a submaximal photic stimulus might activate only a fraction of the entire c-Fos population, raising the possibility that different lighting regimes might excite different cellular subgroups rather than the whole set. Lastly, most of the co-localization data have come from the rat SCN, where c-Fos cells are limited to a ventrolateral distribution, raising the concern that conclusions might not be generalizable.
This paper seeks to resolve these issues, including presentation of the ultrastructural localization of the c-Fos protein in the SCN by immunoelectron microscopy. Photic activation of c-fos gene expres- sion in the mouse SCN has been described previously by Colwell and Foster (1992) and Schwartz et al. (1996). and the Sabra mouse SCN, with whose ultrastructure we are familiar (Castel et al., 1990, 1993), was chosen for the present study .
For immuno-ultrastructural demonstration of the c-Fos protein, the crystalline chromogen tetramethyl benzidine (TMB) served as a distinctive electron-dense marker for nuclear c-Fos, and was well suited also for dual immunocytochemical co-localization in combina- tion with diffusely labelled cytoplasmic antigens. The latter included vasoactive intestinal polypeptide (VIP), vasopressin-associated neuro- physin (VF-NP) and nitric oxide synthase (NOS), all of which are associated with messenger molecules in the SCN, and also glial fibrillary acidic protein (GFAP). Our present results, derived by the use of light microscope immunocytochemstry, indicate that there is probably an upper limit to the number of SCN cells that express C- Fos after photic stimulation, and immunoelectron microscopy shows that this functionally defined population is morphologically and phenotypically heterogeneous. Brief preliminary reports of these findings have been made (Castel and Belenky, 1994; Castel et al., 1995).
Materials and methods
Animals
Adult male albino mice (25-30 g) of the Sabra strain were obtained from the Hebrew University Medical School and maintained individu- ally in clear polycarbonate cages within a well-ventilated room (26°C) under a 12 h light:12 h dark cycle for at least 3 weeks before experiments. Light intensity was -400-500 lux during the light phase; no light was present during darkness. Purina chow and water were provided freely, and cage handling was once weekly at random times.
For routine experiments photic stimulation was administered during the dark phase, 3-4 h after lights off [zeitgeber time (ZT) 15-16]. Individual mice were exposed to a single pulse of bright white light of various intensities. Different groups of mice were exposed to no light or to a single 15 min light pulse of 65 450 or 2300 lux, then returned to darkness for another 30 min. Animals were routinely killed 45 min after the onset of the pulse.
In order to assess the possible effect of different time schedules on the numbers of c-Fos-positive nuclei, pilot experiments at 65 450 or 2300 lux included: (i) exposure of mice to photic stimuli 9-10 h (instead of 3-4 h) after lights off, i.e. at ZT 21-22 (instead of ZT 15- 16); (ii) killing the mice at ZT 15-16, 90 min after the light pulse (instead of 45 min).
A total of 74 mice were used for the present study, as follows; quantitative light microscope c-Fos immunocytochemistry at ZT 15- 16, 45 min after light stimulation (n=22); in si fa hybridization (a= 20); light microscope immunocytochemistry for VIP, VP-NP, GFAP (n=3); additional dual ultrastructural immunocytochemistry (n=6); NOS immunocytochemistry (n=3); pilot experiments at ZT 21-22 (n=12), and 90 min after photic stimulation (n=8).
Light microscopy Interspersed by copious TBS washes, and using TBS as diluent, sections were sequentially treated with 25% methanol containing 0.3% H202 for 30 min; 0.5% sodium borohydride for 30 min; 1% Triton X-100 for 1 h; blocker containing 0.5% Triton X-100,2% egg albumin, 0.5% glycine and 0.5% lysine for 1 h; and primary antiserum with 0.5% Triton X-100 and 1% egg albumin for 12 h at room temperature. Labelling was visualized by the use of a biotin- avidin-peroxidase kit (ABC Elite, Vectastain; Vector Laboratories, Burlingame, CA) with diaminobenzidineH202 as chromogen. Sec- tions were lifted onto subbed slides, dipped briefly in 0.1% osmium tetroxide, dehydrated in ethanol, cleared in xylene, and coverslipped with Entellan (Merck).
Quantitation of c-Fos-immunoreactive nuclei
Counts of cell nuclei within the bilateral SCN were derived from five alternate serial coronal sections per mouse brain. The area within which the nuclei were counted was determined from corresponding cresyl violet stained sections (Fig. lA), which served as templates from which overlays were drawn. Within these circumscribed areas, all cell nuclei labelled for c-Fos (both strongly and faintly stained) were counted with the use of a meshed graticule in a Zeiss microscope at a magnification of X 100, repeated twice independently (by M. B. and S. C.). Since the template overlays had been drawn on a meshed background that corresponded with the mesh of the graticule, this facilitated recording of nuclear counts. For each bilateral SCN, the counts from five alternate serial vibratome sections were pooled. Areas were digitized from the overlays with the use of an IBM PC- compatible computer, Summasketch Plus digitizer (Summagraphics, Fairfield, CT, USA) and SigmaScan software (Jandel Scientific, Corte Madera, CA, USA). The sum of the areas, derived from five

1952 Immuno-ultrastructural localization of c-Fos protein in the SCN
FIG. 1. Micrographs of coronal vibrdtome sections from the suprachiasmatic nucleus (SCN) of Sabra mice at a similar rostrocaudal level. (A) Cresyl violet staining emphasizes the rounded shape of the SCN and the close packing of the small cell nuclei, The dotted border circumscribes the area within which c-Fos- positive nuclei were counted in corresponding immunocytochemically labelled sections. (B) Vasoactive intestinal polypeptide immunoreactivity in ventral somata and in processes throughout the nucleus. (C) Vasopressin-neurophysin immunoreactivity mainly in dorsomedial somata, in a few ventrolateral somata, and in processes throughout the nucleus. (D) Glial fibrillary acidic protein immunoreactivity within the SCN, in small astrocytic somatia and extensive processes. (E-H) c-Fos immunoreactivity in SCN sections from Sabra mice that had been exposed to a 15 min light pulse of different intensities at ZT 16. (E) Control, no light exposure. (F) 65 lux pulse. (G) 450 lux pulse. (H) 2300 lux pulse. Note the absence of c-Fos labelling within the SCN of the control, although there are some labelled cell nuclei dorsal to the SCN. All the light-exposed specimens reveal large numbers of c-Fos-immunoreactive cell nuclei throughout the SCN. 3V, third ventricle; OC, optic chiasma. Scale bars, 50 pn.

Immuno-ultrastructural localization of c-Fos protein in the SCN 1953
rostrocaudal levels of the bilateral SCN, represented the total area from which nuclei were counted for a particular specimen. Since this area was generally close to 0.5 mm2, nuclear counts were calculated and presented as number of cell nuclei per 0.5 mm2.
Electron microscopy Sections were processed as for light microscopy, except that methanol and Triton X-100 were omitted. The chromogen for visualizing c- Fos was TMB, followed by stabilization with diaminobenzidine, according to a modification of the Weinberg and Van Eyck (1991) procedure. Briefly, sections were washed in 0.1 M phosphate buffer (pH 6.0), preincubated in buffer containing 0.005% TMB and 0.5% ammonium paratungstate for 20 min, then incubated in this medium with 0.01% H202 added. Dark-blue reaction product labelled c-Fos nuclei within the SCN within 5-7 min. For stabilization, sections were incubated in 1% paratungstate in 0.1 M phosphate buffer (pH 6.9) for 20 min, washed in buffer, and treated with a diaminobenzidinel cobalt/H202 mixture in 0.1 M cacodylate buffer (pH 6.9), after which the reaction product turned greyish-blue. The entire TMB procedure was carried out at 4°C on a horizontal shaker. As required, alternate sections were dual-labelled for VIP, VP-NP, NOS or GFAP, with diaminobenzidine as the chromogen.
Immunoreacted sections were postfixed in I % osmium tetroxide and 1.5% potassium femcyanide in cacodylate buffer for 1 h at room temperature, dehydrated in ascending concentrations of ethanol, infiltrated with epoxy resin (EM-BED-8 12, Electron Microscopy Sciences, Fort Washington, PA, USA), flat-embedded in prefonned resin blocks, and polymerized for 2 days at 60°C. Ultrathin sections were cut with a diamond knife on an LKB I11 Ultratome and picked up on 300-mesh thin-bar grids. Sections were contrasted with lead citrate for 2-3 min and ethanolic uranyl acetate for 5 min, and viewed in a JEOL l0OCX or a Philips 300 electron microscope. Counting was done directly from the fluorescent screen and manually recorded on a mesh template corresponding to the thin-bar grid.
In situ hybridization Mice were exposed to no light (n=6) or to a single 15 min light pulse of either 65 (n=7) or 2300 (n=7) lux, returned to darkness for 30 min, then swiftly decapitated under a dark-red safe light. Brains were rapidly removed and frozen in 2-methylbutane cooled to -30°C with dry ice. Coronal cryostat sections (15 pm) through the SCN were mounted onto Vectabond-subbed slides, and processed for hybridization with a 35S-labelled c-fos cDNA, as previously described (Schwartz et aL, 1996). Slices were exposed to Hyperfilm mp (Amersham, Arlington Heights, IL), and the optical density (OD) of the autoradiographic hybridization signal was measured using a Zeiss (Kontron) Image Processing System. The size of the cursor was 100 pm2, and when centred over a unilateral SCN it was slightly smaller than the autoradiographic image. For each SCN, bilateral readings were taken from at least three sections, so that OD data for each mouse represents the average of at least six readings. This was expressed as a relative OD (ratio of the OD of the SCN to that of the surrounding hypothalamus).
The c-fos cDNA probe was derived from a 2.2 kb rat cDNA insert subcloned into the EcoRl site of pSP65 vector (Curran et al., 1987; recombinant plasmid generously supplied by Dr Tom Curran, Roche Institute of Molecular Biology, Nutley, NJ). It was prepared by cutting the cDNA with Ddel, retrieving the fragments by phenol-chloroform extraction and ethanol precipitation, and labelling with [35S]dCTP by the random primed method (Boehringer Mannheim, Indianapolis, IN). Labelled probe was isolated by passage through a Sephadex G-25 spin column (Boehringer).
Number of c-Fos Positive Cell Nuclei
Relative Optical Density, c-fos mRNA 30001
Controls 6 5 450 2300
Intensity of Light Pulse (lux)
FIG. 2. Expression of immunoreactive c-Fos protein (open columns) and in situ hybridized c-fos mRNA (smped columns) in the Sabra mouse SCN after 15 min exposure at ZT 15-16 to a single light pulses of different intensity. The open columns indicate the numbers of c-Fos-immunoreactive cell nuclei in controls (n=6) and after exposure to 65 (n=6), 450 (n=6) and 2300 (n= 4) lux. The mean cell counts for the four groups were significantly different (P = 0.006, Kruskal-Wallis one way analysis of variance on ranks), and pairwise comparisons using Dunn’s method showed that each of the light-stimulated groups was significantly different from the control (P < 0.05) but they were not significantly different from each other. The striped columns indicate optical density measurements from autoradiographs expressing c-jus mRNA levels in controls (n=6) and after exposure to 65 (n=7) and 2300 (n=7) lux. Thc mean optical densities for the three groups were significantly different (P = 0.002, Kruskal-Wallis one-way analysis of variance on ranks), and pairwise comparisons using Dunn’s method showed that both of the light-stimulated groups were significantly different from the control (P < 0.05) but not from each other. Each column represents mean ? SEM (see Materials and methods for details of counting and optical density procedures).
Results
Light microscopy The microanatomical borders of the SCN in the Sabra mouse were demarcated from cresyl violet-stained vibratome sections (Fig. 1 A), from which templates were drawn, as described under Materials and methods. Immunocytochemical labelling of corresponding sections showed that somata containing VIP were mostly located ventrally, including some embedded in the optic chiasma (Fig. lB), while those containing VP-NP were clustered mainly dorsomedially and in a discrete aggregation near the ventrolateral border of the SCN (Fig. 1 C). Processes, immunoreactive for these neuropeptides, ramified throughout the SCN. Astroglial labelling, defined by GFAP immuno- reactivity, was much more prominent in the SCN than in the surrounding hypothalamic tissue (Fig. ID), as has been described also in the SCN of other rodents (Morin et aL, 1989; Lavialle and Servikre, 1993).
Immunoreactive c-Fos protein levels in the Sabra mouse SCN were robustly elevated after animals were exposed to a light pulse administered during the dark phase of the light-dark cycle ( 3 4 h after lights-off), whereas the levels were barely detectable at this time in control mice maintained in darkness (Fig. 1E-H). Labelled cell nuclei, distributed extensively throughout the full extent of the mouse SCN, overlapped subdivisional boundaries demarcated by VIP- and VP-NP-immunoreactive somata.
Counts derived from bilateral SCNs of mice that had been photically exposed at ZT 15-16 indicated on average -1800 c-Fos-positive cell nuclei per 0.5 mm2, a total that did not increase further with increasing light intensity (Fig. 2). Pilot experiments in which mice were killed 90 min (instead of 45 min) after pulse onset yielded similar results

1954 Immuno-ultrastructural localization of c-Fos protein in the SCN
(not shown), further attesting to ‘saturation’ in numbers of c-Fos positive cells. In situ hybridization for c-fos mRNA was consistent with the immunocytochemical data. Exposure of animals to no light or to single 15-min light pulses or 65 or 2300 lux revealed that c-fos mRNA levels were not significantly different at the two light intensities (Fig. 2), which is compatible with similar data recently reported for C3WHeN mice (Benloucif et al., 1997).
Pilot experiments were also conducted during the latter part of the night, and showed that mice photically exposed to light at ZT 21-22 (not shown) yielded essentially similar nuclear counts to those exposed at ZT 15-16. This matches the observations of Colwell and Foster (1992) for Mus domesticus and of Masana et al. (1996) for C3H/ HeN mice, but differs from recent results in the rat, where light exposure during early night (ZT 14) yielded lower counts than exposure later in the night (ZT 19) (Romijn et al., 1996; Speh and Moore, 1996) (see Discussion).
lmmunoelectron microscopy At the ultrastructural level c-Fos-containing nuclei were identified by the presence of distinctive TMBltungstate spicule-like crystals, mainly within the paler euchromatic region of the karyoplasm (Figs 3 and 4). Nucleoli were invariably unlabelled. The number of TMB/ tungstate spicules per c-Fos-positive nucleus varied, while dual immunocytochemical procedures sometimes tended to reduce their electron density. Cytoplasmic labelling with TMBhngstate was rare, but occurred occasionally near the Golgi region (Fig. 3D), which may, indicate the ephemeral presence of c-Fos within the cytoplasm, prior to its accumulation within the nucleus. Non-specific background labelling was negligible.
In order to estimate at the ultrastructural level the proportion of SCN cell nuclei that were c-Fos-immunoreactive after photic stimulation, a total of 4838 nuclei were counted on 20 grids from various levels of the SCN derived from six mice, of which 21 ? 3% (mean t SEM) were c-Fos-positive, ranging between 3 and 36% per individual grid. These counts were made from SCNs of mice exposed to a light pulse of 2300 lux, after pilot experiments indicated similar data for 65 450 and 2300 lux. In the absence of photic stimulation, only sporadic c-Fos labelling was found in the SCN of control mice.
A noteworthy feature of the cell population containing c-Fos- positive nuclei was its morphological and phenotypic heterogeneity. Most c-Fos-labelled cells appeared to be neurons (Figs 3A-D and 4A, B, D), while some were astroglial (Fig. 4C). A considerable proportion of c-Fos-positive neurons were peptidergic, judging by extensive rough endoplasmic reticulum and Golgi configurations and dense-core vesicles. Dual immunocytochemical labelling confirmed that -24% of all c-Fos-positive nuclei were located within VIP- containing neurons and -1 3% within VP-NP neurons. However, most VIP- and VP-NP-imunoreactive neurons were c-Fos negative. Occasional ciliated cells within the SCN also contained c-Fos-labelled nuclei (Fig. 3D).
However, the majority of all c-Fos-positive nuclei were located in presumptive interneurons, so designated because of their ubiquity, small size and organelle-poor cytoplasm lacking secretory vesicles. Interneurons are a prominent component of the dense local circuitry that exemplifies the SCN (Van den Pol, 1980, 1991). We found that these small cells with pale cytoplasm were not a uniform population. Some were closely associated with capillary endothelium (Fig. 3B) while most were not; the nuclei of some were smooth while others were highly pleomorphic (Fig. 3A-C). Furthermore, a considerable number of putative interneurons were c-Fos-negative. Preliminary evidence from dual immunocytochemical labelling indicated that nuclear c-Fos and cytoplasmic NOS were co-localized in some
interneurons (Fig. 5). However, the relative percentage of interneurons in which c-Fos and NOS were co-localized has not yet been determined. It is noteworthy that of the three NOS antisera that we used (NOS-I, iNOS, eNOS), only neuronal NOS-I gave a positive reaction.
Astroglial cells were identified by GFAP immunoreactivity (Figs 1D and 4C), at the ultrastructural level, seen as a thin rim of immunoperoxidase-labelled perinuclear cytoplasm, and also within extensive branching profiles insinuated between other elements of the neuropil. About 7% of all c-Fos-positive nuclei in the SCN were located within GFAP-immunoreactive glial cells. However, in the majority of identified astroglial cells c-Fos was not detected.
Dual immunocytochemical labelling also served to identify some of the synaptic inputs onto c-Fos-positive neurons. A common occurrence was VIP-immunoreactive axonal boutons impinging syn- aptically on c-Fos-labelled somata (Fig. 4D). It is not known whether the neurons from which these boutons originated expressed c-Fos themselves. Adjacent c-Fos-positive neuronal somata were often po5tsynaptic to common presynaptic boutons (Fig. 4D), suggesting functional synchrony between photically activated cells.
Discussion
Despite a literature of over 50 publications on the physiology, pharmacology and ontogeny of c-Fos induction in the rodent SCN, relatively little has been written about the identity of the cells expressing c-Fos. We have found that the SCN cells, immunoreactive for c-Fos after photic stimulation, are morphologically and pheno- typically a mixed population. Furthennore, c-Fos expression was induced only in a relatively small proportion of total SCN cells, an upper limit (-1800 cells per 0.5 mm2, -20%) that was not exceeded even after photic stimuli of supramaximal intensity.
Characterization of c-fos-expressing cells Our results confirm that, in the mouse, photically induced c-Fos labelling occurs within cell nuclei dispersed throughout the entire dorsoventral extent of the SCN (Colwell and Foster, 1992). This differs from the situation in the rat, in which the labelling is restricted to the ventrolateral SCN (Rea, 1989; Aronin et al., 1990; Earnest et al., 1990). These differences in c-Fos distribution match differences in the retinal input to the SCN, which in the mouse is more homogeneously distributed throughout the nucleus (Castel et al., 1993), whereas in the rat the retinorecipient region is concentrated in the ventral subdivision of the SCN (Johnson et al., 1988).
Previous attempts to establish the identity of c-Fos-expressing cells in the SCN at the light microscope level focused mainly on known phenotypes within the retinorecipient region of the rat SCN. In the rat, neuronal cell bodies immunoreactive for VIP or for gastrin- releasing peptide (GRP) are concentrated within the ventral SCN (Mikkelsen et al., 1991), and in some instances the two neuropeptides coexist in the same neurons (Okamura et al., 1986). Earnest et al. (1993) reported that 8% of c-Fos positive cell nuclei could be co- localized to GRP-containing neurons, but, contrary to our results, these authors found no co-localization of c-Fos nuclei in VIP pcrikarya. However, there have been other reports of ‘many’ (Daikoku et al., 1992) or ‘some’ (Mikkelsen et al., 1994) VIP neurons that were immunoreactive for c-Fos after photic stimulation. Phase- dependent distribution and co-localization of light-induced c-Fos expression within VIP and GRP neurons in the rat SCN has been reported recently (Romijn et al., 1996; Speh and Moore, 1996). Complicating the issue is the fact that, while the light pulses used to

Immuno-ultrastructural localization of c-Fos protein in the SCN 1955
FIG. 3. Electron micrographs showing c-Fos immunoreactivity in the nuclei of various cell types in the Sabra mouse SCN. Mice were exposed to a 15 min light pulse at ZT 16 of the light-dark cycle. Immunoreactivity is indicated by electron-dense spicule-like crystals, the reaction product of the chromogen TMBt tungstate. (A) Profiles of three SCN somata are depicted, one of which displays reaction product denoting c-Fos protein within the karyoplasm of its nucleus. Spicules are associated mainly with pale euchromatin; the nucleolus (n) is unlahelled. The pale perinuclear cytoplasm, containing few organelles, suggests an intemeuron. (B) Profile of a soma (intemeuron?) adjacent to capillary (c) endothelium (upper right). The pleomorphic nucleus is c-Fos-immunoreactive. (C) A dendrite-like process (arrow) extends from the soma of a small putative interneuron, whose pleomorphic nucleus (N) is c-Fos-immunoreactive. Nuclei (N) of two neighbouring somata are also immunoreactive. (D) Profile of neuronal soma bearing a cilium (arrow). Spicule-like reaction product is seen in the karyoplasm; a spicule is also located in the cytoplasm close to Golgi configurations (G). Magnification, X 15 000 in A, X7000 in B, X12 000 in C , X 18 000 in D.

1956 Immuno-ultrastructural localization of c-Fos protein in the SCN
FIG. 4. Electron micrographs showing dual immunocytochemical labelling in SCNs derived from light-pulsed specimens. Immunoreactivity for c-Fos is denoted by TMB/tung\tate crystals, and cytoplasmic ligands are indicated by diffuse diaminobenzidine reaction product. (A) Neuronal soma showing co-localization of nuclear c-Fos and cytoplasmic VIP. Note electron-dense secretory granules in the diffusely labelled cytoplasm; the mitochondria1 matrix is unlabelled. (B) Neuronal soma showing co-localization of nuclear c-Fos and cytoplasmic VP-NP. (C) Profile of an astrocyte soma. The very thin rim of perinuclear cytoplasm contains patches of diffuse reaction product (arrowheads) denoting immunoreactivity for GFAP. The nucleus is c-Fos-immunoreactive. (D) Labelling with anti- c-Fos and anti-VIP; profiles of two c-Fos-immunoreactive neurons (of unknown phenotype), the upper one postsynaptic to a large VIP-containing bouton (arrow). Both c-Fos-positive neurons are also postsynaptic to a common unlabelled synaptic bouton (asterisk). Magnification, X 15 000 in A and B, X19 000 in C. X I 8 000 in D.
Immuno-ultrastructural localization of c-Fos protein in the SCN 1957
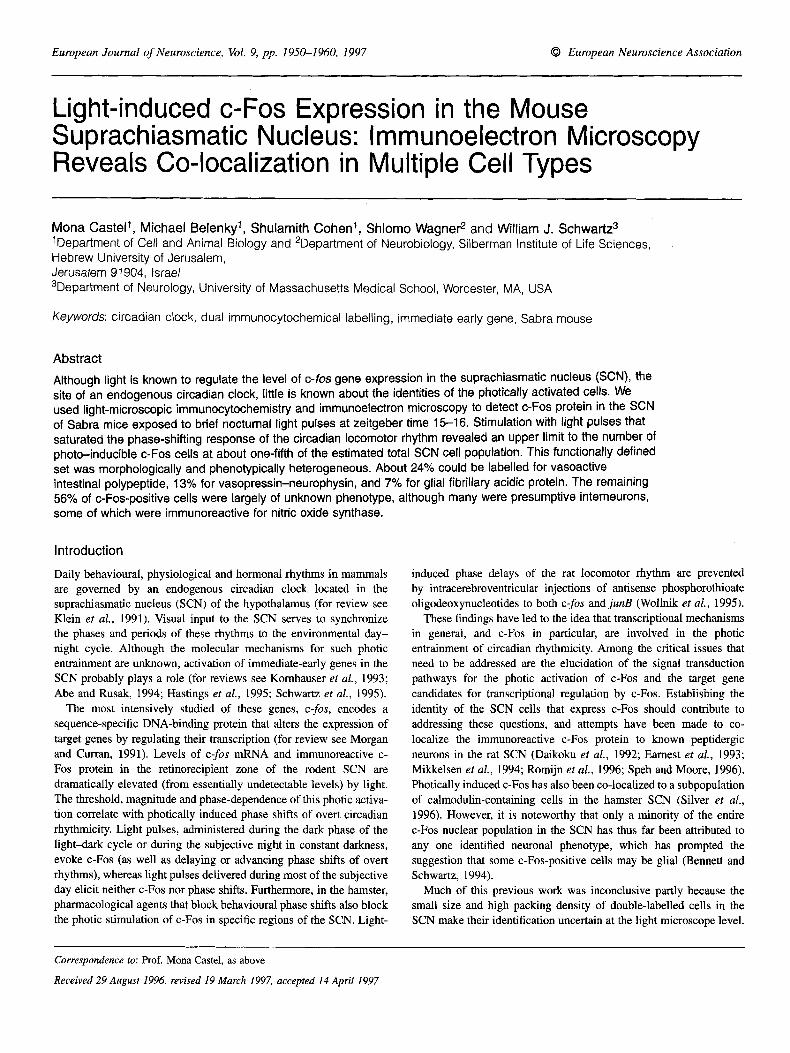
FIG 5. Electron micrograph showing juxtaposed profiles of several putative interneurons in (lie SCN of a light-pulsed Sabra mouse. Three of the presumptive interneurons (1, 2, 3 ) arc dual-labelled for nuclear c-Fos and cytoplasmic NOS; TMBhngstnte crystals within the cell nuclei denote c-Fos immunoreactivity, and diffuse diaminobenfidine reaction product within the cytoplasm indicates immunoreactivc NOS. Note unlabelled nucleolus (n) in cell 2 . At the upper right is a portion of an unlabclled cell (star). Magnification, X20 000.
activate c-Fos would be expected to increase GRP immunoreactivity, they would probably diminish iminunoreactivity for VIP (Inouye and Shibata, 1994). In an effort to establish whether glia were among the c-Fos-expressing cell5 in the rat SCN, Bennett and Schwartz (1994) used an antibody to the calcium-binding protein S- 100 and estimated that 5-10% of the photically induced c-Fos-labelled nuclei were in identified astroglial cells. In the hamster, photic stimulation induces c-Fos-immunoreactivity within a specific subpopulation of calbindin- D28-containing cells in the core of the SCN (Silver et al., 1996).
In the present study on the Sabra mouse, dual labelling revealed the phenotypes of almost half the c-Fos-expressing nuclei: 24% were in VIP-immunoreactive neurons, 13% in VP-NP neurons, and 7% were attributed to GFAP-immunoreactive astroglia. Co-localization of NOS within some c-Fos-positive interneurons was also revealed. In the dorsomedial SCN, co-localization of c-Fos within VP-NP somata may be peculiar to the mouse, where optic terminals gain access to cells throughout the SCN and c-Fos immunoreactivity is indeed widely distributed. It is noteworthy that our results, compared with those of the afore-mentioned authors, were achieved with a relatively brief stimulation paradigm (45 min after onset of a 15 min light pulse).
Hence. the common feature of c-Fos-expressing cells is not their peptide content or even their neuronal or glial character; perhaps a receptor subtype or second messenger mechanism is a unifying characteristic. Other data have also suggested that the c-Fos cells in the SCN constitute a heterogeneous population. For example, the inhibition of c-Fos photoinduction by pharmacological blockade is regionally specific within the hamster SCN (Abe et al., 1992; Vindlacheruvu et al., 1992; Colwell et al., 1993; Rea et al., 1993; Zhang ef ol., 1993).
The piecise function of c-Fos may differ in different cell types, and it will be important to learn whether the c-fos gene is differentially regulated in the variety of SCN cells that have been identified. Moreover. we do not know whether c-Fos in peptidergic neurons and in glia is expressed simultaneously or sequentially after onset of the light stimulus. Adding to this uncertainty is the current lack of knowledge concerning the precise identity of the neurons directly impinged upon by the retinal input.
In the present study, approximately half the total population of photically induced c-Fos-expressing cells in the SCN were of unknown phenotypc. Among these the most numerous were small putative interneurons with sparse, cytoplasmic membrane systems, which may

1958
be analogous to the local circuit neurons described by Van den Pol (1980, 1991) in the rat SCN. Recently NOS immunoreactivity was demonstrated in so-called interneurons by both light and electron microscopy within the ventral retinorecipient region of the rat SCN, and throughout the entire SCN of the mouse (Wang and Morris, 1996). NOS is a calmodulin-dependent enzyme responsible for conversion of arginine into citrulline and nitric oxide (NO) (Garthwaite, 1991), which is believed to be a messenger molecule involved in signal transduction within the SCN (Amir, 1992; Ding et al., 1994; Watanabe et al., 1994, 1995). It is postulated that, within the circadian timing system, NOS activity is initiated by the influx of Ca2+ through NMDA receptors activated by the glutamatergic retinal input (Pape, 1995). In the hamster, retinohypothalamic projec- tions have been shown to impinge on NOS-immunoreactive neurons in the ventral SCN (Decker and Reuss, 1994), although the precise relationship between NOS activity and c-Fos expression is not yet clear (Weber et al., 1995). In the rat, Reuss et al. (1995) have reported that some SCN cells are double-labelled for NOS and VIP. In the mouse we present the first ultrastructural evidence clearly indicating that photically induced c-Fos protein is co-localized in some NOS- containing interneurons. It is therefore possible that these NOS- containing interneurons bear NMDA receptors, are activated by glutamate released from retinal boutons, and represent ‘first-order’ c-Fos-expressing cells. The rapid transmembrane effect of NO, within a ‘spherical domain of about 100 km’ (Pape, 1995) may account for a variety of ‘second order’ c-Fos-expressing cells.
Quantitation of c-Fos-expressing cells Within the wide range of light stimuli that we employed (65-2300 lux), the number of c-Fos-immunoreactive cells in the Sabra mouse SCN remained constant at -1800 per 0.5 mm2 per bilateral SCN. Previous reports have shown that the level of c-jos mRNA (Kornhauser et al., 1990) and the number of c-Fos-expressing cells (Tr5vnickovi et al., 1996) increase in the SCN when light pulses of altered intensity or timing increase the amplitude of behavioural or hormonal phase shifts; in these studies the amount of c-Fos correlates with the magnitude of the phase shift. Here we exposed mice to light pulses of increasing intensity, but the magnitude of our dimmest pulse was similar to pulses that saturate the phase-shifting response of the murine circadian locomotor rhythm (Foster et al., 1991; of the order of 1-10 pW/cni2). In Sabra mice also, we found that the amplitude of their locomotor phase shifts was not augmented with light pulses greater than 65 lux (M. C. and W. J. S., preliminary observations); similar findings have now been reported in C3WHeN mice (Benloucif et al., 1997). The salient point is that our experimental setup has enabled us to define an upper limit to the number of c-Fos-expressing cells. There is an apparent ceiling to the size of the photo-inducible c-Fos population in the SCN, indicating that it is not indefinitely recruitable or expandable.
The maximum count of -1800 per 0.5 mm2 c-Fos-positive cell nuclei was based on light microscope counts from alternate serial vibratome sections, comprising approximately half of the rostrocaudal SCN. Therefore, it is not unreasonable to extrapolate that the actual number within the entire rostrocaudal SCN would be about double that count, close to 2 X 1800 = 3600 c-Fos cells per SCN. The total number of cells in the mouse SCN is not known, but extrapolating from the rat SCN, where the total number of neurons and glia has been estimated at -20000 in the paired nuclei (Van den Pol, 1980, 199 1 ), then 3600 c-Fos-immunoreactive cell nuclei in the mouse SCN would represent roughly 18% of the total. This tallies reasonably well with our on-grid counts at the ultrastructural level, where an average of 21% of cell nuclei were c-Fos-immunoreactive.
Immuno-ultrastructural localization of c-Fos protein in the SCN
As for a possible influence of early versus late night on the number of photically induced c-Fos-positive nuclei in the Sabra mouse SCN, we did not find any difference between routine counts at ZT 15-16 (n = 22) and preliminary counts at ZT 21-22 (n = 12). Likewise, in M L ~ S domesticus, Collwell and Foster (1992) reported ‘that it was not possible to distinguish between the effect of a light pulse delivered at CT 24 and at CT 16 on Fos-like-immunoreactivity’ (CT is circadian time). Moreover, in light-pulsed C3WHeN mice c-Fos mRNA levels were virtually the same at CT 14 and CT 22 (Masana et al., 1996). However, in the rat (Speh and Moore, 1996; Romijn et al., 1996), light stimuli at ZT 19 induced significantly higher counts of c-Fos- immunoreactive cells than light stimuli at ZT 14. A differential was also reported in c-Fodneuropeptide co-localization, so that c-Fos at ZT 19 (accompanied by phase advance of behavioural rhythmicity) appeared to be associated with both GRP and VIP neurons, while c- Fos at ZT 14 (accompanied by phase delay) was associated only with VIP neurons. Apart from the methodological differences between the studies discussed above, the results probably do indicate a real difference between mice and rats in light-induced c-Fos expression in the SCN. Of note, since mice typically exhibit free-running circadian periods of <24 h (Schwartz and Zimmerman, 1990), unlike rats, they entrain to light-dark cycles primarily by phase delays.
Technical considerations Our immuno-ultrastructural observations add to a small group of studies examining c-Fos at the electron microscope level in the central nervous system: in the mouse hippocampus after Metrazole-induced seizures (Mugnaini et al., 1989), in the rat neostriatum after intrastriatal quinolinic acid (Aronin et al., 1991) and in the rat supraoptic nucleus after chronic intermittent salt loading (Lafarga et a i , 1993). Immunoelectron microscopy also showed c-Fos immunoreactivity in cortical cells of the zona fasciculata of ACTH-injected rats (Yang et al., 1990). These studies, all of which visualized immunoreactive c- Fos by diffuse diaminobenzidine labelling, demonstrated localization within those subcellular nuclear domains that correspond to actively transcribing dispersed euchromatin. Within the SCN, using diamino- bensidine as the chromogen, c-Fos immunolabelling was not satisfact- ory (M. C. and S. C., unpublished observations), possibly because the amount of c-Fos generated by a physiological stimulus such as ambient light may be less than that induced by the pharmacological stimuli used in the aforementioned studies. However, use of the more sensitive TMB procedure, combined with tungstate augmentation, produced a readily visible and unambiguous crystalline electron-dense reaction product that could be discerned even at low magnifications. Furthermore, for dual immuno-ultrastructural labelling, TMB/tung- state marking of c-Fos and diaminobenzidine labelling of cytoplasmic antigens has the distinct advantage of two chromogens with distin- guishing morphological features.
One of the drawbacks of TMB labelling is that the antigenic site that each crystalline spicule denotes is spatially more limited than the spicule itself, although this did not adversely affect the interpretation of results in the present study. Another. drawback, relating to dual labelling, is that the TMBhngstate procedure itself is somewhat damaging for tissue constituents, and since it was used to label the first antigen (c-Fos) it had a deleterious effect on the antigenicity of the cytoplasmic ligands that were subsequently labelled with diaminobenzidine. This would imply underestimation of co-localized ligands in our dual-labelling results, which was particularly apparent when NOS was the second antigen. Future studies will seek to alleviate this problem by the use of antibodies with higher affinity for cytoplasmic antigens, and modification of the TMBItungstate procedure, which is protracted and carried out at acidic pH.
Immuno-ulb-astructural localization of c-Fos protein in the SCN 195.9
Colwek c. s., kufman, c. M. and Menaker, M. (1993) Photic induction of Fos in the hamster suprachiasmatic nucleus is inhibited by baclofen but not by diazepam or bicuculline. Neuroxi. Lett., 163, 177-181.
c m m , T., Gordon, M. B., Rubina, K. G. and Sambucetti, L. c. (1987) Isolation and characterization of the c-@ (rat) cDNA and analysis of post- translational modification in vitro. Oncogene, 2, 79-84.
Daikoku, S., Yokote, R., Aizawa, T. and Kawano, H. (1992) Light stimulation of the hypothalamic neuroendocrine system. Arch. Histol. Cyrol., 55,67-76.
Decker, K. and Reuss, S. (1994) Nitric oxide-synthesizing neurons in the hamster suprachiasmatic nucleus: a combined NOS- and NADPH- staining and retinohypothalamic tract tracing study. Bruin Res., 666, 284-288.
Ding, J. M., Chen, D., Weber, E. T.. Faiman, L. E., Rea, M. A. and Gillette, M. U. (1994) Resetting the biological clock: mediation of nocturnal circadian shifts by glutamate and NO. Science, 266, 1713-1717.
Ernest, D. J., Iadarola, M., Yeh, H. H. and Olschowka, J. A. (1990) Photic regulation of c-Fos expression in neural components governing the entrainment of Circadian rhythms. Enp. Neurol., 109, 353-361.
Earnest, D. J., DiGiorgio, S. and Olschowka, J. A. (1993) Light induces expression of fos-related proteins within gastrin-releasing peptide neurons in the rat suprachiasmatic nucleus. Bruin Res., 627, 205-209.
Foster, R. G., Provencio, I., Hudson, D., Fiske, S., De Grip, W. and Menaker, M. (1991) Circadian photoreception in the retinally degenerate mouse (rdlrd). J. Comp. Physiol. A, 169, 39-50.
Garthwaite, J. (1991) Glutamate, nitric oxide and cell-cell signalling in the nervous system. Trends Neurosci., 14, W 6 7 .
Hastings, M. H., Ebling, F. J. P., Grosse, J., Herbert, J., Maywod, E. S., Mikkelsen, J. D. and Sumovi, A. (1995) Immediate-early genes and the neuronal bases of photic and non-photic entrainment. In Chadwick, D. J. and Ackrill, K. (eds), Circudiun Clocks and Their Adjustment. Cibu Foundution Symposium, I83. John Wiley & Sons, Chichester, pp. 175-197.
Inouye, S . T. and Shibata, S. (1994) Neurochemical organization of circadian rhythm in the suprachiasmatic nucleus. Neurosci. Res., 20, 109-130.
Johnson, R. F., Morin, L. P. and Moore, R. Y. (1988) Retinohypothalamic projections in the hamster and rat demonstrated using cholera toxin. Bruin Res., 462, 301-312.
Klein, D. C., Moore, R. Y. and Reppert, S. M. (eds) (1991) Suprachiusmutic Nucleus: The Mind’s Clock. Oxford University Press, Oxford.
Kornhauser, J. M., Nelson, D. E., Mayo, K. E. and Takahashi, J. S. (1990) Photic and circadian regulation of c-fos gene expression in the hamster suprachiasmatic nucleus. Neuron, 5, 127-134.
Kornhauser, J. M., Mayo, K. E. and Takahashi, J. S. (19Y3) Immediate-early gene expression in a mammalian circadian pacemaker: the suprachiasmatic nucleus. In Young, M. W. (ed.), Molecular Genetics of Biological Rhythms. Marcel Dekker, New York, pp. 271-307.
Lafarga, M., Martinez-Guijano, F. J., Berciano, M. T., Blasco-lbafiez, J. M., Andres, M. A., Mellstrom, B., Lopez-Garcia, C. and Naranjo, J. R. (1993) Nuclear Fos domains in transcriptionally activated supraoptic nucleus neurons. Neuroscience, 57, 353-364.
Lavialle, M. and ServSre, J. (1993) Circadian fluctuations in GFAP distribution in the Syrian hamster suprachiasmatic nucleus. NeuroRepon, 4, 1243-1246.
Masana, M. I., Benloucif, S. and Dubocovich, M. L. (1996) Light-induced C- fos mRNA expression in the suprachiasmatic nucleus and the retina of C3WHeN mice. Mol. Bruin Res., 42, 193-201.
Mikkelsen, J. D., Larsen, P. J., O’Hare, M. M. T. and Wiegand, S. J. (1991) Gastrin releasing peptide in the r+t suprachiasmatic nucleus: an immunohistochemical, chromatographic, and radioimmunological study. Neuroscience, 40, 55-66.
Mikkelsen, J. D., Larsen, P. J., Sdrensen, G. G., Woldhye, D., Bolwig, T. G., Hastings, M. H. and Ebling, F. J. P. (1994) A dual-immunocytochemical method to localize c-Fos protein in specific neurons based on their content of neuropeptides and connectivity. Histochemistry, 101,245-25 1.
Morgan, J. I. and Cwan, T. (1991) Stimulus-transcription coupling in the nervous system: involvement of the inducible proto-oncogenes fos and jun. Annu. Rev. Neurosci., 14, 421451.
Morin, L. P., Johnson, R. F. and Moore, R. Y. (1989) TWO brain nuclei controlling circadian rhythms are identified by GFAP immunoreactivity in hamsters and rats. Neumsci. Lett., 99, 55-60.
Mugnaini, E., Berrebi, A. S., Morgan, J. I. and Curran, T. (1989) Fos-like inmunoreactivity induced by seizure in mice is specifically associated with euchromatin in neurons. Eur J. Neumsci., 1, 46-52.
Okamura, H., Murakami, S., Uda, K., Sugano, T., Takahashi, Y., Yanaihara, C., Yanaihara, N. and Ibata, Y. (1986) Coexistence of vasoactive intestinal peptide (VIP)-, peptide histidine isoleucine amide (PHI)-, and gastrin releasing peptide (GRP)-like immunoreactivity in neurons of the rat suprachiasmatic nucleus. Biomed. Res., 7 , 295-299.
Conclusion c-Fos was photo-inducible in only about one-fifth of the total number of cells that constitute the SCN, and within this limited population various cell types were differentially represented, about half of which were characterized phenotypically. The temporal order of c-Fos induction in the SCN remains an open question: are all cell categories simultaneously stimulated by the photic input, or is a signal transduc- tion cascade initiated via one type of cell and conveyed to others?
Acknowledgements We gratefully acknowledge support from the USA-Israel Binational Science Foundation grant 91/00154 (M. C., W. J. S.), the Israel Ministry of Science and Humanities grant 032/7241 (M. B., M. C.) and National Institutes of Health (USA) grant RO1 NS24542 (W. I. S.) . Ms Robin Peters and Mr Henry Matzner are warmly thanked for expert technical assistance.
Abbreviations GFAP GRP NOS SCN TMB VIP VP-NP ZT
glial fibrillary acidic protein gastrin-releasing peptide nitric oxide synthase suprachiasmatic nucleus tetramethyl benzidine vasoactive intestinal peptide vasopressin-neurophysin zeitgeber time
References A h , H. and Rusak, B. (1994) Physiological mechanisms regulating photic
induction of Fos-like protein in hamster suprachiasmatic nucleus. Neurosci. Biobehav. Rev., 18, 531-536.
Abe, H., Rusak, B. and Robertson, H. A. (1992) NMDA and non-NMDA receptor antagonists inhibit photic induction of Fos protein in the hamster suprachiasmatic nucleus. Bruin Rrs. Bull.? 28, 831-835.
Amir, S. (1992) Blocking NMDA receptors or nitric oxide production disrupts light transmission to the suprachiasmatic nucleus. Bruin Res., 586,336-339.
&onin, N., Sagar, S. M., Sharp, F. R. and Schwartz, W. J. (1990) Light regulates expression of a Fos-related protein in rat suprachiasmatic nuclei. Proc. Natl Acud, Sci. USA, 87, 5959-5962.
Aronin, N., Chase, K., Sagar. S. M., Sharp, F. R. and DiFiglia, M. (1991) N- methylnaspartate receptor activation in the neostriatum increases c-Fos and Fos-related antigens selectively in medium-sized neurons. Neuroscience, 44,409420.
Ben-Barak, Y., Russell, J. T., Whitnall, M. H., Ozata, K. and Gainer, H. (1985) Neurophysin in the hypothalamo-neurohypophyseal system. I. Production and characterization of monoclonal antibodies. .I. Neurosci., 5 ,
Benloucif, S . , Masana, M. A. and Dubocovich, M. L. (1997) Light-induced phase-shifts of circadian activity rhythms and immediate early gene expression in the suprachiasmatic nucleus are aqenuated in old C3WHeN mice. Bruin Res., 747. 34-42.
Bennett, M. R. and Schwartz, W. J. (1994) Are glia among the cells that express immunoreactive c-Fos in the suprachiasmatic nucleus? NeumReport,
Castel, M. and Belenky, M. (1994) Can c-Pos expression tell us about signal transduction in the suprachiasmatic nucleus? J . Neurochem.. 63, Suppl., 1, abstract 534A.
Castel, M., Feinstein, N., Cohen, S. and Harari, N. (1990) Vasopressinergic innervation of the mouse suprachiasmatic nucleus: an immuno-electron microscopic analysis. J . Comp. Neurol., 298, 172-187.
Castel, M., Belenky, M., Cohen, S., Ottersen, 0. P. and Storm-Mathisen, J. (1993) Glutamate-like immunoreactivity in retinal terminals of the mouse suprachiasmatic nucleus. Eul: J. Neurosci., 5, 368-381.
Castel, M., Belenky, M., Cohen, S. and Schwartz, W. J. (1995) Photic induction of c-Fos in the suprachiasmatic nucleus of the Sabra mouse. Eur J. Neurosci., Suppl. 8, abstract 72.08.
Colwell, C. S. and Foster, R. G. (1992) Photic regulation of Fos-like immunoreactivity in the suprachiasmatic nucleus of the mouse. 1. Comp. Neurol., 324, 135-142.
81-97.
5, 1737-1740.

1960 Immuno-ultrastructural localization of c-Fos protein in the SCN
Pape, H.-C. (1995) Nitric oxide: an adequate modulatory link between biological oscillators and control systems in the mammalian brain. Semin. Neurosci., 7, 329-340.
Rea, M. A. (1989) Light increases Fos-related protein immunoreactivity in the rat suprachiasmatic nuclei, Brain Res. Bull., 23, 577-581.
Rea, M. A,, Buckley, B. and Lutton, L. M. (1993) Local administration of EAA antagonists blocks light-induced phase shifts and c-fos expression in hamster SCN. Am. J. Physiol., 265, R1191-Rl198.
Reuss, S., Decker, K., Rosseler, L., Layes, E., Schollmayer, A. and Spessert, R. (1995) Nitric oxide synthase in the hypothalamic suprachiasmatic nucleus of rat: evidence from histochemistry! inununohstochenlistry and Western blot; and colocalization with VIP. Brain k s . , 695, 257-262.
Romijn, H. J., Sluiter, A. A., Pool., C. W., Wortel, J. and Buijs, R. M. (1996) Differences in colocalization between Fos and PHI, GRP, VIP and VP in neurons in the rat suprachiasmatic nucleus after a light stimulus during phase delay versus phase advance periods of the night. J. Comp. Neuml., 372, Ill-118.
Schwartz, W. J . and Zimmerman, P. (1990) Circadian time-keeping in BALB/ c and C57BL/6 inbred mouse strains. J. Neurosci.. 10, 368553694,
Schwartz, W. J., Aronin, N., Takeuchi, J., Bennett, M. R. and Peters, R. V. (1995) Towards a molecular biology of the suprachiasmatic nucleus: photic and temporal regulation of c-fos gene expression. Semin. Neurosci., 7,53-60.
Schwartz, W. J., Peters, R. V.. Aronin, N. and Bennett, M. R. (1996) Unexpected c-fos gene expression in the suprachiasmatic nucleus of mice entrained to a skeleton photoperiod. J. Bid . Rhythms, 11, 35-44.
Silver, R., Romem, M. T.: Besmer, H. R., Leak, R., Nunez, J. M. and Le Sauter, J. (1996) Calbindin-D28K cells in the hamster SCN express light- induced Fos. NeuroReport, 7, 1224-1228.
Speh , J. C. and Moore R. Y. (1996) Phase dependent differential distribution and co-localization of light-induced c-Fos expression with VIP andor GRP suprachiasmatic nucleus (SCN) neurons. SOC. Neurosci. Ahstx, 22, 2053.
Trivnickovi, Z., Sumova, A., Peters, R., Schwartz, W. J. and Illnerova, H. (1996) Photoperiod-dependent correlation between light-induced SCN c- Fos expression and resetting of circadian phase. Am. J. Physiol., 271,
Van den Pol., A. N. (19801 The hypothalamic suprachiasmatic nucleus of rat: intrinsic anatomy. J. Comp. Neurol.. 191, 661-702.
R825-R83 I .
Vm den Pol,, A. N. (1991) The suprachiasmatic nucleus: morphological and cytochemical substrates for cellular interaction. In Klein, D. C., Moore, R. Y. and Reppert, S. M. (eds). Suprachiasmatic Nucleus: The Mind’s Clock. Oxford University Press, Oxford, pp. 17-SO.
Vindlacheruvu, R. R., Ebling, F. J. P., Maywood, E. S. and Hasthgs, M. H. (1992) Blockade of glutamatergic neurotransmission in the suprachiasmatic nucleus prevents cellular and behavioral responses of the circadian system to light. Eur J. Neurosci., 4, 673479.
Wang, H. and Morris, J. (1996) Presence of neuronal nitric oxide synthase in the suprachiasmatic nuclei of mouse and rat. Neuroscience, 74,1059-1068.
Watanabe, A,, Hamada, T., Shibdtd, S. and Watanabe, S. (1994) Effects of nitric oxide synthase inhibitors on N-methyl-D-aspartate-induced phase delay of circadian rhythm of neuronal activity in the rat suprachiasmatic nucleus in vitro. Brain Res., 646, 161-164.
Watanabe, A,, Ono, M., Shihata, S. and Watanabe, S. (1995) Effect of a nitric oxide synthase inhibitor, N-nitro-L-arginine methylester, on light-induced phase delay of circadian rhythm of wheel-running activity in golden hamsters. Neurosci. Lett., 192, 25-28.
W’eher, E. T., Gannon, R. L., Michel, A. M., Gillette, M. U. and Rea, M. A. (1995) Nitric oxide synthase inhibitor blocks light-induced phase shifts of the circadian activity rhythm, but not c-jos expression in the suprachiasmatic nucleus of the Syrian hamster. Brain Res., 692, 137-142.
Weinberg, R. J. and Van Eyck, S. L. (1991) A tetramethylbenzidine/tungstate reaction for horseradish peroxidase histochemistry. J. Hisfnchern. Cytochem., 39, 1143-1148.
Wollnik, F., Brysch, W., Uhlmann, E., Gillardon, E, Bravo, R., Zimmerman, M., Schlingensiepen, K. H. and Herdegen, T. (1995) Block of c-Fos and JunB expression by antisense oligonucleotides inhibits light-induced phase shifts of the mammalian circadian clock. Eur J. Neurosci., 7, 388-393.
Yang, G. A., Koistinaho, J., Iadarola, M., Shenhua-Zhu and Hervonen, A. (1 990) Administralion of adrenocorticotropic hormone (ACTH) enhances Fos expression in the rat adrenal cortex. Regulatory Peptides, 30, 21-31.
Zhang, Y., Zee, P. C., Kirby, J. D., Takahashi, J. S. and Turek, F, W. (1993) A cholinergic antagonist, mecamylamine, blocks light-induced Fos immunoreactivity in specific regions of the hamster suprachiasmatic nucleus. Brain Res., 615, 107-112.