LIFTING THE SMOG - env-health.org
35
LIFTING THE SMOG How much Tuzla’s public health would benefit from enforcement of air quality legislation June 2019
Transcript of LIFTING THE SMOG - env-health.org
LIFTING THE SMOGHow much Tuzla’s public health would benefit from enforcement of air quality legislation
June 2019

This report was written by CEE Bankwatch Network, the Health and Environment Alliance - HEAL, and the Center for Ecology and Energy, following research and contributions from:
• Ioana Ciută (CEE Bankwatch Network)
• Vlatka Matković Puljić (Health and Environment Alliance - HEAL)
• Maida Mulić PhD MD (Public Health Institute of Tuzla Canton)
• Selma Azabagić PhD MD (Public Health Institute of Tuzla Canton)
• Davor Pehchevski (CEE Bankwatch Network)
• Srđan Kukolj (Health and Environment Alliance - HEAL)
• Denis Žiško (Center for Ecology and Energy)
The authors are grateful to Krakow Smog Alert, Poland, who provided the equipment used in the 2018-2019 independent continuous monitoring of PM10 in Tuzla and to the Federal Hydro-meteorological Institute for technical assistance.
The authors would also like to thank the Public Health Institute of Tuzla Canton, a HEAL partner, for providing the health mortality and morbidity data for 2018 for the Tuzla Canton.
Editor: Pippa Gallop (CEE Bankwatch Network)
Layout and design: Zhenya Tsoy (CEE Bankwatch Network)
Cover photo: Center from Ecology and Energy’s archive
This work is available under the Creative Commons Attribution-NonCommercial-ShareAlike 3.0 IGO licence (CC BYNC-SA 3.0 IGO; https://creativecommons.org/licenses/by-nc-sa/3.0/igo).
The publishing organisations gratefully acknowledge the financial support of the European Union (EU) and the European Climate Foundation (ECF) for the production of this report.
The content of this publication is the sole responsibility of the authors and can under no circumstances be regarded as reflecting the position of the European Union.
The health impact methodology used in this report is based on recommendations from the World Health Organization (WHO) ‘Health risks of air pollution in Europe’ (HRAPIE) project on health impact assessments for air pollution and calculated using the AirQ+ tool.

3
Executive Summary 4
1. The air pollution crisis in Tuzla 6
2. The legal framework on air quality in the Federation of Bosnia and Herzegovina (FBiH) 8
3. Health impacts from air pollution 14
4. Tuzla air quality data: official vs independent monitoring 16
5. Reducing air pollution in Tuzla would protect and benefit health 18
Health benefits of compliance with legal limits and guidelines - scenarios 20
6. Reactions from local medical community 24
7. Why the planned Tuzla 7 coal unit is not a solution 25
Conclusions and recommendations 26
Annex 1: the World Health Organization methodology 28
Annex 2: independent PM10 data collection 33
CONTENTS

4
The air quality in Tuzla is dire, locals know and feel it and their endurance has attracted the attention in recent years from major international media, whose television crews have made their way to this town in the country with the second highest mortality rate from air pollution worldwide.1 Yet flaws in official monitoring mean that the true extent and impacts of the pollution are unclear.
CEE Bankwatch Network and the Center for Ecology and Energy have therefore undertaken independent monitoring in Tuzla of coarse dust particles known as PM10. Together with the Health and Environment Alliance (HEAL), we have also calculated the health impacts of fine PM2.5 dust particles in Tuzla, based on official data, and PM10 calculated from official PM2.5 data using WHO conversion factors.
The independent monitoring shows that in 2018 - for a period of 144 days or almost 5 months spanning summer, autumn and winter - average PM10 levels were double the legal annual average limit. The average PM10 values were 78.9 µg/m3, while the annual average limit is 40 µg/m3.
On 98 days out of 144, PM10 exceeded the legal daily limit value of 50 µg/m3. Legally, only a maximum of 35 days per year is allowed. In other words, air pollution in Tuzla exceeded daily legal limits for three out of five months.
The study estimates that PM2.5 pollution caused 136 premature deaths in
Executive Summary
adults in Tuzla in 2018. This represents 17 per cent of all deaths of adults above 30 years of age. If pollution levels stayed within legal limits, air pollution would still be responsible for 63 deaths in Tuzla’s adult population, whereas adhering to WHO recommendations would avoid all of these deaths. Legal compliance is therefore a minimum requirement and by no means the end goal.
PM10 also resulted in 1 339 new cases of bronchitis in adults in Tuzla in 2018 - almost one third of all incidences of bronchitis that year. If air pollution levels in Tuzla met legal limits, such cases could fall by 612 cases per year. And if the stricter, exclusively health-focused WHO recommendations were followed, additional cases could be prevented completely. This would also result in significant savings in lost productivity and health costs. In addition, all the 160 cases of bronchitis in children during 2018 attributed to PM10 could be avoided, thus reducing the chances of future chronic respiratory diseases.
Particulate matter mainly results from industrial processes, burning coal, motor vehicles, construction sites, open-cast mines or unpaved roads. When inhaled, particles cause harm to our lungs and heart, and the smaller particles, PM2.5, can even enter the bloodstream. They can cause strokes and lead to premature death. Poor air quality is also linked to chronic and acute respiratory diseases, such as bronchitis and the aggravation of asthma. Recent studies also point to air pollution harming children’s health, and link poor air quality to other diseases such as obesity and Alzheimer’s disease.
1 http://apps.who.int/iris/bitstream/10665/255336/1/9789241565486-eng.pdf

5
Air quality legislation and monitoring in TuzlaThe Federation of Bosnia and Herzegovina (FBiH) has aligned its air quality legislation with the European Ambient Air Quality Directive (2008/50/EC). The legislation sets daily and annual limits for PM10. The daily concentration of 50 µg/m3 must not be exceeded more than 35 days per year, and the annual average concentration must not exceed 40 ug/m3. This is not the case for PM2.5, where only an annual limit of 25 µg/m3 is set.
To achieve a comprehensive picture of Tuzla’s air quality and protect people’s health, the regional authorities need to monitor not only PM2.5 as they do now, but also PM10, and to check the concentrations against the daily legal limits. This would enable environmental and public health authorities to act promptly to protect public health.
Without PM10 monitoring, they cannot even issue warnings when pollution levels exceed legal limits, and the public can only deal with the consequences. Moreover, no-one is held accountable for breaching the legal PM10 daily limits. Preventing excessive PM10 (and PM2.5) exposure would be much more efficient and less burdensome to the population and healthcare system.
Tuzla coal power plant as a major source of air pollutionA major source of pollution in Tuzla is the local lignite power plant, built in
the 1960s and 1970s, with its adjacent open-cast mines and ash disposal site. Pollution from the plant cost the health budget over EUR 300 million in 2016 alone.2
The Government’s proposed solution to Tuzla’s notorious pollution is a new 450 MW coal-fired unit at the power plant. Although touted as a replacement for existing units, Elektroprivreda BiH, the plant operator, plans to close only unit 3 (100 MW) and unit 4 (200 MW) as soon as the new unit is built.3
Units 5 and 6 would continue operating beyond 2027, according to Bosnia and Herzegovina’s National Emissions Reduction Plan, so Tuzla 7 would represent increased capacity compared to today, and perpetuate pollution from the coal mines and ash landfills.
To prevent future harm to public health in Tuzla and beyond, the Federation of BiH authorities need to drop this expansion project and bring the existing units into line with EU emissions limits values. The legal minimum requirement under the Energy Community Treaty is compliance with the outdated Large Combustion Plants Directive, but to protect health, the more recent Best Available Techniques reference document for large combustion plants (LCP BREF) 2017 standards need to be applied. The authorities must ensure that Elektroprivreda BiH properly recultivates the already closed lignite mines and ash disposal sites and must not allow the introduction of any new pollution sources in this area, such as the proposed new ash disposal site at Šićki Brod. In addition, new health protective air pollution measures should be adopted, such as protective vegetation belts, low emissions zones and increasing per capita green spaces around the city.
2 https://www.env-health.org/wp-content/uploads/2019/02/Chronic-Coal-Pollution-report.pdf, page 433 Both units have been confirmed under the so-called opt-out regime and need to close by the end of 2023 4 http://www.usaideia.ba/dpa/document.php?id=74299

6
While efforts are being made in the European Union to bring down air pollution to a safe level for people’s health and the environment, at the EU’s doorstep, the Western Balkans are a pollution hotspot. Governments are not taking sufficient action. Air quality data - needed to determine whether legally binding air quality standards are being breached, and to determine measures to improve air quality - is either unavailable or unreliable. Monitoring stations are placed in irrelevant locations and often certain pollutants are simply not monitored. Tuzla is no exception.
Tuzla is the third-largest city in Bosnia and Herzegovina, covering an area of 294 km2. It is the administrative center of the Tuzla Canton in the Federation of Bosnia and Herzegovina. The population, according to the latest official census (2013),5 is 110 979 inhabitants. 58.8 per cent of inhabitants are adults aged 30 or above, while 14.7 per cent are children between 5-19 years of age.
1. The air pollution crisis in Tuzla
According to the World Health Organization’s interactive map,6 Tuzla not only has the worst air quality in Bosnia and Herzegovina, but in the whole Western Balkans, with a modelled annual average of 65 µg/m3 for PM 2.5 in 2016 - 6.5 times above the level recommended by the WHO to protect health.
5 http://www.popis.gov.ba/6 http://maps.who.int/airpollution/
Tuzla
Location: Tuzla
Area Size (km2) 294
Total Population 110 979
Year: 2018
Latitude: 44.5375
Longitude: 18.6735
PM2.5 mean concentration from Skver and Bukinje (µg/m3) 41.03
PM10 calculated from PM2.5 mean concentration (µg/m3) 53.99
Table 1. Basic data on the location, population and mean concentrations of PM pollutants used for the health impact calculations
Photo captured from the WHO website

7
Tuzla is notorious across Europe and beyond for its poor air quality, and locals have taken to the streets in recent winters to protest about the heavy levels of dust pollution, particularly in the cold season. Health professionals have also joined called for the air in Tuzla and its surroundings to be cleaned up.7
The main causes of the problem are assumed to be the thermal power plant (4 units), individual household heating and traffic, but the authorities have so far failed to determine the exact contribution from each sector.
Independent measurements of PM10 and PM2.5 performed8 in 2016 and 2017 in Tuzla and analyses of wind speed and direction have determined that the high peaks in pollution can be attributed to emissions from the lignite power plant, open cast mines and ash disposal sites which surround the town.9
The state-owned electricity company Elektroprivreda BiH plans to build a new
450 MW lignite-fired unit at the Tuzla power plant. This would only replace the existing unit 3 (100 MW) and unit 4 (200 MW) before 2027,10 while units 5 and 6 would continue to operate, according to Bosnia and Herzegovina’s National Emissions Reduction Plan,10 thus perpetuating coal use in Tuzla.
The project promoters claim that the new unit would be in line with EU standards, but the project’s environmental permit and environmental impact assessment clearly show that it will not meet the EU’s latest Best Available Techniques (BAT) standards for large combustion plants, which came into force in 2017 for new plants.12
Additionally, the new unit would perpetuate the need for coal from open-cast mines, leaving behind mountains of dusty spoil-heaps. The new unit would also continue to produce large quantities of ash, whose disposal plays a critical role in aggravating local air pollution due to blowing around in windy weather.
7 https://unmaskmycity.org/project/tuzla/ 8 By CEE Bankwatch Network and Center for Ecology and Energy, Tuzla9 https://bankwatch.org/blog/race-to-the-bottom-dire-air-quality-worsens-as-bih-government-mulls-new-coal-plant-at-tuzla10 Both units have been confirmed under the so-called opt-out regime and will have to close by the end of 2023 https://www.energy-community.org/dam/jcr:1adf04b4-fc82-4ece-a07b-693da6ce9175/ECS_ENV_opt-out%20list_042018.pdf11 http://www.usaideia.ba/dpa/document.php?id=7429912 https://seenews.com/news/planned-coal-fired-power-plants-in-w-balkans-to-breach-new-eu-pollution-standards-bankwatch-572462

8
The legal framework on air quality in FBiH is advanced in its alignment with that of the European Union. However, as outlined throughout this report, grave flaws in its implementation result in some of the worst levels of particulate matter (PM) pollution in Europe. These flaws are: incomplete official monitoring, a mis-match between the legal obligation to keep PM10 within a certain limit, but only PM 2.5 being measured in reality, lack of air quality plans and lack of concrete measures to reduce PM10 and PM2.5 emissions.
Air quality legislation in FBIH
• Law on air quality (Official Gazette of FBiH 33/03; 04/10);13
• Law on environment (Official Gazette of FBiH 33/03; 38/09);14
• Ordinance on the method of performing air quality monitoring and defining types of pollutants, limit values and other air quality standards (Official Gazette of FBiH 01/12);15
• Ordinance on air quality monitoring (Official Gazette of FBiH 12/05);16
2. The legal framework on air quality in the Federation of Bosnia and Herzegovina (FBiH)
13 Zakon o zaštiti zraka (“Službene novine Federacije BiH”, broj: 33/03 i 4/10)14 Zakon o zaštiti okoliša („Službene novine FBiH“ broj 33/03; 38/09)15 Pravilnik o načinu vršenja monitoringa kvaliteta zraka i definisanju vrsta zagađujućih materija, graničnih vrijednosti i drugih standarda kvaliteta zraka (“Službene novine Federacije BiH”, broj: 1/12)16 Pravilnik o monitoringu kvaliteta zraka („Službene novine FBiH“ 12/05)17 Pravilnik o izmjenama i dopuni Pravilnika o monitoringu kvaliteta zraka („Službene novine FBiH“ 09/16)
• Ordinance on amendments to the Ordinance on air quality monitoring (Official Gazette of FBiH 09/16).17
The main goal of this legal framework is the prevention or reduction of emissions of pollutants into the air from human activities by including air quality in an integrated approach to environmental protection. This goal is to be achieved by continuous monitoring of air quality, maintaining an emissions registry and preparation and implementation of medium- and long-term emission reduction plans.
Air quality is monitored by continuous and automated monitoring of the concentration of sulphur dioxide, nitrogen oxides, dust particles (PM10, PM2.5), lead, benzene, carbon monoxide, ground-level ozone, arsenic, cadmium, mercury, nickel and benzo (a) pyrene.
The locations of the monitoring stations are chosen using a set of criteria that are supposed to ensure the best results for the protection of human health and ecosystems. In the FBiH legislation these are transposed from the EU’s Ambient Air Quality Directive (AQD).

9
18 In other words, this means that zones and agglomerations that are most likely to breach limit values on a regular basis are a priority for monitoring.19 The last part of the sentence is more clearly specified in the FBIH legislation than in the EU Ambient Air Quality Directive itself.20 The Ordinance on the method of performing air quality monitoring and defining the types of pollutants, limit values and other air quality standards (Official Gazette of FBiH 01/12) mentions that the limit of 50 µg/m3 for PM10 will only be reached in 2021, following a linear descent from 75 µg/m3 in 2012. However, in the Hydro Meteorological Institute’s annual reports, official measurements are reported against the daily limit of 50 µg/m3 as in the EU Air Quality Directive and in the Federal Law on Air Quality. Therefore, this is the limit also used for reference throughout this report. Even if these interim targets were to be achieved, significant reductions in risks for acute and chronic health effects from air pollution can be expected. Reaching the legal limit values should be the objective to be achieved as soon as possible even before 2021.
Pollutant Averaging Period Limit value
SO2
1-hour 350 µg/m3, not to be exceeded more than 24 times a calendar year
24-hour 125 µg/m3, not to be exceeded more than 3 times a calendar year
1 year 50 µg/m3
NO2
1-hour 200 µg/m3, not to be exceeded more than 18 times a calendar year
24-hour 85 µg/m3
1 year 40 µg/m3
PM1024-hour 50 µg/m3,20 not to be exceeded more than 35
times a calendar year
1 year 40 µg/m3
PM2.5 1 year 25 µg/m3
CO
daily 8-hour mean 10 mg/m3
24-hour 5 mg/m3
1 year 3 mg/m3
O3 daily 8-hour mean 120 µg/m3, not to be exceeded on more than 25 days/year, averaged over 3 years
For the purpose of this analysis two of the criteria stand out:
• Sampling points directed at the protection of human health shall be sited in such a way as to provide data on the following:
• the areas within zones and agglomerations where the highest concentrations occur to which the population is likely to be directly or indirectly exposed for a period which is significant in relation to the averaging period of the limit value(s)18
• Where contributions from industrial sources are to be assessed, at least one sampling point shall be installed downwind of the source in the nearest residential area. Where the background concentration is not known, an additional sampling point shall be situated within the main wind direction, upwind from the pollution source.19
The site-selection procedures should be fully documented and the sites should be reviewed at regular intervals with repeated documentation to ensure that the selection criteria remain valid over time.
Similarly, the limit values for air pollutants are transposed from the Ambient Air Quality Directive (AQD), but with an additional annual limit for sulphur dioxide, 24-hour limit for nitrogen dioxide and 24-hour and annual limits for carbon monoxide. The limit values for selected pollutants relevant for this analysis are given in the table on the right.
Table 2 - Limit values for all pollutants, according to FBiH legislation

10
In addition to the basic air quality framework, there is a specific Ordinance on limit values of emissions to air from combustion plants (Official Gazette of FBiH 3/13). This Ordinance, in which the EU Large Combustion Plants Directive is transposed,21 prescribes emission limit values of polluting substances into the air from combustion plants and ways to fulfill the plant operator’s obligations to adhere to these limit values.
Emissions from the four operating units in the Tuzla coal-fired power plant are regulated by this Ordinance. As an alternative to the Tuzla power plant fully adhering to the emission limit values by the deadline of 1 January 2018, the power plant operator either had to apply for an exception known as the “opt-out”, in which it operates the units for a limited number of hours - up to 20 000 total after 1 January 2018 - and closes them by the end of 2023, or it needed to prepare a programme for the progressive reduction of total annual emissions down to the established limits in this Ordinance, which is then included in a National Emissions Reduction Plan (NERP).22
Units 3 and 4 have been confirmed as “opting out”, and will need to close by the end of 2023, while units 5 and 6 have been included in a NERP which has been approved both at the State level in Bosnia and Herzegovina, and by the Energy Community Secretariat. All the plants included need to bring their emissions into line with the legally binding limit values of the Industrial Emissions Directive Annex V part 1, by the end of 2027.
‘Stop ash dumps’Photo taken at the protest against the Šički Brod ash disposal site, 18 May 2019
21 Directive 2001/80/EC, now superseded in the EU by Directive 2010/75/EU of the European Parliament and of the Council of 24 November 2010 on industrial emissions but still in force in the Energy Community Treaty countries including Bosnia and Herzegovina.22 https://www.usaideia.ba/en/activities/emission-reductions/what-we-do/emission-reduction-plans/
11
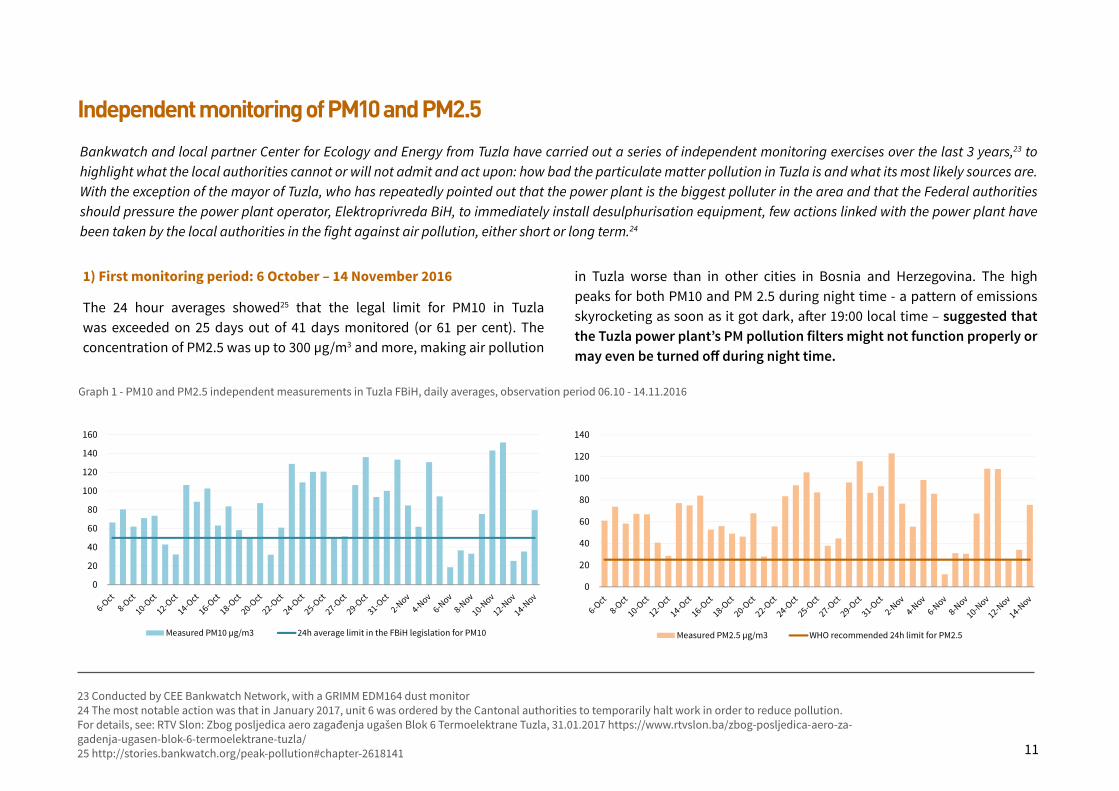
1) First monitoring period: 6 October – 14 November 2016
The 24 hour averages showed25 that the legal limit for PM10 in Tuzla was exceeded on 25 days out of 41 days monitored (or 61 per cent). The concentration of PM2.5 was up to 300 µg/m3 and more, making air pollution
Independent monitoring of PM10 and PM2.5
23 Conducted by CEE Bankwatch Network, with a GRIMM EDM164 dust monitor24 The most notable action was that in January 2017, unit 6 was ordered by the Cantonal authorities to temporarily halt work in order to reduce pollution. For details, see: RTV Slon: Zbog posljedica aero zagađenja ugašen Blok 6 Termoelektrane Tuzla, 31.01.2017 https://www.rtvslon.ba/zbog-posljedica-aero-za-gadenja-ugasen-blok-6-termoelektrane-tuzla/25 http://stories.bankwatch.org/peak-pollution#chapter-2618141
Bankwatch and local partner Center for Ecology and Energy from Tuzla have carried out a series of independent monitoring exercises over the last 3 years,23 to highlight what the local authorities cannot or will not admit and act upon: how bad the particulate matter pollution in Tuzla is and what its most likely sources are. With the exception of the mayor of Tuzla, who has repeatedly pointed out that the power plant is the biggest polluter in the area and that the Federal authorities should pressure the power plant operator, Elektroprivreda BiH, to immediately install desulphurisation equipment, few actions linked with the power plant have been taken by the local authorities in the fight against air pollution, either short or long term.24
in Tuzla worse than in other cities in Bosnia and Herzegovina. The high peaks for both PM10 and PM 2.5 during night time - a pattern of emissions skyrocketing as soon as it got dark, after 19:00 local time – suggested that the Tuzla power plant’s PM pollution filters might not function properly or may even be turned off during night time.
0
20
40
60
80
100
120
140
160
Measured PM10 µg/m3 24h average limit in the FBiH legislation for PM10
0
20
40
60
80
100
120
140
Measured PM2.5 µg/m3 WHO recommended 24h limit for PM2.5
Graph 1 - PM10 and PM2.5 independent measurements in Tuzla FBiH, daily averages, observation period 06.10 - 14.11.2016

1226 https://bankwatch.org/beyond-coal/airpollution-balkans
2) Second monitoring period: 10-18 October 2017
Over nine days of monitoring, record-breaking values of PM10 were documented.26 The 24h limit value established in FBiH legislation was breached on all days, with the highest peak at 937µg/m3 on 11 October at 05:00 - almost 20 times above the limit. Other notable recorded values of PM10 were recorded on 18 October, 08:00 – 632 µg/m3, followed by 500 µg/m3 on 15 October at 08:00.
Compared to the recordings in the previous year, 2017 shows an increase in pollution levels by almost 10 per cent, which is particularly worrying since
the autumn of 2017 was much warmer and locals had not generally started heating their homes at the time of monitoring.
The lack of interest from the responsible cantonal ministry and inadequate plans for emergency measures, and additionally incomplete Federal legislation (there are no defined maximum daily concentrations of PM2.5), resulted in no warning or measures related to this pollutant despite the fact that concentrations reached twelve times more than the WHO guidelines of 25 micrograms/m3 for 24-hour averages in previous years.
0
50
100
150
200
250
300
10-Oct 11-Oct 12-Oct 13-Oct 14-Oct 15-Oct 16-Oct 17-Oct 18-Oct
Measured PM10 µg/m3 24h average limit in the FBiH legislation for PM10
0
10
20
30
40
50
60
70
80
90
100
110
10-Oct 11-Oct 12-Oct 13-Oct 14-Oct 15-Oct 16-Oct 17-Oct 18-Oct
Measured PM2.5 µg/m3 WHO recommended 24h limit for PM2.5
Graph 2 - PM10 and PM2.5 independent measurements in Tuzla FBiH, daily averages, observation period 10-18.10.2017

13
3) Results of the 6-month continuous monitoring - 2018-2019
A long-term continuous PM10 monitoring device was placed in Tuzla, Bukinije. The independent monitoring station measured PM10 between 28 July 2018 and 2 February 2019, for a total of 174 days. In that time period, the average PM10 values were 87.3 µg/m3. This is more than double the legal annual limit value of 40 µg/m3 and more than four times the WHO recommended value of 20 µg/m3 for the annual mean.
Looking at the data for 2018 alone, PM10 was recorded for 144 days (39 per cent of the year, during 3 seasons (summer, autumn, winter). The average PM10 values in that period were 78.9 µg/m3. Out of 144 days of monitoring, on 98 days the PM10 exceeded the legal limit values of 50 µg/m3.
Legally, only a maximum of 35 days would be tolerated. And yet, in less than 5 months of measuring the pollution levels, for over 3 months people in Tuzla were breathing air that is legally considered too polluted.
0
50
100
150
200
250
300
350
400
450
28-J
ul
31-J
ul
3-Au
g
6-Au
g
9-Au
g
12-A
ug
15-A
ug
18-A
ug
21-A
ug
24-A
ug
27-A
ug
30-A
ug
2-Se
p
5-Se
p
8-Se
p
11-S
ep
14-S
ep
17-S
ep
20-S
ep
23-S
ep
26-S
ep
29-S
ep
2-O
ct
5-O
ct
8-O
ct
11-O
ct
14-O
ct
17-O
ct
20-O
ct
23-O
ct
26-O
ct
29-O
ct
1-N
ov
4-N
ov
7-N
ov
10-N
ov
13-N
ov
16-N
ov
19-N
ov
22-N
ov
25-N
ov
28-N
ov
1-De
c
4-De
c
7-De
c
10-D
ec
13-D
ec
16-D
ec
19-D
ec
22-D
ec
25-D
ec
28-D
ec
31-D
ec
3-Ja
n
6-Ja
n
9-Ja
n
12-J
an
15-J
an
Measured PM10 µg/m3 Annual average limit in the FBIH legislation for PM10 Average PM10 in over the monitoring period
Graph 3 - PM10 independent measurements in Tuzla FBiH, daily averages, observation period 28.07.2018 - 02.02.2019

14
According to the World Health Organization (WHO) no level of air pollution can be considered ‘safe’,27 and the link between air pollution and respiratory and cardiovascular diseases is well established.28, 29, 30
Breathing in particulate matter (PM), even at low levels, can lead to physiological changes in the body that damage health. Poor air quality is also linked to chronic and acute respiratory diseases, such as bronchitis and the aggravation of asthma. Scientists continue to identify new ways that air pollution can harm our health, for example, there is increasing evidence linking air pollution to dementia and new evidence has shown that particles of air pollution travel through the lungs of pregnant women and lodge in their placentas, harming children before they are even born.
3. Health impacts from air pollution
27 WHO/Europe: Review of evidence on health aspects of air pollution –REVIHAAP Project Technical Report, 2013: http://www.euro.who.int/__data/assets/pdf_file/0004/193108/REVIHAAP-Final-technical-report-final-version.pdf28 WHO/Europe: Review of evidence on health aspects of air pollution – REVIHAAP Project, 2013: http://www.euro.who.int/en/health-topics/environment-and-health/air-quality/publications/2013/review-of-evidence-on-health-aspects-of-air-pollution-revihaap-project-final-technical-report29 Royal College of Physicians: Every breath we take: the lifelong impact of air pollu-tion, February 2016 https://www.rcplondon.ac.uk/projects/outputs/every-breath-we-take-lifelong-impact-air-pollution30 The European Respiratory Society/The European Lung Foundation: The European Lung White Book. https://www.erswhitebook.org/chapters/outdoor-environment/
Visual reprinted with permission by Health and Environment Alliance (HEAL)
15
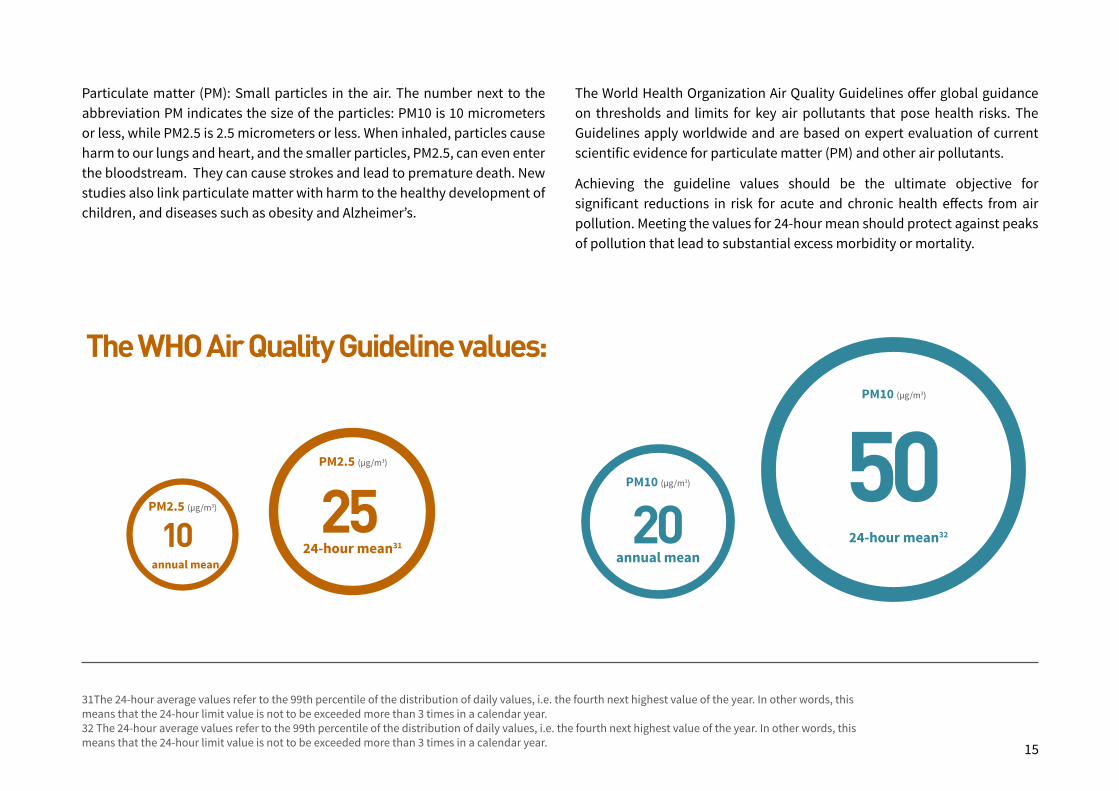
Particulate matter (PM): Small particles in the air. The number next to the abbreviation PM indicates the size of the particles: PM10 is 10 micrometers or less, while PM2.5 is 2.5 micrometers or less. When inhaled, particles cause harm to our lungs and heart, and the smaller particles, PM2.5, can even enter the bloodstream. They can cause strokes and lead to premature death. New studies also link particulate matter with harm to the healthy development of children, and diseases such as obesity and Alzheimer’s.
31The 24-hour average values refer to the 99th percentile of the distribution of daily values, i.e. the fourth next highest value of the year. In other words, this means that the 24-hour limit value is not to be exceeded more than 3 times in a calendar year.32 The 24-hour average values refer to the 99th percentile of the distribution of daily values, i.e. the fourth next highest value of the year. In other words, this means that the 24-hour limit value is not to be exceeded more than 3 times in a calendar year.
The World Health Organization Air Quality Guidelines offer global guidance on thresholds and limits for key air pollutants that pose health risks. The Guidelines apply worldwide and are based on expert evaluation of current scientific evidence for particulate matter (PM) and other air pollutants.
Achieving the guideline values should be the ultimate objective for significant reductions in risk for acute and chronic health effects from air pollution. Meeting the values for 24-hour mean should protect against peaks of pollution that lead to substantial excess morbidity or mortality.
25PM2.5 (µg/m3)
24-hour mean3110PM2.5 (µg/m3)
annual mean
50PM10 (µg/m3)
24-hour mean3220PM10 (µg/m3)
annual mean
The WHO Air Quality Guideline values:

16
The Federation of Bosnia and Herzegovina has air quality legislation aligned with the EU Air Quality Directive. The legislation sets yearly limit values for particulate matter, both PM10 (40 µg/m3) and PM2.5 (25 µg/m3). It also regulates PM10 pollution with a 24-hour limit - 50 µg/m3 - stating that this should not be exceeded more than 35 days per year.
Although legislation on both daily and yearly limits of PM10 pollution exists, official measuring stations in Tuzla Canton record PM2.5, but not PM10 values. Moreover, PM2.5 only has an annual limit in the legislation. In other words, the public institutions responsible for enforcing air quality monitoring and improvement measures are not collecting the data they would need to be able to understand and improve the situation and to issue warnings to the population to protect their health for peak pollution.
It is important to have data on both PM10 and PM2.5, as both pollutants lead to health impacts, and also to be able to estimate these impacts.
This lack of official PM10 monitoring has a negative effect on the health of the people living in Tuzla and its surroundings, and is also the reason an independent monitoring station was installed in Bukinje, near Tuzla, to measure PM10. The location was chosen because of its proximity to the Tuzla coal power plant and ash disposal site, as well as to the monitoring station in Bukinje, which is part of Tuzla’s official monitoring system. The location offered the possibility to compare the PM measurements from both stations, using WHO factors33 to convert PM10 levels into PM2.5 and the other way around.
4. Tuzla air quality data: official vs independent monitoring
33 For Bosnia and Herzegovina the conversion factor is 0.76. National conversion factors (PM2.5/PM10 ratio) were estimated as population-weighted averages of city-specific conversion factors for the country. WHO Ambient air quality database, 2016.
Independent monitoring station next to an official one, for calibration, at the Hydro-Meteorological Institute in Sarajevo

17
34 The WHO country-specific conversion factor for Bosnia and Herzegovina is 0.76 35 The data was taken from the hourly measured PM2.5 in 2018 for Skver and Bukinje. The dataset has 16279 measurements recorded (or 92.9% of the year covered, at 2 stations). All missing (1241) and negative (557) values were excluded from the calculation.
* 28 July 2018 to 31 December 2018, 144 days of measurements, 39 per cent of the year, covering 3 seasons** PM2.5 was converted from PM10 measurement with the WHO’s country-specific conversion factor for Bosnia and Herzegovina, which is 0.76.
46.6
no data
34.6
59.9**
0 10 20 30 40 50 60 70
Skver
BKC
Bukinje
Independent station(Bukinje)*
Graph 4. Official monitoring station consistently show lower levels of air pollution than independent monitoring.
Looking at the data for 2018 alone, PM10 was recorded for 144 days (39 per cent of the year, during 3 seasons (summer, autumn, winter). The average PM10 values in that period were 78.9 µg/m3. Out of 144 days of monitoring on 98 days the PM10 exceeded the legal daily limit value of 50 µg/m3.
The WHO’s national conversion factors for BiH allow to calculate PM 2.5 values from the PM10 values measured, resulting in an average of 59.9 µg/m3 for PM2.5 over the monitored period.
Comparing these independent monitoring results with the nearest official measurements of PM2.5, they show a discrepancy of 54 per cent, official monitoring stations showing lower levels of pollution than the independent station (graph 4).
For calculating the health impacts of PM exposure in Tuzla, official data available on air quality was used. As explained above, these air quality numbers most likely represent an underestimation of air pollution levels in the Tuzla area. Consequently, it is safe to assume that the health impacts are also a lot graver.
According to official measurements, the annual mean PM2.5 concentration in 2018 in Tuzla was 41.03 µg/m3. From that, and using the WHO country conversion,34 the calculated PM10 annual mean concentration was 53.99 µg/m3.35
PM2.5 µg/m3

18
Public health in Tuzla in 2018 and how it is impacted by air pollutionThe mortality and morbidity data for 2018 for the Tuzla Canton was provided by the Tuzla Canton Public Health Institute of Tuzla Canton (Table 3 and Annex 1).
Mortality in Tuzla due to all causes was the highest in the region (canton), with a 1 220.95 death rate per 100 000 population - equal to 1 355 cases in 2018. Tuzla is followed by Lukavac, where the death rate was 1 096.14 per 100 000 population. The average death rate in the Tuzla Canton is 985.11 per 100 000 population.
It is worth mentioning that the Tuzla coal power plant is located half-way between the centres of Tuzla (8 kilometres) and Lukavac (7 kilometres).
In Tuzla, 62 people died due to ischemic lung disease. That is a rate of 55.87 per 100,000 inhabitants in Tuzla. Other cities had a higher mortality rate for this disease. Moreover, 88 Tuzlans died of a stroke in 2018. Gradačac and Lukavac had higher mortality rates due to stroke - 155 and 116 respectively. There were 38 deaths due to COPD in Tuzla, among the three highest mortality rates in the Tuzla Canton, led by Doboj and Lukavac. 70 people in Tuzla died due to lung cancer in 2018. This represents the fourth highest mortality rate in the Canton, 63.07 per 100 000 inhabitants.
36 Data provided by the Tuzla Canton Public Health Institute37 COPD - chronic obstructive pulmonary disease
Mortality and morbidity in Tuzla, 2018 Number of cases
Mortality, all causes 1 355
Mortality, ischemic heart disease 62
Mortality, stroke 88
Mortality, COPD37 38
Mortality, lung cancer 70
Acute bronchitis 17 597
Bronchitis and COPD 6 157
Hospitalisations due to respiratory disease 3 071
Hospitalisations due to cardiovascular disease 163
5. Reducing air pollution in Tuzla would protect and benefit health
Table 3. Data on mortality and morbidity in Tuzla, 201836

19
Based on these official numbers, we were able to determine how many of these deaths can be attributed to PM2.5 exposure (detailed in the graphs and tables below).38 In the case of lung cancer in adults over 30, PM2.5 was responsible for 8 out of 41 deaths. For stroke, air pollution was responsible for 29 per cent of deaths - 17 out of 58 stroke deaths that occured in Tuzla.
The overview of the health impact assessment, below, is based on the 2018 annual average of PM2.5 values from the two available official stations, 41.03 µg/m3 and, calculated from that, the PM10 annual average of 53.99 µg/m3. Following the aforementioned discrepancy between official data and monitoring and independent checks, the data can only be described as a conservative estimate, with likely much graver impacts on the population’s health.
Graph 5. Share of health impacts caused by PM pollution in Tuzla, 2018
31%of bronchitis in adults
23%of bronchitis in children
20%of deaths from lung
cancers
29%of deaths by stroke
38 The core reference for the health impact assessment is the Health Response to Air Pollutants in Europe Project (HRAPIE) coordinated by WHO-Europe for the EU Commission, and bringing together a large number of senior experts on the health effects of air pollution from Europe and North America. This is the most recent and complete review of the science available. HRAPIE provides response functions for exposure to three pollutants, fine particles (PM2.5 or PM10), NO2 and ozone. In this study we have looked only at the health outcomes related to PM10 and PM2.5.

20
To estimate the health benefits of reducing air pollution in Tuzla, two scenarios have been modelled, legal and health protective.
Health benefits of compliance with legal limits and guidelines - scenarios
Legal scenario - compliance with legal limits: less ambitious scenario, levels of pollution would reach the legal limits, based on the FBIH legislation, set at 25 µg/m3 for PM2.5 and 40 µg/m3 for PM10 per year.
• Based on official PM2.5 measurements, in 2018, PM2.5 pollution caused 136 premature deaths in adults in Tuzla. That is 17 per cent of all deaths of adults above 30 years of age. If levels of PM2.5 pollution stayed within legal limits, the number of premature deaths could be reduced by 73 annually, but air pollution would still be responsible for 63 deaths yearly in Tuzla’s adult population.
• In 2018, an estimated 1 339 adults in Tuzla developed bronchitis due to PM10 - an estimated 31 per cent of all bronchitis cases. But if the levels of air pollution in Tuzla stayed within the legal limits, new cases of bronchitis in adults could fall by 612 cases per year.
• Also, in the legal scenario, 71 fewer children would suffer from bronchitis, out of a total 160 cases recorded in 2018 due to PM10.
0
50
100
150
200
250
300
350
400
450
PM10 µg/m3 - 24h average measured
PM2.5 µg/m3 - 24h values - WHO 0.76 conversion factor applied
PM10 limit: 40 µg/m3
PM 2.5 limit: 20 µg/m3
Monitored period: July - December 2018
Graph 6. PM pollution levels as compared to the legal limits

21
Health protective scenario - true health protection: a more ambitious scenario where the level of pollution would not exceed unhealthy levels, based on the WHO recommendations, set at 10 µg/m3 annually for PM2.5 and 20 µg/m3 for PM10.
• All 136 estimated premature deaths in Tuzla attributed to PM2.5 in 2018 could be avoided in a health protective scenario.
• 6 deaths in Tuzla in 2018 due to chronic obstructive pulmonary disease (COPD) are attributed to PM2.5. In the health protective scenario, all these could be eliminated.
• In 2018 in Tuzla, 8 adults over 30 years old died of lung cancer attributed to PM2.5. In a health protective scenario, these could be reduced to zero.
• If PM2.5 pollution was brought into line with the health protective scenario, the total number of PM2.5-attributed deaths by stroke, could be reduced from 17 to zero. This would also reduce overall deaths by stroke in Tuzla by 29 per cent.
• All 1 339 cases of bronchitis attributed to PM10 could be eliminated in the health protective scenario. This would reduce the total number of new cases of chronic bronchitis in adults by almost a third compared to the 4 271 cases in 2018. Applying the health protective scenario would also mean that the number of children suffering from PM10-induced bronchitis in Tuzla - 160 in 2018 - would be reduced to zero. This would bring a reduction of 23 per cent compared to the 695 children who had this condition in 2018.
PM2.5µg/m3
PM10µg/m3
0
10
25
0
20
40
Graph 7. Comparison of PM pollution limits in the Legal and Health protective scenarios

22
Table 4 shows the number of health impacts in 2018 and how many of them could be avoided in the Legal and Health-protective scenarios.
Pollutant
Health Endpoint
Health impacts attributed to ALL causes
Health impacts attributed to PM POLLUTION
Share of deaths and other health impacts caused by PM pollution
Number of health impacts mitigated:LEGAL Scenario
Number of health impacts mitigated: HEALTH PROTECTIVE Scenario
Estimated number of cases avoided
Range of uncertainty (low-high)
Estimated number of cases avoided
Range of uncertainty (low-high)
PM2.5 Mortality, all (natural) causes (adults age 30+ years) 797 136 17% 73 (49-96) 136 (91-175)
PM2.5 Mortality due to COPD for adults (30+ years) 22 6 27% not applicable not applicable 6 (3-9)
PM2.5 Mortality Lung Cancer 30+ 41 8 20% not applicable not applicable 8 (5-12)
PM2.5 Mortality due to stroke for adults (25+ years) 58 17 29% not applicable not applicable 17 (8-25)
PM10 New cases of bronchitis in adults 4 271 1 339 31% 612 (228-918) 1339 (533-1 900)
PM10 Bronchitis in children 695 160 23% 71 (-19-150) 160 (-49-310)
136630
100
200
300
400
500
600
700
800
900
Current numbers Legal scenario Health protectivescenario
deaths attributed to PM pollution all other causes
1339
727
0
500
1000
1500
2000
2500
3000
3500
4000
4500
Current numbers Legal scenario Health protectivescenario
adult bronchitis attributed to PM pollution other
16089
0
100
200
300
400
500
600
700
800
Current numbers Legal scenario Health protectivescenario
children bronchitis attributed to PM pollution other
Num
ber o
f cas
es
Num
ber o
f cas
es
Num
ber o
f cas
es
Graph 8. Number of health impacts and avoided cases in the Legal and Health protective scenarios as compared to current numbers

23
Hospital admissions due to:
Number of hospital admissions attributed to ALL causes
Number of hospital admissions attributed to PM2.5 POLLUTION
Share of hospital admissions caused by PM2.5 POLLUTION
Number of hospital admissions avoided: LEGAL Scenario
Number of hospital admissions avoided: HEALTH PROTECTIVE Scenario
Estimated number of admissions avoided
Range of uncertainty (low-high)
Estimated number of admissions avoided
Range of uncertainty (low-high)
Respiratory disease 3 071 174 5.6% 91 (-9-188) 174 (-17-353)
Cardiovascular diseases (CVD) and stroke 163 5 2.7% 2 (0-4) 5 (1-8)
Reducing the current levels of air pollution would mean an immediate reduction of health impacts. Most immediate would be short-term effects on the number of hospitalisations (Table 5), meaning less immediate burden on the health system and health costs savings.
Up to 353 hospitalisations due to respiratory problems (out of a total of 179 attributed to PM2.5 pollution) could have been avoided in 2018, if a health protective scenario was applied.
Table 5 shows the number of hospital admissions in 2018 and how many of them could be avoided in the Legal and Health-protective scenarios

24
Number of deaths and health conditions could be reduced if air pollution in Tuzla would improve. Strong response to air pollution is urgently needed to protect citizens' health and life. The cost of investing in coal is additional price paid for the lost lives of many.
Maida Mulić PhD MD, director of the Public Health Institute of Tuzla Canton
6. Reactions from local medical community
Improving air quality is preventive intervention in cutting down deaths from stroke and cardiovascular disease. Hospital admissions in Tuzla would drop too allowing more capacity for our local health system to deal with other non-preventable diseases. People in Tuzla need clean air and sustainable future that will contribute to well-being of the community.
Selma Azabagić PhD MD, Head of department for hygiene and health ecology in the Public Health Institute of Tuzla Canton

25
The air quality in Tuzla is dire, locals know and feel it and their endurance has attracted the attention in recent years from big international media including Euronews,39 the BBC40 and RAI News,41 whose television crews have made their way to this town in the world’s second most polluted country.42
The Government’s and Parliament’s proposed solution to the notorious pollution in Tuzla is a new 450 MW unit at the existing lignite power plant. However, Tuzla 7 has not been designed in line with the latest EU standards regulating pollution control for large combustion plants - the so-called Best Available Techniques reference document for large combustion plants (LCP BREF)43 - making this unit out of date before it is even built.
Although it is usually cited as a replacement for existing units, Elektroprivreda BiH, the plant operator, plans to close only the existing 100 MW unit 3 and 200 MW unit 4 before the new unit is built, while units 5 and 6 would continue to operate beyond 2027, according to Bosnia-Herzegovina’s National Emissions Reduction Plan.
The environmental permit for Tuzla 7 is incomplete as it does not cover the planned ash landfill at Šićki Brod. Article 71 of the Federation’s Law on Environmental Protection states that an environmental permit must
7. Why the planned Tuzla 7 coal unit is not a solution
39 http://www.euronews.com/2016/11/11/bosnia-and-herzegovina-dying-for-coal40 http://www.bbc.com/news/av/world-europe-42000232/bosnia-s-silent-killer-the-coal-industry41 http://www.rainews.it/dl/rainews/media/Bosnia-Herzegovina-L-aria-che-uccide-reportage-inquinamento-polveri-sottili-b71df178-ed39-4886-b8da-e28540e16887.htmlAlthough it is usually cited as a replacement for existing units, Elektroprivreda BiH, the plant operator, plans to close only the existing 100 MW unit 3 and 200 MW unit 4 before the new unit is built,# while units 5 and 6 would continue to operate beyond 2027, according to Bosnia-Herzegovina’s National Emissions Reduction Plan.# 42 http://apps.who.int/iris/bitstream/10665/255336/1/9789241565486-eng.pdf43 https://bankwatch.org/wp-content/uploads/2017/06/BREF-Balkan-coal-14Jun2017.pdf44 http://balkans.aljazeera.net/vijesti/zitelji-tuzlanskih-naselja-termoelektrana-uzrok-karcinoma45 https://www.klix.ba/vijesti/bih/protest-gradjana-tuzle-i-lukavca-deponija-sljake-u-sickom-brodu-ce-nas-ubiti/190517123
include measures for managing waste produced by the facility in question. In addition, using the Šićki Brod site as an ash landfill would contravene the Tuzla Canton and Lukavac and Tuzla municipality spatial plans.
Local opposition to a new ash disposal site is high. The local community representatives delivered a petition with 2 100 signatures44 against the proposal to the Federal Ministry of Environment and Tourism, already in April 2016. In May 2019 citizens of Tuzla and Lukavac in protest again against the proposed ash dumping site.45 About 200 citizens held a protest in Bistarac, close to the Šićki Brod lake, site of the new ash disposal site planned by the latest draft of the Spatial plan for the Tuzla canton. They warned the cantonal authorities of potentially devastating health impacts on local communities.

26
The dire health and environmental consequences of air pollution, especially particulate matter, can be mitigated. Recommendations to Bosnia and Herzegovina decision-makers, environmental protection agencies and the Tuzla authorities in particular include compliance with the existing air quality legislation, application of the “polluter pays” principle in a manner that is effective, proportionate and dissuasive to activities harming people’s health and taking the concerns of the community into account when making decisions on the future industrial development of the region.
To decision-makers in Tuzla Canton:
• Do not make changes to the Spatial Plan that would allow the Šićki Brod ash disposal site to be built;
• Provide protection belts and health and environmental protection measures in the Cantonal Spatial Plan;
• Urgently approve and implement land improvement measures for old/depleted mining sites and ash disposal sites;
• Put short-term measures in place directed at the power plant, coal mine and ash disposal sites for periods when air pollution is several times above the legal limit values;
• Establish low emissions zones in the city;
• Increase per capita green spaces around the city.
Conclusions and recommendations

27
To the Cantonal Ministry of Environment:
• Urgently upgrade the air pollution monitoring network and make sure all monitoring stations measure all pollutants regulated in the air quality legislation (PM10, PM2.5, SO2, NO2, CO and O3);
• Make official monitoring data available online in real time and keep previous datasets available;
• Adopt credible and measurable Air Quality Action Plans, which will bring the air pollution levels into line with the legal annual limit values first, followed by WHO recommendations in a maximum of 8 years.47
46 https://www.energy-community.org/dam/jcr:1adf04b4-fc82-4ece-a07b-693da6ce9175/ECS_ENV_opt-out%20list_042018.pdf47 The National Emissions Reduction Plan runs until the end of 2027, by which time at least all units are legally required to be in line with Annex V part 1 of the Industrial Emissions Directive.
To the health and medical community:
• Get engaged in public discussion on air quality, including on policy changes, and provide input into the development and implementation of clean air activities and plans.
• Inform the public on health risks due to air pollution and communicate alerts to your patients and the public when air pollution exceeds healthy levels.
• Highlight the true costs of coal power generation in economic and public health deliberations, consultations and health impact assessments, and work towards increasing public understanding of how public health will benefit from reducing coal’s unpaid health bill.
• Support measures to reduce coal pollution and to develop ambitious phase out plans.
To the Government of the Federation of BiH:
• Urgently enforce EU industrial emissions legislation at Tuzla’s existing units - the Large Combustion Plants Directive is the legal minimum but any pollution abatement investments in coal plants must be in line with the 2017 LCP BREF to better protect public health and avoid the need for additional investments in a few years.
• Comply with the LCPD opt-out decision46 and close units Tuzla 3 and 4 by the end of 2023.
• Do not build Tuzla 7 or any other new coal capacities.
• Make informed energy choices based on health and environmental impact assessments, and economic cost-benefit analyses that include short and long term cost-benefits, local and transboundary impacts.
• Make energy sector planning more streamlined by connecting strategies and legislation from the economic, energy and environmental sectors and increase transparency by allowing experts and the general public to participate.
• Opt for sustainable forms of renewable energy and energy savings. Take advantage of the falling costs of solar and wind and the potential of geothermal heat pumps for heating and cooling.
• Adopt information and alert thresholds for PM10 and PM2.5 pollution in the air quality legislation.

28
In this study, we used AirQ+ software version 1.3. The software is a tool for health risk assessment of air pollution developed by World Health Organisation.48
AirQ+ is designed to calculate the magnitude of the impacts of air pollution on health in a given population. It handles long- and short-term exposure to ambient air pollution from several pollutants, and long-term exposure to household air pollution from solid fuel use.
AirQ+ can be used for any city, country or region to estimate:
• How much of a particular health outcome is attributable to selected air pollutants?
• Compared to the current levels of pollution, what would be the change in health effects if air pollution levels changed in the future, lower than now observed?
Annex 1: the WHO methodology
48 http://www.euro.who.int/en/health-topics/environment-and-health/air-quality/activities/airq-software-tool-for-health-risk-assessment-of-air-pollution
In our study we used 2 levels of reduction of air pollution:
• Scenario 1 (legal) - compliance with legal limits: less ambitious scenario, levels of pollution would reach the legal limits, based on the legislation in Bosnia and Herzegovina, set at 20 µg/m3 for PM2.5 and 40 µg/m3 for PM10.
• Scenario 2 (health protective) - true health protection: more ambitious scenario where the level of pollution would not exceed unhealthy levels, based on the WHO recommendations, set at 10 µg/m3 for PM2.5 and 20 µg/m3 for PM10.
All calculations performed by AirQ+ are based on methodologies and concentration-response functions established by epidemiological studies. The concentration–response functions used in the software are based on the systematic review of all studies available and their meta-analysis.
Health impacts calculation methodology and public health data on mortality and morbidity in Tuzla canton

2949 ME Héroux. Quantifying the health impacts of ambient air pollutants: Recommendations of a WHO/Europe project. International Journal of Public Health, 2015.
CI confidence interval, RR relative risk, COPD chronic obstructive pulmonary disease, CVD cardiovascular disease, GBD global burden of disease, PM2.5 particulate matter with an aerodynamic diameter smaller than 2.5 lm, PM10 particulate matter with an aerodynamic diameter smaller than 10 lm
Group A: pollutant–outcome pairs contributing to the limited set of effects but considered already accounted for by summing those with an asterisk
Group A*: pollutant–outcome pairs contributing to the total limited set of effects (the effects are additive)
Group B*: pollutant–outcome pairs contributing to the total extended set of effects (the effects are additive)
Data on mortality and morbidity for Tuzla city and canton was collected and provided by Public Health Institute of Tuzla canton.
Details of numbers and rates below.
Pollutant Pollutant metric Health outcome Group
RR (95 % CI) per 10 µg/m3
Increase in % of health outcome per 10 µg/m3 increase of pollutant
PM2.5 annual mean Mortality, all-cause (natural), age 30+ years A* 1.062 (1.040–1.083) 6.20%
PM2.5 annual meanMortality, cerebrovascular disease (includes stroke), ischaemic heart disease, COPD and trachea, bron-chus and lung cancer, age 30+ years
A GBD 2010 study (IHME 2013)
PM10 annual mean Prevalence of bronchitis in children, age 6–12 (or 6–18) years B* 1.08 (0.98–1.19) 8.00%
PM10 annual mean Incidence of chronic bronchitis in adults (age 18+ years) B* 1.117 (1.040–1.189) 11.70%
PM2.5 daily mean Hospital admissions, respiratory diseases, all ages A* 1.019 (0.998-1.040) 1.90%
PM2.5 daily mean Hospital admissions, CVDs (including stroke), all ages A* 1.0091 (1.0017-1.0166) 0.91%
Table 6. Pollutant–health outcome pairs for which the HRAPIE project recommends concentration–response functions49

30
Municipalities Number of deaths Rate per 100,000 inhabitants
Banovići 189 829.93
Čelić 112 1 066.46
Doboj Istok 106 1 034.35
Gračanica 408 902.26
Gradačac 393 998.98
Kalesija 238 720.06
Kladanj 120 971.82
Lukavac 488 1 096.14
Sapna 76 679.91
Srebrenik 343 864.46
Teočak 73 983.3
Tuzla 1 355 1 220.95
Živinice 483 836.15
Total number of deaths 4 384 985.11
Table 7. Number of deaths in the Tuzla Canton area in 2018 (total and rate per 100,000 population)

31
Table 8. Number of deaths in the Tuzla Canton area in 2018 (specification by disease)
Općine I25 (Chronic ischemic heart disease)
I63 (Cerebral infarction) J44 (Chronic obstructive pulmonary disease)
C34 (Malignant neoplasm of bronchus and lung)
Total
number of deaths
the rate per 100,000 inhabitants
number of deaths
the rate per 100,000 inhabitants
number of deaths
the rate per 100,000 inhabitants
number of deaths
the rate per 100,000 inhabitants
number of deaths
the rate per 100,000 inhabitants
Banovići 7 30.74 14 61.48 4 17.56 12 52.69 37 162.47
Čelić 2 19.04 5 47.61 0 1 9.52 8 76.18
Doboj 6 58.55 6 58.55 5 48.79 4 39.03 21 204.92
Gračanica 16 35.38 19 42.02 8 17.69 30 66.34 73 161.43
Gradačac 24 61.01 61 155.06 8 20.34 25 63.55 118 299.95
Kalesija 10 30.25 17 51.43 5 15.13 15 45.38 47 142.20
Kladanj 6 48.59 4 32.39 3 24.3 6 48.59 19 153.87
Lukavac 25 56.15 52 116.80 16 35.94 21 47.17 114 256.06
Sapna 1 8.95 6 53.68 1 8.95 2 17.89 10 89.46
Srebrenik 17 42.84 28 70.57 10 25.2 22 55.45 77 194.06
Teočak 5 67.35 2 26.94 3 40.41 7 94.29 17 228.99
Tuzla 62 55.87 88 79.29 38 34.24 70 63.07 258 232.48
Živinice 12 20.77 35 60.59 16 27.7 28 48.47 91 157.53
Total number of deaths
193 43.37 337 75.73 117 26.29 243 54.6 890 199.99

32
Table 9. Acute bronchitis registered in Primary Health Care in the Tuzla Canton area in 2018
Acute bronchitis, bronchiolitis (J20-J21)
Age of child 0-6 Age of children 7-19
number of diseases
rate per 10,000 inhabitants
number of diseases
rate per 10,000 inhabitants
11 116 3 376.46 2 210 273.31
19-64 ages 65 age and more
number of diseases
rate per 10,000 inhabitants
number of diseases
rate per 10,000 inhabitants
3 472 123.69 799 148.12
Table 10. Bronchitis, emphysema and other chronic obstructive lung diseases registered in Primary Health Care in the Tuzla Canton area in 2018
Bronchitis, emphysema and other chronic obstructive lung diseas-es (J40-J44)
Age of child 0-6 Age of children 7-19
number of diseases
rate per 10,000 inhabitants
number of diseases
rate per 10,000 inhabitants
185 62.67 510 63.07
19-64 ages 65 age and more
number of diseases
rate per 10,000 inhabitants
number of diseases
rate per 10,000 inhabitants
2,965 105.63 2 497 462.91
Limitations of AirQ+
The estimates generated by AirQ+ carry some uncertainties as they rely on information from concentration-response functions, which are based on a number of assumptions. Key assumptions include:
• models consider ambient air pollution concentration as a proxy indica-tor of population exposure;
• calculations do not account for multiple exposure cases or multipollut-ant scenarios;
• health outcomes related to hospital admissions due to air pollution might not be accurate (have low reliability) due to difficulties in their assessment.

33
The independent measurements in Tuzla between 28 July 2018 and 02 February 2019 were carried out using a DustTrak II 8530 aerosol monitor produced by TSI Incorporated. The device is a light-scattering laser photometer that gives real-time aerosol mass readings and collects a gravimetric sample of PM1, PM2.5 and PM10 dust particles. Using several accessories it was modified for environmental measurements. Dust separation is done physically by mounting a suitable head on the measuring device; an outer casing is used to protect it from weather conditions and the data from the device is sent to the database using a GSM modem connected to the data-logger.
Interference from water in a condensed form (water droplets) can influence the results of optical sensors used for dust monitoring. In cases of high humidity when condensation occurs in the air, laser light is scattered on the water droplets and this results in an overstated measurement result. In order to remove the aforementioned problem the analyzer was equipped with an air conditioning inlet, which heats the air samples in order to remove water in a condensed form.
Annex 2: independent PM10 data collection
50 Poland is the device’s country of origin.
The device was calibrated by the manufacturer. Then, corrective factors were introduced by calibrating in Polish conditions50 for a wide range of concentrations in the heating season by comparing the results with the gravimetric method or a device equivalent to BAM-1020.
In cooperation with the Federal Hydro-meteorological Institute in Sarajevo, the relevant authority for air quality monitoring, calibration was also performed in Sarajevo relative to the Bjelave reference station (Envea MP101M particulate monitor). After the initial measurements were taken, a significant difference between our monitor and the Bjelave reference station was obvious. The difference appears because the official monitoring station applies an 8-hour moving average to the measurements with the result being smoother graphs and loss of some of the pollution peaks.

34
For the purpose of the analysis and to obtain values that are easily comparable to the official monitoring system, the same average was applied to the DustTrak II 8530 measurements and the device was additionally calibrated using the corrected data. The primary results after applying the 8-hour moving average and the calibration in Sarajevo are on the following graph:
As it can be seen, the measurements taken with the DustTrak II 8530 were then comparable to the ones from the Bjelave monitoring station and the device was ready for the six months of monitoring in Tuzla.
Photo: Development Planning Unit University College London (CC BY 2.0)