Life style factors in late onset depression
90
Lifestyle Factors In Late Onset Depression: A Comparison Between Treatment Seeking Population And Matched Healthy Controls. Thesis submitted in partial fulfillment of the regulations of the National Institute of Mental Health and Neurosciences (Deemed university) For the degree of Doctor of Medicine in Psychiatry Dr. Ramkumar G S DEPARTMENT OF PSYCHIATRY NATIONAL INSTITUTE OF MENTAL HEALTH AND NEUROSCIENCES (Deemed University) BANGALORE-560029 INDIA 2011
-
Upload
ramkumar-g-s -
Category
Health & Medicine
-
view
3.973 -
download
7
description
this study explores lifestyle factors like diet, exercise, socialization, leisure activities and alcohol, tobacco use in geriatric depression. it is a cross-sectional comparative study of elderly with depression and age, sex and education matched healthy controls.
Transcript of Life style factors in late onset depression
Lifestyle Factors In Late Onset Depression: A
Comparison Between Treatment Seeking Population And
Matched Healthy Controls.
Thesis submitted in partial fulfillment of the regulations of the
National Institute of Mental Health and Neurosciences
(Deemed university)
For the degree of
Doctor of Medicine in Psychiatry
Dr. Ramkumar G S
DEPARTMENT OF PSYCHIATRY
NATIONAL INSTITUTE OF MENTAL HEALTH AND NEUROSCIENCES
(Deemed University)
BANGALORE-560029
INDIA
2011
DECLARATION
I, Dr. Ramkumar G S, hereby declare that the thesis titled
“Lifestyle Factors In Late Onset Depression : A Comparison Between
Treatment Seeking Population And Matched Healthy Controls”, was
carried out by me under the guidance of Dr. Srikala Bharath, Professor of
Psychiatry, Dr. P T Sivakumar, Asst. Professor of Psychiatry and Dr.
Seema Mehrotra, Assoc. Professor of Mental Health and Social Psychology
at the National Institute of Mental Health And Neurosciences (NIMHANS,
Deemed University), Bangalore.
I also declare that no part of this study has previously been
submitted as thesis for any degree or diploma of any University.
October 2010 Dr. Ramkumar G S

ACKNOWLEDGEMENTS
My sincere thanks to Prof. Srikala Bharath who has been a constant source
of encouragement and guidance over the last two years during the course of
this research work.
My sincere thanks to Dr P T Sivakumar and Dr Seema Mehrotra for their
guidance and support.
I am grateful to Dr K Thennarasu, Assoc. Prof. of Biostatistics for statistical
assistance and Mrs Beena, (Nutritionist) for assistance in developing the
scale for dietary assessment.
I express my gratitude to all the staff of the Geriatric Clinic, NIMHANS who
have always been most supportive.
Special thanks to all the research participants who patiently sat through the
interview and cooperated whole heartedly for this endeavor.
I am thankful to all my friends at Kabini Hostel who have helped me with
the statistical software, reference manager software and helping in putting
the manuscript in order.

CONTENTS
S. no Chapter Pages
1 List of Tables, Figures and Appendices i
2 Introduction 1-6
3 Review of literature 7-29
4 Aims and Objectives 30
5 Methodology 31-35
6 Results 36-43
7 Discussion 44-49
8 Conclusion and Summary 50-52
9 Bibliography 53-61
10 Appendices 62-84
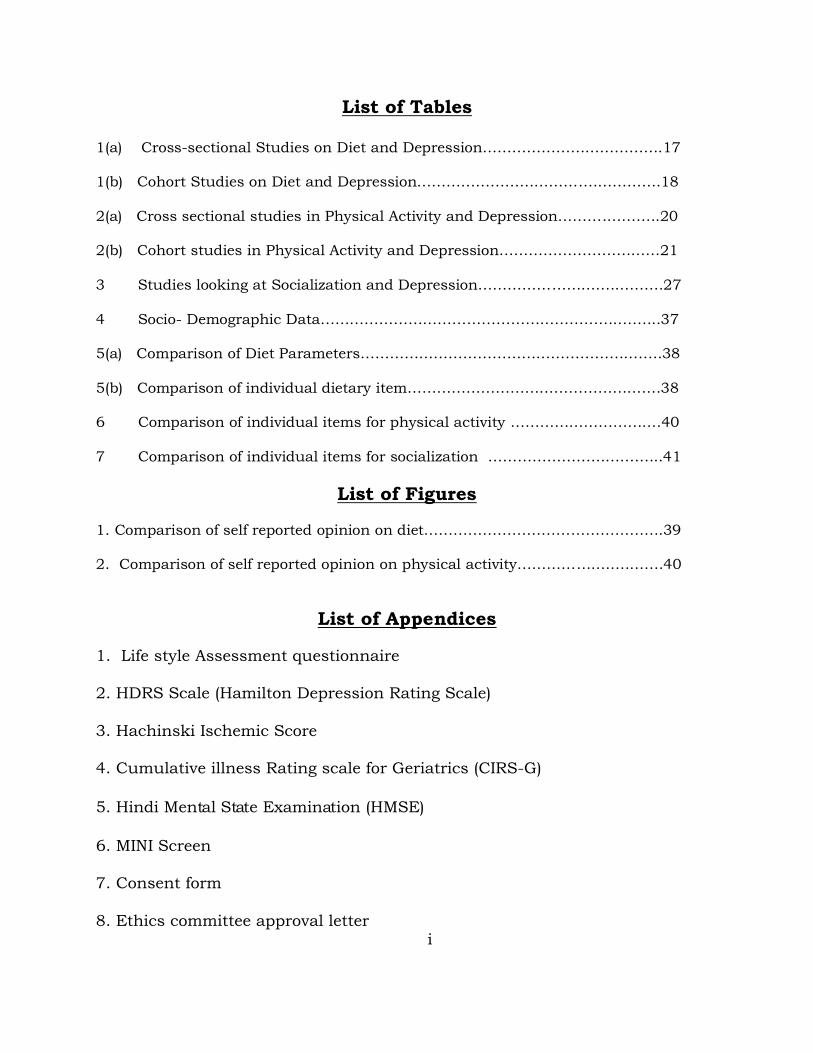
List of Tables 1(a) Cross-sectional Studies on Diet and Depression……………………………….17 1(b) Cohort Studies on Diet and Depression…………………………….…………….18 2(a) Cross sectional studies in Physical Activity and Depression……….….…….20 2(b) Cohort studies in Physical Activity and Depression……………………………21 3 Studies looking at Socialization and Depression…………………….….………27 4 Socio- Demographic Data……………………………………………………..……..37 5(a) Comparison of Diet Parameters……………………………………………….…….38
5(b) Comparison of individual dietary item……………………………………….……38 6 Comparison of individual items for physical activity ……………………….…40 7 Comparison of individual items for socialization ……………………….……..41
List of Figures 1. Comparison of self reported opinion on diet………………………………………….39 2. Comparison of self reported opinion on physical activity………………..……….40
List of Appendices
1. Life style Assessment questionnaire
2. HDRS Scale (Hamilton Depression Rating Scale)
3. Hachinski Ischemic Score
4. Cumulative illness Rating scale for Geriatrics (CIRS-G)
5. Hindi Mental State Examination (HMSE)
6. MINI Screen
7. Consent form
8. Ethics committee approval letter i

This document is licensed under the Creative commons attribution license 3.0
http://creativecommons.org/licenses/by/3.0/ Contact author at [email protected] http://twitter.com/ram3481 http://ramposters.blogspot.com/ http://www.slideshare.net/ram3481/presentations
1
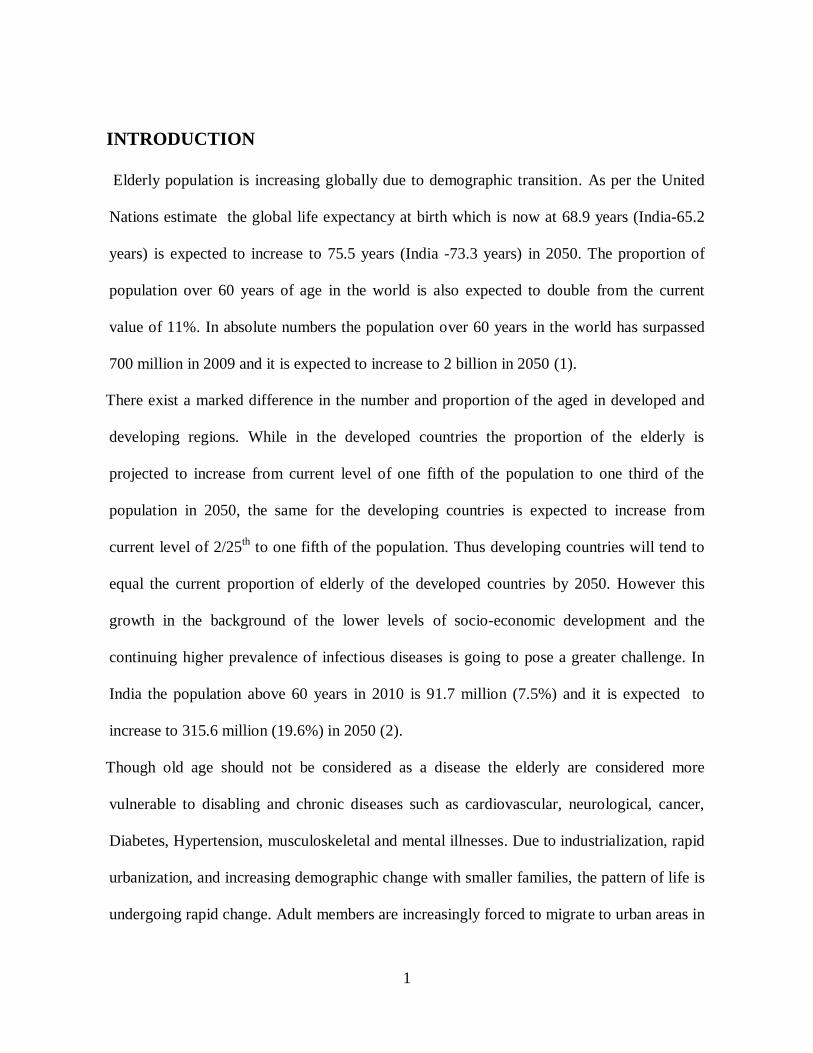
INTRODUCTION
Elderly population is increasing globally due to demographic transition. As per the United
Nations estimate the global life expectancy at birth which is now at 68.9 years (India-65.2
years) is expected to increase to 75.5 years (India -73.3 years) in 2050. The proportion of
population over 60 years of age in the world is also expected to double from the current
value of 11%. In absolute numbers the population over 60 years in the world has surpassed
700 million in 2009 and it is expected to increase to 2 billion in 2050 (1).
There exist a marked difference in the number and proportion of the aged in developed and
developing regions. While in the developed countries the proportion of the elderly is
projected to increase from current level of one fifth of the population to one third of the
population in 2050, the same for the developing countries is expected to increase from
current level of 2/25th to one fifth of the population. Thus developing countries will tend to
equal the current proportion of elderly of the developed countries by 2050. However this
growth in the background of the lower levels of socio-economic development and the
continuing higher prevalence of infectious diseases is going to pose a greater challenge. In
India the population above 60 years in 2010 is 91.7 million (7.5%) and it is expected to
increase to 315.6 million (19.6%) in 2050 (2).
Though old age should not be considered as a disease the elderly are considered more
vulnerable to disabling and chronic diseases such as cardiovascular, neurological, cancer,
Diabetes, Hypertension, musculoskeletal and mental illnesses. Due to industrialization, rapid
urbanization, and increasing demographic change with smaller families, the pattern of life is
undergoing rapid change. Adult members are increasingly forced to migrate to urban areas in
2
search of livelihood. These changes are having direct impact on the health care needs of the
elderly.
Mental health in the elderly
The geriatric population is affected by the same psychiatric disorders as younger adults
however Dementia and Delirium have greater prevalence in comparison (3, 4). Depression is
the leading cause of disability when measured as Years Lost to Disability (YLD) and the
fourth leading contributor to the global burden of disease when assessed as Disability
Adjusted Life Years (DALYs). By year 2020 Depression is projected to reach the second
place in the ranking of DALYs calculated for all ages and for both sexes (5).
The lifetime incidence of depression is 26.9% for men and 45.2% for women in people up to
70 years of age (6). The prevalence of depression in the total population is generally
estimated at 5-8%. In elderly people (usually 65 years old and older), the prevalence is
generally estimated at 12-15%. The prevalence is even more higher in elderly who seek out-
patient care ranging from 18% to 36% (7).
The prevalence of Major Depressive Disorder in individuals more than 65 years was
estimated to be 1.4% in women and 0.4% in men with over all prevalence of 1% (8). A
recent study (9) also report higher prevalence rates in women -12.4% vs. 7.8% in men
however this gender gap becomes narrower in the ―oldest old‖ (10). The prevalence of sub-
syndromal depression in the elderly population in East Asia is about 8-9% (11). Other
epidemiological studies have reported prevalence rates ranging from 1%- 5% (10, 12).
The low percentages of prevalence rates in many epidemiological studies are believed to be
underestimations because of the difficulties in detecting depression in elderly. Patients and
care givers may wrongly attribute it to the ageing process and identifying the symptoms
3
when they coexist with medical illness may need skilful observation by the physician. It has
been noted that older people tend to report more physical complaints and under report
depressed mood making it difficult to use the established diagnostic criteria for the depressed
in the elderly. Very often they have combination of mild depression symptoms, ―non-
dysphoric‖ depression, dysthymia, persistent dysphoria associated with anxiety, pain in
multiple areas etc. Prevalence percentages can also vary because of population studied,
sample size, definition of depression, and method of diagnosis.
Geriatric depression in India.
In the Indian setting studies report higher prevalence rates for depression in comparison to
studies from the west. A community survey in the year 1976 (n= 1060, all age groups)
reported that the incidence of mental health disorders in the people above 60 years was
higher (75/ 1000) compared to younger age groups (13). A study done later by the same
authors in 1997 which was also a community survey of people over 60 years (n=183)
reported the prevalence of total mental morbidity as 612/1000 and depression as 522/1000
population. Depression was the most common mental disorder in this study (14). A
community survey of people more than 50 years (n= 408) in South India found that
psychiatric disorders were present in 35% (350/1000)of the elderly population out of which
the prevalence of depression was found to be much higher than any other psychiatric
disorder- 59% of the diseased (15).Another study put the prevalence rate of mental illness
at 89/1000 with depressive illness accounting for 67% of mental disease burden in a
community sample of 686 elderly (16). In a study conducted in rural population in northern
India the prevalence rate of psychiatric morbidity was 43.3% and the commonest diagnosis
was neurotic depression, Manic Depressive Psychosis (MDP) depression, and anxiety state
4
in descending order of frequency (17). A recent study from Mumbai has indicated that the
point prevalence of depressive symptoms in more than 60 years elderly is 45.9% (18).
Geriatric Depression- Characteristics
Geriatric Depression may represent a heterogeneous group of disorders that differ in
etiology, pathophysiology and prognosis, some of which may be distinct from the depressive
disorder experienced by younger adults. One example of heterogeneity is the distinction
between the late life patient with Recurrent Depressive Disorder (RDD) with onset of first
episode early in life (Early Onset Depression– EOD) and the older patient with onset of
major depressive illness after age of 50 years (Late Onset Depression– LOD).
Comparison of Late Onset Depression (LOD) and Early Onset Depression (EOD).
Patients with LOD have lower family history of depression and greater magnetic resonance
imaging abnormalities (MRI) abnormalities compatible with ischemic cerebrovascular
disease (19, 20). Vascular Factors (Hypertension, Coronary Vascular Accident, Ischemic
Heart Disease and Diabetes Mellitus) were found to increase the risk of depression in the
LOD (21-26).
In a study (unpublished thesis) it was seen that patients with LOD had more impairment in
executive functions indicating a frontal lobe involvement when compared with EOD (27) .
LOD was also seen to be associated with more neurological soft signs and cognitive deficits
than EOD. The increased association of cognitive impairment with LOD supports an
underlying organic origin (23,28) and LOD may be a possible fore runner for Alzheimer‘s
dementia (8,29).
Based on phenomenology EOD is understood to be associated with more feelings of guilt
(30, 31) and psychotic symptoms (32). It is also associated with more agitation and anxiety
5
symptoms while LOD on the other hand is associated with more somatic complaints (33).
Apathy is more prominent in LOD than in EOD (31). However some studies did not find any
difference in phenomenology between the two types (34). An Indian study reported a trend
to increased agitation and restlessness rather than retardation in the depressed elderly when
compared with younger adults(16).
The higher family history of affective disorders in EOD compared to LOD might indicate a
greater importance of genetic factors in EOD (32,33,35-38). LOD is associated with greater
life stressors and has greater chance of becoming chronic rather than recurrent (39).Two
different etiological pathways are also proposed for LOD -one through the experience of
severe life stressors and the other through biological changes in the brain (40).
In a community based longitudinal study (41) which compared women with LOD, EOD and
No MDD( Major Depressive Disorder), no difference between groups was found on marital
conflict and social support. Those with EOD scored higher than those in the LOD and No
MDD groups on neuroticism. Those with LOD reported poorer health than those with No
MDD at 10 years prior to diagnosis. The authors suggested that poor health and not
psychosocial risk factors or neuroticism predispose otherwise healthy adults to developing
depression for the first time in late-life. An earlier Indian study (42) also reported that
physical disabilities had significant association with LOD and it limits the movement of the
subject and in combination with environmental conditions lead on to a feeling of loneliness
and depression.
However conceptually the critical question remains as to whether these differences result
primarily from age associated physiological changes and a high prevalence of co-morbid
medical conditions (differences in young vs. old patients) or whether late life depression is a
disease entity distinct in its presentation, etiology, course and treatment response from
6
illness affecting the younger adults (difference in EOD vs. LOD). LOD is also being
increasingly considered as a life style disease especially because of its close association with
vascular diseases for which lifestyle influences have been strongly demonstrated. Research
by various groups internationally is active in this field and this study is being planned to
explore the same in an Indian setting.
7
REVIEW OF LITERATURE
The Concept of Life-Style
The simple sociological definition of lifestyle is ―the way a person lives‖.It includes aspects
like consumption, entertainment, diet, social interactions and so on. It can be summarised as
a conscious or unconscious choice of one set of behaviour over another. Lifestyles can be
used for making broad social classifications based upon income and occupation, spiritual and
religious preferences, traditional vs. modern, rural vs. urban etc.
Lifestyle diseases also refered to as diseases of longevity are defined as diseases that develop
as people live longer. This came from the realization that living long was good but the
quality of life was also important. Changes in diet, lifestyle and environment are thought be
behind the genesis of these disorders which affects quality of life in old age. Commonly
referred life style disorders are Diabetes Mellitus, Hypertension, Heart disease, Stroke,
Cancer, Osteoporosis, Cirrhosis and so on. Recent studies indicate that Dementia and other
late onset psychiatric disorders like depression can also result secondary to lifestyle factors.
These diseases directly influence morbidity and mortality in late life. The pattern of life style
diseases is that they develop as degenerative process which has insidious onset, take many
years to manifest and is difficult to cure. Depression however does not easily fit this pattern
as its course can be self limiting with recurrence in episodic pattern although there is a
tendency for chronicity in geriatric depression (39).But the fact that it can cause severe
morbidity and disability is not widely known .
Evidence for life-style diseases
The existance of lifesyle diseases is exemplified by the differential incidence of diseases in
different nations and cultures. The differential incidence of cancer between the western
countries and the developing countries is linked to the difference in dietary pattern and
8
physical activity (43). This study further adds weight to the said hypothesis by finding that
the incidence of cancer takes on that of the host nation in people who migrate to it thus
indicating that environmental factors are important determining risk factor rather than
genetic factors for accounting for international variation in cancer incidence.
This implies that modifiable evironmental factors can be put to advantage to reduce the
incidence of these lifestyle diseases and therefore has enormous importance in a public
health perspective. Studies have proven benefits of such interventions in various physical
illnesses like in cardiovascular diseases, stroke and more recently in cognitive impairment
(44,45).
Life style and health outcomes
The life style factors that have been found to influence genesis of physical illnesses are also
plausibly thought to influence genesis of psychiatric illness. It appears logically possible
especially in late life psychiatric illness like LOD and Dementia because of the increasing
evidence of association of vascular causes with both of them.
This area is being extensively researched by researches having affiliation to diverse
disciplines. Many aspects of lifestyle are being looked into by these researchers and their
approach has also been influenced by their disciplinary allegiance.
The Alameda country study is a land mark study of a community cohort followed up from
1965 to 1999 (46). A study published from this cohort (47) examined the relationship
between physical health status and health practices. They looked at hours of sleeping in the
night, regularity of meals, physical activity, alcohol consumption, and smoking. They found
that sleeping 7-8 hours per night, eating regular meals, participating in regular exercise,
limiting alcohol consumption, and not smoking were highly correlated with healthier
9
individuals. This study provided initial empirical support for the link between lifestyle and
health outcomes.
A 5.5 years follow up study (48) used the same parameters and additional ones of weight
and BMI to study the relationship of lifestyle to mortality. It was found that those who ate
regular meals including breakfast, received adequate sleep (7–8 hours), maintained healthy
weight for their height, did not smoke, limited alcohol consumption, and participated in
regular physical activity lived longer than those who did not practice these behaviors.
However more recent studies did not find the relationship of not eating breakfast and
snacking between meals to be associated with adverse health outcomes as previously noted.
These health habits classified as ―good‖ became a standard and were investigated in many
more studies looking at its relation to health outcomes including depression. It was found
that depression prevalence rates were higher for six of the seven ―poor‖ health habits
examined compared with the ―good‖ health habits (49). Multivariate regression analyses
done in this study showed that a simple sum of the total number of good habits to be a
significant independent predictor of depression after controlling for prior depression and
various socio-demographic factors.
Studies which have defined lifestyle as socio economic status and education have found
increased depression to be associated with low income, low socio economic status and low
education (50). Socio economic ststus and education can directly as well as indirectly
mediate dietary patterns via influencing the availability, pattern of use of food and so on.
Life style factors
This study from a mental health perspective looks into five life style factors that could be
influencing LOD by looking at a cross sectional population with depression as defined on
conventional scale.
10
Lifestyle factors that would be addressed in the present study are
1. Diet,
2. Exercise/physical activity,
3. Leisure activities including hobbies
4. Social interactions or Socialization.
5. Recreational alcohol use and tobacco use.
Review of literature focusses on studies that have studied the above mentioned five factors.
Interventional studies that look at change in depressive symptoms after its onset have been
omitted as the current study focusses only on lifestyle factors that might influence genesis of
depression in the elderly.
[I] DIET
The influence of one‘s diet on health is widely recognized in oriental culture from ancient
times. Traditional medical systems have laid a lot of importance to dietary advice not only
during time of illness but also in the healthy state. In modern medicine the importance of diet
on one‘s health is being increasingly recognized. Although the influence of dietary habits
and nutrition on physical illness is widely appreciated its influence on mental well being or
illness is not known to many (51).
Dietary pattern in general and deficiency of various nutrients like vitamins, minerals, and
omega-3 fatty acids have been implicated in genesis of depressive symptoms in various
studies. Epidemiological, co-relational studies and recent experimental studies find influence
of various nutritive factors in depression. Some of these studies are reviewed below.
11
Diet and General Nutrition
A population based study investigated social and lifestyle factors that influence depression,
anxiety disorders, sleep disorders and quality of life in men and women (age 18- 90yrs) (52).
The authors found that the prevalence of depression was more in women and it was
associated with self evaluation of nutrition as ―poor‖, low food intake and low paid jobs.
Depression was also associated with smoking, alcohol abuse and dependence. Depression
was also positively associated with vascular and gastro intestinal diseases.
In a community sample of 267 male and female it was concluded that nutritional deficit and
depression were associated after controlling for educational status, socio economic status
and smoking (53).
As found in the above mentioned studies malnutrition in general have been implicated to be
associated with depression due to decreased appetite (54). However healthy elderly are also
reported to loose weight when followed up over long period (55). Surprisingly evidence
from elderly without mental illness seem to suggest a protective effect for obesity on
depression (56). In a sample of 2406 men and women aged 70-79 years followed up after 3
years it was found that depressed mood at baseline predicted weight gain after 3 years. Also
weight loss over three years predicted depressed mood at end of the three years. The authors
attribute this effect to probable deterioration in general health associated with advancing age
(57). In fact research on the association of obesity (as measured as Body Mass Index (BMI))
and depression has produced conflicting results (58) and more studies are reporting a
protective effect of obesity for depression in elderly called popularly as the ―Jolly Fat‖
hypothesis (59, 60). In contrast other studies have reported a positive association of obesity
with depression. This can be mediated by a co-morbid metabolic syndrome (61) and also
indirectly by reduced health related quality of life from a sedentary life style (62). The
12
relationship remains unclear with many studies reporting lack of association between
depression and obesity (63).
Depression and Nutrients
The association of vascular nutritional risk factors and depression in an elderly cohort of
depression (n=196, age more than 60 years) in comparison with non depressed subjects was
studied. It was found that the depression group had higher intake of saturated fat and
cholesterol, higher body mass indices, lower alcohol intake, and higher Keys score (a
measure of the serum cholesterol-raising capacity of the diet) than the comparison group
(64). After controlling for variables like age, sex, education, race, and medical co-morbidity,
associations persisted for cholesterol, alcohol, and Keys score. Depression was found to be
positively associated with overall dietary pattern as defined by total kilocalories, saturated
fat, cholesterol, Body Mass Index, polyunsaturated fat, Sodium intake, and alcohol intake.
The study concluded that the dietary pattern considered as risk factors for vascular illness
differed between depressed and non depressed group.
Mediterranean Dietary Pattern which contains an adequate intake of fruits, nuts, vegetables,
cereals, legumes or fish ensures adequate levels of vitamin B12 and Folate have been
postulated to influence depression in various studies. In a large cohort study it was
investigated both cross-sectionally and longitudinally (65, 66). In the initial cross sectional
analysis (n= 9670) it was found that Folate intake was inversely associated with depression
prevalence among men, Vitamin B12 intake was inversely associated with depression in
women. No significant association was observed for omega-3 fatty acids intake. The
participants were reassessed after 5 years (mean follow up- 4.4 years, n= 10,094) for their
adherence to Mediterranean diet and depressive symptoms. It was found that 480 new cases
of depression were noted and adherence to Mediterranean diet was found to be protective.
13
Dose-response relationships were found inversely related to fruit and nuts intake,
monounsaturated to saturated-fatty-acids ratio, and legumes.
A prospective epidemiological cohort study followed up elderly subjects (n= 610) for 6 years
to look at the influence of dietary lipids on geriatric depression scale score (GDS) (67). In
multivariate linear regression analysis, GDS score was found to be negatively associated
with dietary intake of monounsaturated lipids (MUFA) and their main source -olive oil. GDS
score was positively associated with intake of polyunsaturated lipids (PUFA) derived from
one of the principal dietary source -seed oils. Intake of calories, total lipids, fish and seafood
or saturated lipids was not found to be associated with variation in GDS score by this group.
Depression and Consumption of Fish
Other studies have found a negative correlation between Depression and fish consumption.
A cross-sectional study with a sample of 3204 adults has found this correlation (68). In a
study which compared between the national estimate of fish consumption pattern and
prevalence of depression it was found that they were negatively associated (69). However
both the methodological aspects of this study and the tendency in general to impute dietary
explanations to any health condition has been critiqued (70).
A study assessed the serum levels of fatty acids in a community based sample of elderly
more than 60 years (71). Subjects with depressive disorders had a higher ratio of n-6 to n-3
poly unsaturated fatty acids (PUFAs) compared to healthy subjects. But difference in
individual PUFAs between the groups was small. The study controlled for potential
confounders like atherosclerosis, inflammation etc.
In a prospective study there was no association of diet-related factors with late-life
depression in a cohort of elderly men (n= 526; age 70 -89 years) (72). However a negative
relation between physical activity, moderate alcohol consumption and decline in serum
14
cholesterol level during the study period with depression was noted. The authors concluded
that physical activity and moderate alcohol consumption may be protective in ―old-old‖ men.
The study also found that a decline in serum cholesterol level may predict development of
late-life depression. An earlier review (73) has discussed this issue by looking at studies
which had similar finding and also those contesting it. They postulated that this inverse
relation between cholesterol levels and depression could be mediated by another variable in
the diet i.e. the reduced intake of dietary omega-3 poly unsaturated fatty acid (PUFA). This
has probably resulted out of the increasing proportion of omega-6 to omega-3 PUFA in the
diet over the years due to the changing dietary pattern. The inverse association between
consumption of fish and depression was further explored as to whether it was mediated
directly or indirectly (50) . Post hoc analysis of data from a large cohort study (n=10,602
men age, 50- 59 yrs) via regression analysis found that depressed mood was associated with
fish intake both directly, and also indirectly as part of other factors in the diet and also as
part of a lifestyle that was associated with depression.
General Dietary Pattern and Depression
The above studies and many other studies have looked more on the nutrients that influence
mood states and also how supplementation of these could alter health states (not discussed in
this review). A few recent studies have also look at it in a macro level i.e. quality of dietary
patterns. Food frequency questionnaires were used to gather information about diet which
were scored based on perceived quality. A study in an elderly cohort (mean age =55.6yrs)
investigated the influence of ‗whole food‘ (heavily loaded by vegetables, fruits and fish)
and
‗processed food‘ (heavily loaded by sweetened desserts, fried food, processed meat, refined
grains and high-fat dairy products) on score on standard depression scale as outcome
measure (74). The participants in the highest tertile of the whole food pattern had lower odds
15
of depression than those in the lowest tertile. High consumption
of processed food was
associated with increased odds of depression. This study concluded that whole food pattern
may be protective for depression.
Mental health outcomes in women aged 20- 93 years using similar categories in the form of
"traditional" dietary pattern ( vegetables, fruit, meat, fish, and whole grains), "western" diet
(processed or fried foods, refined grains, sugary products, and beer) and ―modern food‖
(fruits, salads, fish, tofu, beans, nuts, yogurt, red wine) were studied. It was found that
traditional dietary pattern was associated with reduced odds for depression and dysthymia.
The authors concluded that the habitual diet quality and the prevalence of mental disorders
were associated (75) .
The deficiency of omega 3 fatty acid and vitamin B12 causes impaired mood state.
Vegetarian diet has deficiency of these nutrients. 60 vegetarians were compared to 78
omnivores. It was found that vegetarians reported significantly less negative emotion than
omnivores. The authors concluded that the vegetarian diet profile does not appear to
adversely affect mood despite low intake of long-chain omega-3 fatty acids (76).
Various review articles have also summarized the research findings in this area of diet and
depression The various mechanisms of low fatty acids influencing depression like
influencing the structure of brain and modification of fluidity of neuronal cell membranes
have been comprehensively discussed in one of the review article (77). Another review has
looked at risk factors for depression along with other aspects. It reports that depression is
related to low serum Folate and vitamin B12 levels and increased serum Homocysteine
levels (11). As the evidence from randomized controlled trials (RCT) for the effect of B
vitamins and n-3 PUFAs is modest it was suggested that larger RCTs and meta-analysis
needs be done to better understand its effect (56). A better way to throw light on the
16
causality of dietary factors on mood and cognitive function would be to include them as
outcome measure in studies that look at effect of dietary patterns as markers of physical
health (78).

17
(Table -1a) Cross-sectional Studies on Diet and Depression*
Author, Year Place,
sample Age (yrs) Design Scales,
Diagnostic
criteria
Results
Tiemeier et al, 2003.
Rotterdam
study.(71)
Netherlands, 264 M&F
>60 Community, Cross-
sectional
CES, PSE- 10,DSM IV
diagnosis of
depression
Blood fatty acid composition related
to depression.
Averina et al,
2005. (52)
Russia
1968 M
&1737 F
18-90 Population
based cross-
sectional
AUDIT, QOL
& Depression
scales.
Depression
positively
associated with poor nutrition, low SES,
adverse health
behaviours (alcohol use smoking).
Sánchez-
Villegas et
al, 2006. SUN cohort.
(66)
Spain,
9670 M&F
University
graduates
Cross-
sectional
FFQ, Physician
diagnosis of
Depression.
B12 intake in
women & Folate in
men inversely associated to
depression; omega-
3 fatty acid intake not related.
Payne et al,
2006. (64)
US,
196. M&F
> 60 Cross-
sectional
FFQ, Keys
score
Depression group
had higher intake of
saturated fat, cholesterol, higher
BMI, lower alcohol
intake, and higher Keys score.
Appleton et al, 2007.
PRIME
cohort data.
(50)
Northern Ireland,
France
10,602 M
50- 59 Cross sectional
data from a
cohort study
Welsh Pure subscale for
Depression
from MMPI;
FFQ
Negative association of
depression with
dietary fish both
direct and indirect via associated life
style.
Cabrera et al, 2007. (53)
Brazil 267 M&F
>60 Community, Cross
sectional
GDS, Mini nutritional
assessment.
Depression is associated with
nutritional deficit.
*M- Men, F- women, SES- Socio Economic Status, BMI- Body Mass Index, CES-D - Centre for
Epidemiologic Studies Depression scale, PSE-10- Present State Examination, DSM-IV- Diagnostic and
statistical Manual of mental disorders edition IV, AUDIT- Alcohol Use Disorders Identification Test , QOL-
Quality Of Life, FFQ- Food Frequency Questionnaire, GDS- Geriatric Depression Scale, MMPI- The
Minnesota Multiphasic Personality Inventory. Keys score (a measure of the serum cholesterol-raising capacity of the diet)
18
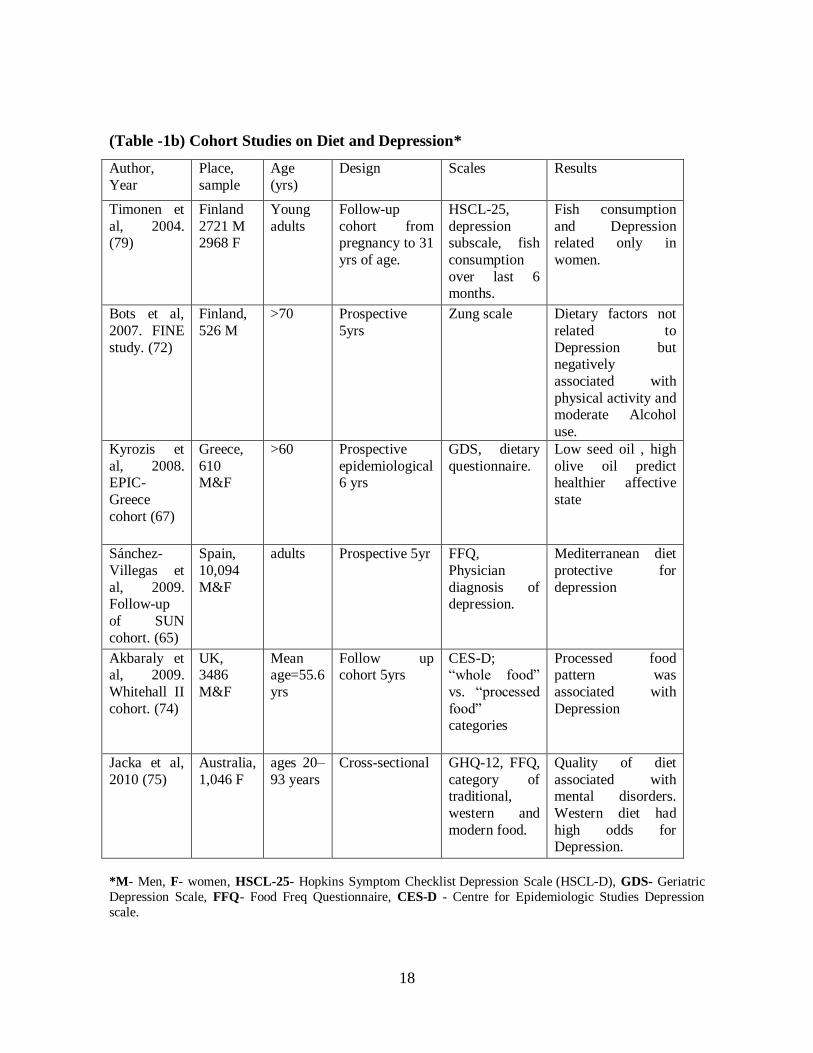
(Table -1b) Cohort Studies on Diet and Depression*
Author,
Year
Place,
sample
Age
(yrs)
Design Scales Results
Timonen et
al, 2004. (79)
Finland
2721 M 2968 F
Young
adults
Follow-up
cohort from pregnancy to 31
yrs of age.
HSCL-25,
depression subscale, fish
consumption
over last 6 months.
Fish consumption
and Depression related only in
women.
Bots et al,
2007. FINE
study. (72)
Finland,
526 M
>70 Prospective
5yrs
Zung scale Dietary factors not
related to
Depression but negatively
associated with
physical activity and moderate Alcohol
use.
Kyrozis et
al, 2008. EPIC-
Greece
cohort (67)
Greece,
610 M&F
>60 Prospective
epidemiological 6 yrs
GDS, dietary
questionnaire.
Low seed oil , high
olive oil predict healthier affective
state
Sánchez-
Villegas et
al, 2009. Follow-up
of SUN
cohort. (65)
Spain,
10,094
M&F
adults Prospective 5yr FFQ,
Physician
diagnosis of depression.
Mediterranean diet
protective for
depression
Akbaraly et al, 2009.
Whitehall II
cohort. (74)
UK, 3486
M&F
Mean age=55.6
yrs
Follow up cohort 5yrs
CES-D; ―whole food‖
vs. ―processed
food‖ categories
Processed food pattern was
associated with
Depression
Jacka et al,
2010 (75)
Australia,
1,046 F
ages 20–
93 years
Cross-sectional GHQ-12, FFQ,
category of traditional,
western and
modern food.
Quality of diet
associated with mental disorders.
Western diet had
high odds for Depression.
*M- Men, F- women, HSCL-25- Hopkins Symptom Checklist Depression Scale (HSCL-D), GDS- Geriatric
Depression Scale, FFQ- Food Freq Questionnaire, CES-D - Centre for Epidemiologic Studies Depression
scale.
19
[II] PHYSICAL ACTIVITY/ EXERCISE
Physical activity is beneficial in people who are well and also on people who are unwell.
Disease outcomes that have been found to be inversely related to regular physical activity in
prospective observational studies are cardiovascular disease, thromboembolic stroke,
Hypertension, Type 2 Diabetes Mellitus, Osteoporosis, Obesity, colon cancer, breast cancer,
anxiety and depression (80). More and more of such evidence are available in recent times
especially in relation to cognitive function (81,82). However there is lack of randomized
controlled design to substantiate these findings though this evidence is considered in the
same league as the evidence in other health related behaviors and outcomes like smoking,
saturated fat intake and coronary heart diseases. Public health interventions have been
initiated in terms of lifestyle alteration in these life style diseases without need for
demonstrating the relation through randomized control trials.
The American Heart Association in 2007 has updated its original recommendation (in 1995)
about physical activity for the general public including elderly. It has stated the specific
nature, type and frequency to be followed for better physical health.
The mechanisms mediating such benefits especially the antidepressant effect which is the
focus of this review have been hypothesized; namely, a) psychological mechanisms like
increased feelings of self-efficacy, b) self perceptions of control and mastery c) reduced
physiologic responses to stress, d) and beneficial effects on neurotransmitters such as
increased serotonin and endorphins (83). Exercise and diet are also believed to mitigate the
adverse effect of stress and ageing on the functioning of neurotrophic factors (84).
The following studies are reviewed in detail.
20
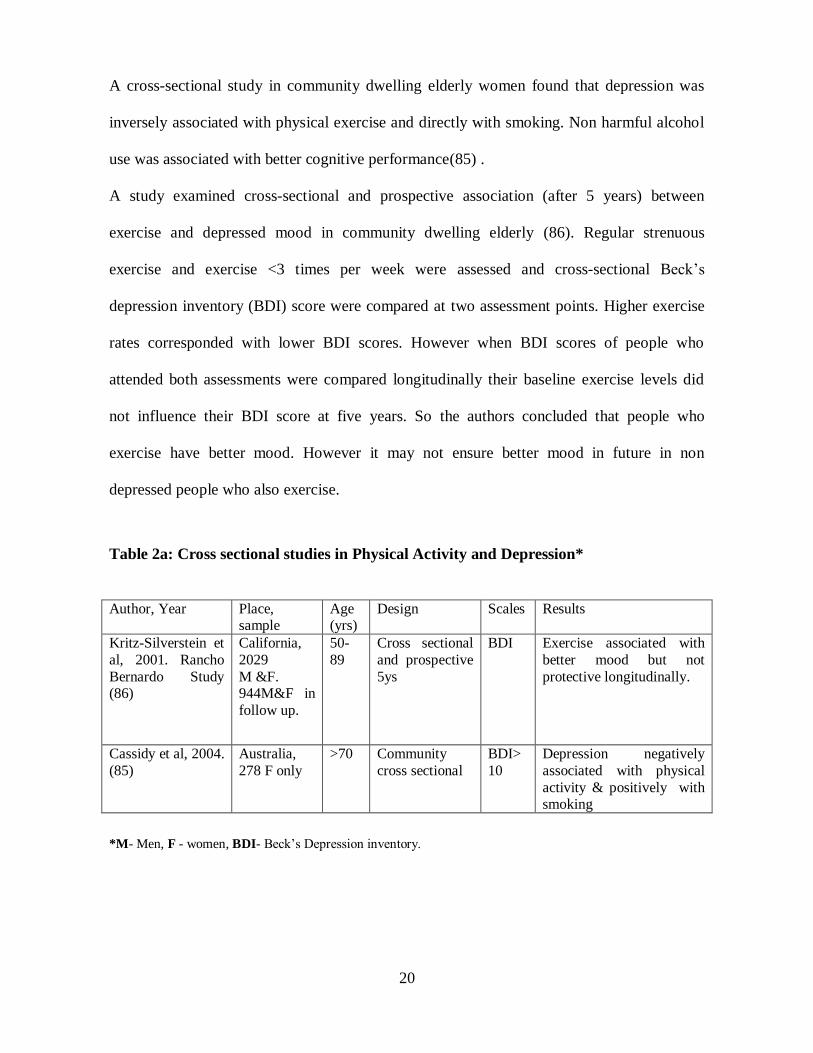
A cross-sectional study in community dwelling elderly women found that depression was
inversely associated with physical exercise and directly with smoking. Non harmful alcohol
use was associated with better cognitive performance(85) .
A study examined cross-sectional and prospective association (after 5 years) between
exercise and depressed mood in community dwelling elderly (86). Regular strenuous
exercise and exercise <3 times per week were assessed and cross-sectional Beck‘s
depression inventory (BDI) score were compared at two assessment points. Higher exercise
rates corresponded with lower BDI scores. However when BDI scores of people who
attended both assessments were compared longitudinally their baseline exercise levels did
not influence their BDI score at five years. So the authors concluded that people who
exercise have better mood. However it may not ensure better mood in future in non
depressed people who also exercise.
Table 2a: Cross sectional studies in Physical Activity and Depression*
Author, Year Place, sample
Age (yrs)
Design Scales Results
Kritz-Silverstein et
al, 2001. Rancho
Bernardo Study (86)
California,
2029
M &F. 944M&F in
follow up.
50-
89
Cross sectional
and prospective
5ys
BDI Exercise associated with
better mood but not
protective longitudinally.
Cassidy et al, 2004.
(85)
Australia,
278 F only
>70 Community
cross sectional
BDI>
10
Depression negatively
associated with physical
activity & positively with smoking
*M- Men, F - women, BDI- Beck‘s Depression inventory.
21
Table 2b: Cohort studies in Physical Activity and Depression*
Author, Year place, sample
Age (yrs)
Design Scales Results
Camacho et al,
1991. Alameda
country study (87)
Californi
a,
M&F
Adults Longitudinal
cohort 20yrs
- High physical activity
related to less
depression
Strawbridge et
al, 2002. Alameda
country study
(88)
Californi
a , 1947
M&F
>50 Longitudinal,
cohort 5ys
DSM-IV
diagnosis of depression,
physical activity
scale
Physical activity
protective for depression
Frederick et al, 2004. (49)
Los Angeles,
752
M&F
adults Community longitudinal
screening
CES-D; Life style habits
Depression was associated with 6 out
of 7 poor habits.
Brown et al, 2005. (89)
Australia, 9207 F
Middle aged
Prospective cohort ,5ys
CESD-10, Mental health [MH]
subscale of the
Short Form 36 survey
Association between increasing physical
activity and decreasing
depressive symptoms
Wiles et al, 2006. Caerphilly
study (90)
UK, 1158 M
45- 69 Cohort: at 5yr and 10 yr
follow up
GHQ, Minnesota leisure time
physical activity
questionnaire
Heavy intensity leisure time activity
associated with less
odds of Depression, the effect persisted at
5ys but not at 10yrs.
Wise et al, 2006.
Black Women‘s‘ health study (91)
Boston,
US 35,224 F
21- 69 Cohort follow
up after 2yr, 4ys.
CES-D Leisure time physical
activity had reduced odds for depression.
Bots et al, 2008.
FINE study. (72)
Finland,
526 M
>70 Prospective
5yrs
Zung scale Less Depression with
physical activity and moderate alcohol use.
Dietary factors not
related.
Ku et al, 2009. (92)
Taiwan, 3778
M&F
>50 Cohort 7yr follow up
CED- D Leisure time physical activity has reduced
risk for depression.
Heesh et al,
2010. (93)
Australia,
6653 F
73- 78 Community
longitudinal
screening
GADS, Leisure
Time Physical
Activity scale(LTPA)
Depressive symptoms
on GADS score were
negatively correlated with LTPA scores.
*M- Men, F- women, CES-D - Centre for Epidemiologic Studies Depression scale, DSM-IV- Diagnostic and
statistical Manual of mental disorders edition IV, GHQ- General Health Questionnaire, GADS- Generalized
Anxiety Disorder [GAD]scale
22
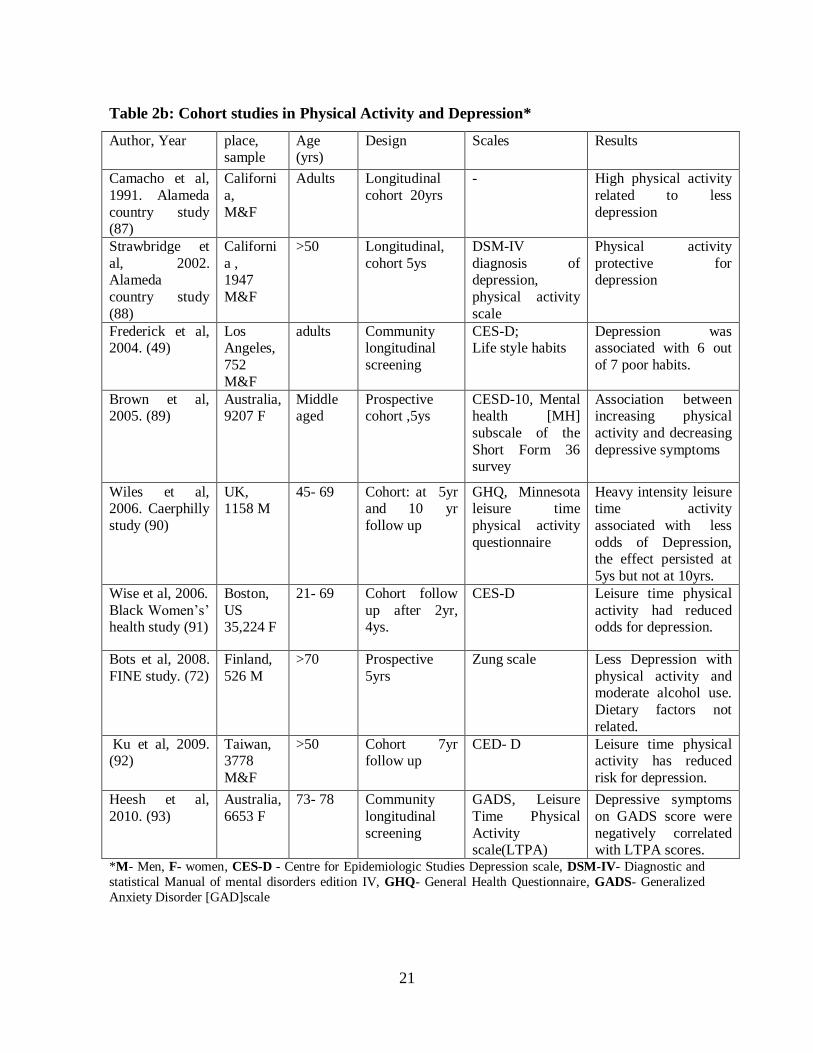
The studies that have looked at mental health outcomes from a longitudinal cohort have
found that that men and women with low activity levels at baseline were at a significantly
greater risk for depression at the 20-year follow-up than those who reported high activity
levels (87). The relationship between physical activity and depression in older adults (50 to
94 years) was studied after adjusting for age, sex, ethnicity, socio-economic status, chronic
conditions, disability, body mass index, alcohol consumption, smoking, and social relations.
It was found that physical activity was protective for both prevalent and incident depression
(88). Similar inverse relation between depression and physical activity has been previously
discussed (72). A dose response relationship between self-reported Physical activity (PA)
and depressive symptoms in cross sectional analysis was investigated by a prospective
assessment in community dwelling middle aged women. Mailed questionnaire included
questions about time spent in walking, moderate- and vigorous-intensity PA. Mean
depression scores decreased with increasing levels of previous, current, and habitual activity
(89).
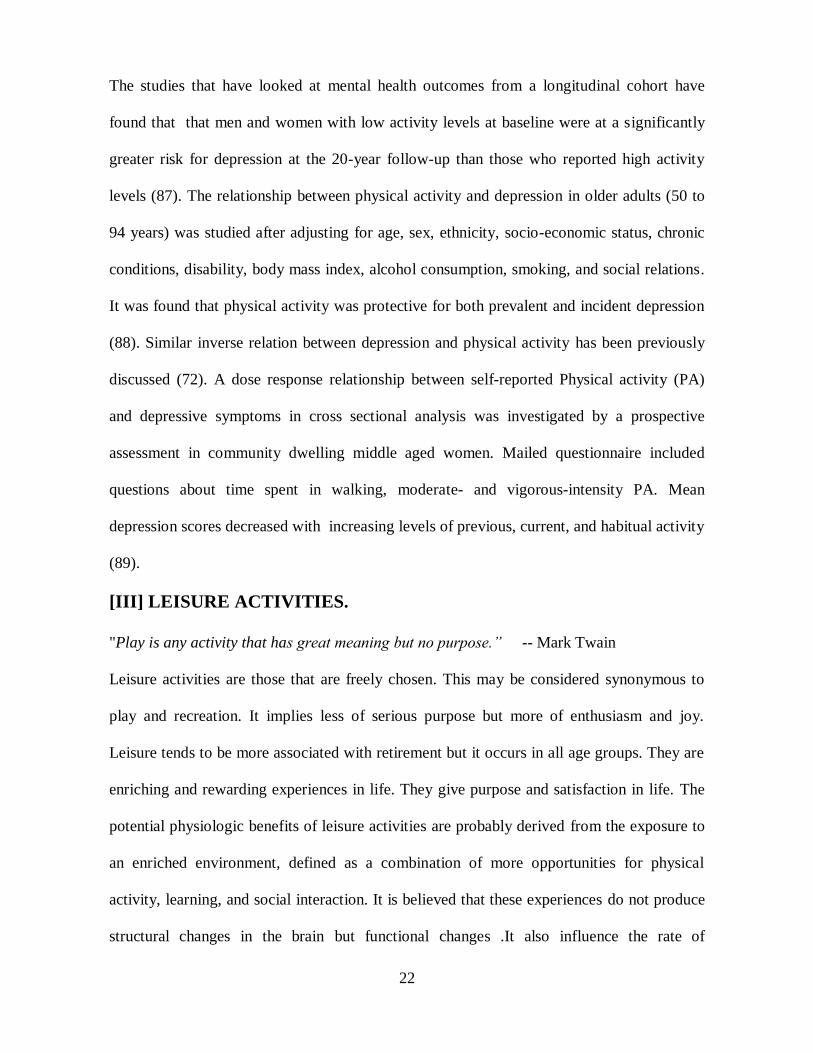
[III] LEISURE ACTIVITIES.
"Play is any activity that has great meaning but no purpose.” -- Mark Twain
Leisure activities are those that are freely chosen. This may be considered synonymous to
play and recreation. It implies less of serious purpose but more of enthusiasm and joy.
Leisure tends to be more associated with retirement but it occurs in all age groups. They are
enriching and rewarding experiences in life. They give purpose and satisfaction in life. The
potential physiologic benefits of leisure activities are probably derived from the exposure to
an enriched environment, defined as a combination of more opportunities for physical
activity, learning, and social interaction. It is believed that these experiences do not produce
structural changes in the brain but functional changes .It also influence the rate of
23
neurogenesis in adult and senescent animal models. Various aspects of leisure activities
have been extensively studied especially their protective effect in cognitive decline and
dementia (94) . Leisure activities may be generally divided into ingredients of social,
physical and mental (intellectual) spheres. The differential effects of these components are
well studied in literature pertaining to cognitive decline and dementia. However in studies
looking at depression it appears that only the physical aspects of leisure have been
considered.
Social and productive activities that involve little or no enhancement of fitness have the
ability to lower the risk of all cause mortality as much as fitness activities do (95). It is
believed that in addition to increased cardiopulmonary fitness, leisure activity may confer
survival benefits through psychosocial pathways.
.
The following studies have been reviewed in detail.
A cohort study found that engaging in little or no recreational activity was associated with
twofold increased odds of incident depression after 8 years in women. But no such increase
was seen in men (96).
Other epidemiological studies have however approached physical activities as part of leisure
in general. The differential influence of leisure time physical activity and occupational
physical activity with common mental disorders (CMD) as outcome in men (age 45-69) was
studied by assessing the total leisure-time activity and percentage of time spent in heavy-
intensity activity from self-reports. The leisure time physical activity was intensity scored as
light, moderate and heavy. The energy expenditure was also calculated. Men were classified
into four classes of occupational activity from least active to most active. The study found
that those who participated in any heavy-intensity leisure-time activity had reduced odds of
24
common mental disorders (CMD) 5 years later. There was little evidence that men in the
most physically demanding jobs had reduced odds of CMD after 5 years. There was no
association between physical activity and CMD at 10 year follow up (90).
Women living in the community (n=35,224, aged 21 to 69) were assessed for past and
current exercise levels at baseline. They were followed up after 2years using mailed
questionnaire. It was found that adult vigorous physical activity during leisure time was
inversely associated with depressive symptoms (91). Women who reported vigorous exercise
both in high school (≥ 5 hr per week) and adulthood (≥ 2 hr per week) had the lowest odds of
depressive symptoms relative to women who had never been physically active. Walking as
an exercise negatively affected depression symptom onset only in women having BMI > 30.
A similar study using mailed questionnaire in a community dwelling elderly women (age 73
-78 yrs) found beneficial effect of walking (93). They were assessed on their weekly minutes
of walking, moderate leisure time physical activity (LTPA) and vigorous LTPA. Association
between five levels of LTPA (none, very low, low, intermediate and high) and depression
and anxiety scores were calculated. Inverse dose–response associations were
observed between both LTPA/walking and depression
scores in concurrent and prospective models. The results supported an inverse dose–response
association between both LTPA /walking and mental health.
Another study also found that low leisure time activity was associated with greater risk of
developing depressive symptoms (92).
A Review article while looking into the relation between physical activity and mood has
evaluated the possible mechanisms that mediate it (97). The authors have dealt with
psychological theories like distraction, self efficacy, social interaction and physiological
theories that link positive mood changes to monoamine and endorphin levels. The authors
25
after a systematic review of 87 studies concluded that moderate exercise elevates mood
while heavy exercise can in fact deteriorate mood. A review article looks into basic and
clinical studies that lead to a neurotrophic hypothesis of depression according to which
stress and depression reduce neurotrophic factors and neuronal development (84).
Neurogenesis is progressively reduced in aging and could potentially put the individual at
risk for depression. Author inferred that the exercise and diet modulate antidepressant action
via positively influencing neurotrophic factors especially in the hippocampus.
All studies mentioned in this review looking at physical activity have focused on how
physical activity directly influences health outcome. Some recent research looks specifically
at the mediating variable like genetic diathesis that influence exercise behavior and health
outcome. In a twin study (98) the twin who exercised more did not display fewer anxious
and depressive symptoms than the co-twin who exercised less. The authors conclude that the
association between regular exercise and reduced depression in population at large is not due
to causal effect of exercise, but in toto a common genetic vulnerability to lack of regular
exercise and risk for anxiety and depression.
[IV] SOCIALIZATION
Social participation which is an important psychological resource is beneficial in all age
groups Studies have found that involving in social and productive activities can reduce
mortality in the elderly similar to physical activities (99). It is hypothesised that if benefits
from physical activities is due to better cardiopulmonary function, then social activities may
confer survival benefits through psychosocial pathways (95). Better health benefits in people
who do exercise have also been attributed to associated social interaction that occurs during
the process.
26
The following studies have been examined in detail.
A community level cross-sectional survey of life-style used 16 items selected from the four
factors of economic situation, physical health, social activity, and personal status(100). The
study also investigated life satisfaction, morale, and physical function and it was found that
the factors significantly related to depression in community dwelling elderly were the
number of friends and morale. An increase in the number of friends was related to a decrease
in depression. Depression in the ―old-old‖ elderly was more significantly related to many
lifestyle items compared with the ―young-old‖ elderly. The extent of influence of
socialization on depression was found more in the old-old.
Another study looked at depression in both community-dwelling and institutionalized elderly
(101). In the community study it was noted that ability to do activities of daily living and
social activities were protective for depression. In the institutionalized elderly loneliness and
poor perception of general health predicted depression. In a recent study from a cross-
sectional sample of 55 elderly from India, it was found that loneliness was positively related
to depression. However the amount of socialization was not found to be related (102). The
study also found that loneliness was not related to sociability. It appears that the concept of
loneliness appear to have more relevance in the subjective experience of depression.
27
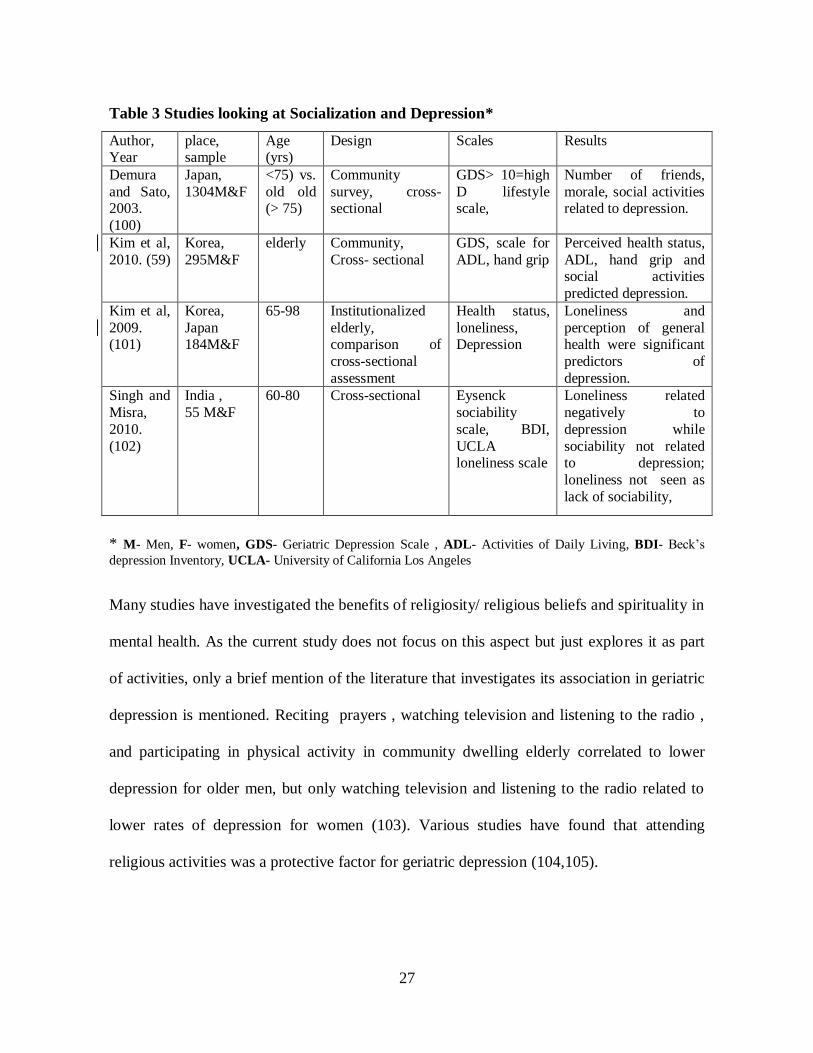
Table 3 Studies looking at Socialization and Depression*
Author, Year
place, sample
Age (yrs)
Design Scales Results
Demura
and Sato, 2003.
(100)
Japan,
1304M&F
<75) vs.
old old (> 75)
Community
survey, cross-sectional
GDS> 10=high
D lifestyle scale,
Number of friends,
morale, social activities related to depression.
Kim et al,
2010. (59)
Korea,
295M&F
elderly Community,
Cross- sectional
GDS, scale for
ADL, hand grip
Perceived health status,
ADL, hand grip and social activities
predicted depression.
Kim et al,
2009. (101)
Korea,
Japan 184M&F
65-98 Institutionalized
elderly, comparison of
cross-sectional
assessment
Health status,
loneliness, Depression
Loneliness and
perception of general health were significant
predictors of
depression.
Singh and
Misra,
2010.
(102)
India ,
55 M&F
60-80 Cross-sectional Eysenck
sociability
scale, BDI,
UCLA loneliness scale
Loneliness related
negatively to
depression while
sociability not related to depression;
loneliness not seen as
lack of sociability,
* M- Men, F- women, GDS- Geriatric Depression Scale , ADL- Activities of Daily Living, BDI- Beck‘s
depression Inventory, UCLA- University of California Los Angeles
Many studies have investigated the benefits of religiosity/ religious beliefs and spirituality in
mental health. As the current study does not focus on this aspect but just explores it as part
of activities, only a brief mention of the literature that investigates its association in geriatric
depression is mentioned. Reciting prayers , watching television and listening to the radio ,
and participating in physical activity in community dwelling elderly correlated to lower
depression for older men, but only watching television and listening to the radio related to
lower rates of depression for women (103). Various studies have found that attending
religious activities was a protective factor for geriatric depression (104,105).
28
[V] ALCOHOL AND TOBACCO
Many of the studies discussed previously have also looked into the issue of substance use
and depression in the elderly. Direct relationship of alcohol and mood change in the form of
depression has been well documented. Substance use can mediate depressive symptoms
directly also indirectly via its influence on vascular diseases.
Long term follow up studies have found a direct relationship between substance use and
increased mortality. They have also found positive association of depression with tobacco
and alcohol use (47,52,85). However moderate alcohol consumption was also found
associated with less depression (72). Another study found that depressive subjects consumed
less alcohol than non depressed subjects (64) .
In a study among community dwelling elderly (n= 1280, 55-85 yrs) depression was assessed
both cross-sectionally and longitudinally (at the end of 6yrs). It was found that depression
was associated with smoking, a recent increase in the number of cigarettes smoked and
sedentary lifestyle. There was also a trend towards association with excessive alcohol
consumption (106).
Summary of Literature Review
Diet- Malnutrition is associated with geriatric depression as a cause and consequence.
Although studies have conflicting results obesity may have a protective influence on
depression. Dietary pattern that are associated with vascular diseases like increased intake of
calories, saturated fat, alcohol, and smoking are also found to be associated with geriatric
depression. Increased consumption of fish (omega-3 fatty acids) and mono unsaturated fatty
acids intake seem to be protective for depression. Deficiency of various nutrients like
omega-3 fatty acids, Vitamin B12 and Folate has been associated with depression. ―Whole‖

29
food and ―traditional‖ food have been found to be associated with less depression.
Vegetarian diet has not been associated with depression.
Physical activity/ Exercise- There are consensus among the studies that physical activity/
Exercise have both cross-sectional and prospective positive association with depression. A
few studies have reported that the prospective association is less clear. Physical activity is
associated with less risk for depression. Heavy intensity occupational physical activity did
not seem to protect against depression in men.
Leisure activities – Various studies have found that involvement in recreational and leisure
activities have been associated with less depression. However most studies have studied the
physically active dimension of leisure activities. Studies looking at other dimensions like
intellectual and social dimensions were lacking. Walking has been defined as a leisure time
physical activity. It has been found to be protective for depression. Many studies have found
an inverse dose- response association between leisure time physical activity and depression.
Socialization and social Interaction- Various studies have found positive association
between good social interaction and reduced depression. A few studies have reported that
feeling of loneliness may have more salience in the elderly who are depressed.
Alcohol and tobacco use- Geriatric depression has been directly associated with tobacco
use and alcohol consumption even though a few studies seem to indicate protective effect for
moderate consumption of alcohol on depression.
30
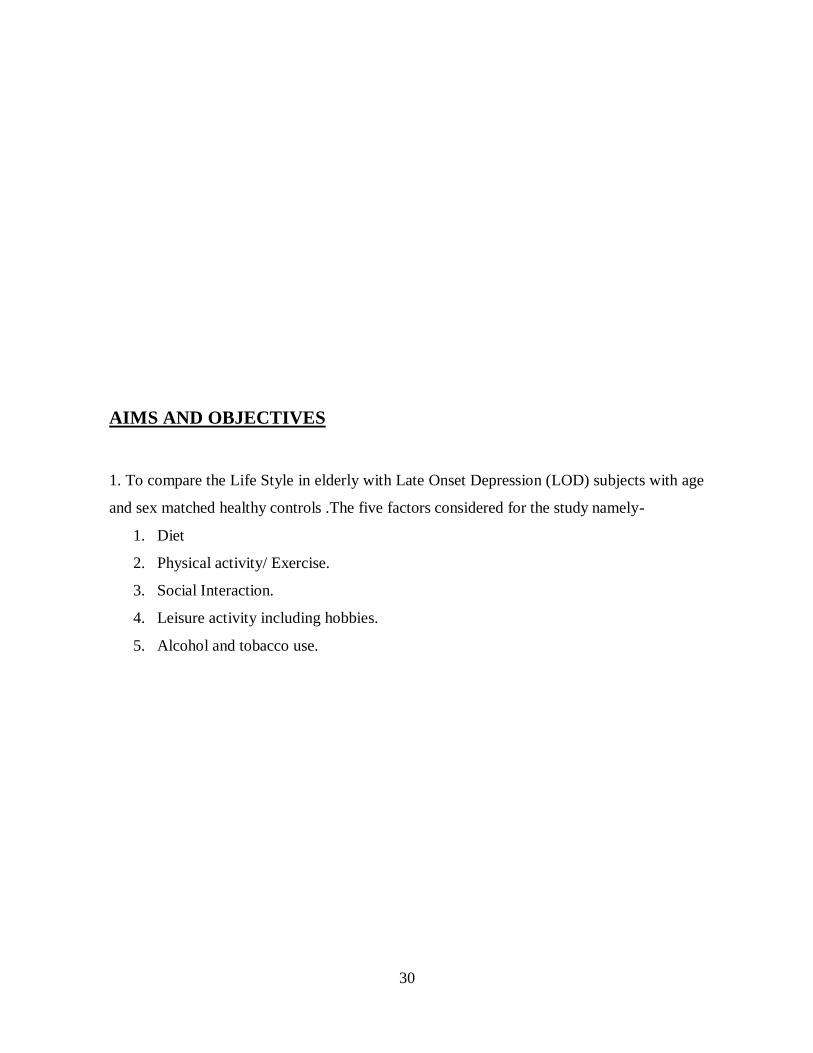
AIMS AND OBJECTIVES
1. To compare the Life Style in elderly with Late Onset Depression (LOD) subjects with age
and sex matched healthy controls .The five factors considered for the study namely-
1. Diet
2. Physical activity/ Exercise.
3. Social Interaction.
4. Leisure activity including hobbies.
5. Alcohol and tobacco use.
31
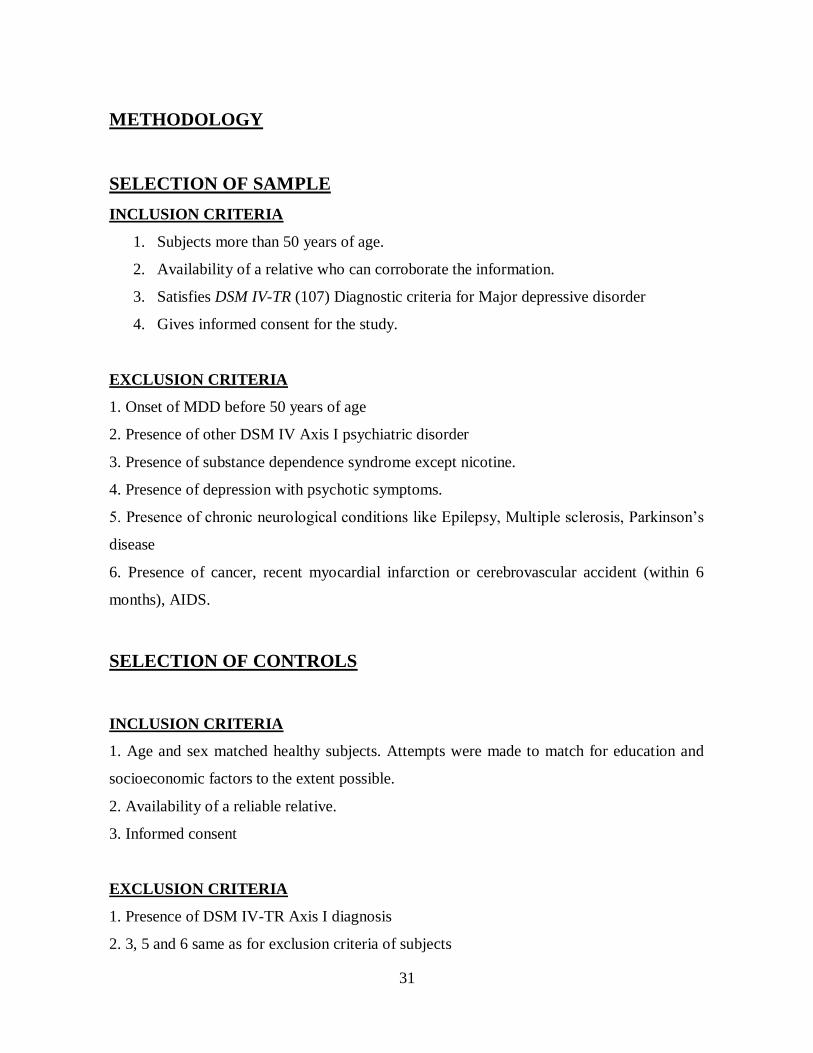
METHODOLOGY
SELECTION OF SAMPLE
INCLUSION CRITERIA
1. Subjects more than 50 years of age.
2. Availability of a relative who can corroborate the information.
3. Satisfies DSM IV-TR (107) Diagnostic criteria for Major depressive disorder
4. Gives informed consent for the study.
EXCLUSION CRITERIA
1. Onset of MDD before 50 years of age
2. Presence of other DSM IV Axis I psychiatric disorder
3. Presence of substance dependence syndrome except nicotine.
4. Presence of depression with psychotic symptoms.
5. Presence of chronic neurological conditions like Epilepsy, Multiple sclerosis, Parkinson‘s
disease
6. Presence of cancer, recent myocardial infarction or cerebrovascular accident (within 6
months), AIDS.
SELECTION OF CONTROLS
INCLUSION CRITERIA
1. Age and sex matched healthy subjects. Attempts were made to match for education and
socioeconomic factors to the extent possible.
2. Availability of a reliable relative.
3. Informed consent
EXCLUSION CRITERIA
1. Presence of DSM IV-TR Axis I diagnosis
2. 3, 5 and 6 same as for exclusion criteria of subjects
32
INSTRUMENTS FOR ASSESSMENT OF SUBJECTS AND CONTROLS
1. Socio demographic Questionnaire.
2. Hindi Mental Status Examination (HMSE) (108)
3. Mini International Neuro Psychiatric Interview (MINI) (109)
4. Hamilton Depression Rating Scale (HDRS ) (110)
5. Hachinski Ischemic Score (111).
6. Cumulative Illness Rating Scale for Geriatrics( CIRS-G) (112).
5. Life Style Questionnaire - Based on other standard questionnaires a Life Style
Questionnaire that suited the Indian population was developed addressing diet,
exercise/physical activity, alcohol and tobacco use, leisure and social activities taking into
consideration expert opinion of nutritionist and statistician.
METHOD
Forty six patients with a diagnosis of Late Onset Depression attending the Geriatric
Outpatient Services of NIMHANS and forty six healthy controls (matched for age, sex and
education) with no psychiatric conditions were studied.
DESCRIPTION OF TOOLS
1. Socio-demographic data sheet contained relevant socio demographic data, clinical
history, and mental status examination. A diagnosis of depression based on DSM IV criteria
was made.
2. Hamilton Depression Rating Scale( HDRS) (110) This is one of the most commonly
used raring scales in studies on depression. It comprises of 21 items. Items are scored 0-2
and 0-4. It has good reliability and internal consistency. It takes 15- 20 minutes to
administer.
3. Hindi Mental state examination (HMSE) (108) It is a scale that is adapted from MMSE
for purpose of interviewing Indian population.
33
5. MINI international neuropsychiatric interview- Screen (109). It is a truncated version
of the MINI questionnaire for purpose of screening people for psychiatric disorder it is used
along with schedule K of the full MINI that screens for psychotic disorder.
6. Cumulative Illness Rating Scale for Geriatrics (CIRS-G)(112) It is a modified CIRS
was operationalised with a manual of guidelines geared toward the geriatric patient. In
medically and psychiatrically impaired elderly subjects it gives reliable quantitative ratings
of chronic medical illness burden for geropsychiatric practice and research. . The score gives
an indication of the burden of vascular risk factors. It has 14 items each to be scored from 0
to 4 based on increasing severity. A total score, a severity index can be calculated from it.
7. Hachinski Ischemic Score(HIS) (111) A tool used in screening to differentiate vascular
dementia from degenerative forms of the disorder. It has got 13 items which have to be
scored either 1 or 2. Patients with a score of 7 or higher are more likely to have a vascular
dementia. A low Hachinski Ischemic Score is less likely to indicate vascular dementia.
8. Life-Style Questionnaire was developed for this study based on other standard
questionnaires from the West after consultation with the nutritionist and statistician. A
comprehensive and easy to apply scale that measured all the items of life style in the Indian
population was not available. Therefore the questionnaire developed included items which
measure frequency and type of diet, extent of physical activity, socialization, leisure
activities substance use and composite scores. The respondents were asked to reply on the
variables during the period of one to two years before onset of depressive illness.
Dietary assessments included whether the respondent was vegetarian or non vegetarian,
Adequacy of food measured on ordinal scale on categories of no of meals, snacks and
amount of water. Type of food was assessed based on broad categories like carbohydrate
(with and without fiber separately), protein (non-vegetarian and vegetation separate), fats
34
etc. Items were scored based on frequency of use from 1(never) to 3 (> 4times a week). The
dietary items were made descriptive asking the subjects about the food they commonly
consumed e.g. Anna (par-boiled rice), Mudde, idly, Dosa, Roti, Chappathi, Dhaliya, Kambu
kalzhi, Puri were categorized as carbohydrate with fibre while Akki Roti, Anna ( Raw
Polished Rice), Upma, Nan, Avalakki, Sooji, Sabudhanna Kanji were classified as
carbohydrate without fiber. For certain items based on nutritionist‘s suggestion and after
discussion with the three mental health professionals and the statistician the scoring were
reversed e.g. eating chicken more than four times a week got lesser score of 1 compared to
once a week- score of 3.
Physical activities were measured on the number of activities and the frequency of exercise
and also the number of hours spent daily in physically demanding activities. Household
activities like cooking, cleaning, washing clothes, gardening and looking after grand children
were specifically asked and scored.
Leisure activities and hobbies were assessed on the number of activities reported and each
activity got a score of one.
Social activities were measured on ordinal scale form 0-5 and it was adapted from the
Patient Version of questionnaire developed by the 10/66 Dementia Research Group (113). It
included questions which assessed how far relatives and sibling stayed away from home,
frequency of interaction with friends and children etc.
The composite scores for each factor was calculated and the max score in each are
Carbohydrate- 10, Protein- 18, Fat-6, physical activity- 15, Leisure activities- 16,
socialization- 30.
35
PROCEDURE
Patients attending the Geriatric Clinic at the Department of Psychiatry, NIMHANS
were screened for Major Depressive Disorders (DSM IV-TR codes 296.2x, 296.3 xs).
Suitable subjects were clinically examined by the investigator. The diagnosis was confirmed
by discussing with the consultant psychiatrist and cases with onset of illness after 50 years
were recruited for the study. Patients who were previously diagnosed with depression and
currently in partial or full remission were also included.
The details of study were discussed with the subjects and a reliable relative and written
informed consent was obtained. Hindi Adaptation of the Mini Mental State Examination was
administered initially to rule out any associated cognitive deficits (dementia). Hamilton
Depression Rating Scale (HDRS) was administered to assess the severity of the depression.
Subsequently the Lifestyle Questionnaire developed for this study was applied. The subjects
were asked to recall their life-style before the onset of depression and answer the questions.
Using purposive sampling, controls matched for age, gender and education and who
met the sample selection criteria were identified by ―word of mouth‖ and recruited for the
study after informed consent. MINI screening questionnaire was applied in the control
subjects to rule out psychiatric morbidity including depression. The recruited controls were
assessed with the same tools applied on the cases.
STATISTICAL METHOD
Continuous variables were tested for their normal distribution and comparison between
groups was done using Independent sample t test.
Non parametric analysis of Wilcoxon Mann- Whitney test was adopted when distribution
was not normal. Categorical variables were analyzed using Chi square test/ Fisher‘s exact
test. P < 0.05 was considered statistically significant.
36
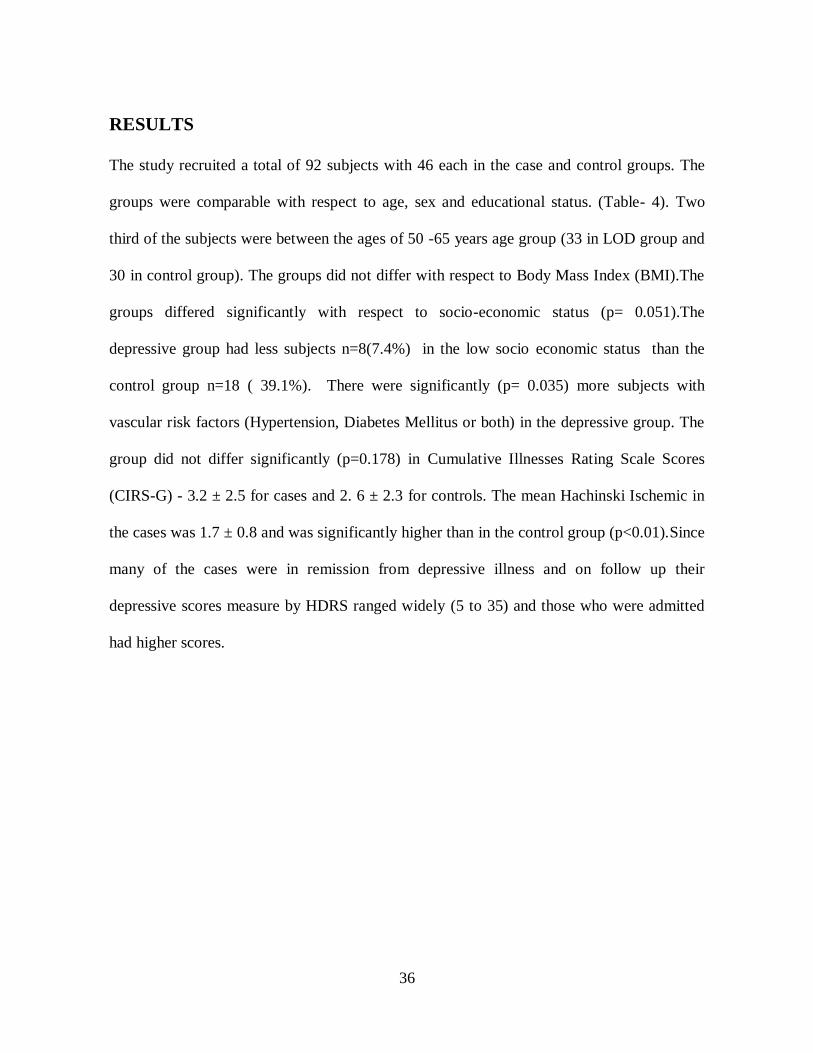
RESULTS
The study recruited a total of 92 subjects with 46 each in the case and control groups. The
groups were comparable with respect to age, sex and educational status. (Table- 4). Two
third of the subjects were between the ages of 50 -65 years age group (33 in LOD group and
30 in control group). The groups did not differ with respect to Body Mass Index (BMI).The
groups differed significantly with respect to socio-economic status (p= 0.051).The
depressive group had less subjects n=8(7.4%) in the low socio economic status than the
control group n=18 ( 39.1%). There were significantly (p= 0.035) more subjects with
vascular risk factors (Hypertension, Diabetes Mellitus or both) in the depressive group. The
group did not differ significantly (p=0.178) in Cumulative Illnesses Rating Scale Scores
(CIRS-G) - 3.2 ± 2.5 for cases and 2. 6 ± 2.3 for controls. The mean Hachinski Ischemic in
the cases was 1.7 ± 0.8 and was significantly higher than in the control group (p<0.01).Since
many of the cases were in remission from depressive illness and on follow up their
depressive scores measure by HDRS ranged widely (5 to 35) and those who were admitted
had higher scores.
37
Table 4 Socio- Demographic Data
Item Depression (n =46) control (n= 46) P value*
Age ( mean in yrs) 62.9 ± 7.2 62.8 ± 8.3 0.947
Sex
Men 20(43.43%) 22(47.82%)
0.834 Women 26 (56.57%) 24(52.18%)
BMI 22.8 ±2.8 23.1 ±3.0 0.548
Education
Illiterate
11 (24%)
9 (19.6%)
0.49
Less than 10 std 14 (30.4%) 19 (41.35)
More than 10 std 13 (28.3%) 8 (17.4%)
Degree 6 (13%) 5(10.7%)
Post-graduation 2 (4.35%) 5 (10.7%)
Socioeconomic
Low
8 (17.4%)
18 (39.1%)
.051 Middle 33 (71.7%) 26 (56.5%)
Upper 5 (10.7%) 2 (4.35%)
Systemic illness HTN,DM or both
26 (56.5%) 15 (32.6%) .035
Others or nil 20 (43.5%) 31 (67.4%)
* Chi-square/ fisher‘s exact test, T test
Diet
The two groups did not differ significantly with respect to BMI (p=0.548). Mean BMI in
cases was 22.8 ±2.8 and in controls was 23.1 ±3.0. In detailed physical examination also
they did not show any signs of malnutrition. There was higher percentage of vegetarians
22(47.8%) in the depressive group compared to the controls 13(28.3%) but this was not
statistically significant (p=0.085). Many subjects - 9 in depressive group and 13 in control
group, who called themselves non-vegetarians, were taking non vegetarian diet less
frequently than once a month thus scoring similar to vegetarians in the diet scale
measurements on non-vegetarian items. The analysis of dietary items was done as a group
and also individually.
38
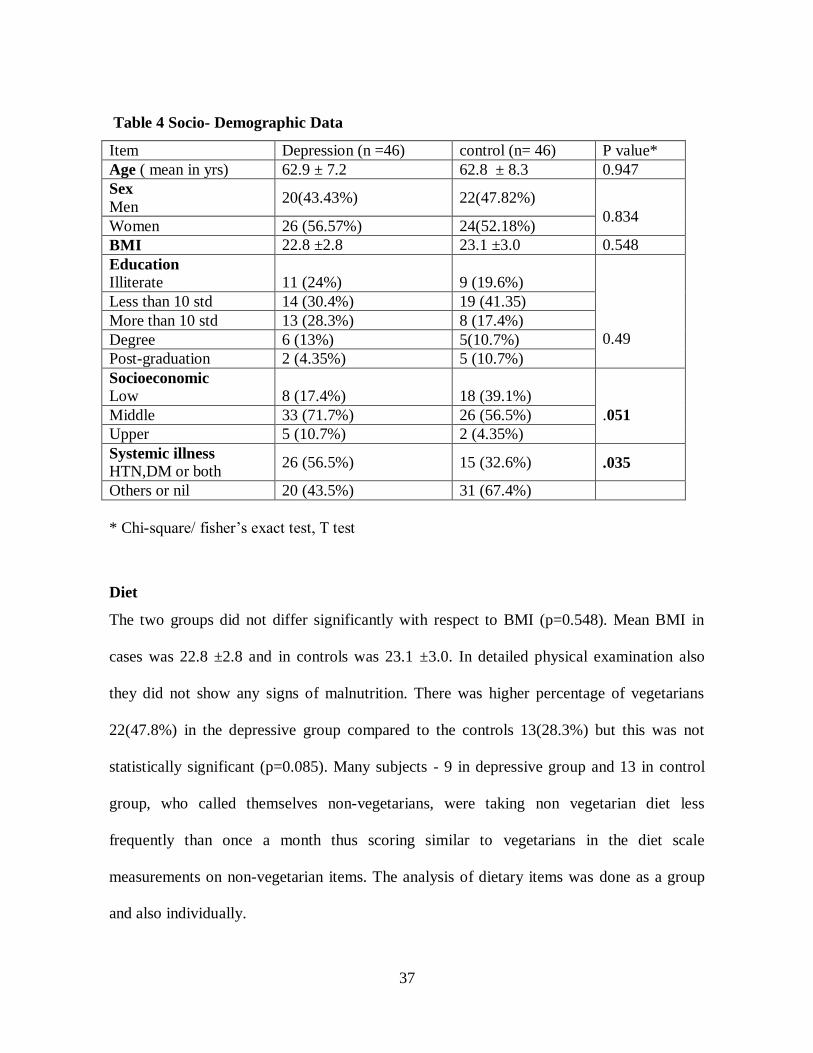
The mean composite scores for dietary factors, physical activity, socialization and leisure
activities did not differ significantly between LOD and the control groups (Table 2a).On
comparison of individual items it was found that group with depression was taking
significantly more dietary fiber(p<0.001) and dairy products ( p=0.03) (Table: 2b)
Table 5(a): Comparison of Diet Parameters
Depression (n =46)* control (n= 46) P value( T test)
Carbohydrate 6.4 ± 1.7 6.1± 1.8 0.32
Protein 8.2 ±3.7 7.7 ±3.7 0.50
Fat 6.1 1.8 6.1 2.0 0.95
* Values represent Means of composite scores ± Standard Deviation
Table 5(b) Comparison of individual dietary item.
Depression** control P Value*
Water 2.0± 0.5 2.3± 1.0 .241
Carbohydrate with Fiber 4.7± 0.8 3.9± 1.1 <.001
Carbohydrate without Fiber 1.8± 1.4 2.1± 1.2 .126
Fish 0.5± 1.0 0.6± 1.1 .412
Chicken 0.9± 1.4 0.9 ±1.3 .847
Meat 0.5± 1.1 0.6± 1.1 .647
Eggs 1.0± 1.2 1.1± 1.3 .637
Dairy products 2.5± 1.0 1.8± 1.2 .003
Veg. protein 2.7± 0.7 2.5± 0.8 .276
Fat 3.4± 1.2 3.4± 1.1 .899
Pufa 2.7± 0.8 2.0.±1.0 .752
Vegetables 4.1± 0.9 4.0± 0.6 .158
Fruits 3.2± 1.6 3.0 ±1.7 .493
*Mann- Whitney U test
** Mean scores ± Standard Deviation
39
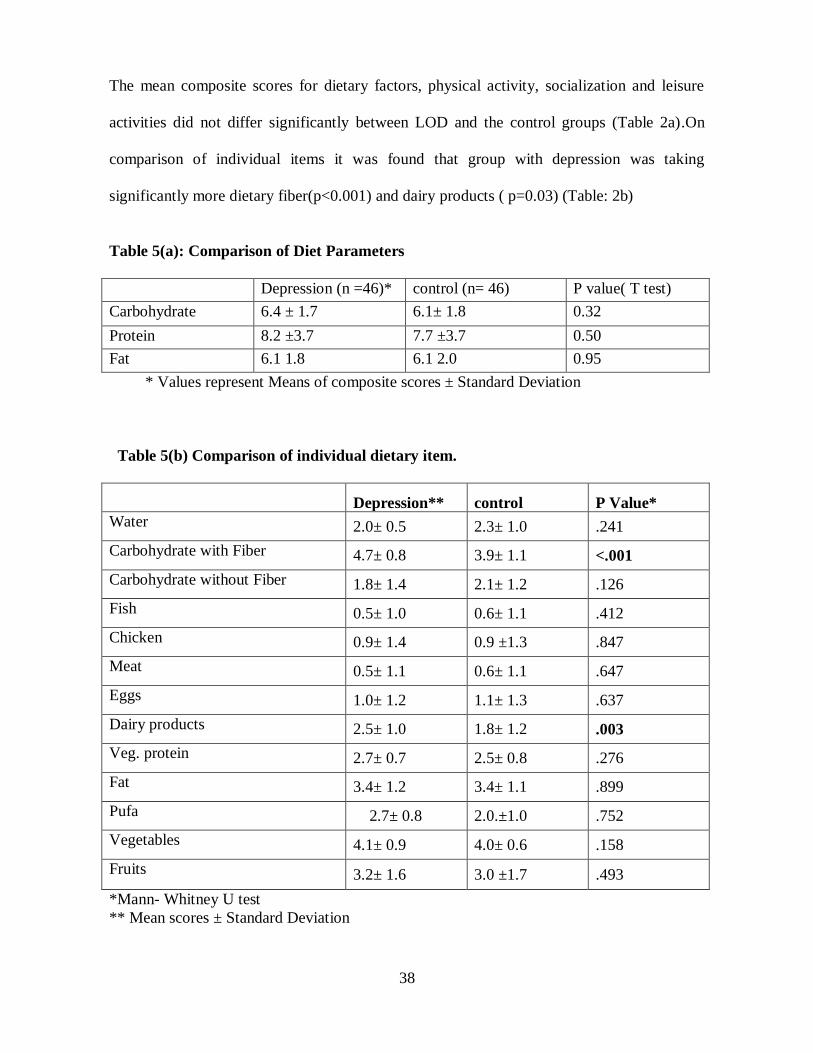
Depressive subjects reported that they felt their diet was very healthy before the onset of
depression and this was significant when compared with control. (Fig- 1).
Fig 1 Comparison of self reported opinion on diet*
0
5
10
15
20
25
30
very good
moderate
some- what
Depression
Control
X axis= dietary pattern (very healthy, moderately healthy, somewhat healthy)
Y axis= no. of subjects.* chi square test (p= 0.03)
Physical Activity.
There was no significant difference (p = 0.64) between the LOD group and the control group
with respect to physical activity. The mean composite score in the LOD group was 5.9 ±2.4
and in control group was 5.7 ± 2.5. Comparison for individual items that measured physical
activity based on the number of hours per day and also the number of activities also showed
no significant difference (Table 6).
40
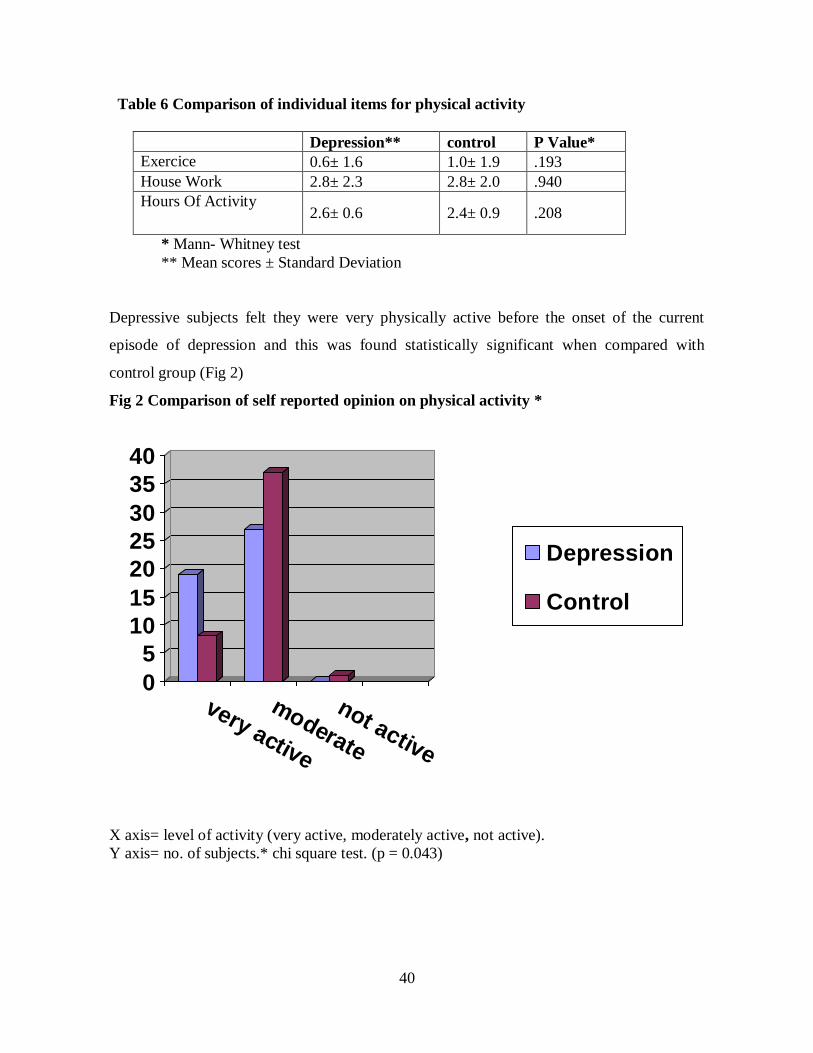
Table 6 Comparison of individual items for physical activity
Depression** control P Value*
Exercice 0.6± 1.6 1.0± 1.9 .193
House Work 2.8± 2.3 2.8± 2.0 .940
Hours Of Activity 2.6± 0.6 2.4± 0.9 .208
* Mann- Whitney test
** Mean scores ± Standard Deviation
Depressive subjects felt they were very physically active before the onset of the current
episode of depression and this was found statistically significant when compared with
control group (Fig 2)
Fig 2 Comparison of self reported opinion on physical activity *
0
5
10
15
20
25
30
35
40
very active
moderate
not active
Depression
Control
X axis= level of activity (very active, moderately active, not active).
Y axis= no. of subjects.* chi square test. (p = 0.043)
41
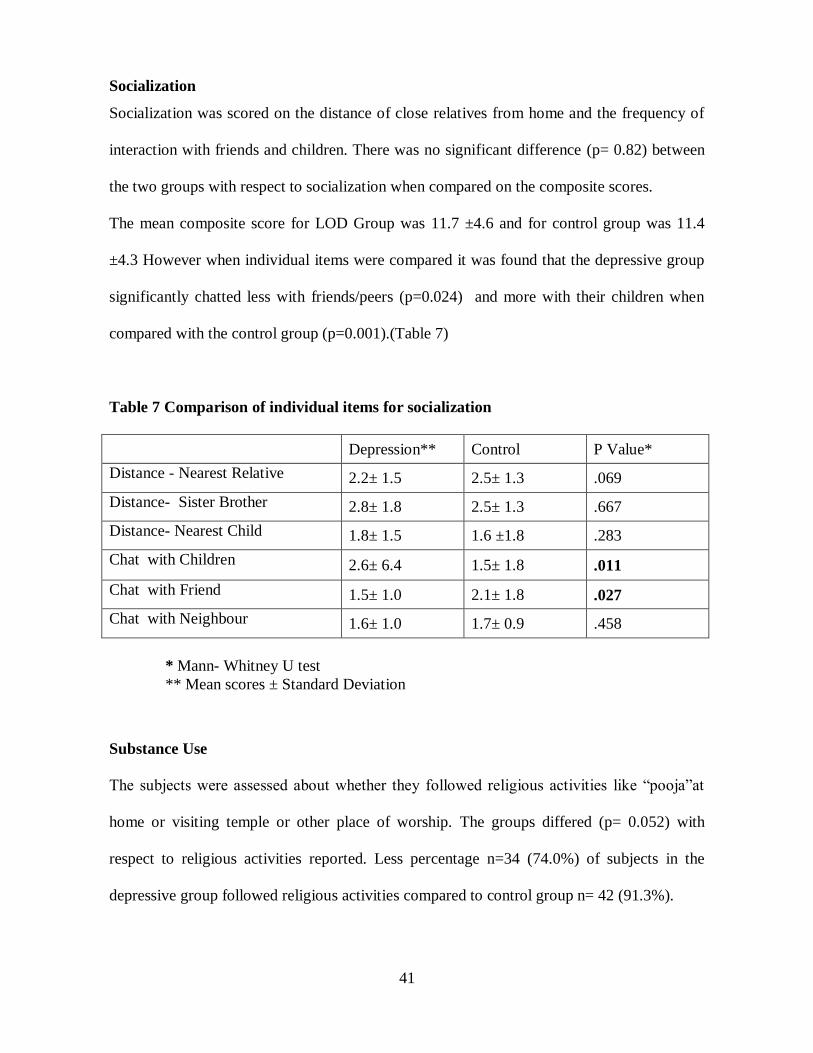
Socialization
Socialization was scored on the distance of close relatives from home and the frequency of
interaction with friends and children. There was no significant difference (p= 0.82) between
the two groups with respect to socialization when compared on the composite scores.
The mean composite score for LOD Group was 11.7 ±4.6 and for control group was 11.4
±4.3 However when individual items were compared it was found that the depressive group
significantly chatted less with friends/peers (p=0.024) and more with their children when
compared with the control group (p=0.001).(Table 7)
Table 7 Comparison of individual items for socialization
Depression** Control P Value*
Distance - Nearest Relative 2.2± 1.5 2.5± 1.3 .069
Distance- Sister Brother 2.8± 1.8 2.5± 1.3 .667
Distance- Nearest Child 1.8± 1.5 1.6 ±1.8 .283
Chat with Children 2.6± 6.4 1.5± 1.8 .011
Chat with Friend 1.5± 1.0 2.1± 1.8 .027
Chat with Neighbour 1.6± 1.0 1.7± 0.9 .458
* Mann- Whitney U test
** Mean scores ± Standard Deviation
Substance Use
The subjects were assessed about whether they followed religious activities like ―pooja‖at
home or visiting temple or other place of worship. The groups differed (p= 0.052) with
respect to religious activities reported. Less percentage n=34 (74.0%) of subjects in the
depressive group followed religious activities compared to control group n= 42 (91.3%).
42
Leisure Activity and Hobbies
Leisure activities were measured as scores that measured the number of leisure activities
reported. There was no significant difference (p= 0.706) between the groups with respect to
leisure activities. The mean score for LOD group was 2.2± 1.4 and for the control group was
2.3± 1.1.
There was no significant difference (p = 0.662) between groups on tobacco use (15 in
depression group and 17 in control group). Very few had a history of alcohol use in either
group (4 in LOD and 5 in control group).
Summary of Results
1. The study involves 92 subjects- 46 cases with Late Onset Depression (LOD) and 46 age,
sex and education matched controls.
2. The cases and controls differed (P=.051) with respect to socio economic status. The
control group had more number of subjects in the low socio-economic category.
3. The Groups did not differ with respect to Body Mass Index (BMI) or the Cumulative
Illnesses Rating Scale Scores (CIRS-G).
4. There were significantly (p= 0.035) more subjects with vascular risk factors (HTN, DM or
both) in the depressive group.
5. HDRS ranged widely (5 to 35) in the LOD group as many subjects were in remission.
6. Though there was higher percentage of vegetarians 22 (47.8%) in the LOD group
compared to the controls 13(28.3%) this was not statistically significant (p=0.085)
7. The mean composite scores for dietary factors, physical activity, socialization and leisure
activities did not differ significantly between the groups and substance use was found to be
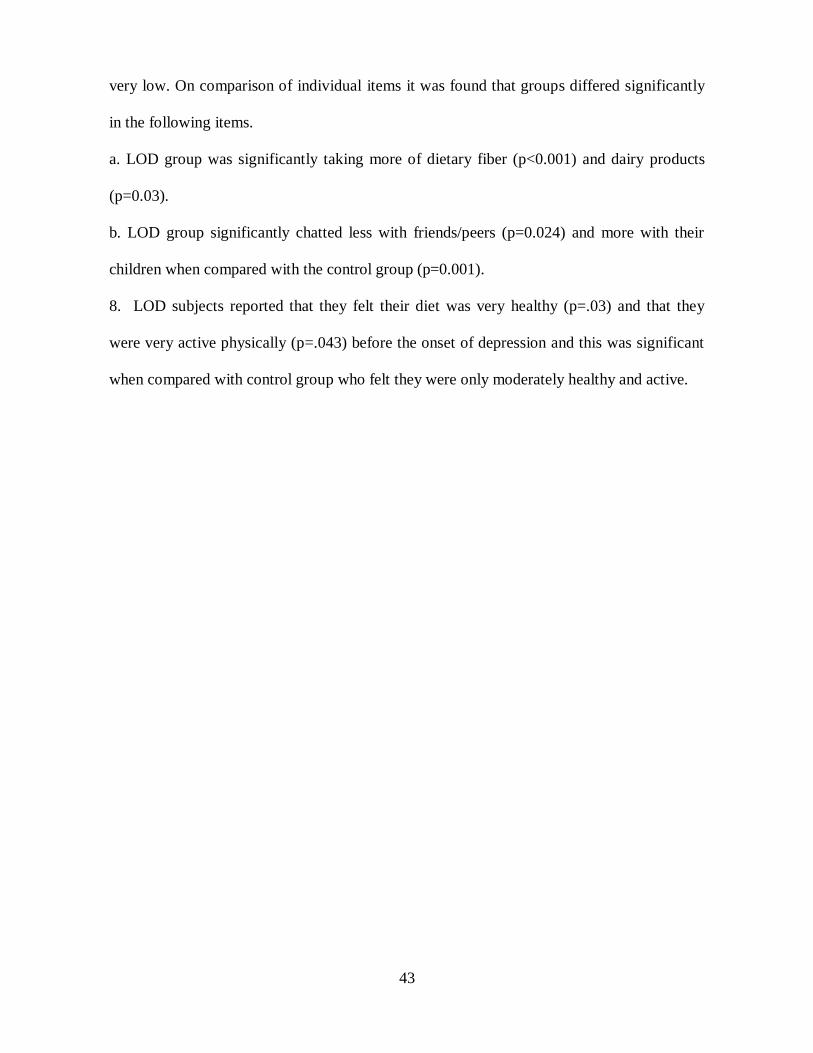
43
very low. On comparison of individual items it was found that groups differed significantly
in the following items.
a. LOD group was significantly taking more of dietary fiber (p<0.001) and dairy products
(p=0.03).
b. LOD group significantly chatted less with friends/peers (p=0.024) and more with their
children when compared with the control group (p=0.001).
8. LOD subjects reported that they felt their diet was very healthy (p=.03) and that they
were very active physically (p=.043) before the onset of depression and this was significant
when compared with control group who felt they were only moderately healthy and active.
44
DISCUSSION:
Late Onset Depression (LOD) is different from Early Onset Depression (EOD) as discussed
in the review and it is associated with various parameters which have to be separately
studied rather than generalizing information from EOD. Among the various parameters,
life-style and its ramifications on health and living seem to be very relevant in the elderly.
Many studies in the Western countries have looked at it and hence formed the impetus for
the current study in the Indian population.
Life Style Factors of Diet, Physical Activity, Leisure Activities, Socialization and Substance
Use were compared between LOD group and an age and gender matched control group.
Causality was not presumed, but comparisons were made. A Descriptive and exploratory
approach has been taken in this study.
The clinic at which the study was conducted is a special clinic which serves mostly the
population from southern India. Since it is a referral Institute, there were also referrals from
the other parts of the country.
Despite attempts by the investigator to match the two groups of study on age, sex, education
and socioeconomic status cases and controls remained significantly different with respect to
socio-economic status. The control group had more subjects in the low socio-economic
status. The groups did not differ in age, gender or educational status. As it is known that Life
Style Factors are often influenced by socioeconomic factors (50) the findings of this study
need to repeated with more stringent matching of control group in future.
The subjects were also largely from an urban background thus lending more heterogeneity in
the lifestyle patterns especially diet. This might have resulted in greater individual
differences thus blunting the inter group differences. The study is also a retrospective one
with a cross- sectional design. Since most of the persons with LOD were on the road to
45
recovery, it was possible to interview them about their Life Style Pattern before the onset of
the episode. All the information gathered are pertaining to the period before the onset of the
depressive illness. This information was also corroborated to some extent with the relative
who accompanied the client. All the clients from the LOD groups were on antidepressants –
often SSRI – either Escitalopram or Mirtazapine; rarely Venlafaxine.
Body Mass Index is an objective indicator of health and indirectly life-style. The persons
with LOD in this study did not differ in their BMI from that of the controls. Biological
Functions especially appetite and food intake are affected in depression (54) with either low
or high food intake which in turn could affect the body mass index. As discussed in the
review, relation of BMI to depression is not clear though depressive individuals are prone for
malnutrition probably because of decreased appetite or associated health morbidity. The
sample studied did not show signs of malnutrition. This aspect need to be further explored
especially in view of the conflicting reports as to whether higher BMI is protective in
depression.
There was no difference between the groups in the five broad categories of life style factors.
Interesting differences emerged when individual items were scrutinized and compared. This
is discussed below.
Diet
There was no difference in the dietary intake between the two groups. BMI not being
different between the two groups corroborated this. A pervious study (72) also did not find
differences in dietary factors between LOD men and controls. However it was found in the
present study that depressed subjects were significantly taking more carbohydrate with fiber
and diary products than controls. This difference was perceived to be a reflection of the
dietary preference between the two groups – there were more vegetarians among the LOD
46
group (48%) than the control group (28%) though the difference was not statistically
significant (P= 0.08). Diary products are considered vegetarian in India and used as an
important source of protein by vegetarians. Vegetarian diets are considered to be deficient in
Vitamin B12 and Folic Acid which are associated with depression (66). But a study in adult
population reported that vegetarian diet is not associated with depression (76). The lesser
consumption of dairy products in the control group may also be explained by more
percentage of lower-socioeconomic status subjects indirectly reflecting their purchasing
power.
Interestingly the LOD opined that their diet was better before the onset of their depression
(Similar opinion voiced for physical activity also – see below). This may be due to recall
bias of the elderly who is recovering from depression who perceives as the pre-depression
days as being ‗golden‘ in comparison to the depressed period.
This study needs to be extended further if definite conclusions have to be drawn regarding
dietary habits including fiber, dairy products among others.
Socialization
Depressed subjects socialized less with their friends, but more with their own children.
Despite other research affirming the relationship between decreased socialization and
depression in the elderly (100) this finding probably needs to be understood in a varying
socio cultural context. Currently a significant proportion of the Indian elderly continue to
live in extended families especially the ‗young –old‘ (50 – 65 years) with married or
unmarried children. In this study too majority of the subjects across the group lived with
their children in the same house or within one mile as. The majority of the subjects in both
groups also reported satisfaction with the help and support they got from close friends.
However the LOD group reported significant history of less interaction with their friends and
47
peers and more interaction with their children. This probably has resulted from the pattern of
lesser interaction with peers and hence exaggerated interaction with children compared to
the control group who reported probably equal socialization with both peers and family
members. The above is only a hypothesis and needs to be validated further as one study from
India report that ‗loneliness‘ may be more related to depression in the elderly than
socialization (102). Interactions with peers/people outside the family circle could provide
opportunities for mutual disclosures with the same age peers, facilitation in problem
solving as well as positive distractions from interpersonal/other issues at home. More over
content of sharing and quality of interactions are important variables than not just the
frequency of interactions and this aspect was not specifically explored in this study. As the
specific family structure was not explored this study could not corroborate a previous Indian
study (42) which had reported that functional disorders were more common in elderly living
in nuclear family or living alone compared to joint family.
Participation in religious activities whether at home or outside was assessed as part of social
activities and it was found that the depressive group had engaged in significantly less
religious activities. This study assessed practice of religious activities as either ceremonial
prayer at home or visits to place of worship. Lesser involvement in religious activities in the
LOD may indirectly also reflect the lesser interaction patterns outside their home. This might
be possible because accessibility of social connections is considered one of the mechanism
through which religious participation may serve as a protective mechanism for health
outcome. This result seems to support previous research which seems to suggest a positive
effect of religious activities in protecting from depression (104,105).
48
Physical Activity and Exercise:
The depressive group subjectively reported more physical activity than control group. How
ever when the same was quantified as ―number of hours of activity‖ there was no difference
between the two groups. It may be due to recall bias of the depressed individuals when
asked to report on their level of physical activity before they were depressed. As many of the
subjects studied were in the ―young-old‖ (<65yrs) category they were involving themselves
in heavy occupational physical activity especially those who were involved in farming.
Many women also reported heavy house old occupational activities like washing clothes,
cleaning etc. However this study did not assess them quantitatively in metabolic equivalents
as done in some other studies. There is also a need to assess physical activities qualitatively
as whether part of occupation or leisure as in some other studies (90) that have tried to
distinguish the two with differential benefits.
Leisure Activities and Hobbies:
There was no difference in the types and numbers of leisure activities between the two study
groups. Leisure activities and hobbies were assessed as the number of activities reported.
There is a need to review the items in the tool in future work to see associations as some of
the other research have combined physical activities and leisure (90, 93). There is also need
to better understand leisure activities in culturally diverse elderly population (114).
Substance Use:
Despite detailed interviewing there were less number of elderly in both the groups who were
using alcohol. Tobacco was slightly more and there was no difference between the two
groups. Unlike the West, the current Indian elderly belong to the era where alcohol and
tobacco are a ‗social taboo and hence the low prevalence of substance use and probably the
lack of significant difference between the groups.
49
In summary this study explored the life-style pattern in a sample of elderly Indian population
and its influence on the genesis of depression. It is a retrospective study in elderly population
who developed depression compared with and age, sex and educational status matched
healthy controls. The life style patterns did not differ much between the groups studied.
When individual items were compared there appeared significant differences which require
elaboration in further studies.
50
CONCLUSION
This cross sectional study on Lifestyle Factors in Late Onset Depression (LOD) did not find
significant difference between elderly with LOD and age, sex and education matched
controls. However in this study there were certain interesting findings in relation to life-style
and LOD in the Indian socio-cultural context. Depressed elderly consumed more dietary
fiber and diary products. They perceived themselves being more physically active and
following healthier diet before the onset of depression. They socialized less with their peers,
but seemed to interact more with family, probably as a function of living with offspring.
They reported significantly less religious practices than control group. Substance use was
observed to be generally low.
LIMITATIONS
1. For want of an available questionnaire that is applicable in Indian context life style
questionnaire was devised based on available questionnaires after consultation with
experts including statistician and nutritionist.
2. The questionnaire needs to be further fine tuned to include the dimensional aspects of
leisure activities which have been used in studies done in dementia.
3. Both the study sample and control sample were derived form urban population with
heterogeneous dietary patterns. This probably blunted the differences between the
groups.
51
FUTURE DIRECTIONS
Further research both in standardization of the tool and also identification of specific life-
style factors in LOD in India need to be carried out.
Longitudinal studies need to be carried out with larger samples in more homogenous
population to better understand the effects of life-style patters in late onset depression.
Studies that can look at serum levels of fatty acids can be more informative about the
influence of specific nutrients that can influence depression.
The specific role of vegetarian diet and depression needs to be explored in a larger sample.
Further exploration into the family structure and the specifics of social interaction patterns
need to be studied in relation to geriatric depression.
IMPLICATIONS OF THIS STUDY.
Life-style factors are modifiable factors that influence health outcomes and present a
window of opportunity to intervene for primordial prevention of diseases. As has been
demonstrated for various physical illnesses if the beneficial effects of better life style could
also be proved for mental health, public at large can be educated regarding positive changes
in their life pattern. Significant differences between the depressed elderly and the matched
controls did not emerge on several life style variables examined. However, the data
highlighted interesting differences on a few items pertaining to dietary pattern and
socialization. The study findings in general and these observations in particular have
generated several hypotheses that need to be critically examined through further research.
52
SUMMARY (ABSTRACT)
Introduction.
The association of lifestyle factors and Late Onset Depression (LOD) was studied in a
treatment seeking elderly population in India.
Method
Treatment seeking population with LOD (n=46) and controls matched for age, sex and
education was cross-sectionally assessed for lifestyle pattern. Depression was diagnosed
based on DSM-IV criteria and HDRS was used for assessing severity of depression.
Depressed group reported about their lifestyle prior to onset of depressive disorder. Lifestyle
was assessed on five parameters namely diet, physical activity/exercise, leisure activities,
Socialization, alcohol and tobacco use.
Result
The mean composite scores for dietary factors, physical activity, socialization and leisure
activities did not differ significantly between the groups and substance use was found to be
low. On comparison of individual items it was found that the LOD group was significantly
taking more of dietary fiber (p<0.001) and dairy products (p=0.03). LOD group also chatted
significantly less with friends/peers (p=0.024) and more with their children when compared
with the control group (p=0.001). Less percentage n=34 (74.0%) of subjects in the
depressive group followed religious activities compared to control group n= 42 (91.3%)
(p=0.052).
Conclusion
This cross sectional study on Lifestyle Factors in Late Onset Depression (LOD) did not find
significant difference between elderly with LOD and age, sex and education matched
controls. However on comparison of individual items LOD group consumed more dietary
fiber and diary products. They socialized less with their peers, but seemed to interact more
with family, probably as a function of living with offspring. They reported significantly less
religious practices than control group. Substance use was observed to be generally low.
These findings need further elaboration in larger sample.
53
References
1. United-Nations. World Population Prospects: The 2008 Revision Population
Database. Population Division of the Department of Economic and Social Affairs of the
United Nations Secretariat 2009 [cited 2010 15 10]; Available from:
http://esa.un.org/UNPP/index.asp?panel=2.
2. United-Nations. World Population Ageing 2009. Department of Economic and Social
Affairs Population Division; 2009 [cited 2010 15 10]; Available from:
http://www.un.org/esa/population/publications/WPA2009/WPA2009_WorkingPaper.pdf.
3. Rajkumar S, Kumar S, Thara R. Prevalence of dementia in a rural setting: A report
from India. Int J Geriatr Psychiatry. 1997;12(7):702-7.
4. Khurana PS, Sharma PSVN, Avasthi A. Prevalence Of Delirium In Geriatric
Hospitalized General Medical Population2002.
5. World-Health-Organization. Mental Health. 2010 [cited 2010 15 10]; Available
from: http://www.who.int/mental_health/management/depression/definition/en/.
6. Grasbeck A. The epidemiology of anxiety and depressive syndromes. A prospective,
longitudinal study of a geographically defined, total population: the Lundby study. Doctoral
thesis.Lund. Lund Sweden: University of Lund; 1996.
7. Gottfries CG. Recognition and management of depression in the elderly. Int Clin
Psychopharmacol. 1997;12 Suppl 7:S31-6.
8. Alexopoulos GS, Meyers BS, Young RC, Kakuma T, Silbersweig D, Charlson M.
Clinically defined vascular depression. Am J Psychiatry. 1997;154(4):562-5.
9. Wang JK, Su TP, Chou P. Sex differences in prevalence and risk indicators of
geriatric depression: the Shih-Pai community-based survey. J Formos Med
Assoc;109(5):345-53.
10. Djernes JK. Prevalence and predictors of depression in populations of elderly: a
review. Acta Psychiatr Scand. 2006;113(5):372-87.
11. Heok KE, Ho R. The many faces of geriatric depression. Current Opinion in
Psychiatry. 2008;21(6):540-5 10.1097/YCO.0b013e328311cdae.
12. Hasin DS, Goodwin RD, Stinson FS, Grant BF. Epidemiology of major depressive
disorder: results from the National Epidemiologic Survey on Alcoholism and Related
Conditions. Arch Gen Psychiatry. 2005;62(10):1097-106.
54
13. Nandi DN, Ajmany S, Ganguli H, Benerjee G, Boral GC, Ghosh A, et al. The
Incidence Of Mental Disorders In One Year In A Rual Community In West Bengal1976.
14. Nandi PS, Banerjee G, Mukherjee SP, Nandi S, Nandi DN. A Study Of Psychiatric
Morbidity Of The Elderly Population Of A Rural Community In West Bengal1997.
15. Ramachandran V, Sarada M, Ramamurthy B. Psychiatric Disorders In Subjects Aged
Over Fifty1979.
16. Rao VA, Madhavan T. Gerospsychiatric Morbidity Survey In A Semi-Urban Area
Near Maddurai1982.
17. Tiwari SC. Geriatric psychiatric morbidity in rural northern India: implications for
the future. Int Psychogeriatr. 2000;12(1):35-48.
18. Jain RK, Aras RY. Depression in geriatric population in urban slums of Mumbai.
Indian J Public Health. 2007;51(2):112-3.
19. Krishnan KR, Hays JC, Blazer DG. MRI-defined vascular depression. Am J
Psychiatry. 1997;154(4):497-501.
20. Steffens DC, Krishnan KR. Structural neuroimaging and mood disorders: recent
findings, implications for classification, and future directions. Biol Psychiatry.
1998;43(10):705-12.
21. Carney RM, Rich MW, Tevelde A, Saini J, Clark K, Jaffe AS. Major depressive
disorder in coronary artery disease. Am J Cardiol. 1987;60(16):1273-5.
22. Gavard JA, Lustman PJ, Clouse RE. Prevalence of depression in adults with diabetes.
An epidemiological evaluation. Diabetes Care. 1993;16(8):1167-78.
23. Greenwald BS, Kramer-Ginsberg E, Bogerts B, Ashtari M, Aupperle P, Wu H, et al.
Qualitative magnetic resonance imaging findings in geriatric depression. Possible link
between later-onset depression and Alzheimer's disease? Psychol Med. 1997;27(2):421-31.
24. Luber MP, Hollenberg JP, Williams-Russo P, DiDomenico TN, Meyers BS,
Alexopoulos GS, et al. Diagnosis, treatment, comorbidity, and resource utilization of
depressed patients in a general medical practice. Int J Psychiatry Med. 2000;30(1):1-13.
25. Rabkin JG, Charles E, Kass F. Hypertension and DSM-III depression in psychiatric
outpatients. Am J Psychiatry. 1983;140(8):1072-4.
26. Salloway S, Malloy P, Kohn R, Gillard E, Duffy J, Rogg J, et al. MRI and
neuropsychological differences in early- and late-life-onset geriatric depression. Neurology.
1996;46(6):1567-74.
27. Debbarama G. Depression- A comparitive study of Late and Early onset. Bangalore:
NIMHANS; 2002.
55
28. Alexopoulos GS, Young RC, Meyers BS, Abrams RC, Shamoian CA. Late-onset
depression. Psychiatr Clin North Am. 1988;11(1):101-15.
29. Alexopoulos GS, Young RC, Meyers BS. Geriatric depression: age of onset and
dementia. Biol Psychiatry. 1993;34(3):141-5.
30. Brown RP, Sweeney J, Loutsch E, Kocsis J, Frances A. Involutional melancholia
revisited. Am J Psychiatry. 1984;141(1):24-8.
31. Krishnan KR, McDonald WM. Arteriosclerotic depression. Med Hypotheses.
1995;44(2):111-5.
32. Burvill PW, Hall WD, Stampfer HG, Emmerson JP. A comparison of early-onset and
late-onset depressive illness in the elderly. Br J Psychiatry. 1989;155:673-9.
33. Baldwin RC, Tomenson B. Depression in later life. A comparison of symptoms and
risk factors in early and late onset cases. Br J Psychiatry. 1995;167(5):649-52.
34. Brodaty H, Luscombe G, Parker G, Wilhelm K, Hickie I, Austin MP, et al. Early and
late onset depression in old age: different aetiologies, same phenomenology. J Affect Disord.
2001;66(2-3):225-36.
35. Brodaty H, Peters K, Boyce P, Hickie I, Parker G, Mitchell P, et al. Age and
depression. J Affect Disord. 1991;23(3):137-49.
36. Conwell Y, Nelson JC, Kim KM, Mazure CM. Depression in late life: age of onset as
marker of a subtype. J Affect Disord. 1989;17(2):189-95.
37. Drevets WC. Geriatric depression: brain imaging correlates and pharmacologic
considerations. J Clin Psychiatry. 1994;55 Suppl A:71-81; discussion 2, 98-100.
38. Mendlewicz J. The age factor in depressive illness: some genetic considerations. J
Gerontol. 1976;31(3):300-3.
39. Cassano GB, Akiskal HS, Savino M, Soriani A, Musetti L, Perugi G. Single episode
of major depressive disorder. First episode of recurrent mood disorder or distinct subtype of
late-onset depression? Eur Arch Psychiatry Clin Neurosci. 1993;242(6):373-80.
40. Van den Berg MD, Oldehinkel AJ, Bouhuys AL, Brilman EI, Beekman AT, Ormel J.
Depression in later life: three etiologically different subgroups. J Affect Disord.
2001;65(1):19-26.
41. Sneed JR, Kasen S, Cohen P. Early-life risk factors for late-onset depression. Int J
Geriatr Psychiatry. 2007;22(7):663-7.
42. Ramachandran V, Menon SM, Arunagiri S. Physical Disabilities In Late Onset
Depression In The Community1982.
56
43. Key TJ, Allen NE, Spencer EA, Travis RC. The effect of diet on risk of cancer.
Lancet. 2002;360(9336):861-8.
44. Flicker L. Life style interventions to reduce the risk of dementia. Maturitas.
2009;63(4):319-22.
45. Middleton LE, Kirkland SA, Maxwell CJ, Hogan DB, Rockwood K. Exercise: a
potential contributing factor to the relationship between folate and dementia. J Am Geriatr
Soc. 2007;55(7):1095-8.
46. Housman J, Dorman S. The Alameda County Study: A Systematic, Chronological
Review. American Journal of Health Education 2005;36(5):302-8.
47. Belloc NB, Breslow L. Relationship of physical health status and health practices.
Prev Med. 1972;1(3):409-21.
48. Belloc NB. Relationship of health practices and mortality. Prev Med. 1973;2(1):67-
81.
49. Frederick T, Frerichs RR, Clark VA. Personal health habits and symptoms of
depression at the community level. Prev Med. 1988;17(2):173-82.
50. Appleton KM, Woodside JV, Yarnell JW, Arveiler D, Haas B, Amouyel P, et al.
Depressed mood and dietary fish intake: direct relationship or indirect relationship as a result
of diet and lifestyle? J Affect Disord. 2007;104(1-3):217-23.
51. Rao TS, Asha MR, Ramesh BN, Rao KS. Understanding nutrition, depression and
mental illnesses. Indian J Psychiatry. 2008;50(2):77-82.
52. Averina M, Nilssen O, Brenn T, Brox J, Arkhipovsky VL, Kalinin AG. Social and
lifestyle determinants of depression, anxiety, sleeping disorders and self-evaluated quality of
life in Russia--a population-based study in Arkhangelsk. Soc Psychiatry Psychiatr
Epidemiol. 2005;40(7):511-8.
53. Cabrera MA, Mesas AE, Garcia AR, de Andrade SM. Malnutrition and depression
among community-dwelling elderly people. J Am Med Dir Assoc. 2007;8(9):582-4.
54. Torres SJ, McCabe M, Nowson CA. Depression, nutritional risk and eating
behaviour in older caregivers. J Nutr Health Aging. 2010;14(6):442-8.
55. Woo J, Ho SC, Sham A. Longitudinal changes in body mass index and body
composition over 3 years and relationship to health outcomes in Hong Kong Chinese age 70
and older. J Am Geriatr Soc. 2001;49(6):737-46.
56. Bhat RS, Chiu E, Jeste DV. Nutrition and geriatric psychiatry: a neglected field.
Current Opinion in Psychiatry. 2005;18(6):609-14.

57
57. Koster A, van Gool CH, Kempen GI, Penninx BW, Lee JS, Rubin SM, et al. Late-life
depressed mood and weight change contribute to the risk of each other. Am J Geriatr
Psychiatry. 2010;18(3):236-44.
58. Ho RC, Niti M, Kua EH, Ng TP. Body mass index, waist circumference, waist-hip
ratio and depressive symptoms in Chinese elderly: a population-based study. Int J Geriatr
Psychiatry. 2008;23(4):401-8.
59. Kim E, Song JH, Hwang JY, Ahn K, Kim J, Koh YH, et al. Obesity and depressive
symptoms in elderly Koreans: evidence for the "Jolly Fat" hypothesis from the Ansan
Geriatric (AGE) Study. Arch Gerontol Geriatr. 2010;51(2):231-4.
60. Li ZB, Ho SY, Chan WM, Ho KS, Li MP, Leung GM, et al. Obesity and depressive
symptoms in Chinese elderly. Int J Geriatr Psychiatry. 2004;19(1):68-74.
61. Almeida OP, Calver J, Jamrozik K, Hankey GJ, Flicker L. Obesity and metabolic
syndrome increase the risk of incident depression in older men: the health in men study. Am
J Geriatr Psychiatry. 2009;17(10):889-98.
62. Kostka T, Bogus K. Independent contribution of overweight/obesity and physical
inactivity to lower health-related quality of life in community-dwelling older subjects. Z
Gerontol Geriatr. 2007;40(1):43-51.
63. Kuriyama S, Koizumi Y, Matsuda-Ohmori K, Seki T, Shimazu T, Hozawa A, et al.
Obesity and depressive symptoms in elderly Japanese: the Tsurugaya Project. J Psychosom
Res. 2006;60(3):229-35.
64. Payne ME, Hybels CF, Bales CW, Steffens DC. Vascular nutritional correlates of
late-life depression. Am J Geriatr Psychiatry. 2006;14(9):787-95.
65. Sanchez-Villegas A, Delgado-Rodriguez M, Alonso A, Schlatter J, Lahortiga F,
Serra Majem L, et al. Association of the Mediterranean dietary pattern with the incidence of
depression: the Seguimiento Universidad de Navarra/University of Navarra follow-up (SUN)
cohort. Arch Gen Psychiatry. 2009;66(10):1090-8.
66. Sanchez-Villegas A, Henriquez P, Bes-Rastrollo M, Doreste J. Mediterranean diet
and depression. Public Health Nutr. 2006;9(8A):1104-9.
67. Kyrozis A, Psaltopoulou T, Stathopoulos P, Trichopoulos D, Vassilopoulos D,
Trichopoulou A. Dietary lipids and geriatric depression scale score among elders: the EPIC-
Greece cohort. J Psychiatr Res. 2009;43(8):763-9.
68. Tanskanen A, Hibbeln JR, Tuomilehto J, Uutela A, Haukkala A, Viinamaki H, et al.
Fish consumption and depressive symptoms in the general population in Finland. Psychiatr
Serv. 2001;52(4):529-31.
58
69. Peet M. International variations in the outcome of schizophrenia and the prevalence
of depression in relation to national dietary practices: an ecological analysis. Br J Psychiatry.
2004;184:404-8.
70. McIntosh A, Lawrie S. Cross-national differences in diet, the outcome of
schizophrenia and the prevalence of depression: you are (associated with) what you eat. Br J
Psychiatry. 2004;184:381-2.
71. Tiemeier H, van Tuijl HR, Hofman A, Kiliaan AJ, Breteler MM. Plasma fatty acid
composition and depression are associated in the elderly: the Rotterdam Study. Am J Clin
Nutr. 2003;78(1):40-6.
72. Bots S, Tijhuis M, Giampaoli S, Kromhout D, Nissinen A. Lifestyle- and diet-related
factors in late-life depression—a 5-year follow-up of elderly European men: the FINE study.
International Journal of Geriatric Psychiatry. 2008;23(5):478-84.
73. Hibbeln JR, Salem N, Jr. Dietary polyunsaturated fatty acids and depression: when
cholesterol does not satisfy. Am J Clin Nutr. 1995;62(1):1-9.
74. Akbaraly TN, Brunner EJ, Ferrie JE, Marmot MG, Kivimaki M, Singh-Manoux A.
Dietary pattern and depressive symptoms in middle age. Br J Psychiatry. 2009;195(5):408-
13.
75. Jacka FN, Pasco JA, Mykletun A, Williams LJ, Hodge AM, O'Reilly SL, et al.
Association of Western and traditional diets with depression and anxiety in women. Am J
Psychiatry. 2010;167(3):305-11.
76. Beezhold BL, Johnston CS, Daigle DR. Vegetarian diets are associated with healthy
mood states: a cross-sectional study in seventh day adventist adults. Nutr J. 2010;9:26.
77. Owen C, Rees A-M, Parker G. The role of fatty acids in the development and
treatment of mood disorders. Current Opinion in Psychiatry. 2008;21(1):19-24
10.1097/YCO.0b013e3282f29841.
78. Rogers PJ. A healthy body, a healthy mind: long-term impact of diet on mood and
cognitive function. Proc Nutr Soc. 2001;60(1):135-43.
79. Timonen M, Horrobin D, Jokelainen J, Laitinen J, Herva A, Rasanen P. Fish
consumption and depression: the Northern Finland 1966 birth cohort study. J Affect Disord.
2004;82(3):447-52.
80. Kesaniemi YK, Danforth E, Jr., Jensen MD, Kopelman PG, Lefebvre P, Reeder BA.
Dose-response issues concerning physical activity and health: an evidence-based
symposium. Med Sci Sports Exerc. 2001;33(6 Suppl):S351-8.
81. Rockwood K, Middleton L. Physical activity and the maintenance of cognitive
function. Alzheimer's and Dementia. 2007;3(2, Supplement 1):S38-S44.
59
82. Lautenschlager NT, Almeida OP. Physical activity and cognition in old age. Current
Opinion in Psychiatry. 2006;19(2):190-3 10.1097/01.yco.0000214347.38787.37.
83. Paluska SA, Schwenk TL. Physical activity and mental health: current concepts.
Sports Med. 2000;29(3):167-80.
84. Duman RS. Neurotrophic factors and regulation of mood: role of exercise, diet and
metabolism. Neurobiol Aging. 2005;26 Suppl 1:88-93.
85. Cassidy K, Kotynia-English R, Acres J, Flicker L, Lautenschlager NT, Almeida OP.
Association between lifestyle factors and mental health measures among community-
dwelling older women. Australian and New Zealand Journal of Psychiatry. 2004;38(11-
12):940-7.
86. Kritz-Silverstein D, Barrett-Connor E, Corbeau C. Cross-sectional and prospective
study of exercise and depressed mood in the elderly : the Rancho Bernardo study. Am J
Epidemiol. 2001;153(6):596-603.
87. Camacho TC, Roberts RE, Lazarus NB, Kaplan GA, Cohen RD. Physical activity
and depression: evidence from the Alameda County Study. Am J Epidemiol.
1991;134(2):220-31.
88. Strawbridge W, Shema S. Impact of spouses‘ sleep problems on partners. Sleep.
2004;3(527-531).
89. Brown WJ, Ford JH, Burton NW, Marshall AL, Dobson AJ. Prospective study of
physical activity and depressive symptoms in middle-aged women. Am J Prev Med.
2005;29(4):265-72.
90. Wiles NJ, Haase AM, Gallacher J, Lawlor DA, Lewis G. Physical activity and
common mental disorder: results from the Caerphilly study. Am J Epidemiol.
2007;165(8):946-54.
91. Wise LA, Adams-Campbell LL, Palmer JR, Rosenberg L. Leisure time physical
activity in relation to depressive symptoms in the Black Women's Health Study. Ann Behav
Med. 2006;32(1):68-76.
92. Ku PW, Fox KR, Chen LJ. Physical activity and depressive symptoms in Taiwanese
older adults: a seven-year follow-up study. Prev Med. 2009;48(3):250-5.
93. Heesch KC, Burton NW, Brown WJ. Concurrent and prospective associations
between physical activity, walking and mental health in older women. Journal of
Epidemiology and Community Health. 2010.
94. Scarmeas N, Levy G, Tang MX, Manly J, Stern Y. Influence of leisure activity on
the incidence of Alzheimer's disease. Neurology. 2001;57(12):2236-42.
60
95. Glass TA, de Leon CM, Marottoli RA, Berkman LF. Population based study of social
and productive activities as predictors of survival among elderly Americans. Bmj.
1999;319(7208):478-83.
96. Farmer ME, Locke BZ, Moscicki EK, Dannenberg AL, Larson DB, Radloff LS.
Physical activity and depressive symptoms: the NHANES I Epidemiologic Follow-up Study.
Am J Epidemiol. 1988;128(6):1340-51.
97. Peluso MA, Guerra de Andrade LH. Physical activity and mental health: the
association between exercise and mood. Clinics (Sao Paulo). 2005;60(1):61-70.
98. De Moor MH, Boomsma DI, Stubbe JH, Willemsen G, de Geus EJ. Testing causality
in the association between regular exercise and symptoms of anxiety and depression. Arch
Gen Psychiatry. 2008;65(8):897-905.
99. Reynolds P, Kaplan G. . Social connections and risk for cancer: Prospective evidence
from the Alameda County Study Behav Med. 1990;31(2):101-10.
100. Demura S, Sato S. Relationships between depression, lifestyle and quality of life in
the community dwelling elderly: a comparison between gender and age groups. J Physiol
Anthropol Appl Human Sci. 2003;22(3):159-66.
101. Kim J-I, Choe M-A, Chae YR. Prevalence and Predictors of Geriatric Depression in
Community-Dwelling Elderly. Asian Nursing Research. 2009;3(3):121-9.
102. Singh A, Misra N. Loneliness, depression and sociability in old age. Industrial
psychiatry Journal. 2010;18(1):51-5.
103. Gautam R, Saito T, Kai I. Leisure and religious activity participation and mental
health: gender analysis of older adults in Nepal. BMC Public Health. 2007;7:299.
104. Hahn CY, Yang MS, Yang MJ, Shih CH, Lo HY. Religious attendance and
depressive symptoms among community dwelling elderly in Taiwan. Int J Geriatr
Psychiatry. 2004;19(12):1148-54.
105. Kennedy GJ, Kelman HR, Thomas C, Chen J. The relation of religious preference
and practice to depressive symptoms among 1,855 older adults. J Gerontol B Psychol Sci
Soc Sci. 1996;51(6):P301-8.
106. van Gool CH, Kempen GI, Penninx BW, Deeg DJ, Beekman AT, van Eijk JT.
Relationship between changes in depressive symptoms and unhealthy lifestyles in late
middle aged and older persons: results from the Longitudinal Aging Study Amsterdam. Age
Ageing. 2003;32(1):81-7.
107. American-Psychiatric-Association, editor. Diagnostic and Statistical Manual of
Mental Disorders. 4th ed Text Revision ed. Washington, DC2000.
61
108. Ganguli M, Ratcliff G, Chandra V, Sharma S, Gilby J, Pandav R, et al. A hindi
version of the MMSE: The development of a cognitive screening instrument for a largely
illiterate rural elderly population in india. International Journal of Geriatric Psychiatry.
1995;10(5):367-77.
109. Sheehan DV, Lecrubier Y, Harnett Sheehan K, Janavs J, Weiller E, Keskiner A, et al.
The validity of the Mini International Neuropsychiatric Interview (MINI) according to the
SCID-P and its reliability. European Psychiatry. 1997;12(5):232-41.
110. Hamilton M. A rating scale for depression. J Neurol Neurosurg Psychiatry.
1960;23:56-62.
111. Hachinski VC, Iliff LD, Zilhka E, Du Boulay GH, McAllister VL, Marshall J, et al.
Cerebral blood flow in dementia. Arch Neurol. 1975;32(9):632-7.
112. Miller MD, Paradis CF, Houck PR, Mazumdar S, Stack JA, Rifai AH, et al. Rating
chronic medical illness burden in geropsychiatric practice and research: application of the
Cumulative Illness Rating Scale. Psychiatry Res. 1992;41(3):237-48.
113. Prince M, Ferri C, Acosta D, Albanese E, Arizaga R, Dewey M, et al. The protocols
for the 10/66 dementia research group population-based research programme. BMC Public
Health. 2007;7(1):165.
114. Allison MT, Geiger CW. Nature of leisure activities among the Chinese-American
elderly. Leisure Sciences: An Interdisciplinary Journal. 1993;15(4):309 - 19.
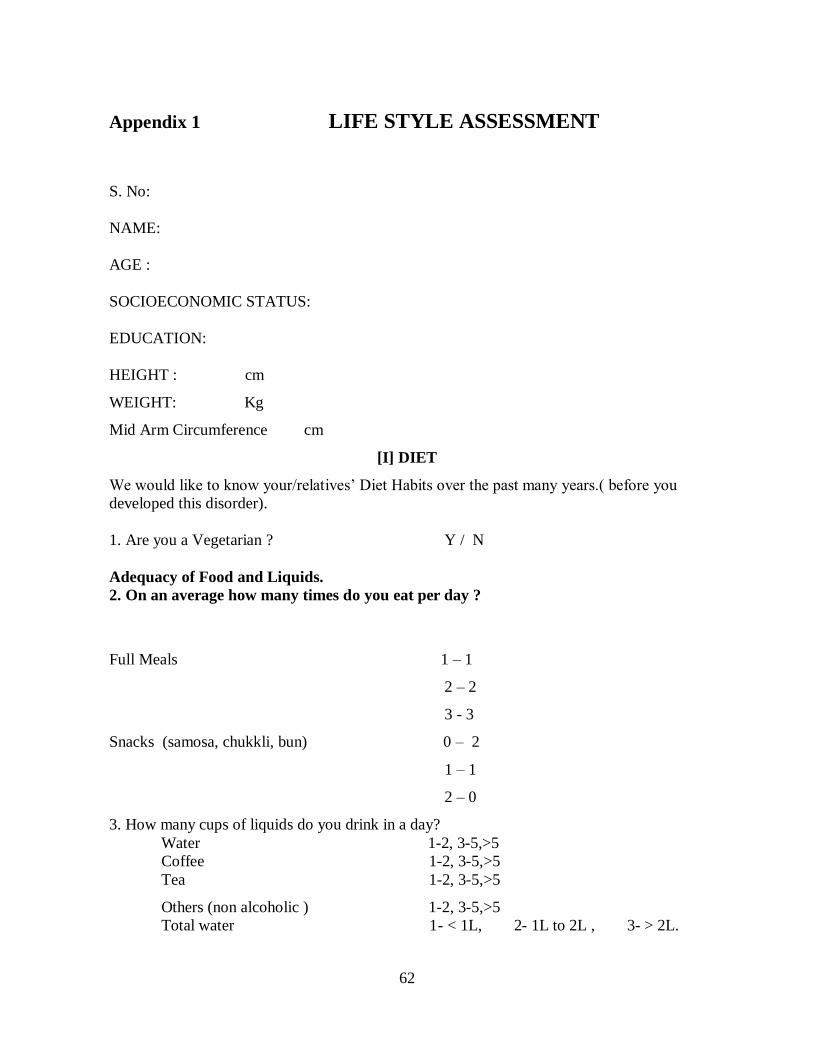
62
Appendix 1 LIFE STYLE ASSESSMENT
S. No:
NAME:
AGE :
SOCIOECONOMIC STATUS:
EDUCATION:
HEIGHT : cm
WEIGHT: Kg
Mid Arm Circumference cm
[I] DIET
We would like to know your/relatives‘ Diet Habits over the past many years.( before you
developed this disorder).
1. Are you a Vegetarian ? Y / N
Adequacy of Food and Liquids.
2. On an average how many times do you eat per day ?
Full Meals 1 – 1
2 – 2
3 - 3
Snacks (samosa, chukkli, bun) 0 – 2
1 – 1
2 – 0
3. How many cups of liquids do you drink in a day?
Water 1-2, 3-5,>5
Coffee 1-2, 3-5,>5
Tea 1-2, 3-5,>5
Others (non alcoholic ) 1-2, 3-5,>5
Total water 1- < 1L, 2- 1L to 2L , 3- > 2L.
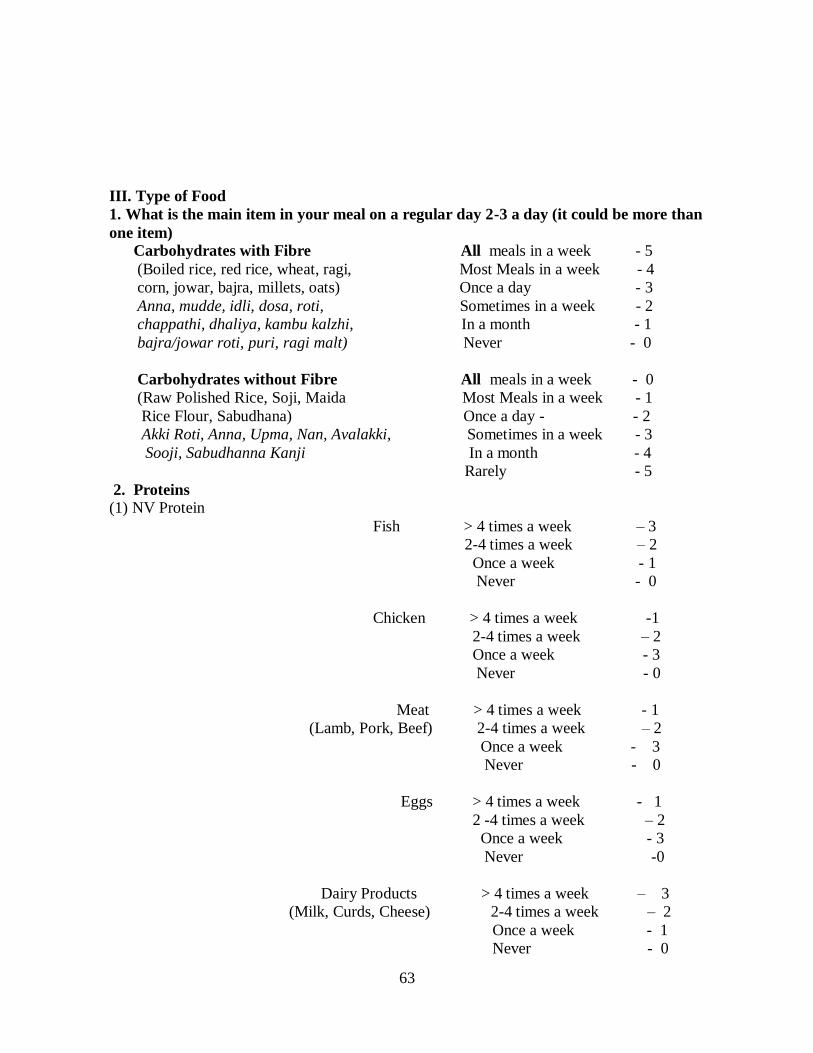
63
III. Type of Food
1. What is the main item in your meal on a regular day 2-3 a day (it could be more than
one item)
Carbohydrates with Fibre All meals in a week - 5
(Boiled rice, red rice, wheat, ragi, Most Meals in a week - 4
corn, jowar, bajra, millets, oats) Once a day - 3
Anna, mudde, idli, dosa, roti, Sometimes in a week - 2
chappathi, dhaliya, kambu kalzhi, In a month - 1
bajra/jowar roti, puri, ragi malt) Never - 0
Carbohydrates without Fibre All meals in a week - 0
(Raw Polished Rice, Soji, Maida Most Meals in a week - 1
Rice Flour, Sabudhana) Once a day - - 2
Akki Roti, Anna, Upma, Nan, Avalakki, Sometimes in a week - 3
Sooji, Sabudhanna Kanji In a month - 4
Rarely - 5
2. Proteins
(1) NV Protein
Fish > 4 times a week – 3
2-4 times a week – 2
Once a week - 1
Never - 0
Chicken > 4 times a week -1
2-4 times a week – 2
Once a week - 3
Never - 0
Meat > 4 times a week - 1
(Lamb, Pork, Beef) 2-4 times a week – 2
Once a week - 3
Never - 0
Eggs > 4 times a week - 1
2 -4 times a week – 2
Once a week - 3
Never -0
Dairy Products > 4 times a week – 3
(Milk, Curds, Cheese) 2-4 times a week – 2
Once a week - 1
Never - 0
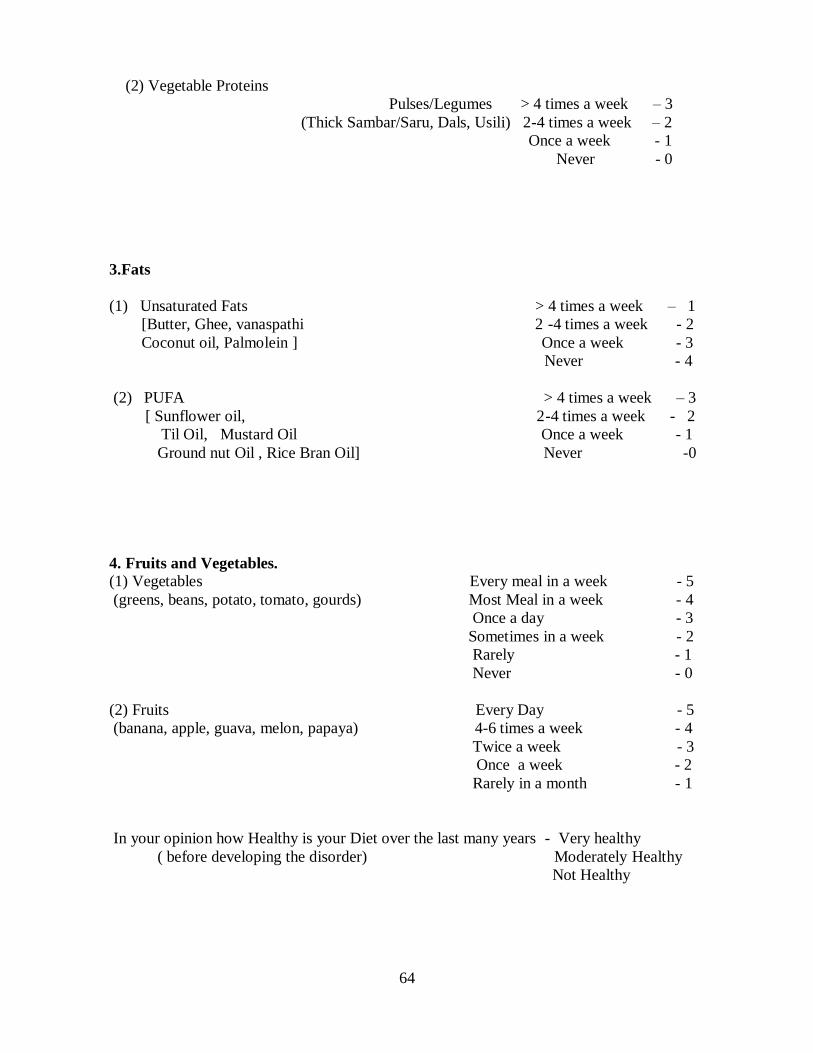
64
(2) Vegetable Proteins
Pulses/Legumes > 4 times a week – 3
(Thick Sambar/Saru, Dals, Usili) 2-4 times a week – 2
Once a week - 1
Never - 0
3.Fats
(1) Unsaturated Fats > 4 times a week – 1
[Butter, Ghee, vanaspathi 2 -4 times a week - 2
Coconut oil, Palmolein ] Once a week - 3
Never - 4
(2) PUFA > 4 times a week – 3
[ Sunflower oil, 2-4 times a week - 2
Til Oil, Mustard Oil Once a week - 1
Ground nut Oil , Rice Bran Oil] Never -0
4. Fruits and Vegetables.
(1) Vegetables Every meal in a week - 5
(greens, beans, potato, tomato, gourds) Most Meal in a week - 4
Once a day - 3
Sometimes in a week - 2
Rarely - 1
Never - 0
(2) Fruits Every Day - 5
(banana, apple, guava, melon, papaya) 4-6 times a week - 4
Twice a week - 3
Once a week - 2
Rarely in a month - 1
In your opinion how Healthy is your Diet over the last many years - Very healthy
( before developing the disorder) Moderately Healthy
Not Healthy
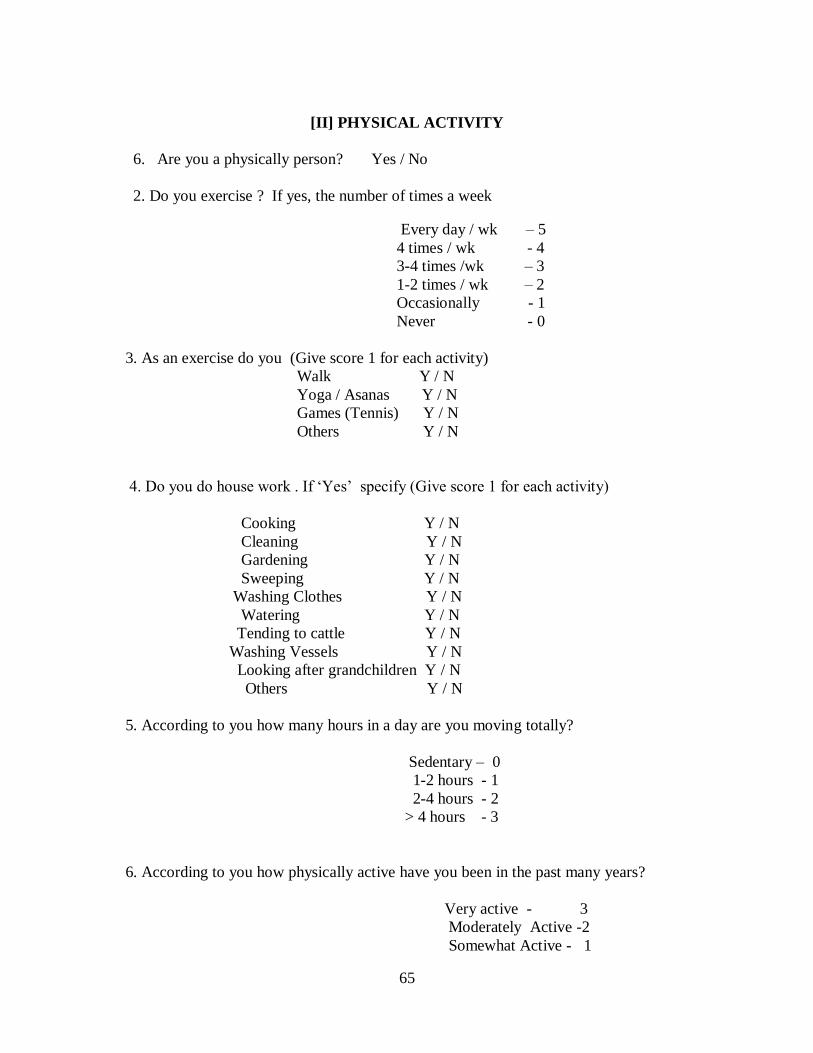
65
[II] PHYSICAL ACTIVITY
6. Are you a physically person? Yes / No
2. Do you exercise ? If yes, the number of times a week
Every day / wk – 5
4 times / wk - 4
3-4 times /wk – 3
1-2 times / wk – 2
Occasionally - 1
Never - 0
3. As an exercise do you (Give score 1 for each activity)
Walk Y / N
Yoga / Asanas Y / N
Games (Tennis) Y / N
Others Y / N
4. Do you do house work . If ‗Yes‘ specify (Give score 1 for each activity)
Cooking Y / N
Cleaning Y / N
Gardening Y / N
Sweeping Y / N
Washing Clothes Y / N
Watering Y / N
Tending to cattle Y / N
Washing Vessels Y / N
Looking after grandchildren Y / N
Others Y / N
5. According to you how many hours in a day are you moving totally?
Sedentary – 0
1-2 hours - 1
2-4 hours - 2
> 4 hours - 3
6. According to you how physically active have you been in the past many years?
Very active - 3
Moderately Active -2
Somewhat Active - 1
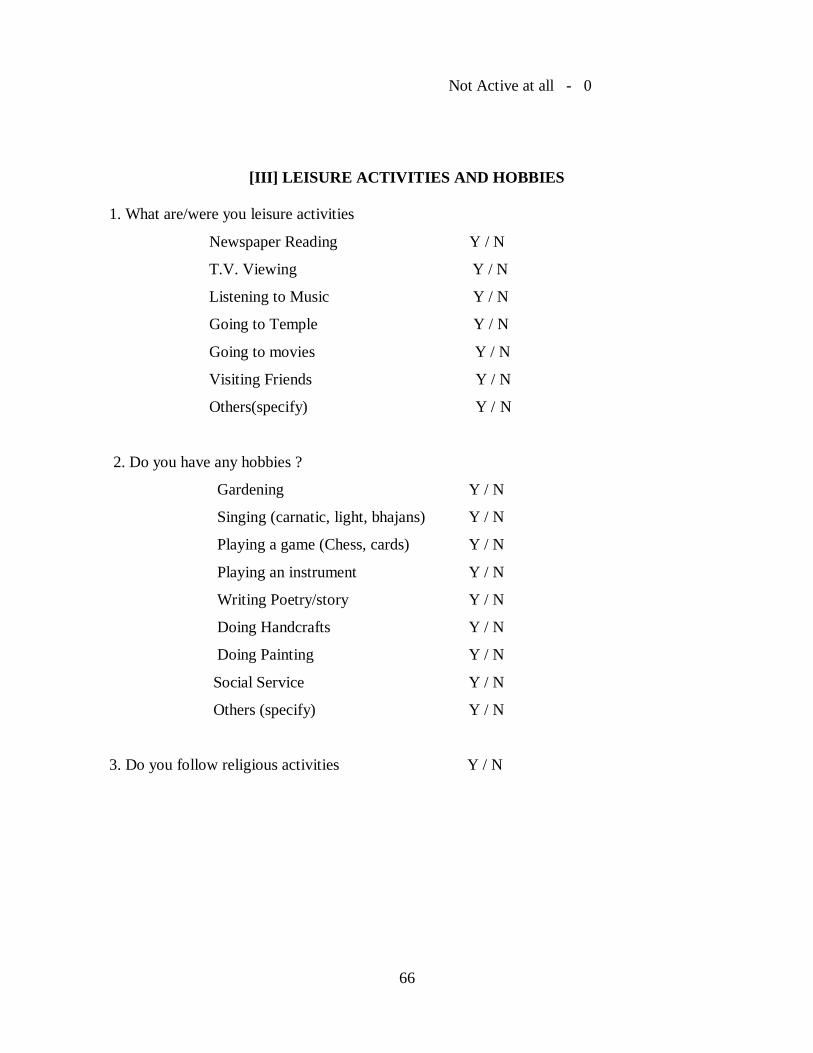
66
Not Active at all - 0
[III] LEISURE ACTIVITIES AND HOBBIES
1. What are/were you leisure activities
Newspaper Reading Y / N
T.V. Viewing Y / N
Listening to Music Y / N
Going to Temple Y / N
Going to movies Y / N
Visiting Friends Y / N
Others(specify) Y / N
2. Do you have any hobbies ?
Gardening Y / N
Singing (carnatic, light, bhajans) Y / N
Playing a game (Chess, cards) Y / N
Playing an instrument Y / N
Writing Poetry/story Y / N
Doing Handcrafts Y / N
Doing Painting Y / N
Social Service Y / N
Others (specify) Y / N
3. Do you follow religious activities Y / N
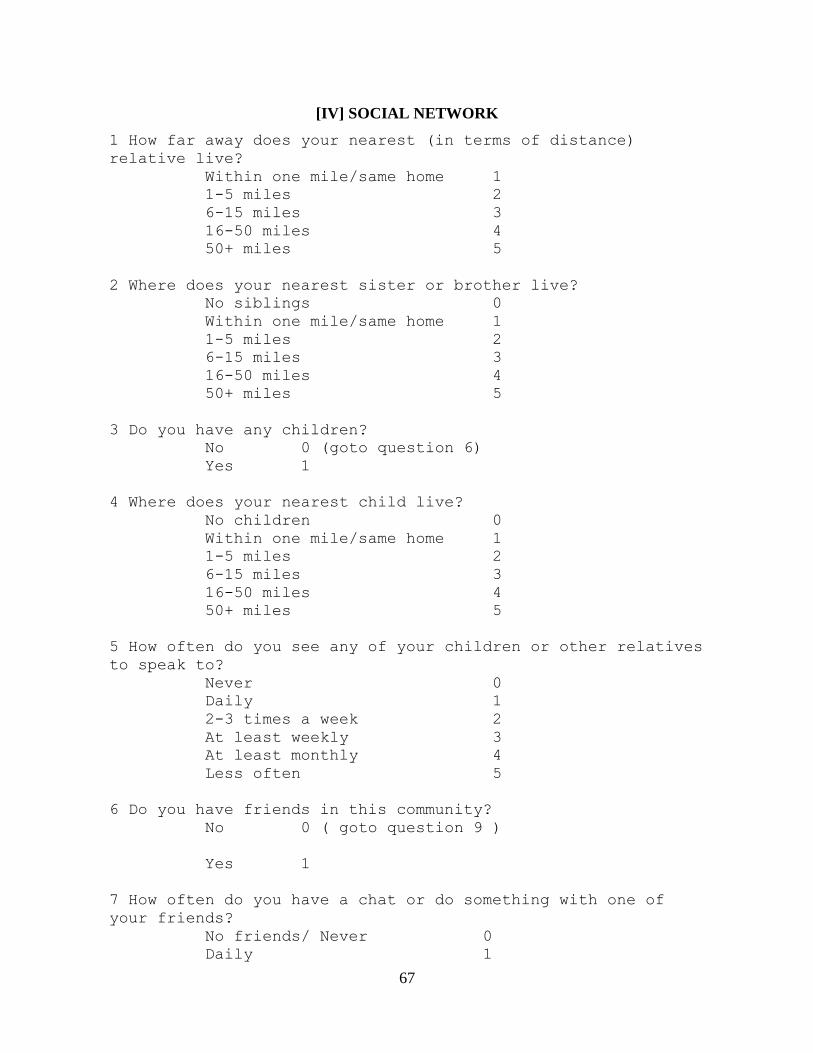
67
[IV] SOCIAL NETWORK
1 How far away does your nearest (in terms of distance)
relative live?
Within one mile/same home 1
1-5 miles 2
6-15 miles 3
16-50 miles 4
50+ miles 5
2 Where does your nearest sister or brother live?
No siblings 0
Within one mile/same home 1
1-5 miles 2
6-15 miles 3
16-50 miles 4
50+ miles 5
3 Do you have any children?
No 0 (goto question 6)
Yes 1
4 Where does your nearest child live?
No children 0
Within one mile/same home 1
1-5 miles 2
6-15 miles 3
16-50 miles 4
50+ miles 5
5 How often do you see any of your children or other relatives
to speak to?
Never 0
Daily 1
2-3 times a week 2
At least weekly 3
At least monthly 4
Less often 5
6 Do you have friends in this community?
No 0 ( goto question 9 )
Yes 1
7 How often do you have a chat or do something with one of
your friends?
No friends/ Never 0
Daily 1
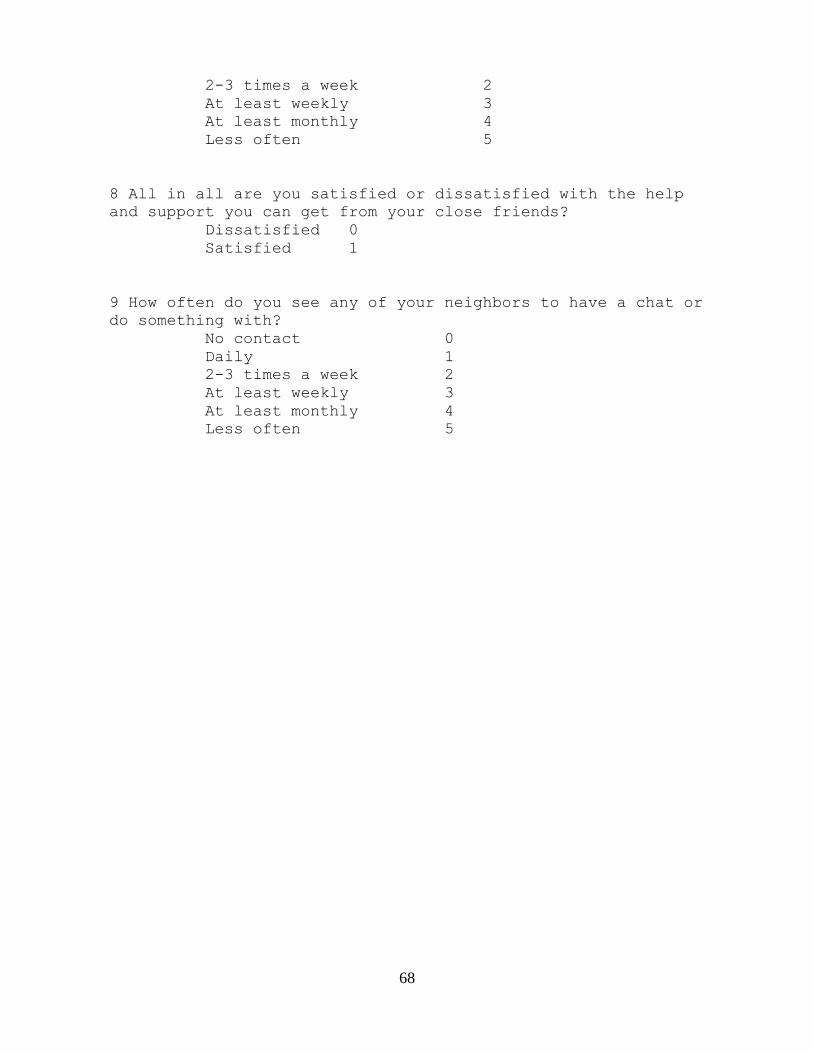
68
2-3 times a week 2
At least weekly 3
At least monthly 4
Less often 5
8 All in all are you satisfied or dissatisfied with the help
and support you can get from your close friends?
Dissatisfied 0
Satisfied 1
9 How often do you see any of your neighbors to have a chat or
do something with?
No contact 0
Daily 1
2-3 times a week 2
At least weekly 3
At least monthly 4
Less often 5
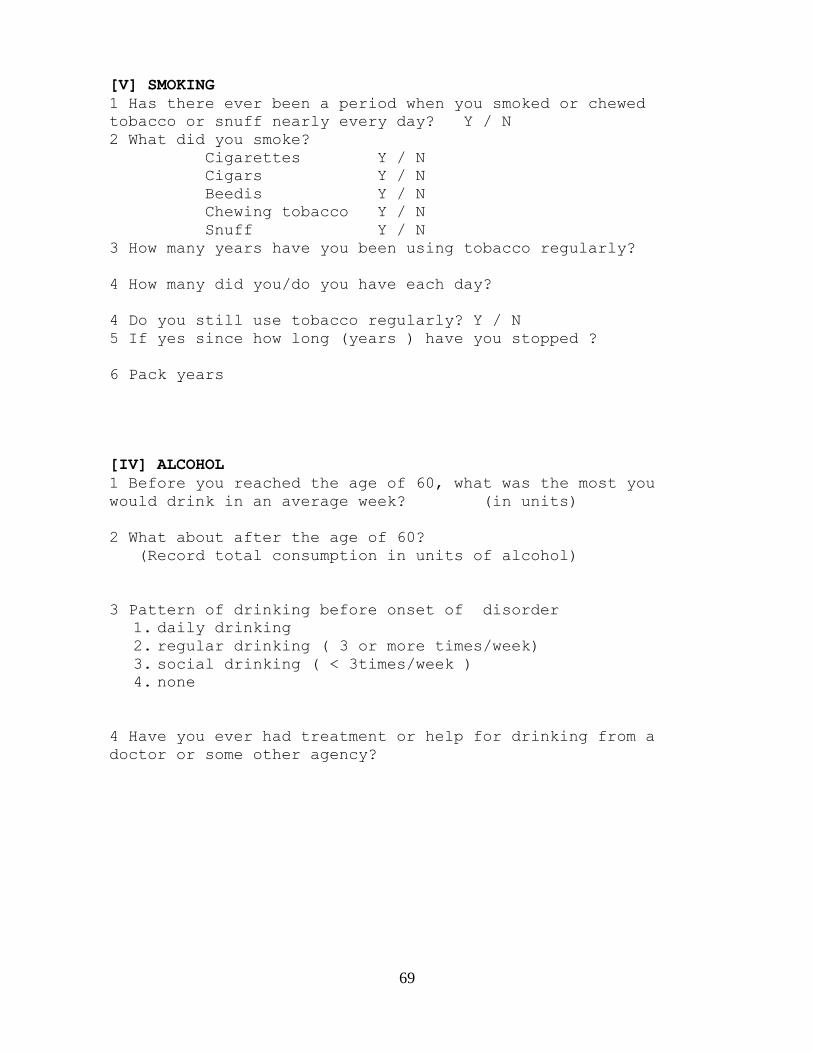
69
[V] SMOKING
1 Has there ever been a period when you smoked or chewed
tobacco or snuff nearly every day? Y / N
2 What did you smoke?
Cigarettes Y / N
Cigars Y / N
Beedis Y / N
Chewing tobacco Y / N
Snuff Y / N
3 How many years have you been using tobacco regularly?
4 How many did you/do you have each day?
4 Do you still use tobacco regularly? Y / N
5 If yes since how long (years ) have you stopped ?
6 Pack years
[IV] ALCOHOL
1 Before you reached the age of 60, what was the most you
would drink in an average week? (in units)
2 What about after the age of 60?
(Record total consumption in units of alcohol)
3 Pattern of drinking before onset of disorder
1. daily drinking 2. regular drinking ( 3 or more times/week) 3. social drinking ( < 3times/week ) 4. none
4 Have you ever had treatment or help for drinking from a
doctor or some other agency?
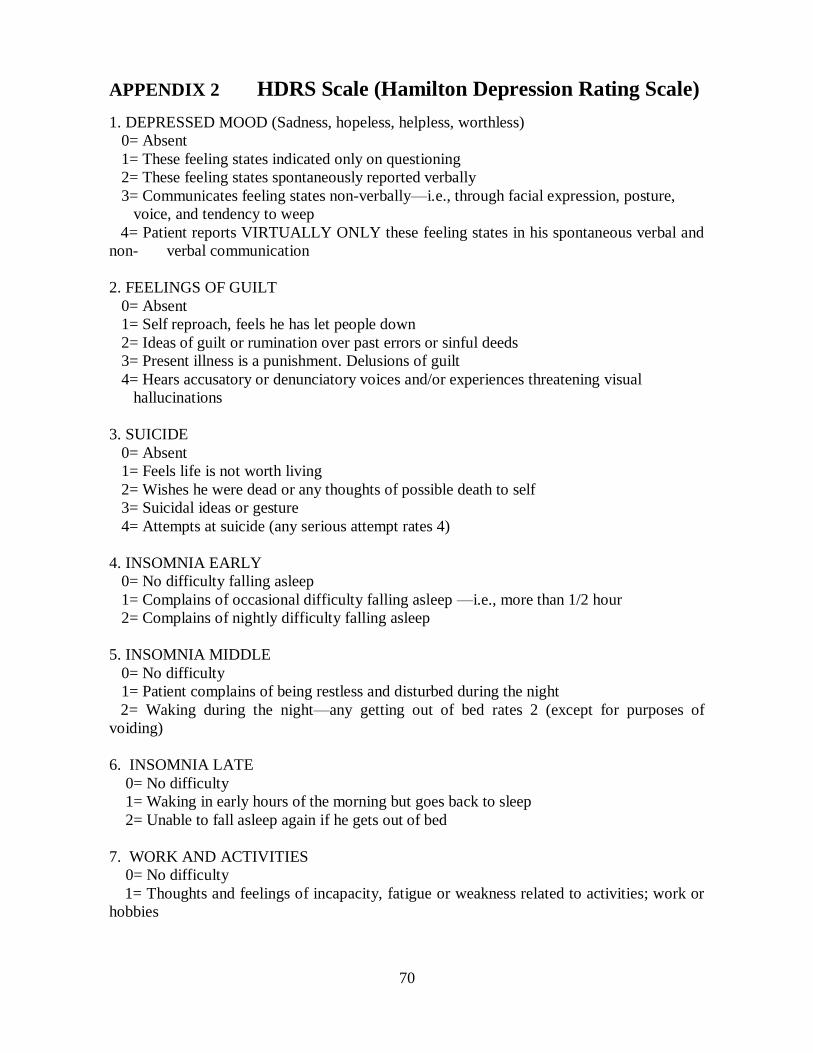
70
APPENDIX 2 HDRS Scale (Hamilton Depression Rating Scale)
1. DEPRESSED MOOD (Sadness, hopeless, helpless, worthless)
0= Absent
1= These feeling states indicated only on questioning
2= These feeling states spontaneously reported verbally
3= Communicates feeling states non-verbally—i.e., through facial expression, posture,
voice, and tendency to weep
4= Patient reports VIRTUALLY ONLY these feeling states in his spontaneous verbal and
non- verbal communication
2. FEELINGS OF GUILT
0= Absent
1= Self reproach, feels he has let people down
2= Ideas of guilt or rumination over past errors or sinful deeds
3= Present illness is a punishment. Delusions of guilt
4= Hears accusatory or denunciatory voices and/or experiences threatening visual
hallucinations
3. SUICIDE
0= Absent
1= Feels life is not worth living
2= Wishes he were dead or any thoughts of possible death to self
3= Suicidal ideas or gesture
4= Attempts at suicide (any serious attempt rates 4)
4. INSOMNIA EARLY
0= No difficulty falling asleep
1= Complains of occasional difficulty falling asleep —i.e., more than 1/2 hour
2= Complains of nightly difficulty falling asleep
5. INSOMNIA MIDDLE
0= No difficulty
1= Patient complains of being restless and disturbed during the night
2= Waking during the night—any getting out of bed rates 2 (except for purposes of
voiding)
6. INSOMNIA LATE
0= No difficulty
1= Waking in early hours of the morning but goes back to sleep
2= Unable to fall asleep again if he gets out of bed
7. WORK AND ACTIVITIES
0= No difficulty
1= Thoughts and feelings of incapacity, fatigue or weakness related to activities; work or
hobbies
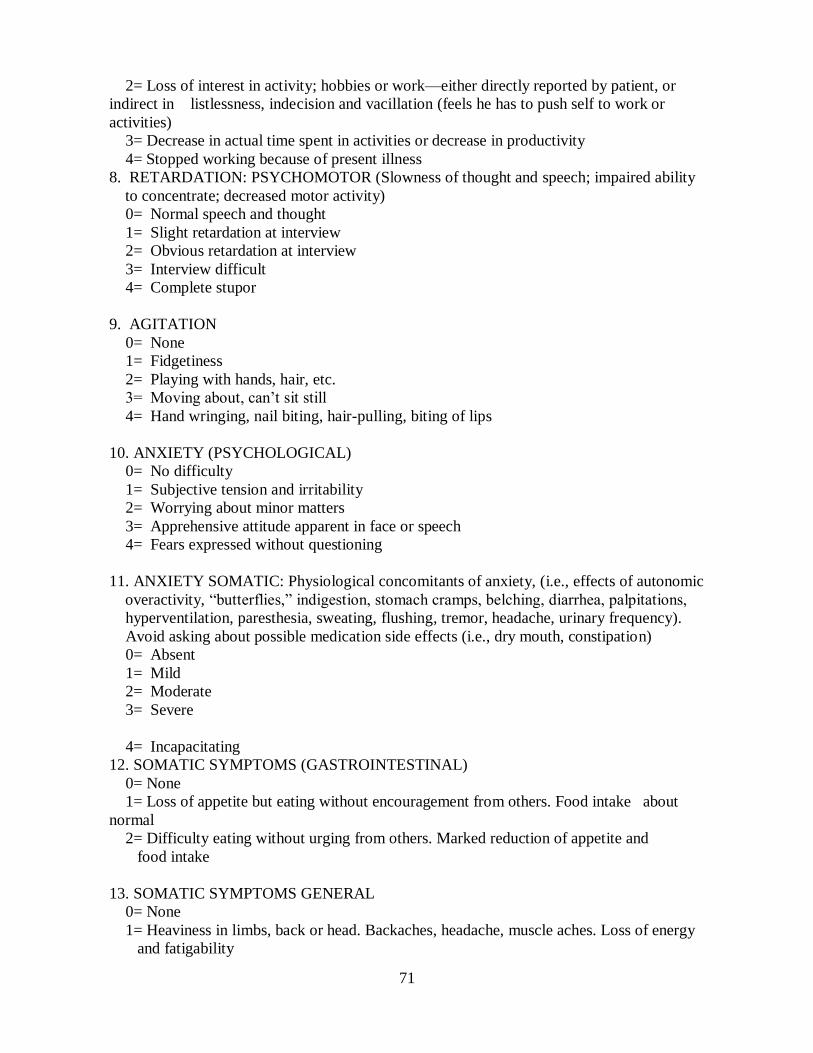
71
2= Loss of interest in activity; hobbies or work—either directly reported by patient, or
indirect in listlessness, indecision and vacillation (feels he has to push self to work or
activities)
3= Decrease in actual time spent in activities or decrease in productivity
4= Stopped working because of present illness
8. RETARDATION: PSYCHOMOTOR (Slowness of thought and speech; impaired ability
to concentrate; decreased motor activity)
0= Normal speech and thought
1= Slight retardation at interview
2= Obvious retardation at interview
3= Interview difficult
4= Complete stupor
9. AGITATION
0= None
1= Fidgetiness
2= Playing with hands, hair, etc.
3= Moving about, can‘t sit still
4= Hand wringing, nail biting, hair-pulling, biting of lips
10. ANXIETY (PSYCHOLOGICAL)
0= No difficulty
1= Subjective tension and irritability
2= Worrying about minor matters
3= Apprehensive attitude apparent in face or speech
4= Fears expressed without questioning
11. ANXIETY SOMATIC: Physiological concomitants of anxiety, (i.e., effects of autonomic
overactivity, ―butterflies,‖ indigestion, stomach cramps, belching, diarrhea, palpitations,
hyperventilation, paresthesia, sweating, flushing, tremor, headache, urinary frequency).
Avoid asking about possible medication side effects (i.e., dry mouth, constipation)
0= Absent
1= Mild
2= Moderate
3= Severe
4= Incapacitating
12. SOMATIC SYMPTOMS (GASTROINTESTINAL)
0= None
1= Loss of appetite but eating without encouragement from others. Food intake about
normal
2= Difficulty eating without urging from others. Marked reduction of appetite and
food intake
13. SOMATIC SYMPTOMS GENERAL
0= None
1= Heaviness in limbs, back or head. Backaches, headache, muscle aches. Loss of energy
and fatigability
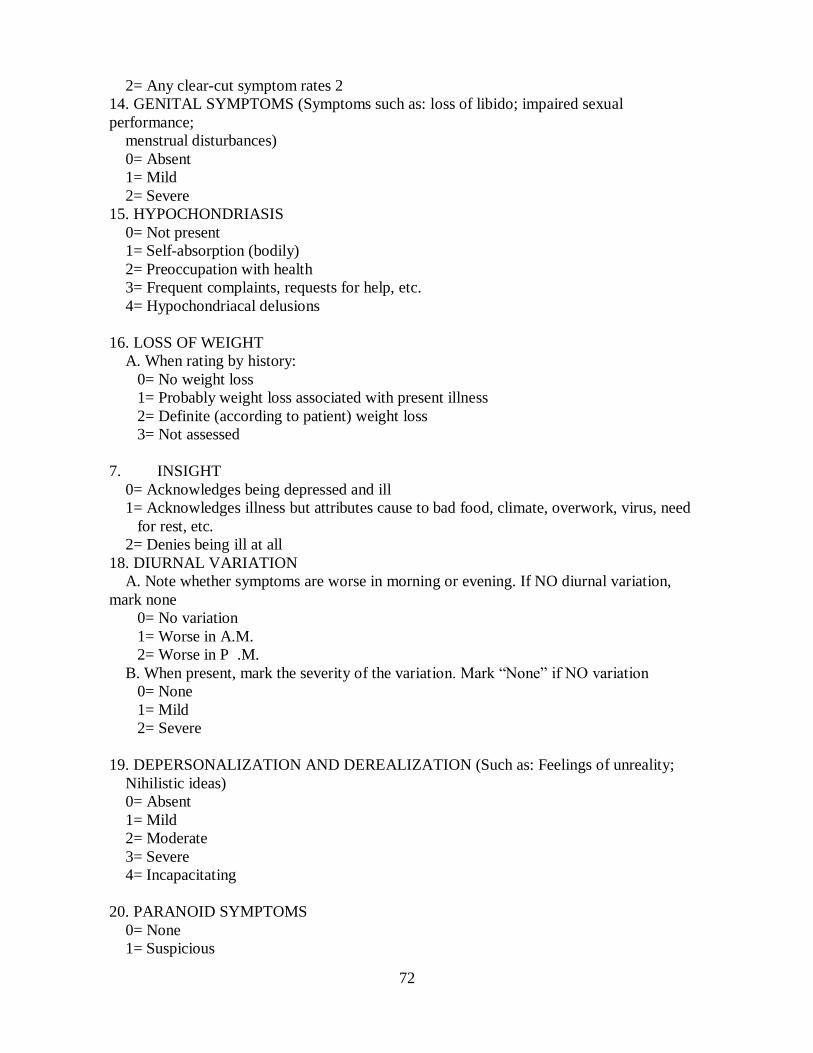
72
2= Any clear-cut symptom rates 2
14. GENITAL SYMPTOMS (Symptoms such as: loss of libido; impaired sexual
performance;
menstrual disturbances)
0= Absent
1= Mild
2= Severe
15. HYPOCHONDRIASIS
0= Not present
1= Self-absorption (bodily)
2= Preoccupation with health
3= Frequent complaints, requests for help, etc.
4= Hypochondriacal delusions
16. LOSS OF WEIGHT
A. When rating by history:
0= No weight loss
1= Probably weight loss associated with present illness
2= Definite (according to patient) weight loss
3= Not assessed
7. INSIGHT
0= Acknowledges being depressed and ill
1= Acknowledges illness but attributes cause to bad food, climate, overwork, virus, need
for rest, etc.
2= Denies being ill at all
18. DIURNAL VARIATION
A. Note whether symptoms are worse in morning or evening. If NO diurnal variation,
mark none
0= No variation
1= Worse in A.M.
2= Worse in P .M.
B. When present, mark the severity of the variation. Mark ―None‖ if NO variation
0= None
1= Mild
2= Severe
19. DEPERSONALIZATION AND DEREALIZATION (Such as: Feelings of unreality;
Nihilistic ideas)
0= Absent
1= Mild
2= Moderate
3= Severe
4= Incapacitating
20. PARANOID SYMPTOMS
0= None
1= Suspicious
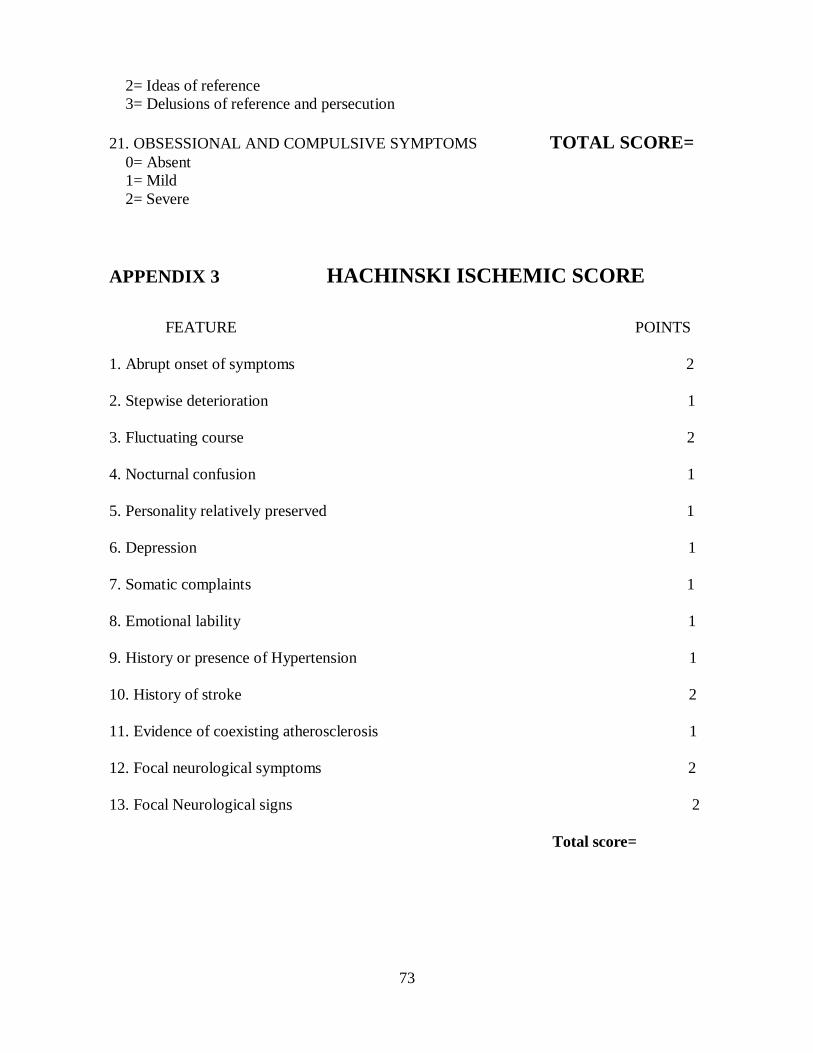
73
2= Ideas of reference
3= Delusions of reference and persecution
21. OBSESSIONAL AND COMPULSIVE SYMPTOMS TOTAL SCORE=
0= Absent
1= Mild
2= Severe
APPENDIX 3 HACHINSKI ISCHEMIC SCORE
FEATURE POINTS
1. Abrupt onset of symptoms 2
2. Stepwise deterioration 1
3. Fluctuating course 2
4. Nocturnal confusion 1
5. Personality relatively preserved 1
6. Depression 1
7. Somatic complaints 1
8. Emotional lability 1
9. History or presence of Hypertension 1
10. History of stroke 2
11. Evidence of coexisting atherosclerosis 1
12. Focal neurological symptoms 2
13. Focal Neurological signs 2
Total score=
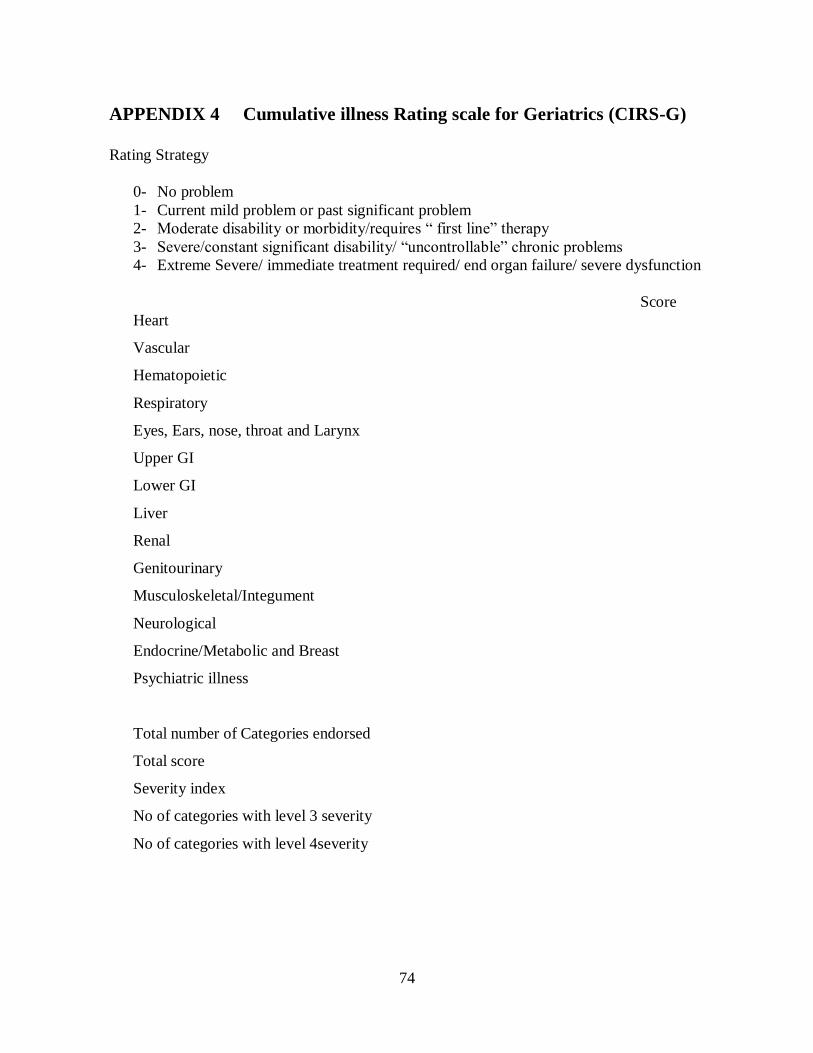
74
APPENDIX 4 Cumulative illness Rating scale for Geriatrics (CIRS-G)
Rating Strategy
0- No problem
1- Current mild problem or past significant problem
2- Moderate disability or morbidity/requires ― first line‖ therapy
3- Severe/constant significant disability/ ―uncontrollable‖ chronic problems
4- Extreme Severe/ immediate treatment required/ end organ failure/ severe dysfunction
Score
Heart
Vascular
Hematopoietic
Respiratory
Eyes, Ears, nose, throat and Larynx
Upper GI
Lower GI
Liver
Renal
Genitourinary
Musculoskeletal/Integument
Neurological
Endocrine/Metabolic and Breast
Psychiatric illness
Total number of Categories endorsed
Total score
Severity index
No of categories with level 3 severity
No of categories with level 4severity
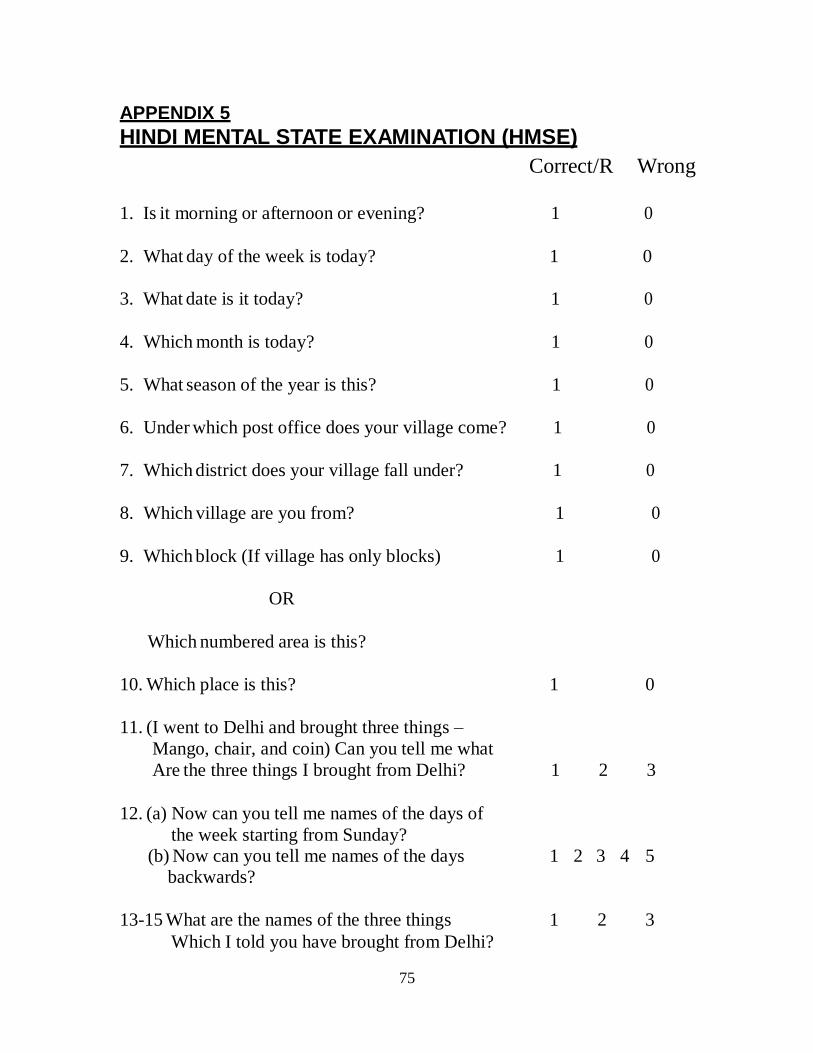
75
APPENDIX 5
HINDI MENTAL STATE EXAMINATION (HMSE)
Correct/R Wrong
1. Is it morning or afternoon or evening? 1 0
2.
What day of the week is today?
1
0
3.
What date is it today?
1
0
4.
Which month is today?
1
0
5.
What season of the year is this?
1
0
6.
Under which post office does your village come?
1
0
7.
Which district does your village fall under?
1
0
8.
Which village are you from?
1
0
9.
Which block (If village has only blocks)
1
0
OR
Which numbered area is this?
10. Which place is this? 1 0
11. (I went to Delhi and brought three things –
Mango, chair, and coin) Can you tell me what
Are the three things I brought from Delhi? 1 2 3
12. (a) Now can you tell me names of the days of
the week starting from Sunday?
(b) Now can you tell me names of the days 1 2 3 4 5
backwards?
13-15 What are the names of the three things 1 2 3
Which I told you have brought from Delhi?
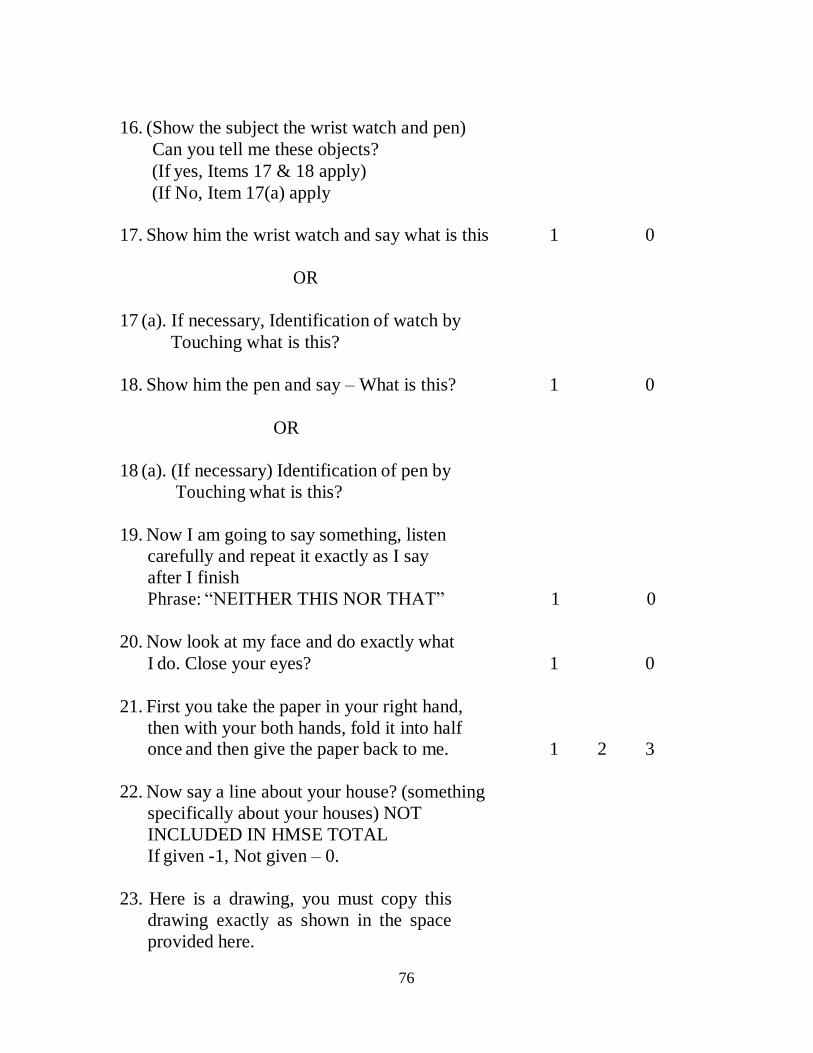
76
16. (Show the subject the wrist watch and pen)
Can you tell me these objects?
(If yes, Items 17 & 18 apply)
(If No, Item 17(a) apply
17. Show him the wrist watch and say what is this 1 0
OR
17 (a). If necessary, Identification of watch by
Touching what is this?
18. Show him the pen and say – What is this? 1 0
OR
18 (a). (If necessary) Identification of pen by
Touching what is this?
19. Now I am going to say something, listen
carefully and repeat it exactly as I say
after I finish
Phrase: ―NEITHER THIS NOR THAT‖ 1 0
20. Now look at my face and do exactly what
I do. Close your eyes? 1 0
21. First you take the paper in your right hand,
then with your both hands, fold it into half
once and then give the paper back to me. 1 2 3
22. Now say a line about your house? (something
specifically about your houses) NOT
INCLUDED IN HMSE TOTAL
If given -1, Not given – 0.
23. Here is a drawing, you must copy this
drawing exactly as shown in the space
provided here.
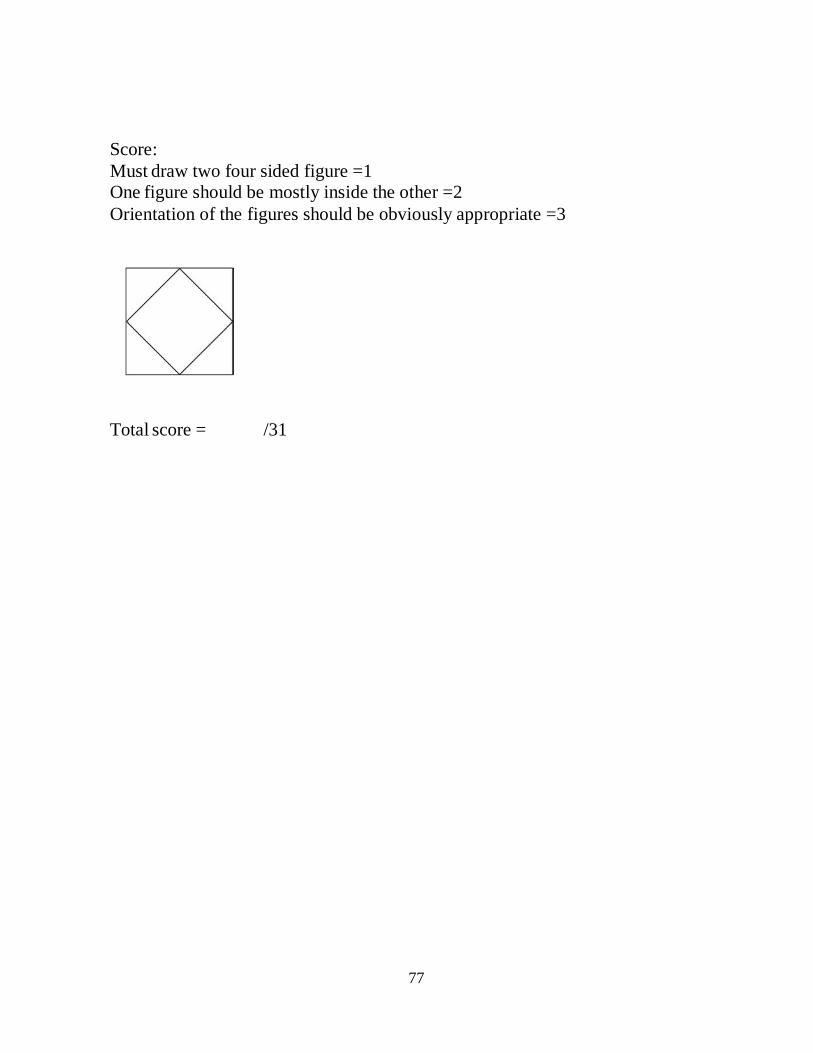
77
Score:
Must draw two four sided figure =1
One figure should be mostly inside the other =2
Orientation of the figures should be obviously appropriate =3
Total score = /31
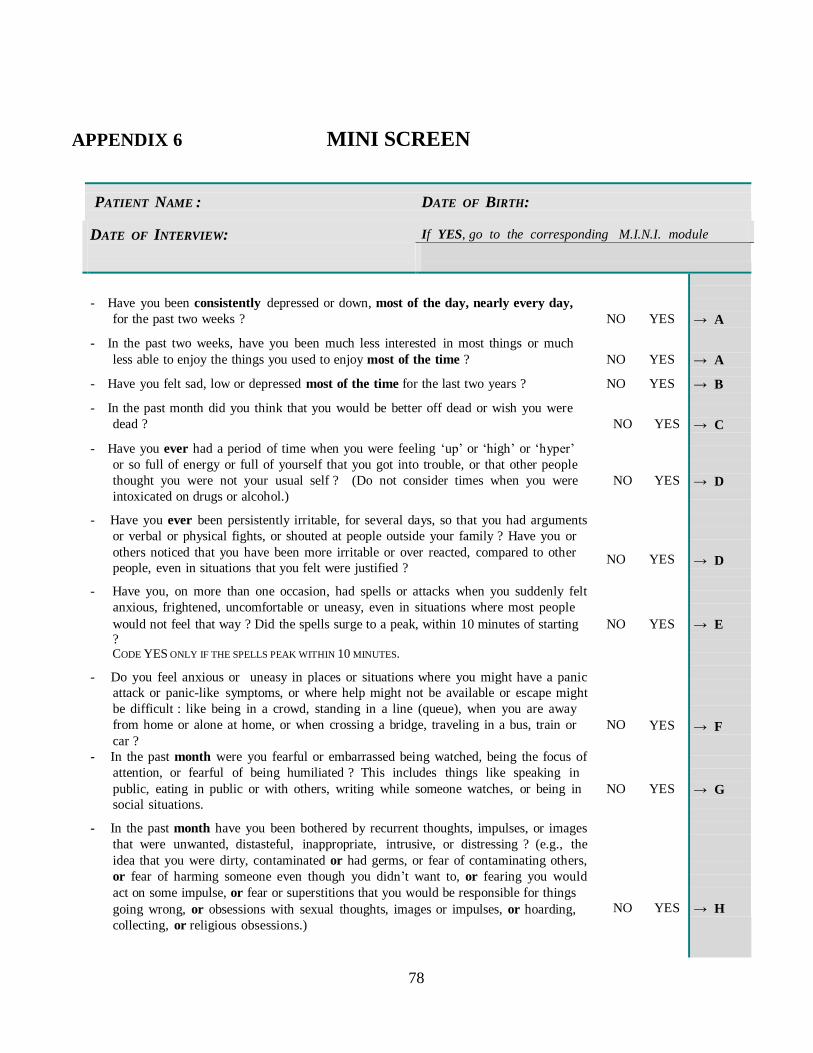
78
APPENDIX 6 MINI SCREEN
PATIENT NAME : DATE OF BIRTH:
DATE OF INTERVIEW: If YES, go to the corresponding M.I.N.I. module
- Have you been consistently depressed or down, most of the day, nearly every day,
for the past two weeks ? NO YES
- In the past two weeks, have you been much less interested in most things or much
less able to enjoy the things you used to enjoy most of the time ? NO YES
- Have you felt sad, low or depressed most of the time for the last two years ? NO YES
- In the past month did you think that you would be better off dead or wish you were
dead ? NO YES
- Have you ever had a period of time when you were feeling ‗up‘ or ‗high‘ or ‗hyper‘
or so full of energy or full of yourself that you got into trouble, or that other people
thought you were not your usual self ? (Do not consider times when you were NO YES
intoxicated on drugs or alcohol.)
- Have you ever been persistently irritable, for several days, so that you had arguments
or verbal or physical fights, or shouted at people outside your family ? Have you or
others noticed that you have been more irritable or over reacted, compared to other
people, even in situations that you felt were justified ? NO YES
- Have you, on more than one occasion, had spells or attacks when you suddenly felt
anxious, frightened, uncomfortable or uneasy, even in situations where most people
would not feel that way ? Did the spells surge to a peak, within 10 minutes of starting NO YES ? CODE YES ONLY IF THE SPELLS PEAK WITHIN 10 MINUTES.
- Do you feel anxious or uneasy in places or situations where you might have a panic
attack or panic-like symptoms, or where help might not be available or escape might
be difficult : like being in a crowd, standing in a line (queue), when you are away
from home or alone at home, or when crossing a bridge, traveling in a bus, train or NO YES
car ?
- In the past month were you fearful or embarrassed being watched, being the focus of
attention, or fearful of being humiliated ? This includes things like speaking in
public, eating in public or with others, writing while someone watches, or being in NO YES
social situations.
- In the past month have you been bothered by recurrent thoughts, impulses, or images
that were unwanted, distasteful, inappropriate, intrusive, or distressing ? (e.g., the
idea that you were dirty, contaminated or had germs, or fear of contaminating others,
or fear of harming someone even though you didn‘t want to, or fearing you would
act on some impulse, or fear or superstitions that you would be responsible for things
going wrong, or obsessions with sexual thoughts, images or impulses, or hoarding, NO YES
collecting, or religious obsessions.)
→ A
→ A
→ B
→ C
→ D
→ D
→ E
→ F
→ G
→ H
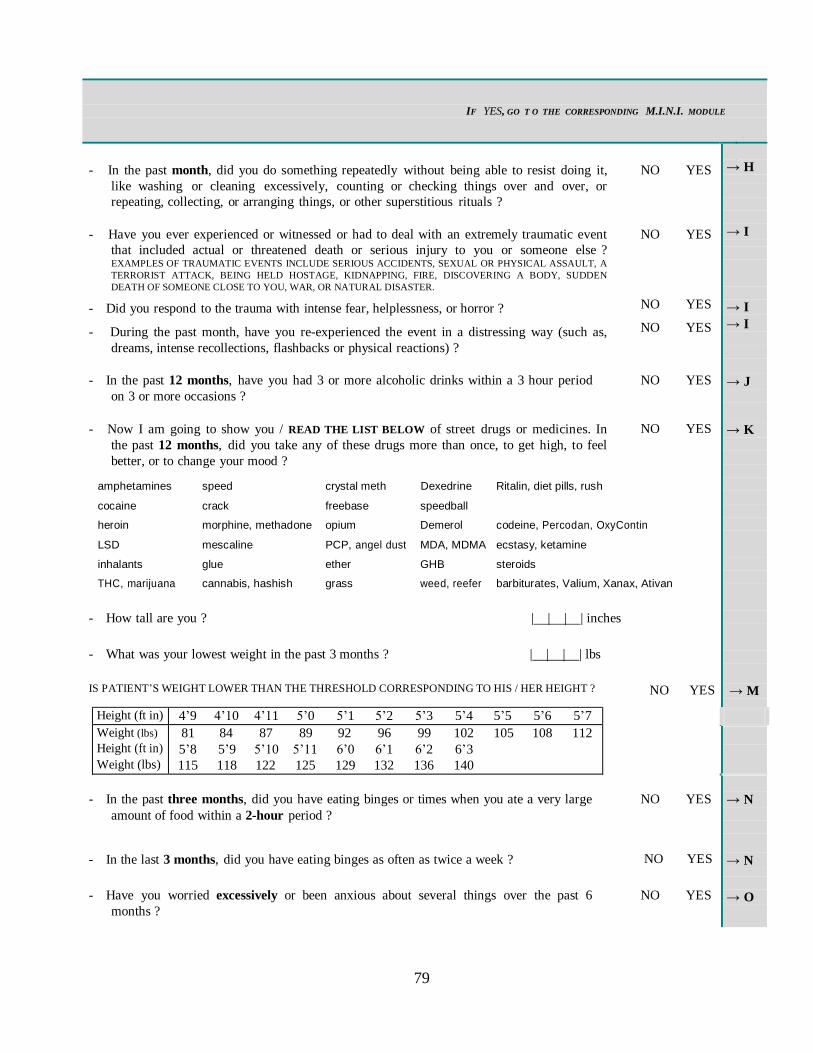
79
IF YES, GO T O THE CORRESPONDING M.I.N.I. MODULE
→ H
→ I
→ I
→ I → J
→ K
→ M
→ N
→ N
→ O
- In the past month, did you do something repeatedly without being able to resist doing it,
like washing or cleaning excessively, counting or checking things over and over, or
repeating, collecting, or arranging things, or other superstitious rituals ?
NO YES
- Have you ever experienced or witnessed or had to deal with an extremely traumatic event
that included actual or threatened death or serious injury to you or someone else ? EXAMPLES OF TRAUMATIC EVENTS INCLUDE SERIOUS ACCIDENTS, SEXUAL OR PHYSICAL ASSAULT, A
TERRORIST ATTACK, BEING HELD HOSTAGE, KIDNAPPING, FIRE, DISCOVERING A BODY, SUDDEN
DEATH OF SOMEONE CLOSE TO YOU, WAR, OR NATURAL DISASTER.
- Did you respond to the trauma with intense fear, helplessness, or horror ?
- During the past month, have you re-experienced the event in a distressing way (such as,
dreams, intense recollections, flashbacks or physical reactions) ?
NO YES NO YES
NO YES
- In the past 12 months, have you had 3 or more alcoholic drinks within a 3 hour period
on 3 or more occasions ?
NO YES
- Now I am going to show you / READ THE LIST BELOW of street drugs or medicines. In
the past 12 months, did you take any of these drugs more than once, to get high, to feel
better, or to change your mood ?
NO YES
amphetamines speed crystal meth Dexedrine Ritalin, diet pills, rush
cocaine crack freebase speedball heroin morphine, methadone opium Demerol codeine, Percodan, OxyContin
LSD mescaline PCP, angel dust MDA, MDMA ecstasy, ketamine
inhalants glue ether GHB steroids
THC, marijuana cannabis, hashish grass weed, reefer barbiturates, Valium, Xanax, Ativan
- How tall are you ? | | | | inches
- What was your lowest weight in the past 3 months ? | | | | lbs
IS PATIENT‘S WEIGHT LOWER THAN THE THRESHOLD CORRESPONDING TO HIS / HER HEIGHT ? NO YES
Height (ft in) 4‘9 4‘10 4‘11 5‘0 5‘1 5‘2 5‘3 5‘4 5‘5 5‘6 5‘7 Weight (lbs)
Height (ft in)
Weight (lbs)
81 84 87 89 92 96 99 102 105 108 112
5‘8 5‘9 5‘10 5‘11 6‘0 6‘1 6‘2 6‘3
115 118 122 125 129 132 136 140
- In the past three months, did you have eating binges or times when you ate a very large
amount of food within a 2-hour period ?
NO YES
- In the last 3 months, did you have eating binges as often as twice a week ? NO YES
- Have you worried excessively or been anxious about several things over the past 6
months ?
NO YES
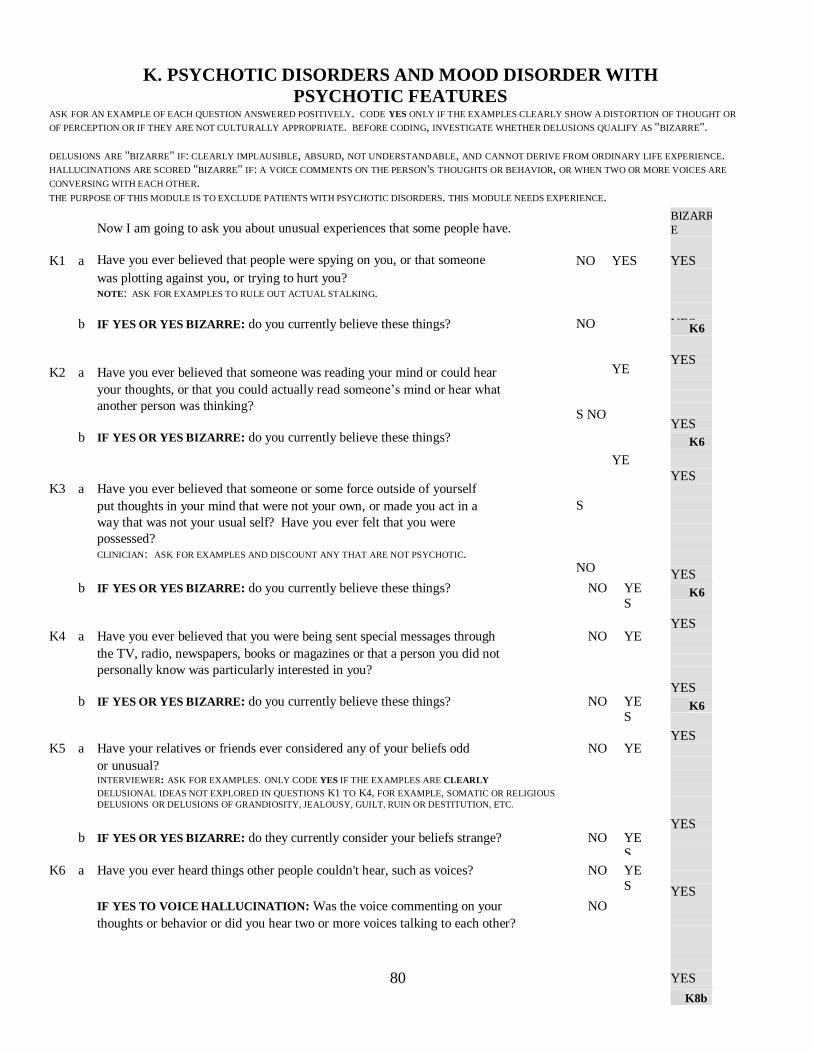
80
BIZARR
E
YES
YES K6 YES
YES K6
YES
YES K6
YES
YES K6
YES
YES YES
YES
K8b
K. PSYCHOTIC DISORDERS AND MOOD DISORDER WITH
PSYCHOTIC FEATURES ASK FOR AN EXAMPLE OF EACH QUESTION ANSWERED POSITIVELY. CODE YES ONLY IF THE EXAMPLES CLEARLY SHOW A DISTORTION OF THOUGHT OR
OF PERCEPTION OR IF THEY ARE NOT CULTURALLY APPROPRIATE. BEFORE CODING, INVESTIGATE WHETHER DELUSIONS QUALIFY AS "BIZARRE".
DELUSIONS ARE "BIZARRE" IF: CLEARLY IMPLAUSIBLE, ABSURD, NOT UNDERSTANDABLE, AND CANNOT DERIVE FROM ORDINARY LIFE EXPERIENCE. HALLUCINATIONS ARE SCORED "BIZARRE" IF: A VOICE COMMENTS ON THE PERSON'S THOUGHTS OR BEHAVIOR, OR WHEN TWO OR MORE VOICES ARE
CONVERSING WITH EACH OTHER.
THE PURPOSE OF THIS MODULE IS TO EXCLUDE PATIENTS WITH PSYCHOTIC DISORDERS. THIS MODULE NEEDS EXPERIENCE.
K1
a
Now I am going to ask you about unusual experiences that some people have.
Have you ever believed that people were spying on you, or that someone
NO YES
NO
YE
S NO
YE
S
NO
YE
S NO
YE
S
was plotting against you, or trying to hurt you?
NOTE: ASK FOR EXAMPLES TO RULE OUT ACTUAL STALKING.
b
IF YES OR YES BIZARRE: do you currently believe these things?
K2
a
Have you ever believed that someone was reading your mind or could hear
your thoughts, or that you could actually read someone‘s mind or hear what
another person was thinking?
b
IF YES OR YES BIZARRE: do you currently believe these things?
K3
a
Have you ever believed that someone or some force outside of yourself
put thoughts in your mind that were not your own, or made you act in a
way that was not your usual self? Have you ever felt that you were
possessed?
CLINICIAN: ASK FOR EXAMPLES AND DISCOUNT ANY THAT ARE NOT PSYCHOTIC.
b
IF YES OR YES BIZARRE: do you currently believe these things?
NO
YE
S
K4
a
Have you ever believed that you were being sent special messages through
NO
YE
S the TV, radio, newspapers, books or magazines or that a person you did not personally know was particularly interested in you?
b
IF YES OR YES BIZARRE: do you currently believe these things?
NO
YE
S K5
a
Have your relatives or friends ever considered any of your beliefs odd
NO
YE
S or unusual? INTERVIEWER: ASK FOR EXAMPLES. ONLY CODE YES IF THE EXAMPLES ARE CLEARLY DELUSIONAL IDEAS NOT EXPLORED IN QUESTIONS K1 TO K4, FOR EXAMPLE, SOMATIC OR RELIGIOUS
DELUSIONS OR DELUSIONS OF GRANDIOSITY, JEALOUSY, GUILT, RUIN OR DESTITUTION, ETC.
b
IF YES OR YES BIZARRE: do they currently consider your beliefs strange?
NO
YE
S
K6
a
Have you ever heard things other people couldn't hear, such as voices?
NO
YE
S
IF YES TO VOICE HALLUCINATION: Was the voice commenting on your
NO
thoughts or behavior or did you hear two or more voices talking to each other?
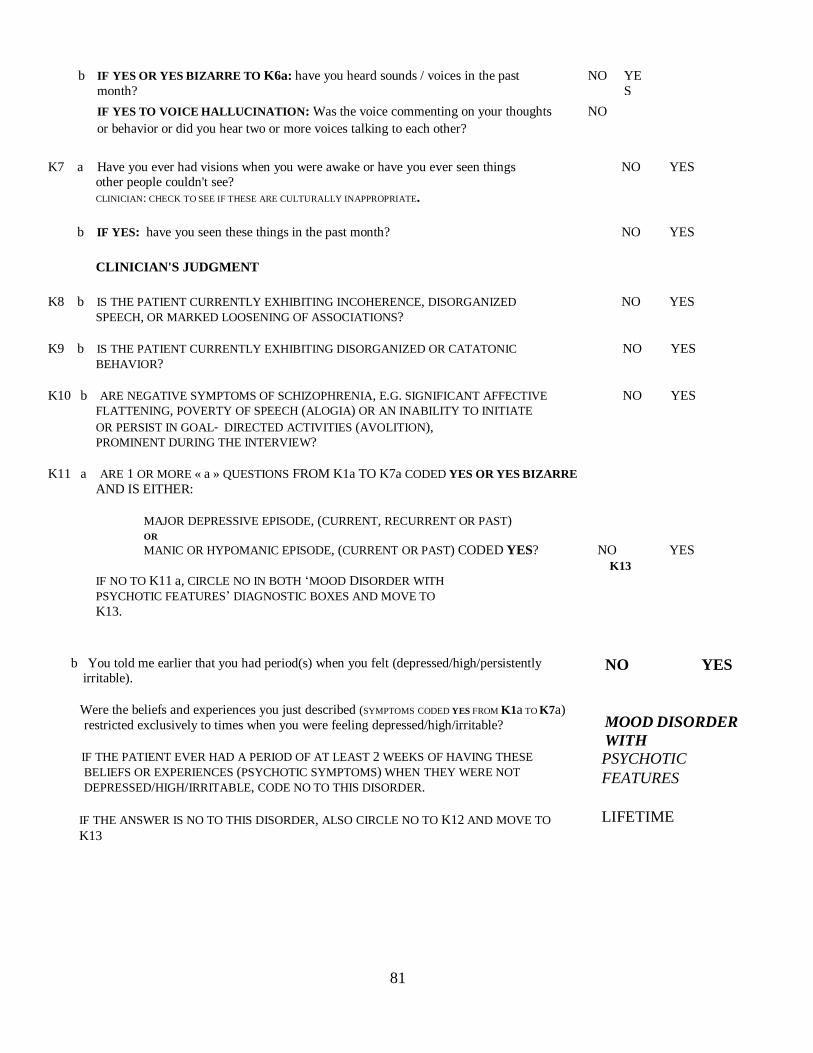
81
b
IF YES OR YES BIZARRE TO K6a: have you heard sounds / voices in the past
month?
NO
YE
S
IF YES TO VOICE HALLUCINATION: Was the voice commenting on your thoughts
NO
or behavior or did you hear two or more voices talking to each other?
K7 a Have you ever had visions when you were awake or have you ever seen things NO YES other people couldn't see?
CLINICIAN: CHECK TO SEE IF THESE ARE CULTURALLY INAPPROPRIATE.
b IF YES: have you seen these things in the past month? NO YES
CLINICIAN'S JUDGMENT
K8 b IS THE PATIENT CURRENTLY EXHIBITING INCOHERENCE, DISORGANIZED NO YES
SPEECH, OR MARKED LOOSENING OF ASSOCIATIONS?
K9 b IS THE PATIENT CURRENTLY EXHIBITING DISORGANIZED OR CATATONIC NO YES
BEHAVIOR?
K10 b ARE NEGATIVE SYMPTOMS OF SCHIZOPHRENIA, E.G. SIGNIFICANT AFFECTIVE NO YES
FLATTENING, POVERTY OF SPEECH (ALOGIA) OR AN INABILITY TO INITIATE
OR PERSIST IN GOAL‐ DIRECTED ACTIVITIES (AVOLITION), PROMINENT DURING THE INTERVIEW?
K11 a ARE 1 OR MORE « a » QUESTIONS FROM K1a TO K7a CODED YES OR YES BIZARRE
AND IS EITHER:
MAJOR DEPRESSIVE EPISODE, (CURRENT, RECURRENT OR PAST) OR
MANIC OR HYPOMANIC EPISODE, (CURRENT OR PAST) CODED YES? NO YES
K13
IF NO TO K11 a, CIRCLE NO IN BOTH ‗MOOD DISORDER WITH
PSYCHOTIC FEATURES‘ DIAGNOSTIC BOXES AND MOVE TO
K13.
b You told me earlier that you had period(s) when you felt (depressed/high/persistently irritable).
Were the beliefs and experiences you just described (SYMPTOMS CODED YES FROM K1a TO K7a)
restricted exclusively to times when you were feeling depressed/high/irritable?
IF THE PATIENT EVER HAD A PERIOD OF AT LEAST 2 WEEKS OF HAVING THESE
BELIEFS OR EXPERIENCES (PSYCHOTIC SYMPTOMS) WHEN THEY WERE NOT
DEPRESSED/HIGH/IRRITABLE, CODE NO TO THIS DISORDER.
IF THE ANSWER IS NO TO THIS DISORDER, ALSO CIRCLE NO TO K12 AND MOVE TO
K13
NO YES
MOOD DISORDER
WITH
PSYCHOTIC
FEATURES
LIFETIME

82
K12 a ARE 1 OR MORE « b » QUESTIONS FROM K1b TO K7b CODED YES OR
YES BIZARRE AND IS EITHER:
MAJOR DEPRESSIVE EPISODE, (CURRENT) OR
MANIC OR HYPOMANIC EPISODE, (CURRENT) CODED YES?
IF THE ANSWER IS YES TO THIS DISORDER (LIFETIME OR CURRENT), CIRCLE NO
TO K13 AND K14 AND MOVE TO THE NEXT MODULE.
K13 ARE 1 OR MORE « b » QUESTIONS FROM K1b TO K6b, CODED YES BIZARRE?
OR
ARE 2 OR MORE « b » QUESTIONS FROM K1b TO K10b, CODED YES
(RATHER THAN YES BIZARRE)?
AND DID AT LEAST TWO OF THE PSYCHOTIC SYMPTOMS OCCUR DURING THE
SAME 1 MONTH PERIOD?
NO YES
PSYCHOTIC
DISORDER
CURRENT
NO YES
MOOD DISORDER
WITH
PSYCHOTIC
FEATURES
CURRENT
K14 IS K13 CODED YES
OR
ARE 1 OR MORE « a » QUESTIONS FROM K1a TO K6a, CODED YES BIZARRE?
OR
ARE 2 OR MORE « a » QUESTIONS FROM K1a TO K7a, CODED YES (RATHER THAN
YES BIZARRE)
AND DID AT LEAST TWO OF THE PSYCHOTIC SYMPTOMS OCCUR DURING THE
SAME 1 MONTH PERIOD?
NO YES PSYCHOTIC
DISORDER
LIFETIME
83
APPENDIX 7 CONSENT FORM
Title of the study:
LIFE STYLE FACTORS IN LATE ONSET DEPRESSION:A COMPARISON
BETWEEN TREATMENT SEEKING POPULATION AND MATCHED
HEALTHY CONTROLS
Information to the participants.
Depression is a mental illness that can occur to any human being. The
common symptoms of Depression are low mood, lack of interest, increased fatigue,
feeling of hopelessness and worthlessness, decreased appetite and sleep which last for
2 weeks or more. Studies have shown that Depression occurs due to changes in
biochemical activities in the brain which may be due to genetic or acquired causes.
Depression is the commonest psychiatric disorder in the community and its incidence
among old people is increasing. It has also been noticed that depression that occur in
old people appear different from that occurring in young adults in many ways like the
distress that the disease cause to the patient, response to the treatment and so on.
Many reasons have been proposed for this apparent difference between the two like
the various changes that may occur in the brain due to prolonged life, coexisting
diseases like increased blood pressure and sugar, stroke and so on in the elderly.
Many studies are being done world wide by researchers to find out more
about the possible factors that could lead to depression in the old age, with the
intention of understanding the disease better and thus hoping to develop new
treatment methods.
In this study we are comparing the life style factors in elderly people
having Depression with those in healthy elderly people. Life style factors would
include diet, exercise, alcohol and tobacco use, hobbies, leisure and social activities.
As part of the study we would like to interview you and your relative and record the
information. Apart from asking questions about how you lead your life with respect
to above mentioned categories no other interventions will be done for the purpose of
the study. The interview session would take approximately 30-45 minutes.
UNDERTAKING BY THE INVESTIGATOR:
Participation in the study is on voluntary basis and you will not be entitled
to any additional benefits for doing the same. It will also not be of any direct benefit
to you in the treatment which you are undergoing. However you will be able to
contribute to our research endeavor which is held solemnly in academic and scientific
interest.
You may decide not to participate in the study without citing any reason for
the same. In that case the treatment that you would continue to receive will not be
affected in any way. Any information that you provide would be kept confidential and
used only for the purpose of this study. Please feel free to clarify any doubts about the
study with Dr. Ramkumar G S, Junior Resident, NIMHANS(09880967850). This
study is being conducted under the guidance of Dr Sreekala Bharath MD, Professor of
Psychiatry, NIMHANS.
1
84
CONSENT FORM:
I/My relative have been informed about the process of the study. I have
understood that I have the right to refuse my consent or withdraw at any time during
the study without adversely affecting my treatment. I am aware that by subjecting to
this study process, I will have to give more time for assessments by the investigating
team and that these assessments do not interfere with the benefits.
I/My relative the undersigned, give consent to be a participant of this study program.
Name, Signature and address Name, signature and nature of
of the Respondent relationship of the Relative.
Signature of investigator
Dr Ramkumar G S,
Junior Resident,
Dept of Psychiatry,
NIMHANS.
Mobile Number 09880967850
GUIDE
Dr Srikala Bharath MD,
Professor of Psychiatry,
NIMHANS.
...............
2