Life Science Journal 2016;13(3) ...€¦ · Gamal Abdel Fattah 1,2 *, Majida Sultan Altouq1 and...
14
Life Science Journal 2016;13(3) http://www.lifesciencesite.com 65 UV –LED Used to Measure the Traces of Sulfur Dioxide in Artificial Environment Gamal Abdel Fattah 1,2 * , Majida Sultan Altouq 1 and Altaf Abdulla Shamsaldien 1 1 The Public Authority for Applied Education and TrainingCollege of technological Studies (Kuwait) 2 National Institutes of Laser Enhanced Sciences (NILES), Cairo University, Cairo, Egypt * [email protected] Abstract.The detection of the pollutants is the first step to treat its source and consequently to eliminate its harm from our environment. The detection of Sulfur Dioxide (SO 2 ), one of the harmful pollutants, is the main goal of this work. The optical absorption spectroscopy measurement is used here. This method depends on the absorption of ultraviolet wavelength through the medium which contains SO 2 .Ultraviolet Light emitted diode (UV- LED) has peak emission at 280 nm is used. Lock-in technique is used to amplify the signals. Fifty ppm. detection sensitivity is achieved and better sensitivity can be reached. Also the idea of Dosimeter is used, where the exposure of certain host material to the SO 2 (is the guest here) may change one of its physical parameters. This change can be measured, and correlated to the concentrations of SO 2 (10 4 ppm, 3x10 3 ppm and 2.5x10 3 ppm). The KMnO 4 solution is used as a host and the measured physical parameter isthe optical transmission. The transmission dependence on the molarity of the solution and the SO 2 concentration is measured. [Gamal Abdel Fattah, Majida Sultan Altouq and Altaf Abdulla Shamsaldien. UV –LED Used to Measure the Traces of Sulfur Dioxide in Artificial Environment. Life Sci J 2016;13(3):65-78]. ISSN: 1097-8135 (Print) / ISSN: 2372-613X (Online). http://www.lifesciencesite.com . 9. doi:10.7537/marslsj13031609 . Keywords: UV-LED, SO 2, Sulfur Dioxide,UV Absorption. 1. Introduction Environmental, industrial, medical, scientific and domestic applications are the basic fields for gas sensors applications. The gas may be one from the reasons of an atmospheric pollutant, hazardous to human health or the gas concentration of important for the process in different industries. Also the gas sensor is required to get real time measurement to monitoring the concentration of specific gas, in mixture of other gases. Combustion of fossil fuel is today the main source of sulfur dioxide and NO, emissions to the environment. The sulfur emitted to the atmosphere will when deposited on the ground cause severe effects. The acidity increases in the ground affecting the biotic nature of both soil and water resources. An additional severe effect of NO, emissions is the formation of tropospheric ozone by reaction of NO, with hydrocarbons or CO in the air.’ On a global scale increasing emissions of NO, CO and CH, to the troposphere, have caused increasing background concentrations of O, which in turn can induce severe effects on plant growth and on the overall chemistry of the atmosphere. [1]. The toxicity of sulfur dioxide is well recognized. Concentrations of 5–10 ppm in air are recommended threshold limits for human exposure and 2 ppm is the recommended limit for working environments. Sulfur dioxide has a serious effect not only on the ecology but also on human health [2]. The sources of SO 2 emissions and its contribution to the total emission, [3] are listed in table (1). Table (1) Source of SO 2 Emission Account of the total Emission Power stations 69 % Burning Fuel in industry and construction 13% Transport 2~6 % The absorption spectrum of SO 2 and NO 2 gas are collected from a various references are shown in figure 1 [4]. There are many analytical techniques available for the detection of sulfur dioxide, including spectrophotometry, chemiluminescence method, ion chromatography, spectrofluorometry, potentiometry, etc. [5]. There are two main methods for gas detection, the first is the direct methods, which measure the physical parameter of the gas under study, and the second is the indirect methods which use a chemical reaction or indicator to identify and measure the gas and its concentration. Both of each method can be divided to optical and non optical. Optical absorption or emission or scattering of a gas species at defined optical wavelengths can be used to detect the gas. The spectral distribution of this optical absorption and emission provides an optical finger print of any specific gas species present, and the magnitude of the optical absorption or emission can be used to calculate the gas concentration. Optical spectroscopy provides in situ and accurate measurement of a gas species.
Transcript of Life Science Journal 2016;13(3) ...€¦ · Gamal Abdel Fattah 1,2 *, Majida Sultan Altouq1 and...

Life Science Journal 2016;13(3) http://www.lifesciencesite.com
65
UV –LED Used to Measure the Traces of Sulfur Dioxide in Artificial Environment
Gamal Abdel Fattah 1,2 *, Majida Sultan Altouq1 and Altaf Abdulla Shamsaldien1
1The Public Authority for Applied Education and TrainingCollege of technological Studies (Kuwait)
2 National Institutes of Laser Enhanced Sciences (NILES), Cairo University, Cairo, Egypt *[email protected]
Abstract.The detection of the pollutants is the first step to treat its source and consequently to eliminate its harm from our environment. The detection of Sulfur Dioxide (SO2), one of the harmful pollutants, is the main goal of this work. The optical absorption spectroscopy measurement is used here. This method depends on the absorption of ultraviolet wavelength through the medium which contains SO2.Ultraviolet Light emitted diode (UV- LED) has peak emission at 280 nm is used. Lock-in technique is used to amplify the signals. Fifty ppm. detection sensitivity is achieved and better sensitivity can be reached. Also the idea of Dosimeter is used, where the exposure of certain host material to the SO2 (is the guest here) may change one of its physical parameters. This change can be measured, and correlated to the concentrations of SO2 (104ppm, 3x10³ ppm and 2.5x10³ppm). The KMnO4 solution is used as a host and the measured physical parameter isthe optical transmission. The transmission dependence on the molarity of the solution and the SO2 concentration is measured. [Gamal Abdel Fattah, Majida Sultan Altouq and Altaf Abdulla Shamsaldien. UV –LED Used to Measure the Traces of Sulfur Dioxide in Artificial Environment. Life Sci J 2016;13(3):65-78]. ISSN: 1097-8135 (Print) / ISSN: 2372-613X (Online). http://www.lifesciencesite.com. 9. doi:10.7537/marslsj13031609. Keywords: UV-LED, SO2, Sulfur Dioxide,UV Absorption. 1. Introduction
Environmental, industrial, medical, scientific and domestic applications are the basic fields for gas sensors applications. The gas may be one from the reasons of an atmospheric pollutant, hazardous to human health or the gas concentration of important for the process in different industries. Also the gas sensor is required to get real time measurement to monitoring the concentration of specific gas, in mixture of other gases.
Combustion of fossil fuel is today the main source of sulfur dioxide and NO, emissions to the environment. The sulfur emitted to the atmosphere will when deposited on the ground cause severe effects. The acidity increases in the ground affecting the biotic nature of both soil and water resources. An additional severe effect of NO, emissions is the formation of tropospheric ozone by reaction of NO, with hydrocarbons or CO in the air.’ On a global scale increasing emissions of NO, CO and CH, to the troposphere, have caused increasing background concentrations of O, which in turn can induce severe effects on plant growth and on the overall chemistry of the atmosphere. [1]. The toxicity of sulfur dioxide is well recognized. Concentrations of 5–10 ppm in air are recommended threshold limits for human exposure and 2 ppm is the recommended limit for working environments. Sulfur dioxide has a serious effect not only on the ecology but also on human health [2]. The sources of SO2 emissions and its contribution to the total emission, [3] are listed in table (1).
Table (1) Source of SO2 Emission Account of the total
Emission Power stations 69 %
Burning Fuel in industry and construction
13%
Transport 2~6 %
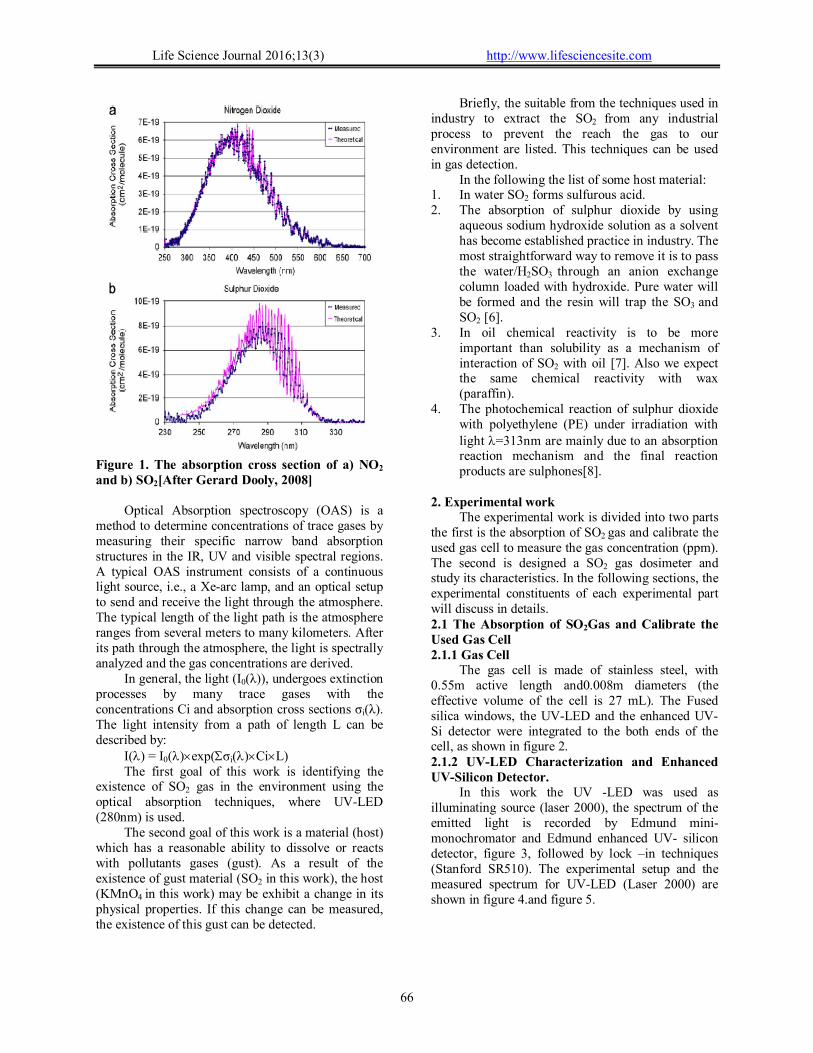
The absorption spectrum of SO2 and NO2 gas are collected from a various references are shown in figure 1 [4].
There are many analytical techniques available for the detection of sulfur dioxide, including spectrophotometry, chemiluminescence method, ion chromatography, spectrofluorometry, potentiometry, etc. [5].
There are two main methods for gas detection, the first is the direct methods, which measure the physical parameter of the gas under study, and the second is the indirect methods which use a chemical reaction or indicator to identify and measure the gas and its concentration. Both of each method can be divided to optical and non optical.
Optical absorption or emission or scattering of a gas species at defined optical wavelengths can be used to detect the gas. The spectral distribution of this optical absorption and emission provides an optical finger print of any specific gas species present, and the magnitude of the optical absorption or emission can be used to calculate the gas concentration. Optical spectroscopy provides in situ and accurate measurement of a gas species.
Life Science Journal 2016;13(3) http://www.lifesciencesite.com
66
Figure 1. The absorption cross section of a) NO2 and b) SO2[After Gerard Dooly, 2008]
Optical Absorption spectroscopy (OAS) is a
method to determine concentrations of trace gases by measuring their specific narrow band absorption structures in the IR, UV and visible spectral regions. A typical OAS instrument consists of a continuous light source, i.e., a Xe-arc lamp, and an optical setup to send and receive the light through the atmosphere. The typical length of the light path is the atmosphere ranges from several meters to many kilometers. After its path through the atmosphere, the light is spectrally analyzed and the gas concentrations are derived.
In general, the light (I0(λ)), undergoes extinction processes by many trace gases with the concentrations Ci and absorption cross sections σi(λ). The light intensity from a path of length L can be described by:
I() = I0()exp(σi()CiL) The first goal of this work is identifying the
existence of SO2 gas in the environment using the optical absorption techniques, where UV-LED (280nm) is used.
The second goal of this work is a material (host) which has a reasonable ability to dissolve or reacts with pollutants gases (gust). As a result of the existence of gust material (SO2 in this work), the host (KMnO4 in this work) may be exhibit a change in its physical properties. If this change can be measured, the existence of this gust can be detected.
Briefly, the suitable from the techniques used in industry to extract the SO2 from any industrial process to prevent the reach the gas to our environment are listed. This techniques can be used in gas detection.
In the following the list of some host material: 1. In water SO2 forms sulfurous acid. 2. The absorption of sulphur dioxide by using
aqueous sodium hydroxide solution as a solvent has become established practice in industry. The most straightforward way to remove it is to pass the water/H2SO3 through an anion exchange column loaded with hydroxide. Pure water will be formed and the resin will trap the SO3 and SO2 [6].
3. In oil chemical reactivity is to be more important than solubility as a mechanism of interaction of SO2 with oil [7]. Also we expect the same chemical reactivity with wax (paraffin).
4. The photochemical reaction of sulphur dioxide with polyethylene (PE) under irradiation with light =313nm are mainly due to an absorption reaction mechanism and the final reaction products are sulphones[8].
2. Experimental work
The experimental work is divided into two parts the first is the absorption of SO2 gas and calibrate the used gas cell to measure the gas concentration (ppm). The second is designed a SO2 gas dosimeter and study its characteristics. In the following sections, the experimental constituents of each experimental part will discuss in details. 2.1 The Absorption of SO2Gas and Calibrate the Used Gas Cell 2.1.1 Gas Cell
The gas cell is made of stainless steel, with 0.55m active length and0.008m diameters (the effective volume of the cell is 27 mL). The Fused silica windows, the UV-LED and the enhanced UV-Si detector were integrated to the both ends of the cell, as shown in figure 2. 2.1.2 UV-LED Characterization and Enhanced UV-Silicon Detector.
In this work the UV -LED was used as illuminating source (laser 2000), the spectrum of the emitted light is recorded by Edmund mini-monochromator and Edmund enhanced UV- silicon detector, figure 3, followed by lock –in techniques (Stanford SR510). The experimental setup and the measured spectrum for UV-LED (Laser 2000) are shown in figure 4.and figure 5.

Life Science Journal 2016;13(3) http://www.lifesciencesite.com
67
Figure 2. The gas Cell
Figure 3. The spectral response of the unbiased UV- enhanced Silicon detector is shown in figure (red curve).
Figure 4. The Experimental setup formeasuring the emission peak UV-LED.

Life Science Journal 2016;13(3) http://www.lifesciencesite.com
68
Figure 5. The Measured Emitted Spectrum for UV-LED (Laser 2000)
The measured emission spectrum of the green, violet and blue LED's are shown in the figure 6.
Figure 6. TheMeasured Spectrum of Different LED's Emission
2.1.3 SO2 Gas Absorption Experiment. The experimental work is preceded as follows:
first SO2 (99.89%)is introduced into the gas cell and the pressure is measured. Then buffer gas (Air) is added to the cell content to reach 1 atm. total pressure. Reference spectra with the cell filled with 1 atm pure buffer gas (Air)is recorded. It should be mentioned that, the UV-LED light source giving no wavelength below 250nm and thus preventing the SO2 from being photolyzed.
The experimental setup is shown in figure 7. It consists of a light source (UV- LED 280 nm), the cell, Enhanced UV- silicon detector and lock in amplifier. The choice of the light source was determined from the absorption peak of the gas under investigation, as shown the figure1. In this experiment, the cell is evacuated to around 200mmHg. The pressure increases by introducing SO2 gas into the cell, the pressure increases to 310, 410 and 475 mmHg in steps.
UV-LED Spectrum
3
4
5
6
7
8
9
260 270 280 290 300 310
wavelength (nm)
Inte
nsity (
a.u
.)
Life Science Journal 2016;13(3) http://www.lifesciencesite.com
69
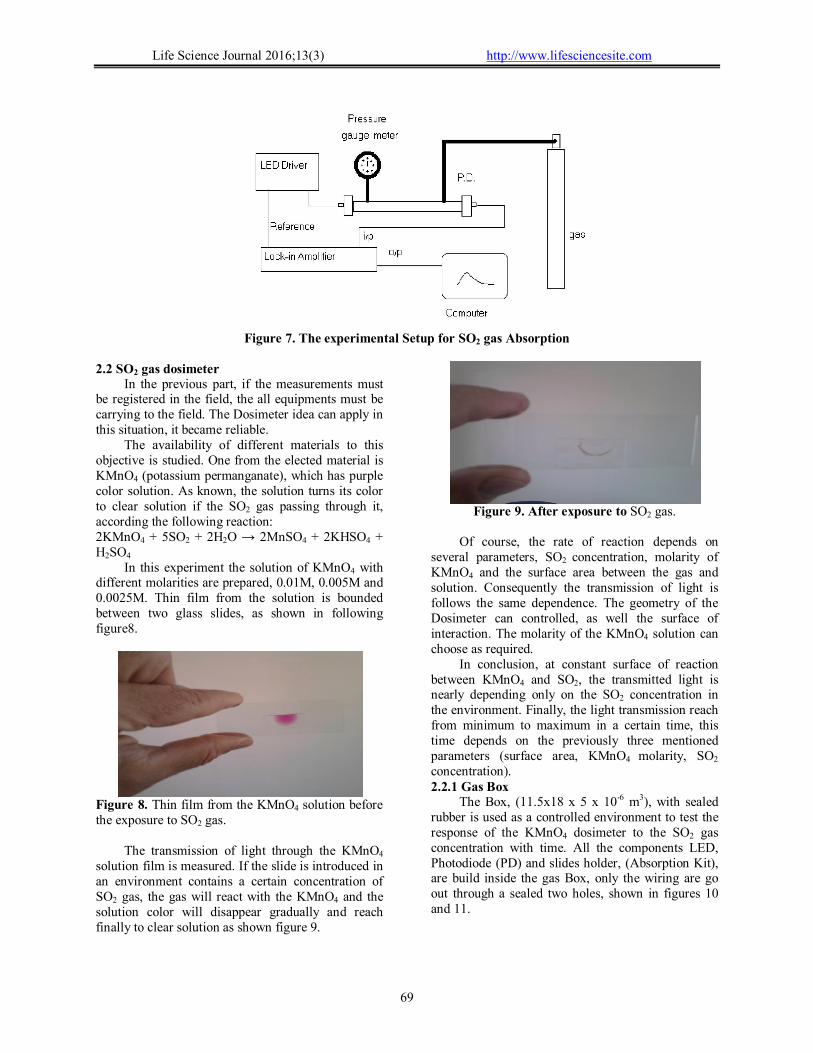
Figure 7. The experimental Setup for SO2 gas Absorption
2.2 SO2 gas dosimeter
In the previous part, if the measurements must be registered in the field, the all equipments must be carrying to the field. The Dosimeter idea can apply in this situation, it became reliable.
The availability of different materials to this objective is studied. One from the elected material is KMnO4 (potassium permanganate), which has purple color solution. As known, the solution turns its color to clear solution if the SO2 gas passing through it, according the following reaction: 2KMnO4 + 5SO2 + 2H2O → 2MnSO4 + 2KHSO4 + H2SO4
In this experiment the solution of KMnO4 with different molarities are prepared, 0.01M, 0.005M and 0.0025M. Thin film from the solution is bounded between two glass slides, as shown in following figure8.
Figure 8. Thin film from the KMnO4 solution before the exposure to SO2 gas.
The transmission of light through the KMnO4 solution film is measured. If the slide is introduced in an environment contains a certain concentration of SO2 gas, the gas will react with the KMnO4 and the solution color will disappear gradually and reach finally to clear solution as shown figure 9.
Figure 9. After exposure to SO2 gas.
Of course, the rate of reaction depends on
several parameters, SO2 concentration, molarity of KMnO4 and the surface area between the gas and solution. Consequently the transmission of light is follows the same dependence. The geometry of the Dosimeter can controlled, as well the surface of interaction. The molarity of the KMnO4 solution can choose as required.
In conclusion, at constant surface of reaction between KMnO4 and SO2, the transmitted light is nearly depending only on the SO2 concentration in the environment. Finally, the light transmission reach from minimum to maximum in a certain time, this time depends on the previously three mentioned parameters (surface area, KMnO4 molarity, SO2
concentration). 2.2.1 Gas Box
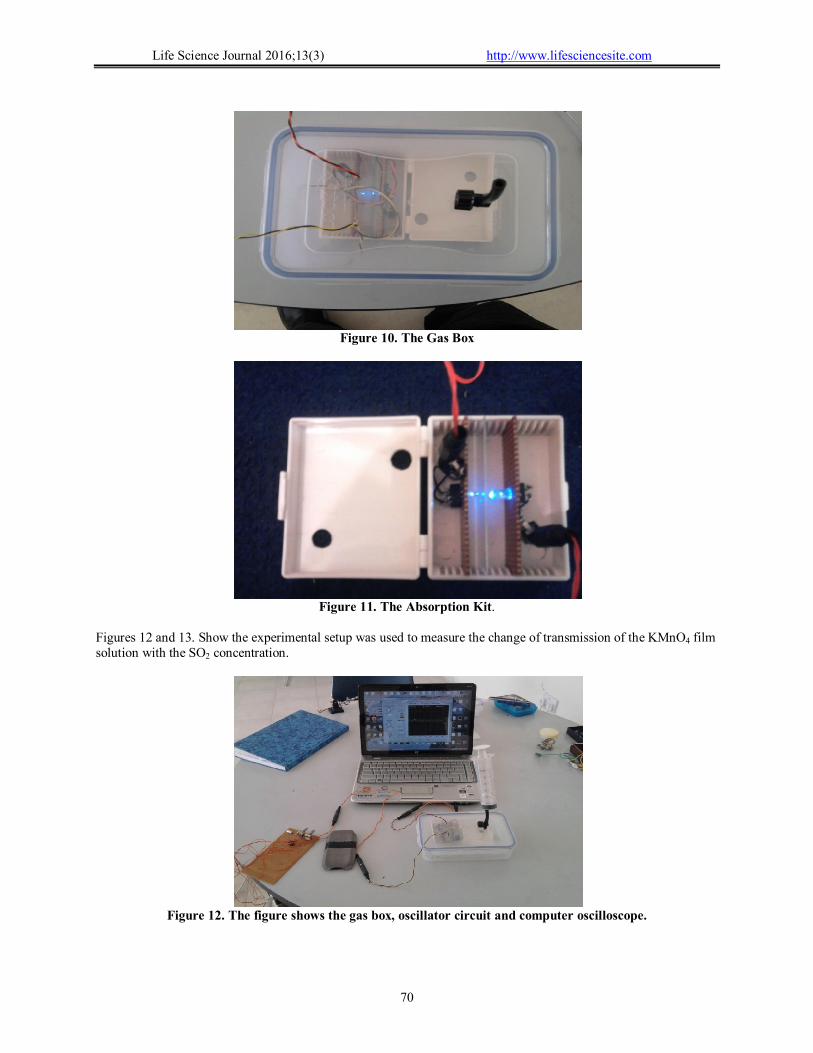
The Box, (11.5x18 x 5 x 10-6 m3), with sealed rubber is used as a controlled environment to test the response of the KMnO4 dosimeter to the SO2 gas concentration with time. All the components LED, Photodiode (PD) and slides holder, (Absorption Kit), are build inside the gas Box, only the wiring are go out through a sealed two holes, shown in figures 10 and 11.
Life Science Journal 2016;13(3) http://www.lifesciencesite.com
70
Figure 10. The Gas Box
Figure 11. The Absorption Kit.
Figures 12 and 13. Show the experimental setup was used to measure the change of transmission of the KMnO4 film solution with the SO2 concentration.
Figure 12. The figure shows the gas box, oscillator circuit and computer oscilloscope.
Life Science Journal 2016;13(3) http://www.lifesciencesite.com
71
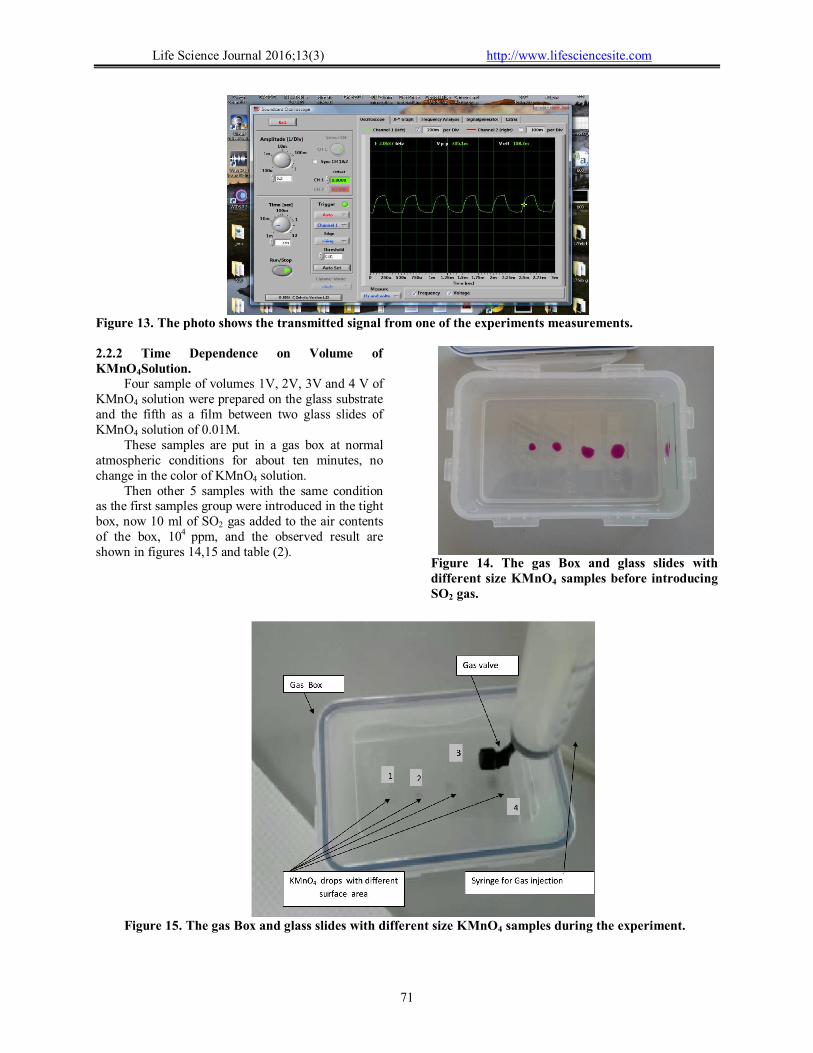
Figure 13. The photo shows the transmitted signal from one of the experiments measurements. 2.2.2 Time Dependence on Volume of KMnO4Solution.
Four sample of volumes 1V, 2V, 3V and 4 V of KMnO4 solution were prepared on the glass substrate and the fifth as a film between two glass slides of KMnO4 solution of 0.01M.
These samples are put in a gas box at normal atmospheric conditions for about ten minutes, no change in the color of KMnO4 solution.
Then other 5 samples with the same condition as the first samples group were introduced in the tight box, now 10 ml of SO2 gas added to the air contents of the box, 104 ppm, and the observed result are shown in figures 14,15 and table (2).
Figure 14. The gas Box and glass slides with different size KMnO4 samples before introducing SO2 gas.
Figure 15. The gas Box and glass slides with different size KMnO4 samples during the experiment.
Life Science Journal 2016;13(3) http://www.lifesciencesite.com
72
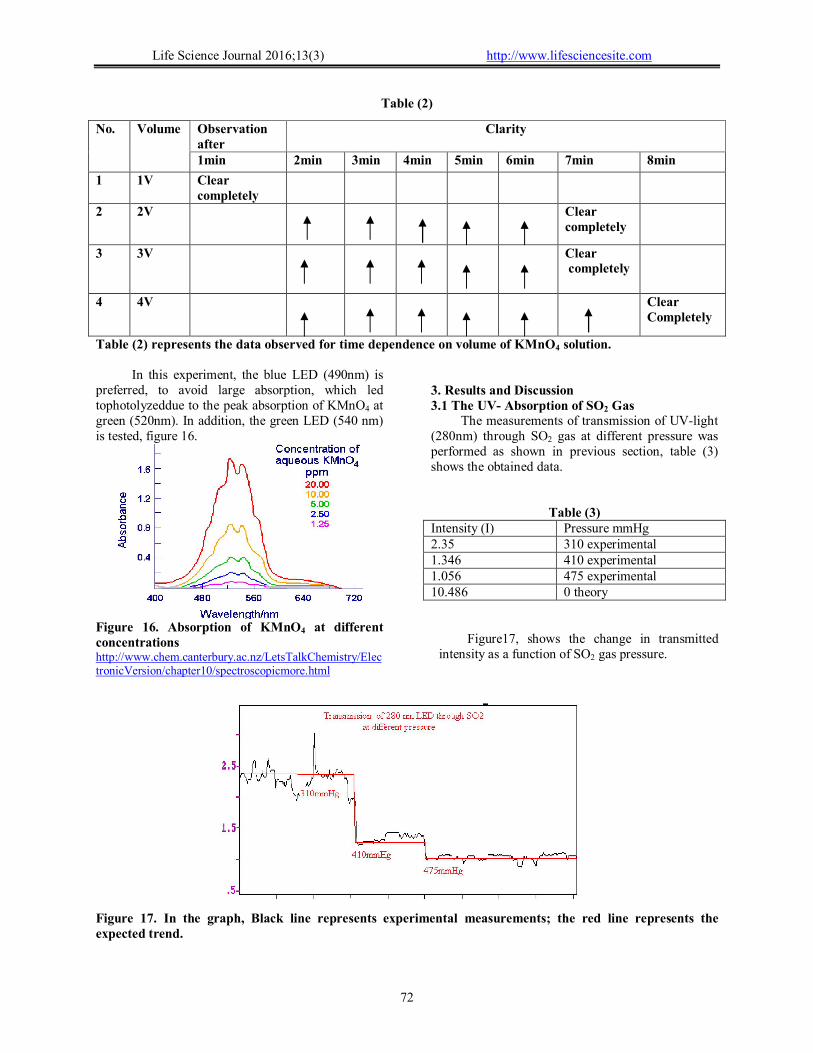
Table (2)
Table (2) represents the data observed for time dependence on volume of KMnO4 solution.
In this experiment, the blue LED (490nm) is preferred, to avoid large absorption, which led tophotolyzeddue to the peak absorption of KMnO4 at green (520nm). In addition, the green LED (540 nm) is tested, figure 16.
Figure 16. Absorption of KMnO4 at different concentrations http://www.chem.canterbury.ac.nz/LetsTalkChemistry/ElectronicVersion/chapter10/spectroscopicmore.html
3. Results and Discussion 3.1 The UV- Absorption of SO2 Gas
The measurements of transmission of UV-light (280nm) through SO2 gas at different pressure was performed as shown in previous section, table (3) shows the obtained data.
Table (3) Pressure mmHg Intensity (I) 310 experimental 2.35 410 experimental 1.346 475 experimental 1.056 0 theory 10.486
Figure17, shows the change in transmitted intensity as a function of SO2 gas pressure.
Figure 17. In the graph, Black line represents experimental measurements; the red line represents the expected trend.
No. Volume Observation after
Clarity
1min 2min 3min 4min 5min 6min 7min 8min
1 1V Clear completely
2 2V Clear completely
3 3V Clear completely
4 4V Clear Completely
Life Science Journal 2016;13(3) http://www.lifesciencesite.com
73
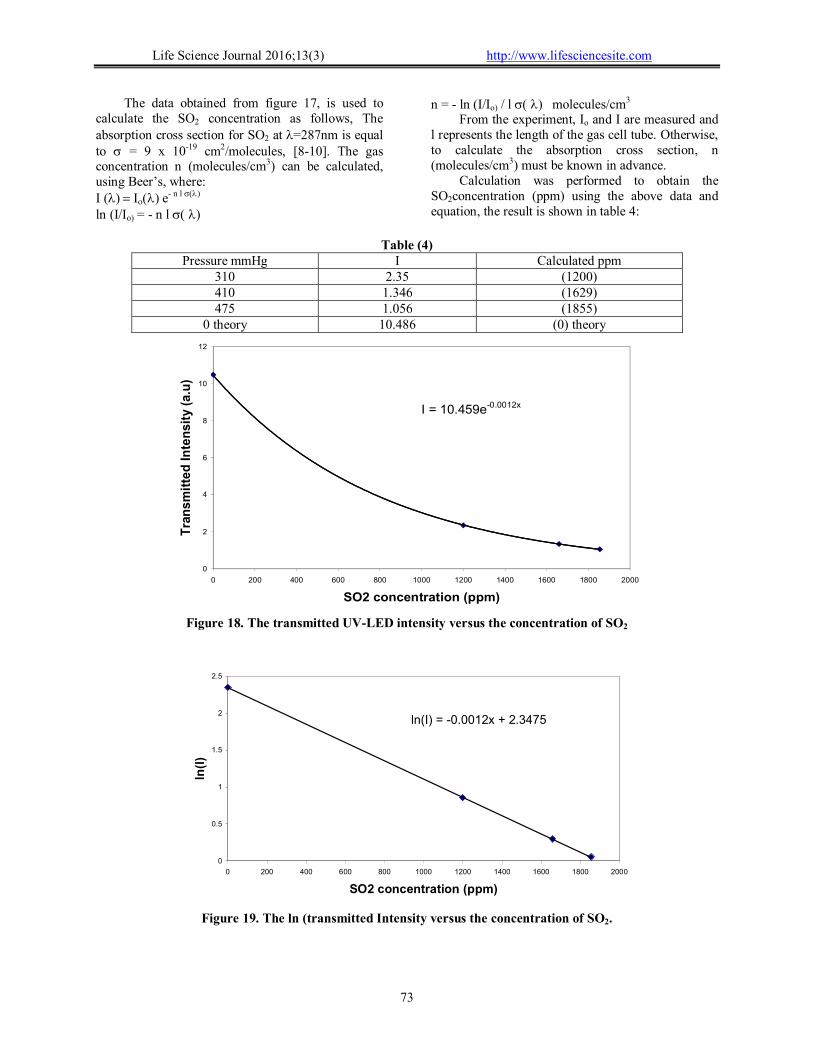
The data obtained from figure 17, is used to calculate the SO2 concentration as follows, The absorption cross section for SO2 at =287nm is equal to = 9 x 10-19 cm2/molecules, [8-10]. The gas concentration n (molecules/cm3) can be calculated, using Beer’s, where: I () e- n lln (I/Io) = - n l
n = - ln (I/Io) / l molecules/cm3 From the experiment, Io and I are measured and
l represents the length of the gas cell tube. Otherwise, to calculate the absorption cross section, n (molecules/cm3) must be known in advance.
Calculation was performed to obtain the SO2concentration (ppm) using the above data and equation, the result is shown in table 4:
Table (4)
Calculated ppm I Pressure mmHg (1200) 2.35 310 (1629) 1.346 410 (1855) 1.056 475
(0) theory 10.486 0 theory
Figure 18. The transmitted UV-LED intensity versus the concentration of SO2
Figure 19. The ln (transmitted Intensity versus the concentration of SO2.
I = 10.459e-0.0012x
0
2
4
6
8
10
12
0 200 400 600 800 1000 1200 1400 1600 1800 2000
SO2 concentration (ppm)
Tra
ns
mit
ted
In
ten
sit
y (
a.u
)
ln(I) = -0.0012x + 2.3475
0
0.5
1
1.5
2
2.5
0 200 400 600 800 1000 1200 1400 1600 1800 2000
SO2 concentration (ppm)
ln(I
)
Life Science Journal 2016;13(3) http://www.lifesciencesite.com
74
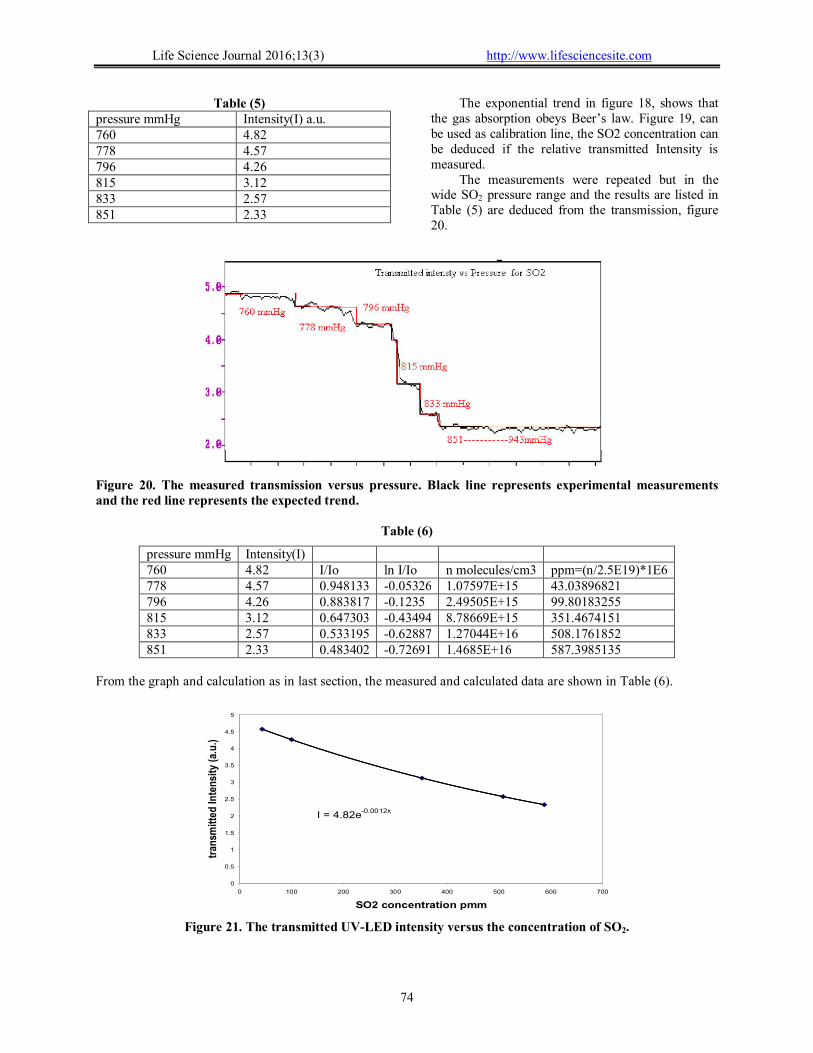
Table (5) Intensity(I) a.u. pressure mmHg 4.82 760 4.57 778 4.26 796 3.12 815 2.57 833 2.33 851
The exponential trend in figure 18, shows that the gas absorption obeys Beer’s law. Figure 19, can be used as calibration line, the SO2 concentration can be deduced if the relative transmitted Intensity is measured.
The measurements were repeated but in the wide SO2 pressure range and the results are listed in Table (5) are deduced from the transmission, figure 20.
Figure 20. The measured transmission versus pressure. Black line represents experimental measurements and the red line represents the expected trend.
Table (6)
pressure mmHg Intensity(I) 760 4.82 I/Io ln I/Io n molecules/cm3 ppm=(n/2.5E19)*1E6 778 4.57 0.948133 -0.05326 1.07597E+15 43.03896821 796 4.26 0.883817 -0.1235 2.49505E+15 99.80183255 815 3.12 0.647303 -0.43494 8.78669E+15 351.4674151 833 2.57 0.533195 -0.62887 1.27044E+16 508.1761852 851 2.33 0.483402 -0.72691 1.4685E+16 587.3985135
From the graph and calculation as in last section, the measured and calculated data are shown in Table (6).
Figure 21. The transmitted UV-LED intensity versus the concentration of SO2.
I = 4.82e-0.0012x
0
0.5
1
1.5
2
2.5
3
3.5
4
4.5
5
0 100 200 300 400 500 600 700
SO2 concentration pmm
tran
smit
ted
Inte
nsi
ty (
a.u
.)
Life Science Journal 2016;13(3) http://www.lifesciencesite.com
75
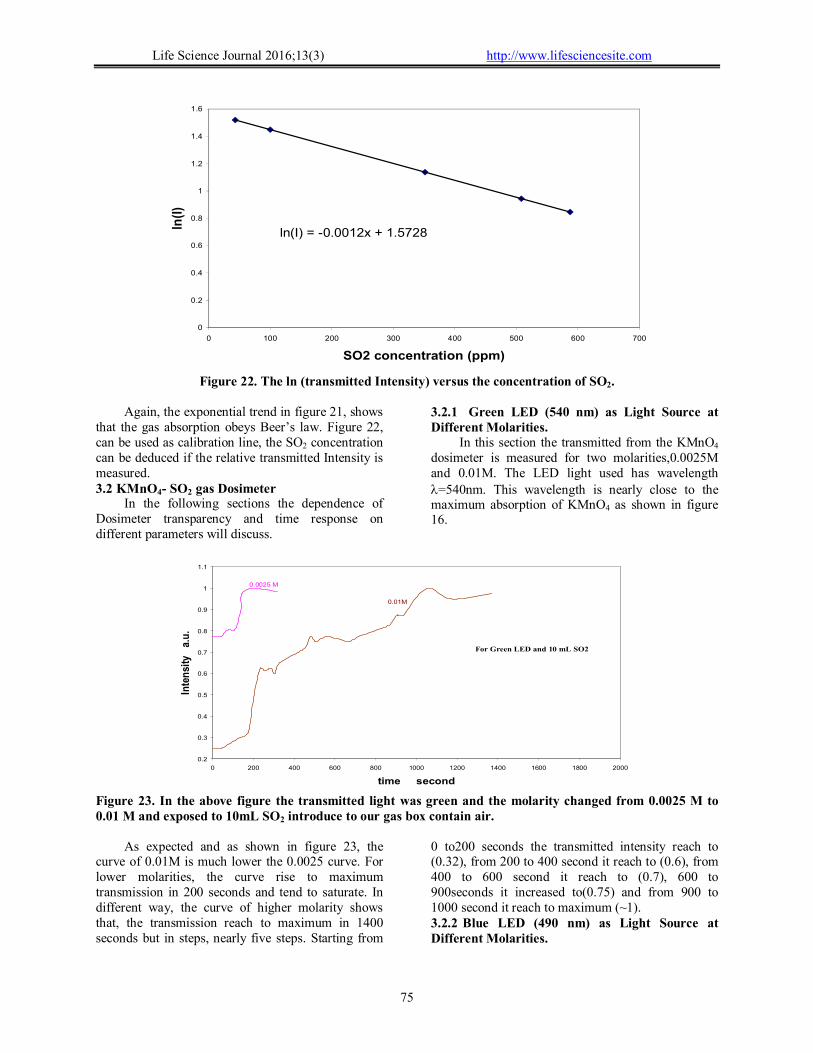
Figure 22. The ln (transmitted Intensity) versus the concentration of SO2.
Again, the exponential trend in figure 21, shows
that the gas absorption obeys Beer’s law. Figure 22, can be used as calibration line, the SO2 concentration can be deduced if the relative transmitted Intensity is measured. 3.2 KMnO4- SO2 gas Dosimeter
In the following sections the dependence of Dosimeter transparency and time response on different parameters will discuss.
3.2.1 Green LED (540 nm) as Light Source at Different Molarities.
In this section the transmitted from the KMnO4 dosimeter is measured for two molarities,0.0025M and 0.01M. The LED light used has wavelength =540nm. This wavelength is nearly close to the maximum absorption of KMnO4 as shown in figure 16.
Figure 23. In the above figure the transmitted light was green and the molarity changed from 0.0025 M to 0.01 M and exposed to 10mL SO2 introduce to our gas box contain air.
As expected and as shown in figure 23, the curve of 0.01M is much lower the 0.0025 curve. For lower molarities, the curve rise to maximum transmission in 200 seconds and tend to saturate. In different way, the curve of higher molarity shows that, the transmission reach to maximum in 1400 seconds but in steps, nearly five steps. Starting from
0 to200 seconds the transmitted intensity reach to (0.32), from 200 to 400 second it reach to (0.6), from 400 to 600 second it reach to (0.7), 600 to 900seconds it increased to(0.75) and from 900 to 1000 second it reach to maximum (~1). 3.2.2 Blue LED (490 nm) as Light Source at Different Molarities.
ln(I) = -0.0012x + 1.5728
0
0.2
0.4
0.6
0.8
1
1.2
1.4
1.6
0 100 200 300 400 500 600 700
SO2 concentration (ppm)
ln(I
)
0.2
0.3
0.4
0.5
0.6
0.7
0.8
0.9
1
1.1
0 200 400 600 800 1000 1200 1400 1600 1800 2000
time second
Inte
nsi
ty
a.u
.
0.0025 M
0.01M
For Green LED and 10 mL SO2

Life Science Journal 2016;13(3) http://www.lifesciencesite.com
76
At shorter wavelength of the transmitted light, = 490nm, the absorption of KMnO4 are much smaller than that at =535nm. The transmission are
studied at blue wavelength LED, = 490nm) at different molarities, 0.0025 M, 0.05 and 0.01 M and the results are shown in figure 24.
Figure 24. In the above figure the transmitted light was blue and the molarities changed as follow 0.0025 M,0.05 and to 0.01 M. the sample exposed separately to 10mL SO2 introduce to the r gas box contain air.
A shown in figure 24, the saturation time (the time at which the transmission start to be flat) increased as the molarity of KMnO4 is decreased. At 0.01M the time was 500 seconds, 0.005M it was 800 seconds. For 0.0025M the behavior shows fluctuation before the curve reaches to plateau after 550 seconds. This fluctuation may be due to the difference in transmission at stating points (different KMnO4
molarity) and at each moment of the reaction of SO2
gas with KMnO4. As the transmission decreases (molarity increases) at the beginning, the stability of reaction become well, which means smooth increasing of transmission with time. In conclusion, one can said the saturation time and the reaction stability increased as the molarity of the KMnO4
decreased.
Figure 25. In the above figure the transmitted blue light and the molarity was kept constant at0.01 M. The sample exposed separately to 2.5 mL (2500ppm), 5 mL (5000ppm), and 10mL (10000ppm) SO2 introduce to the gas box contain air.
Also from figure the transmitted signal at the starting time shows decreasing at higher molarity and
at green light than that for blue light and at the same molarity (0.01M). At low molarity (0.0025M) the
0.2
0.3
0.4
0.5
0.6
0.7
0.8
0.9
1
1.1
0 200 400 600 800 1000 1200 1400 1600 1800 2000
time second
Inte
ns
ity
a
.u.
0.005 M
0.01 M
0.0025 M
For Blue LED and 10 mL SO2
0.2
0.3
0.4
0.5
0.6
0.7
0.8
0.9
1
1.1
0 1000 2000 3000 4000 5000 6000
time second
Inte
nsit
y a
.u.
10 mL
5 mL
2.5 mL
For Blue LED and 0.01M of KMnO4
Life Science Journal 2016;13(3) http://www.lifesciencesite.com
77
transmitted signals at starting time are comparable for the both colors (wavelengths), i.e. the absorption is small at low molarity. 3.2.3 Blue LED (490 nm) and Different SO2Concentrations
At blue LED light and 0.01M molarity the transmission are measured as a function of SO2 concentration. Figure 24, shows that, At higher SO2 concentration (10mL) the transmission increased from 0.45 to 1 in ~800 seconds, is relatively short if it is compared with that at 5mL ~5000 seconds. The lower SO2 concentration (2.5mL) shows the same behavior as the 5mL.
The last the role of decreasing or increasing the SO2 concentration, where both the molarity of and the transmitted blue are the same. This means that, after certain time from the exposure to SO2 one can calibrate the graph to measure the SO2 concentration. 3.2.4. Two Different Wavelengths (490 nm and 540 nm)
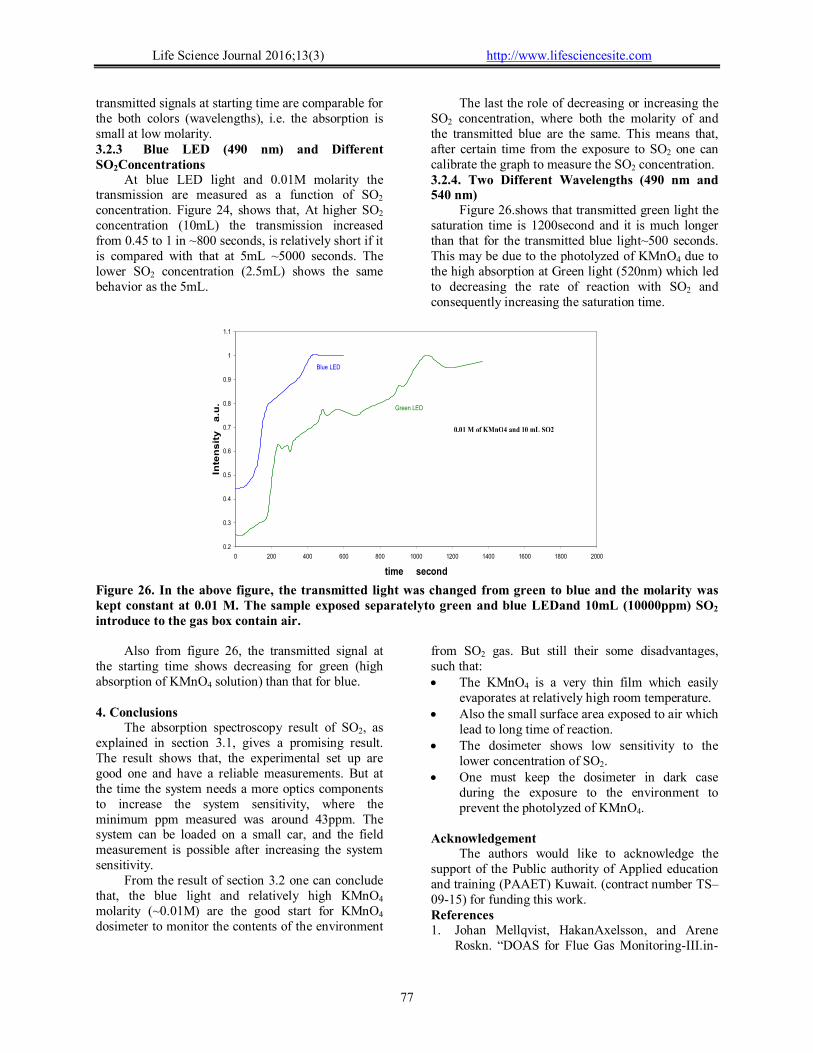
Figure 26.shows that transmitted green light the saturation time is 1200second and it is much longer than that for the transmitted blue light~500 seconds. This may be due to the photolyzed of KMnO4 due to the high absorption at Green light (520nm) which led to decreasing the rate of reaction with SO2 and consequently increasing the saturation time.
Figure 26. In the above figure, the transmitted light was changed from green to blue and the molarity was kept constant at 0.01 M. The sample exposed separatelyto green and blue LEDand 10mL (10000ppm) SO2 introduce to the gas box contain air.
Also from figure 26, the transmitted signal at the starting time shows decreasing for green (high absorption of KMnO4 solution) than that for blue. 4. Conclusions
The absorption spectroscopy result of SO2, as explained in section 3.1, gives a promising result. The result shows that, the experimental set up are good one and have a reliable measurements. But at the time the system needs a more optics components to increase the system sensitivity, where the minimum ppm measured was around 43ppm. The system can be loaded on a small car, and the field measurement is possible after increasing the system sensitivity.
From the result of section 3.2 one can conclude that, the blue light and relatively high KMnO4 molarity (~0.01M) are the good start for KMnO4 dosimeter to monitor the contents of the environment
from SO2 gas. But still their some disadvantages, such that: The KMnO4 is a very thin film which easily
evaporates at relatively high room temperature. Also the small surface area exposed to air which
lead to long time of reaction. The dosimeter shows low sensitivity to the
lower concentration of SO2. One must keep the dosimeter in dark case
during the exposure to the environment to prevent the photolyzed of KMnO4.
Acknowledgement
The authors would like to acknowledge the support of the Public authority of Applied education and training (PAAET) Kuwait. (contract number TS–09-15) for funding this work. References 1. Johan Mellqvist, HakanAxelsson, and Arene
Roskn. “DOAS for Flue Gas Monitoring-III.in-
0.2
0.3
0.4
0.5
0.6
0.7
0.8
0.9
1
1.1
0 200 400 600 800 1000 1200 1400 1600 1800 2000
time second
Inte
nsit
y
a.u
.
Blue LED
Green LED
0.01 M of KMnO4 and 10 mL SO2

Life Science Journal 2016;13(3) http://www.lifesciencesite.com
78
situ Monitoring of Sulfur Dioxide0, Nitogen Monoxide and Amonia” J. Quanr. Specrrosc. Rodiar. Transfer, 56(2), 225-240, 1996.
2. Taha M.A. Razek, Michael J. Miller, Saad S.M. Hassan, Mark A. Arnold, Talanta. “Optical sensor for sulfur dioxide based on fluorescence Quenching”. Talanta.50, 491–498, 1999.
3. Ramadan A..A.., Al- Saudairawi M., Alhajraf S. and Khan A.R. "Total Emission from Power stations and Evaluation of Their Impact in Kuwait". American J. of Environmental Sciences. 4(1),1-12, 2008.
4. Gerard Dooly, Colin Fitzpatrick and Elfed Lewis. "Hazardous exhaust gas monitoring using a deep UV based differential optical absorption spectroscopy (DOAS) system". Journal of physics: conference series 76, 012021, 2007.
5. Wei Chang., Yasunari Ono, Momoko Kumemura, Takashi Korenaga, Talanta. “On-line determination of trace sulfur dioxide in air by integrated microchip coupled with fluorescence detection” Talanta.67 646–650, 2005.
6. Schultes M. Absorption of Sulphur Dioxide with Sodium Hydroxide Solution in Packed Columns, Chemical Engineering & Technology. 21(2), 201-209, 1998.
7. Daniel L. Costa, Dwight Underhill, Solubility and reactivity of sulfur dioxide in various oils, American industrial Hygiene Association journal. 37(1), 46-51,1976.
8. Degtyareva A.A.., A.A. Kachan, L.N. Sharovol’s kaya and V.A. Shrubovich, "Photochemical reaction of sulphur dioxide with polyethylene", Polymer Science U.S.S.R. 17(10) 2471-2476, 1975.
9. Vandaele A.C., Simon P.C., Guilmot J.M., Carleer M., and Colin R. "SO2 Absorption cross section measurement in the UV using a Fourier transform spectrometer" J.geographical Research. 99(D12), 25599-25605, 1994.
10. Gerard Dooly, Colin Fitzpatrick and Elfed Lewis. Optical sensing of Hazardous exhaust emissions using a UV extrinsic sensor. Energy. 33,657-666, 2008.
2/28/2016