Life Prediction of Gas Turbine Materials -...
69
9 Life Prediction of Gas Turbine Materials Xijia Wu Institute for Aerospace Research, National Research Council Canada 1. Introduction The advance of gas turbine engines and the increase in fuel efficiency over the past 50 years relies on the development of high temperature materials with the performance for the intended services. The cutaway view of an aero engine is shown in Fig. 1. During the service of an aero engine, a multitude of material damage such as foreign object damage, erosion, high cycle fatigue, low cycle fatigue, fretting, hot corrosion/oxidation, creep, and thermomechanical fatigue will be induced to the components ranging from fan/compressor sections up front to high pressure (HP) and low pressure (LP) turbine sections at the rear. The endurance of the gas turbine engine to high temperature is particularly marked by the creep resistance of HP turbine blade alloy. Figure 2 shows the trend of firing temperature and turbine blade alloy capability (Schilke, 2004). Nowadays, the state-of-the-art turbine blade alloys are single crystal Ni-base superalloys, which are composed of intermetallic γ’ (Ni 3 Al) precipitates in a solution-strengthened γ matrix, solidified in the [100] crystallographic direction. Turbine disc alloys are also mostly polycrystalline Ni-base superalloys, produced by wrought or powder metallurgy processes. Compressor materials can range from steels to titanium alloys, depending on the cost or weight-saving concerns in land and aero applications. Coatings are often applied to offer additional protection from thermal, erosive and corrosive attacks. In general, the advances in gas turbine materials are often made through thermomechanical treatments and/or compositional changes to suppress the failure modes found in previous services, since these materials inevitably incur service-induced degradation, given the hostile (hot and corrosive) operating environment. Therefore, the potential failure mechanisms and lifetimes of gas turbine materials are of great concern to the designers, and the hot-section components are mostly considered to be critical components from either safety or maintenance points of view. Because of its importance, the methodology of life prediction has been under development for many decades (see reviews by Viswanathan, 1989; Wu et al., 2008). The early approaches were mainly empirically established through numerous material and component tests. However, as the firing temperatures are increased and the operating cycles become more complicated, the traditional approaches are too costly and time-consuming to keep up with the fast pace of product turn-around for commercial competition. The challenges in life prediction for gas turbine components indeed arise due to their severe operating conditions: high mechanical loads and temperatures in a high-speed corrosive/erosive gaseous environment. The combination of thermomechanical loads and a hostile environment may induce a multitude of material damages including low-cycle fatigue, creep, fretting and oxidation. Gas turbine designers need analytical methods to extrapolate the limited material www.intechopen.com
Transcript of Life Prediction of Gas Turbine Materials -...

9
Life Prediction of Gas Turbine Materials
Xijia Wu Institute for Aerospace Research, National Research Council
Canada
1. Introduction
The advance of gas turbine engines and the increase in fuel efficiency over the past 50 years relies on the development of high temperature materials with the performance for the intended services. The cutaway view of an aero engine is shown in Fig. 1. During the service of an aero engine, a multitude of material damage such as foreign object damage, erosion, high cycle fatigue, low cycle fatigue, fretting, hot corrosion/oxidation, creep, and thermomechanical fatigue will be induced to the components ranging from fan/compressor sections up front to high pressure (HP) and low pressure (LP) turbine sections at the rear. The endurance of the gas turbine engine to high temperature is particularly marked by the creep resistance of HP turbine blade alloy. Figure 2 shows the trend of firing temperature and turbine blade alloy capability (Schilke, 2004). Nowadays, the state-of-the-art turbine
blade alloys are single crystal Ni-base superalloys, which are composed of intermetallic γ’ (Ni3Al) precipitates in a solution-strengthened γ matrix, solidified in the [100] crystallographic direction. Turbine disc alloys are also mostly polycrystalline Ni-base superalloys, produced by wrought or powder metallurgy processes. Compressor materials can range from steels to titanium alloys, depending on the cost or weight-saving concerns in land and aero applications. Coatings are often applied to offer additional protection from thermal, erosive and corrosive attacks. In general, the advances in gas turbine materials are often made through thermomechanical treatments and/or compositional changes to suppress the failure modes found in previous services, since these materials inevitably incur service-induced degradation, given the hostile (hot and corrosive) operating environment. Therefore, the potential failure mechanisms and lifetimes of gas turbine materials are of great concern to the designers, and the hot-section components are mostly considered to be critical components from either safety or maintenance points of view. Because of its importance, the methodology of life prediction has been under development for many decades (see reviews by Viswanathan, 1989; Wu et al., 2008). The early approaches were mainly empirically established through numerous material and component tests. However, as the firing temperatures are increased and the operating cycles become more complicated, the traditional approaches are too costly and time-consuming to keep up with the fast pace of product turn-around for commercial competition. The challenges in life prediction for gas turbine components indeed arise due to their severe operating conditions: high mechanical loads and temperatures in a high-speed corrosive/erosive gaseous environment. The combination of thermomechanical loads and a hostile environment may induce a multitude of material damages including low-cycle fatigue, creep, fretting and oxidation. Gas turbine designers need analytical methods to extrapolate the limited material
www.intechopen.com

Gas Turbines
216
property data, often generated from laboratory testing, to estimate the component life for the design operating condition. Furthermore, the requirement of accurate and robust life prediction methods also comes along with the recent trend of prognosis and health management, where assessment of component health conditions with respect to the service history and prediction of the remaining useful life are needed in order to support automated mission and maintenance/logistics planning. To establish a physics-based life prediction methodology, in this chapter, the fundamentals of high temperature deformation are first reviewed, and the respective constitutive models
Fig. 1. Cutaway view of the Rolls-Royce Trent 900 turbofan engine used on the Airbus A380 family of aircraft (Trent 900 Optimised for the Airbus A380 Family, Rolls-Royce Plc, Derby UK, 2009).
Fig. 2. Increase of firing temperature with respect to turbine blade alloys development (Schilke, 2004).
www.intechopen.com
Life Prediction of Gas Turbine Materials
217
are introduced. Then, the evolution of material life by a combination of damage mechanisms is discussed with respect to general thermomechanical loading. Furthermore, crack growth problems and the damage tolerance approach are also discussed with the application of fracture mechanics principles.
2. Fundamentals of high temperature deformation
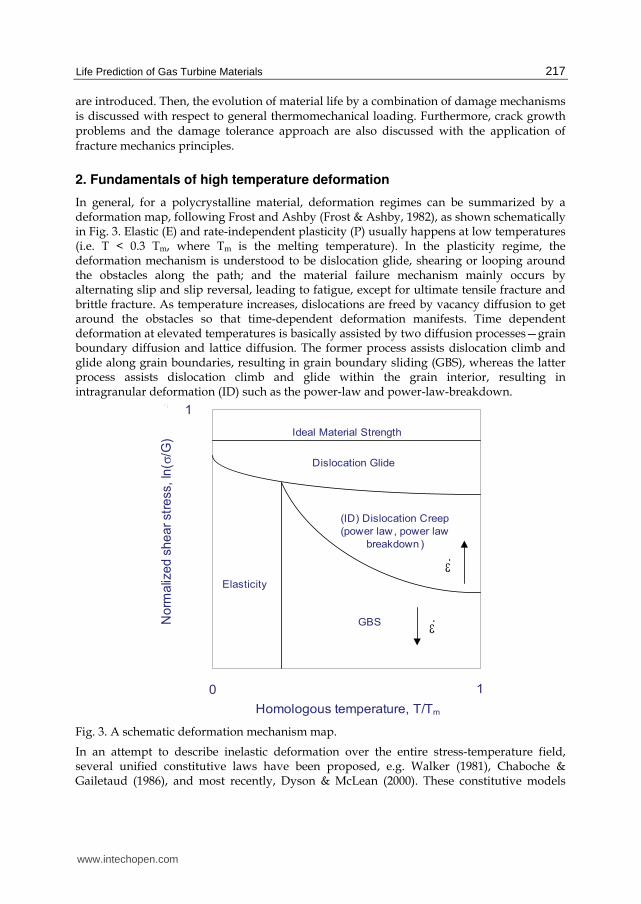
In general, for a polycrystalline material, deformation regimes can be summarized by a deformation map, following Frost and Ashby (Frost & Ashby, 1982), as shown schematically in Fig. 3. Elastic (E) and rate-independent plasticity (P) usually happens at low temperatures (i.e. T < 0.3 Tm, where Tm is the melting temperature). In the plasticity regime, the deformation mechanism is understood to be dislocation glide, shearing or looping around the obstacles along the path; and the material failure mechanism mainly occurs by alternating slip and slip reversal, leading to fatigue, except for ultimate tensile fracture and brittle fracture. As temperature increases, dislocations are freed by vacancy diffusion to get around the obstacles so that time-dependent deformation manifests. Time dependent deformation at elevated temperatures is basically assisted by two diffusion processes—grain boundary diffusion and lattice diffusion. The former process assists dislocation climb and glide along grain boundaries, resulting in grain boundary sliding (GBS), whereas the latter process assists dislocation climb and glide within the grain interior, resulting in intragranular deformation (ID) such as the power-law and power-law-breakdown.
1
0 1
No
rma
lize
d s
he
ar
str
ess,
ln(σ
/G)
Homologous temperature, T/Tm
Ideal Material Strength
Dislocation Glide
(ID) Dislocation Creep
(power law, power law
breakdown)
Elasticity
GBS
εɺ
εɺ
(P)
Fig. 3. A schematic deformation mechanism map.
In an attempt to describe inelastic deformation over the entire stress-temperature field, several unified constitutive laws have been proposed, e.g. Walker (1981), Chaboche & Gailetaud (1986), and most recently, Dyson & McLean (2000). These constitutive models
www.intechopen.com

Gas Turbines
218
employ a set of evolution rules for kinematic and isotropic hardening to describe the total viscoplastic response of the material, but do not necessarily differentiate whether the contribution comes from intrgranular deformation mechanism or GBS, and hence have limitations in correlating with the transgranular, intergranular and/or mixed failure modes that commonly occur in gas turbine components. Therefore, a physics-based theoretical framework encompassing the above deformation and damage mechanisms is needed. To that end, we proceed with the basic concept of strain decomposition that the total inelastic strain in a polycrystalline material can be considered to consist of intragranular strain εg and grain boundary sliding εgbs, as:
in g gbsε ε ε= + (1)
The physics-based strain decomposition rule, Eq. (1), with the associated deformation mechanisms is the foundation for the development of an integrated creep-fatigue (ICF) modelling framework as outlined in the following sections (Wu et al. 2009).
2.1 Intragranular deformation Intragranular deformation can be viewed as dislocation motion, which may occur by glide at low temperatures and climb plus glide at high temperatures, overcoming the energy barriers of the lattice. By the theory of deformation kinetics (Krausz & Eyring, 1975), the rate of the net dislocation movement can be formulated as a hyperbolic sine function of the applied stress (Wu & Krausz, 1994). In keeping consistency with the Prandtl-Reuss-Drucker theory of plasticity, the flow rule of intragranular strain, in tensor form, can be expressed as
g g gp=$ $ nε (2)
where gp$ is the plastic multiplier as defined by
( ) 22 (1 )sinh :3g g g gp A Mp ψ= + =$ $ $ε ε (3)
where A is an Arrhenius-type rate constant, M is a dislocation multiplication factor, and ng is the flow direction as defined by
( )3
2
gg eq
gσ−= s
nχ
(4)
where s is the deviatoric stress tensor and χg is the back stress tensor. Note that the stress and temperature dependence of the plastic multiplier is described by a hyperbolic sine function, Eq. (3), with the evolution of activation energy ψ given by:
eqg
V σkT
= $$ψ (5)
where V is the activation volume, k is the Boltzmann constant, and T is the absolute temperature in Kelvin. Eq. (3) covers both the power-law and the power-law-breakdown regimes in Fig. 3. As intragranular deformation proceeds, a back stress may arise from competition between work hardening (dislocation pile-up and network formation) and recovery (dislocation climb) as:
www.intechopen.com
Life Prediction of Gas Turbine Materials
219
2
3g g g gH κχ ε χ= −$ $ (6)
where Hg is the work-hardening coefficient and κ is the climb rate (see detailed formulation later). Note that more complicated expressions that consider both hardening and dynamic/static recovery terms may need to be used to formulate the back stress with large deformation and microstructural changes, but to keep the simplicity for small-scale deformation (<1%), Eq. (6) is suffice, as demonstrated in the later examples. The effective equivalent stress for intragranular deformation is given by
( ) ( )3:
2eqg g gσ = − −s sχ χ (7)
where the column (:) signifies tensor contraction.
2.2 Grain boundary sliding Based on the grain boundary dislocation glide-climb mechanism in the presence of grain
boundary precipitates (Wu & Koul, 1995; 1997), the governing flow equation for GBS can be
expressed as
gbs gbs gbsp=$ $ nε (8)
with a GBS multiplier as defined by
( )( )
gbs
1
2
eq eqq qicgbsσ σ σDμ b l r
p ┮kT d b μ
− −+⎛ ⎞ ⎛ ⎞= ⎜ ⎟ ⎜ ⎟⎝ ⎠ ⎝ ⎠$ b (9)
where D is the diffusion constant, μ is the shear modulus, and b is the Burgers vector, d is
the grain size, r is the grain boundary precipitate size, l is the grain boundary precipitate
spacing, and q is the index of grain boundary precipitate distribution morphology (q = 1 for
clean boundary, q =2 for discrete distribution, and q = 3 for a network distribution). The
GBS flow direction is defined by
( )3
2
gbs
gbs eqgbsσ
−= s
n
χ (10)
The two equivalent stresses in Eq. (9) are given by
( ) ( )3:
2
eqgbs gbsgbsσ = − −s sχ χ (11)
and
3
:2
eqσ = s s (12)
The evolution of the grain boundary back stress in the presence of grain boundary precipitates is given by (Wu & Koul, 1995)
www.intechopen.com

Gas Turbines
220
2
3gbs gbs gbs gbsH κ= −$ $χ ε χ (13)
where Hgbs is the grain boundary work hardening coefficient, and κ is the dislocation climb rate as given by
( )eq
icσ σbκ μ−= Dμ
kT (14)
The equivalent stress for GBS, eqgbsσ , controls the grain boundary dislocation glide with a
back stress χgbs. The other equivalent stress, eqσ , controls grain boundary dislocation climb, once it surpass a threshold stress, σic, that arises from the constraint of grain boundary precipitates. As shown in Eq. (9), the GBS multiplier is controlled by the grain boundary diffusion constant D and grain boundary microstructural features such as the grain size, the grain boundary precipitate size and spacing, and their morphology. The back stress formulation, Eq. (13), states the competition between dislocation glide, which causes grain boundary dislocation pile-up, and recovery by dislocation climb. Henceforth, Eq. (9) depicts the grain boundary plastic flow as a result of dislocation climb plus glide overcoming the microstructural obstacles present at the grain boundaries. Last but not least, GBS is also affected by the grain boundary waveform, as given by the factor φ (Wu & Koul, 1997):
2
2
2- 1
21
2- 1
1
for trianglular boundariesh
for sinusoidal boundariesh
λφπλ
⎧⎪ ⎛ ⎞⎪ + ⎜ ⎟⎪ ⎝ ⎠⎪= ⎨⎪⎪ ⎛ ⎞⎪ + ⎜ ⎟⎪ ⎝ ⎠⎩
(15)
where λ is wavelength and h is the amplitude. By solving all the components of inelasticity, the evolution of the stress tensor is governed by
: ( )in= −$ $$σ ε εC (16)
3. Deformation processes and constitutive models
3.1 Cyclic deformation and fatigue It is commonly known that a metal subjected to repetitive or flunctuating stress will fail at a stress much lower than its ultimate strength. Failures occuring under cyclic loading are generally termed fatigue. The underlying mechanisms of fatigue is dislocation glide, leading to formation of persistent slip bands (PBS) and a dislocation network in the material. Persistent slip bands, when intersecting at the interface of material discontinuities (surface, grain boundaries or inclusions, etc.) result in intrusions/extrusions or dislocation pile-ups, inevitably leading to crack nucleation. To describe the process of cyclic deformation, we start with tensile deformation as follows. For uniaxial strain-controlled loading, the deformation is constrained as:
constantp
σε ε〝
= + =$$ $ (17)
www.intechopen.com
Life Prediction of Gas Turbine Materials
221
Substituting Eq. (3-7) into Eq. (17) (neglecting dislocation climb, i.e., g Hκχ ε<< $ ; and
multiplication, i.e., M = 0), we have the first-order differential equation of Ψ, as (Wu et al.,
2001)
2 1 sinhEV HΨ ε A ΨkT E
⎡ ⎤⎛ ⎞= − +⎢ ⎥⎜ ⎟⎝ ⎠⎣ ⎦$ $ (18)
which can be solved as
2
0 11exp
Ψ
Ψ
VEε(t t ) ┯e a a
┯ b kT┯e b
−−
⎧ ⎫⎛ ⎞ − +⎛ ⎞− − ⎪ ⎪= −⎜ ⎟ ⎜ ⎟ ⎨ ⎬⎜ ⎟⎜ ⎟ ++ ⎝ ⎠ ⎪ ⎪⎝ ⎠ ⎩ ⎭$
(19)
where
2
21 121 1 1
┯A H┯ , a , b ┯ε E ┯
+ −⎛ ⎞= + = = + +⎜ ⎟⎝ ⎠$ (20)
The initial time of plastic deformation is defined by
00
0 0p(σ Hε σ )
ΨkT
− −= = (21)
where ε0p is the plastic strain accumulated from the prior deformation history, and σ0, as an
integration constant, represents the initial lattice resistance to dislocation glide. At the first
loading, ε0p = 0. Since the deformation is purely elastic before the condition, Eq. (21), is met:
σ = E ε$ t, then t0 =σ0/(E ε$ ). Once the stress exceeds the initial lattice resistance in the
material, i.e., σ > σ0, plasticity commences. In this sense, σ0 corresponds to the critial
resolved shear stress by a Taylor factor. From Eq. (20), we can obtain the stress-strain response as follows:
0
( )ln
1 ( )p
kT a ω bσ Hε σV ω ┯
εε
⎛ ⎞+− − = − ⎜ ⎟⎜ ⎟−⎝ ⎠ (22)
where, ω(ε) is a response function as defined by
2
0 11exp
V(Eε σ ) ┯aω(ε)┯ b kT
⎧ ⎫− +⎛ ⎞− ⎪ ⎪= −⎜ ⎟ ⎨ ⎬⎜ ⎟+⎝ ⎠ ⎪ ⎪⎩ ⎭ (23)
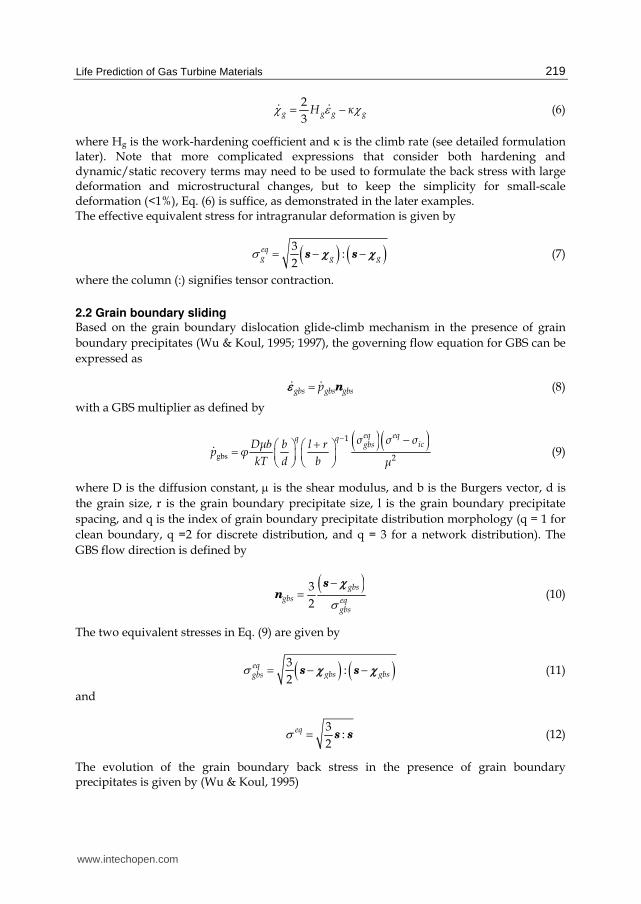
Eq. (22) basically describes the accumulation of plastic strain via the linear strain-hardening rule with dislocation glide as the dominant process and limited dislocation climb activities. It is applicable to high strain rate loading conditions, which are often encountered during engine start-up and shutdown or vibration conditions caused by mechanical and/or aerodynamic forces. Based on the deformation kinetics, Eq. (22) describes the time and temperature dependence of high temperature deformation. As an example, the tensile behaviors of IN738LC at 750 oC, 850 oC and 950 oC are described using Eq. (22) and shown in Fig. 4, in comparison with the
www.intechopen.com
Gas Turbines
222
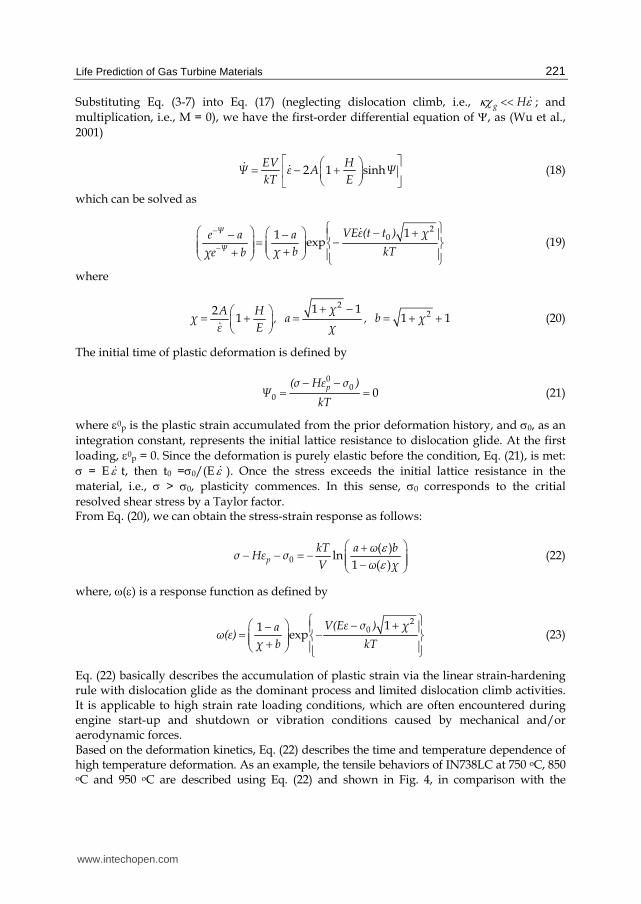
experimental data. The strain rate dependence of the tensile behavior of this alloy at 950oC is also demonstrated in Fig. 5. The parameters for this material model are given in Table 1.
Strain (mm/mm)
Str
ess
(MP
a)
0 0.005 0.01 0.0150
100
200
300
400
500
600
700
800
900
IN738LCStrain Rate: 2x10⁻⁵
sec-1
9500C
8500C
7500C
Fig. 4. Stress-strain curves for the IN738LC with the lines as described by Eq. (22).
Strain (mm/mm)
Str
ess
(MP
a)
0 0.005 0.01 0.0150
100
200
300
400
500
600
2x10⁻³
sec-1
2x10⁻⁴
sec-1
2x10⁻⁵
sec-1
Model
IN738LC - 9500C
Fig. 5. Stress-strain responses of IN738LC to different loading strain rates at 950 oC.
www.intechopen.com

Life Prediction of Gas Turbine Materials
223
Temperature (ºC) 750 850 950
Initial lattice resistance, σ0 (MPa) 540 285 110
Work Hardening Coefficient, H (MPa/mm/mm)
15000 13736 12478
Modulus of Elasticity, E (GPa) 175.5 151.4 137.0
Strain-Rate Constant,
A = A0exp[-ΔG0≠/kT] (sec-1) 3.5x10⁻⁸ 1.56x10⁻⁷ 5.5x10⁻⁷
Activation Constants
Activation Volume, V (m3) 3.977x10⁻²²
Pre-exponential, A0 (sec-1) 0.7
Activation Energy, ΔG0≠ (J) 2.38×10⁻¹⁹
Table 1. Constitutive Model Parameters for IN738LC
This constitutive model has 6 parameters: E, H, V, σ0, A0 and ΔG0≠, which have defined physical meanings. The elastic modulus, E, the work-hardening coefficient, H and the initial
activation stress σ0, are temperature-dependent. The activation parameters, V, A0 and ΔG0≠, are constants corresponding to a “constant microstructure”. As far as deformation in a lifing
process is concerned, which usually occurs within a small deformation range of ±1%, the description is mostly suffice. The present model, in the context of Eq. (22), also incorporates
some microstructural effects via H and σ0. The significance will be further discussed later when dealing with fatigue life prediction. But before that, let us examine the cyclic deformation process as follows. Under isothermal fully-reversed loading conditions, first, Eq. (22) describes the monotonic loading up to a specified strain. Upon load reversal at the maximum stress point, the
material has 2σ0 + Hεp as the total stress barrier to yield in the reverse cycle. This process repeats as the cycling proceeds. As an example, the hysteresis loop of IN738LC is shown in Fig. 6. The solid line represents the model prediction with the parameters given in Table 1
(except σ0 = 40 MPa for this coarser grained material). The model prediction is in very good agreement with the experimental data, except in the transition region from the elastic to the steady-state plastic regimes, which may be attributed to the model being calibrated to a finer-grained material.
As Eq. (22) implies, material deforms purely elastically when the stress is below σ0, but plasticity starts to accumulate just above that, which may still be well below the engineering yield surface defined at 0.2% offset. This means that the commencing of plastic flow may first occur at the microstructural level, even though the macroscopic behaviour still appears
to be in the elastic regime. In this sense, σ0 may correspond well to the fatigue endurance limit. Therefore, just by analyzing the tensile behaviour with Eq. (22), one may obtain an important parameter for fatigue life prediction. Tanaka and Mura (Tanaka & Mura, 1981) have given a theoretical treatment for fatigue crack nucleation in terms of dislocation pile-ups. Fig. 7 shows a schematic of crack nucleation by a) vacancy dipole, which leads to intrusion; b) interstitial dipole which leads to extrusion, or c) tripole that corresponds to an intrusion-extrusion pair. They obtained the following crack nucleation formula:
www.intechopen.com

Gas Turbines
224
Mechanical Strain (mm/mm)
Str
ess
(MP
a)
-0.005 -0.0025 0 0.0025 0.005
-200
-150
-100
-50
0
50
100
150
200 Experiment
Predicted
IN738LCTemperature: 950
0C
Strain Rate: 2x10⁻⁵
sec-1
Fig. 6. Hysteresis loop of IN738LC at 950oC.
(a) vacancy dipole
(b) interstitial dipole
(c) tripole
Fig. 7. Dislocation pile-ups by (a) vacancy dipoles (intrusion), (b) interstitial dipoles (extrusion) and (c) tripoles (intrusion-extrusion pair).
2
4(1 ) 1sc
wN
b
νμ γ−= Δ (24)
where Δγ is the plastic shear strain range. Under strain-controlled cycling conditions, Δεp = Δε - Δσ/E, Eq. (24) can also be written in the following form:
2
21p
⦆σCε C ⦆ε
N E
⎛ ⎞= = −⎜ ⎟⎝ ⎠ (25)
www.intechopen.com
Life Prediction of Gas Turbine Materials
225
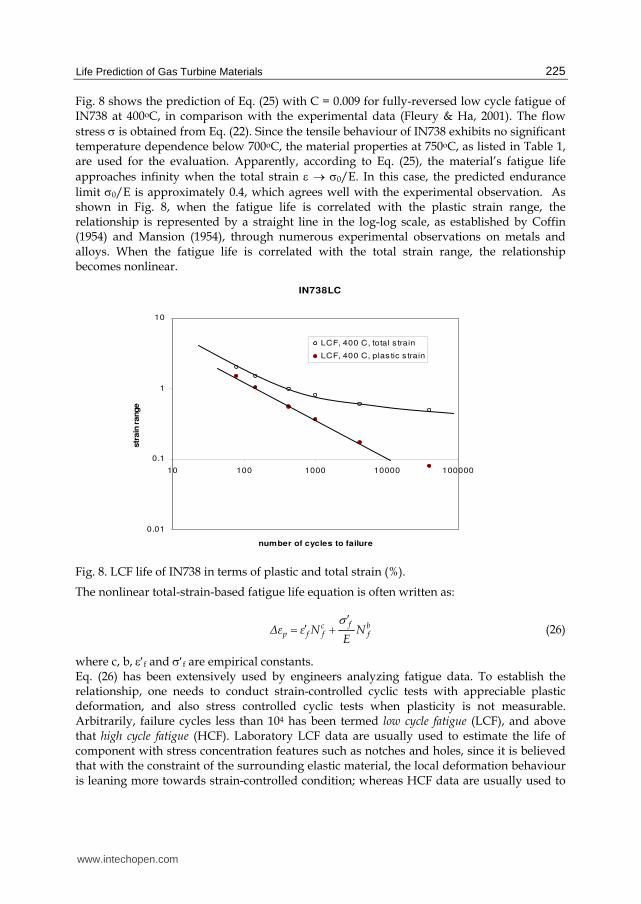
Fig. 8 shows the prediction of Eq. (25) with C = 0.009 for fully-reversed low cycle fatigue of IN738 at 400oC, in comparison with the experimental data (Fleury & Ha, 2001). The flow
stress σ is obtained from Eq. (22). Since the tensile behaviour of IN738 exhibits no significant temperature dependence below 700oC, the material properties at 750oC, as listed in Table 1, are used for the evaluation. Apparently, according to Eq. (25), the material’s fatigue life
approaches infinity when the total strain ε → σ0/E. In this case, the predicted endurance
limit σ0/E is approximately 0.4, which agrees well with the experimental observation. As shown in Fig. 8, when the fatigue life is correlated with the plastic strain range, the relationship is represented by a straight line in the log-log scale, as established by Coffin (1954) and Mansion (1954), through numerous experimental observations on metals and alloys. When the fatigue life is correlated with the total strain range, the relationship becomes nonlinear.
Fig. 8. LCF life of IN738 in terms of plastic and total strain (%).
The nonlinear total-strain-based fatigue life equation is often written as:
fc b
p f f f⦆ε ε N NE
σ ′′= + (26)
where c, b, ε′f and σ′f are empirical constants. Eq. (26) has been extensively used by engineers analyzing fatigue data. To establish the relationship, one needs to conduct strain-controlled cyclic tests with appreciable plastic deformation, and also stress controlled cyclic tests when plasticity is not measurable. Arbitrarily, failure cycles less than 104 has been termed low cycle fatigue (LCF), and above that high cycle fatigue (HCF). Laboratory LCF data are usually used to estimate the life of component with stress concentration features such as notches and holes, since it is believed that with the constraint of the surrounding elastic material, the local deformation behaviour is leaning more towards strain-controlled condition; whereas HCF data are usually used to
IN738LC
0.01
0.1
1
10
10 100 1000 10000 100000
number of cycles to failure
str
ain
range
LCF, 400 C, total s train
LCF, 400 C, plas tic s train
www.intechopen.com
Gas Turbines
226
assess the component life under elastic stresses. For gas turbine engine components, an LCF cycle may represent major loading cycles such as engine start up -shutdown. HCF, on the other hand, occurs under low-amplitude cyclic stresses where deformation is primarily elastic. HCF failures are usually associated with vibration-induced stresses due to mistune or other geometrical damage that change the vibration characteristics of the component. It can become a life-threatening mode of failure especially when it is superimposed on LCF induced cracks. Under these conditions, components vibrate with high frequencies that can reach thousands of cycles per second, and hence exhaust its fatigue life after a short period of time. Eq. (25) can also be extrapolated to HCF under stress controlled fatigue conditions. When the applied stress is well below the engineering yield point, the logarithm term in Eq. (22) is nearly zero such that the plastic strain can be approximated by
0p
σ σεH
−≈ (27)
and Eq. (25) can be rewritten as
1 20
/σ σ H(BN)−= + (28)
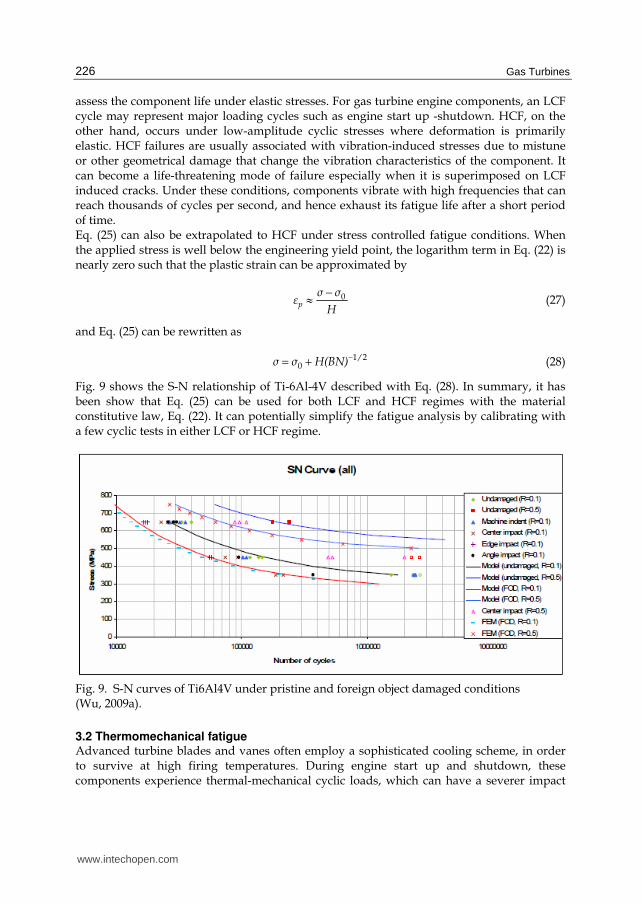
Fig. 9 shows the S-N relationship of Ti-6Al-4V described with Eq. (28). In summary, it has been show that Eq. (25) can be used for both LCF and HCF regimes with the material constitutive law, Eq. (22). It can potentially simplify the fatigue analysis by calibrating with a few cyclic tests in either LCF or HCF regime.
Fig. 9. S-N curves of Ti6Al4V under pristine and foreign object damaged conditions (Wu, 2009a).
3.2 Thermomechanical fatigue Advanced turbine blades and vanes often employ a sophisticated cooling scheme, in order to survive at high firing temperatures. During engine start up and shutdown, these components experience thermal-mechanical cyclic loads, which can have a severer impact
www.intechopen.com

Life Prediction of Gas Turbine Materials
227
on the life of the material than isothermal conditions. Thermomechanical fatigue (TMF) refers to the fatigue behaviour of a material under simultaneously thermal and mechanical loads. For laboratory studies, usually simple TMF cycles are employed: i) the in-phase (IP) cycle, which has a 0o phase angle between thermal and mechanical loads; ii) the out-of-phase (OP) cycle, which has a 180o phase angle; and iii) the diamond phase (DP) cycle, which has a phase angle in between; as schematically shown in Fig. 10. The OP and IP cycles represent two extreme conditions, where the maximum stress is reached at the “hot” end of IP and the “cold” end of OP temperature cycle. A more sophisticated engine cycle is shown in Fig. 11, which consists of a half diamond-phase cycle, a thermal excursion from Tmean to Tmax, and a hold period at the maximum load.
Temperature
Tmax Tmin
IP OP DP Strain
Fig. 10. Temperature-strain cycles for different TMF tests.
Engine TMF Cycle
0
0.2
0.4
0.6
0.8
1
1.2
0 0.2 0.4 0.6 0.8 1 1.2
temperature
en
gin
e s
peed
Startup
Shut down
Fig. 11. An engine TMF cycle.
www.intechopen.com

Gas Turbines
228
During TMF, the total strain (εtot) is the sum of thermal and mechanical strain components:
0tot th mech mechε ε ε (T T ) εα= + = − + (29)
where εth is the thermal strain, T0 is the reference temperature, T is the current temperature,
and α is the thermal expansion coefficient. The mechanical strain (εmech) in general can be considered as the sum of the elastic and inelastic strain components. The damage accumulation and interactions during TMF can be very complex, because it usually involves fatigue, oxidation and creep in some combination. In extreme cases, the combined effects of temperature and stress could just induce one dominant damage mode, for example, it is generally believed that the IP cycle produces predominantly creep damage, while the OP cycle induces oxide-scale cracking (Sehitoglu, 1992). However, under general TMF conditions, the combined damage mechanisms and their interactions can be complicated. Many factors such as the maximum and minimum temperature, thermal and mechanical strain ranges, the phasing between temperature and strain, the strain rate, dwell time, and environment can all influence TMF life. It is almost a formidable task to characterize these effects completely by experimental approaches such as those adopted for LCF and HCF assessments. Therefore, physics based models are needed to describe the complex damage processes under TMF loading. In this section, the cyclic thermomechanical deformation behaviour is described. Interactions with oxidation and creep under general TMF conditions will be discussed later.
For TMF, we assume that the evolution of the energy, Ψ, undergoes a series of infinitesimal
isothermal steps, for each i-th step, the energy state evolves from Ψi-1 to Ψi over the time
interval Δti = ti –ti-1 at a constant temperature Ti. Then, Eq. (18) can be integrated into the form:
1
21ln
i
i
ΨΨ
iΨiΨ
VEε ┯e a ⦆tkT┯e b
−
−−
⎛ ⎞ +− = −⎜ ⎟⎜ ⎟+⎝ ⎠$
(i=1,2,…) (30)
Summing up all these infinitesimal steps, we have:
1
1
ln1
i
i
N N
iii
VEe at
kTe b i
ε χχ
−
Ψ 2−Ψ−Ψ= Ψ
⎛ ⎞ 1+− = − Δ⎜ ⎟⎜ ⎟+⎝ ⎠ =∑ ∑ $ (31)
Let N→∞, the left-hand side of Eq. (31) will be equal to the logarithmic difference between
the final state and the initial state, and the right-hand side is an integration of the
temperature-dependent terms over the loading period. After mathematical rearrangement,
we have:
0
1exp
t
t
Ve a adt
b kTe b
μγ χχχ
2−Ψ−Ψ
⎧ ⎫⎛ ⎞ 1+⎛ ⎞− − ⎪ ⎪= −⎜ ⎟ ⎨ ⎬⎜ ⎟⎜ ⎟ ++ ⎝ ⎠ ⎪ ⎪⎝ ⎠ ⎩ ⎭∫ $ (32)
where t0 is the time to reach the elastic limit, or in other words, for plastic flow to commence, as defined by Eq. (21). Let
www.intechopen.com

Life Prediction of Gas Turbine Materials
229
0
1( ) exp
t
t
VEat dt
b kT
ε χω χ2⎧ ⎫1+⎛ ⎞− ⎪ ⎪= −⎨ ⎬⎜ ⎟+⎝ ⎠ ⎪ ⎪⎩ ⎭∫ $
(33)
and assume that within the temperature range of TMF, the variation of E is moderate such
that it can be represented by its average Em, and 21 1χ+ ≈ since χ is usually small, the ω
function can be evaluated as,
0
1exp lnmVEa T
b k T T
ε χω χ2⎧ ⎫Δ 1+⎛ ⎞− ⎪ ⎪= ⎨ ⎬⎜ ⎟+ Δ⎝ ⎠ ⎪ ⎪⎩ ⎭
∓ (34)
where ΔT = Tmax - Tmin is the temperature range, Δε is the total strain range, the -/+ sign is used for the temperature rising or declining halves of the cycle, respectively, and T0 denotes the temperature point at which the stress reaches the elastic limit, which can be determined
based on the thermomechanical cycle profile, i.e., the T - ε relationship. Then, Eq. (32) can be rewritten into the stress vs. strain function, similar to Eq. (22), as
0 ln1
p
kT a bH
V
ωσ ε σ ωχ⎛ ⎞+− − = − ⎜ ⎟−⎝ ⎠ (35)
The stress-strain response of the coarse-grained IN738LC under an out-of-phase thermomechanical fatigue condition is predicted using Eq. (35), as shown in Figure 2.10,
with the parameter values given in Table 2.1 but with a reduced σ0 =40MPa for the coarse-grained (d~5mm) material. The predicted hysteresis loop is in good agreement with the experimentally measured response.
Strain (mm/mm)
Str
ess
(MP
a)
-0.005 -0.0025 0 0.0025 0.005-300
-200
-100
0
100
200
300
400
500
ExperimentPredicted
IN738LC - OP TMFTemperature: 750-950
0C
Strain Rate: 2x10⁻⁵
sec-1
Fig. 12. Stress-strain response of IN738LC (coarse-grain) during an OP-TMF cycle.
www.intechopen.com
Gas Turbines
230
3.3 Creep Creep is a mode of inelastic material deformation occurring under sustained loading at high temperatures, usually above 0.3 Tm (Tm is the material’s melting point). Creep can be one of the critical factors determining the integrity of components at elevated temperatures. In gas turbine engines, especially in hot sections, components such as turbine blades are subjected to sustained loads (centrifugal force and pressure) at high temperatures during the operation. Creep of a turbine blade can also cause dimensional changes that either reduce its aerodynamic efficiency or lead to elongation that rubs the engine casing, which may induce additional vibration and noise. Furthermore, creep damage may interact with fatigue that leads to significant reduction in the service life of the component. Creep mechanisms have been extensively reviewed (Frost & Ashby, 1982; Ashby & Dyson, 1985; Wu & Koul, 1996). It is generally understood that the creep rate has different stress dependence by different mechanisms. Nevertheless, the steady-state creep rate (or the minimum creep rate) is often expressed in a Norton-Bailey form, as
0 exp nQε ART
σ⎛ ⎞= ⎜ ⎟⎝ ⎠$ (36)
where Q is the activation energy, T is the absolute temperature, R is the universal gas constant, and A0 and n are empirical constants. Traditionally, creep damage assessment has been mainly based on the minimum creep rate and the Larson-Miller plot, taking into consideration the temperature compensated rate property as exhibited in Eq. (36). Fig. 13 shows the Larson-Miller plot for Astroloy. In general, the stress vs. Larson-Miller parameter relationship is nonlinear due to the multiple creep mechanisms involved, and therefore, it is merely an experimental correlation rather than a physics-based model. Extrapolation to predict the long term creep life using Larson-Miller parameter has to be based on extensive testing. For component life prediction, it needs a constitutive law of creep to describe the stress relaxation and redistribution with time as creep deformation proceeds. It has been known that creep deformation is a continuous physical process, where a decreasing creep rate regime (transient creep: primary plus secondary) is followed by an accelerating creep rate regime (tertiary creep) beyond a minimum creep rate. Wu & Koul (1996) have proposed a creep-curve model, based on the decomposition of the total inelastic strain into grain boundary sliding and intragranular deformation, as expressed in Eq. (1), and concluded that grain boundary sliding is primarily responsible for the transient creep behaviour, while the tertiary creep evolves mostly intragranular deformation with dislocation multiplication. Under uniaxial loading condition, the solution of Eq. (8)-(14) has the form (Wu & Koul, 1995)
2
0 21 - exp -
( - 1)
gbs ssgbs ss
gbs
H t t
H
φ εβσε φεε σ ββ⎡ ⎤⎛ ⎞⎢ ⎥⎜ ⎟= + + ⎜ ⎟⎢ ⎥⎝ ⎠⎣ ⎦
$$ (37)
where β is a microstructure parameter, and
( )1
12
(1 )q q
icss
σ σDμ b l r┮kT d b μ
σε β −− −+⎛ ⎞ ⎛ ⎞= − ⎜ ⎟ ⎜ ⎟⎝ ⎠ ⎝ ⎠$ b (38)
www.intechopen.com

Life Prediction of Gas Turbine Materials
231
Fig. 13. The Larson –Miller plot for Astroloy.
Equation (37-38) is derived from the grain boundary dislocation glide plus climb
mechanism. It states that the transient creep is a grain boundary sliding phenomenon that
consists of a primary stage and a steady-state stage. It is influenced mostly by grain
boundary microstructure and morphology, thus emphasizing the importance of grain
boundary engineering in alloy design. According to Eq. (37), the true steady-state creep
occurs at a rate as described by Eq. (38) only after an infinitely long time. Practically, a
quasi-steady-state may be observed relatively soon after creep deformation starts, since the
primary strain is reached as an exponential function of time. However, how long the quasi-
steady-state will last depends on the time to the onset of tertiary creep, which is controlled
by damage accumulation in both grain interior and along grain boundaries, such as
dislocation multiplication, precipitate coarsening and cavity nucleation and growth. These
processes may eventually take over and lead to an acceleration in the creep rate. Tertiary
creep phenomena will be discussed later. Presently, we will discuss the important
characteristics of transient creep before the commencing of tertiary creep.
First of all, the present model predicts a primary strain, as defined by
ptr 2
gbs
= H
σε β (39)
It states that the primary strain is proportional to the applied stress σ divided by the work
hardening coefficient Hgbs. This relationship may provide guidance for grain boundary
engineering to lower the primary strain in alloy applications. Practically, the primary strain
can be attained ~99 percent when the exponential term reaches 4.6, which defines the
primary time as follows.
www.intechopen.com

Gas Turbines
232
2
( - 1)4.6p
trm
tH
β σβ ε=
$ (40)
Second of all, the present model predicts that ideally the GBS strain rate has a stress-dependence to the 2nd power. However, the apparent stress dependence may change since the
presence of grain boundary precipitates can induce a back stress, σic. For example, creep data on Nimonic 115 (Furrillo et al., 1979) can be correlated with Eq. (38), as shown in Fig. 14.
Fig. 14. The minimum creep rate correlation for Nimonic 115 (Wu and Koul, 1995).
The creep data generated by Castillo et al. (1988) on new and service exposed IN738LC turbine blade materials have also been analyzed with Eq. (37-38). Fig. 15 shows the creep curves obtained using Eq. (37) with the parameters as given in Table 2. In addition, creep curves of Alloy 718 and IN738 with planar and wavy grain boundaries are shown in Fig. 16 and Fig. 17, respectively. The descriptions have been made using Eq. (37) with the
microstructure parameter and the wave factor φ, Eq. (15), given in Table 3. It should be noted that Eq. (37) in its present form does not include a damage parameter, and therefore only applicable to the point before tertiary creep commences. The coupling of GBS with grain boundary cavitation and/or oxidation will be discussed later.
Material Condition
Test Temperature
ε0 (%) β H (GPa) mε$ (10-9 s-1)
New 14159 hrs.
954 oC 954 oC
0.1 0.45
1.313 1.13
18.0 30.0
2.0 3.05
Table 2. Creep Curve Parameters for IN738LC under Stress of 90MPa
www.intechopen.com

Life Prediction of Gas Turbine Materials
233
Fig. 15. Creep curves of new and service-exposed IN738LC as predicted by Eq. (37) (Wu & Koul, 1995).
Materials & Test Conditions
Grain Boundary
H (GPa) β φ mε$ (hr-1)
Alloy 718
σ = 590 MPa T = 650 oC
IN738LC
σ = 586 MPa T = 760 oC
(planar) h = 0
λ = d (triangular)
h = 2 μm
λ = 10 μm
(planar) h = 0
λ = d (sinusoidal)
h = 5 μm
λ = 15 μm
204.6
204.6
106.5
106.5
1.78
1.78
1.13
1.13
1.0
0.72
1.0
0.38
0.00233
0.00168
0.0397
0.0152
Table 3. Microstructure and Creep Curve Parameters of Alloy 718
Intragranular deformation has been discussed in the previous section. It can be inferred
from Eq. (2)-(7) that at constant stress, deformation would stop by work-hardening due to
pile-up of gliding dislocations unless dislocation climb helps the dislocations to bypass the
obstacle. Thus, it is reasonable to assume that during constant-stress creep, a steady-state of
back stress is attained soon upon loading such that the intragranular strain rate iε$ =const.
This means that the primary creep mechanism of intragranular deformation is negligible,
which is often the case as observed in single crystal materials (Carry & Strudel, 1977, 1978). The tertiary creep strain then may accumulate with dislocation climb and multiplication as (Wu & Koul, 1996):
(1 )g g iMε ε ε= +$ $ (41)
www.intechopen.com

Gas Turbines
234
Fig. 16. Creep curves of Alloy 718 with planar and triangular wave grain boundaries, as predicted by Eq. (37) (Wu & Koul, 1997).
Fig. 17. Creep curves of IN738LC with planar and sinusoidal wave grain boundaries, as predicted by Eq. (37) (Wu & Koul, 1997).
where M is the normalized dislocation multiplication factor. The integration of Eq (41) leads to the following strain-time relation:
1
[exp( ) 1]g iM tM
ε ε= −$ (42)
Then, adding the strain contributions from Eq. (37) and (42) together, according to Eq. (1), we obtain the total creep strain as
2
0 21 - exp -
( - 1)ss
ssH t
tH
σ φβ εε φε ε σ ββ⎡ ⎤⎛ ⎞= + + ⎢ ⎥⎜ ⎟⎜ ⎟⎢ ⎥⎝ ⎠⎣ ⎦
$$1
[exp( ) 1]iM tM
ε −$ (43)
www.intechopen.com
Life Prediction of Gas Turbine Materials
235
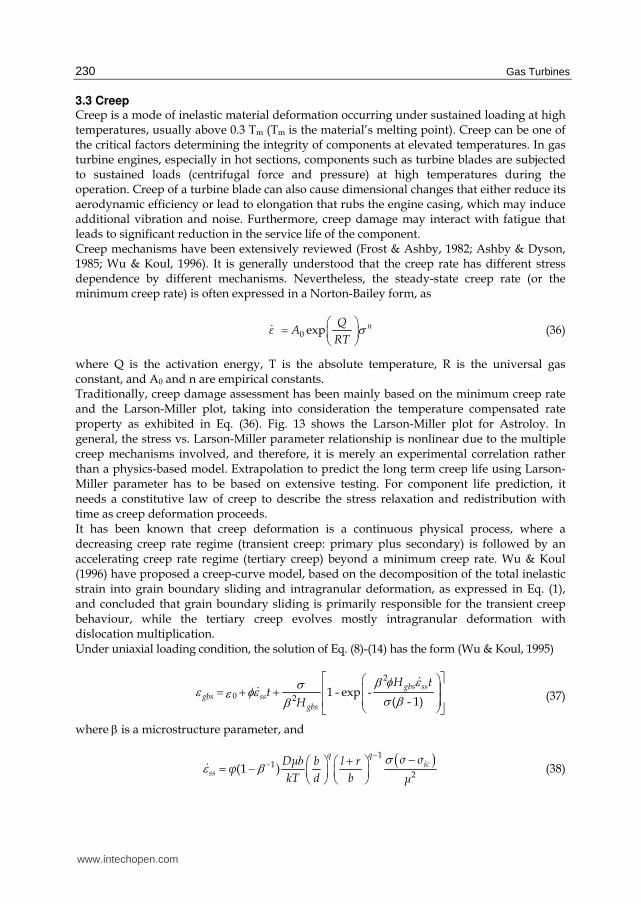
Using Eq. (43), the creep behaviour of IN738LC with and without grain boundary serration are
re-analyzed with additional parameters M = 14.3 and iε$ = 0.0035 h-1, the results are shown in
Fig. 18. The agreement with experimental observation is corroborated with the physical rationale that the two IN738LC materials have nearly the same intragranular microstructure in
terms of γ′ precipitate size and volume fraction but different grain boundary morphology. During tertiary creep, intragranular deformation may overshadow GBS by the mere amount of strain accumulation, but grain boundary damage may still occur under stress, which limits the creep rupture life, as indeed most creep rupture occurs intergranularly in polycrystalline materials. Wu & Koul (1996) have summarized the grain boundary damage accumulation processes via cavitation and oxidation. Continuous cavity nucleation and growth has been described by (Raj & Ashby, 1975):
) 2 ( ) ( ) ( )t t
t t r r t r t d dτ
ρ π π ζ ζ ρ τ ζ τ0
Α( = ( ) + − −∫ ∫ $ $2c c c (44)
where rc is the critical nucleation radius, ρc(t) is the void density and r(t) is the cavity radius at time t.
Fig. 18. Creep curves for IN738LC with planar and serrated grain boundaries, as predicted by Eq. (43) (Wu & Koul, 1996).
As a first approximation, we assume a constant cavity density and only consider the growth
of these cavities, the cavity growth rate is approximately equal to ssr dε=$ $ (note that it is the
GBS deformation component that dominates the steady-state creep rate in this case). If we
define the creep damage parameter as ω = A/πd2, and the rupture time is reached at ω = ωcr,
then tr ∝ 1/ ssε$ . The creep behaviour of wrought Alloy 718 with planar (the SHT material)
and triangular-wave (the MHT material) grain boundaries at 650 °C under stress of 593 MPa
were reported (Chang et al., 1992), as shown in Fig. 19. The average rupture time of the SHT
material was 450 hours. The grain boundary wave factor φ for the MHT material is 0.7 with
h = 2 μm and λ = 10 μm (Table 3). Based on the above consideration, the creep life of the
www.intechopen.com

Gas Turbines
236
MHT material is estimated to be trMHT = trSHT/φ = 642 hours under the given test condition,
which is very close to the experimental observation. This proves that indeed the transient
creep and creep life is limited by GBS. Another mechanism for grain boundary damage is gaseous environmental attack—normally at high temperatures—oxidation. Suppose that oxygen penetrate the material inward through a parabolic law until the oxide scale is broken by deformation, the rate of oxide cracking can be expressed as
ox
1
2
*
2 gbsDdx
dt
εε
⎛ ⎞= ⎜ ⎟⎜ ⎟⎝ ⎠$
(45)
where x is the oxide crack length, D is a diffusion constant, and ε* is the fracture strain of the oxide.
Fig. 19. Creep curves for standard and damage tolerant microstructures of Alloy 718 (Chang et al. 1992).
Sessions et al. (1977) studied the creep-oxidation interaction in Udimet 700. By re-plotting their data on the log-log scale as shown in Fig. 20, we can see that the creep rate in air increases and the rupture time decreases with the number of grains per cross-section. The air-tested creep rate increases linearly with the number of grains per cross section, and
hence it follows the relationship of minε$ ∝ 1/d, but the life is inversely proportional to √d,
which implies a GBS phenomenon, as predicted by Eq. (45). Suppose that GBS occur at nearly a constant rate for most of the material’s creep life, when the oxide crack reaches a
critical length, then Eq. (45) would lead to tr ∝1/√ minε$ . Therefore, we would expect that tr ∝
√d. In Fig. 20, the rupture time decreases with the number of grains per cross-section with a power of -1/2. This observation can be directly translated to the above statement, considering that the number of grains per cross-section is inversely proportional to the grain
www.intechopen.com

Life Prediction of Gas Turbine Materials
237
size d for fixed specimen geometry. Therefore, Eq. (45) is suitable for describing the oxidation damage during creep.
(a)
(b)
Fig. 20. (a) Minimum creep rate data and (b) rupture life data for Udimet 700 at 927°C and 172 MPa, in air and vacuum.
www.intechopen.com
Gas Turbines
238
To overcome the weakness of grain boundaries which are susceptible to cavitation and
oxidation, advanced turbine blade and vane alloys are made from directionally-solidified
(DS) and single crystal (SX) N-base superalloys, which are generally casted in the 001
crystal direction with the lowest modulus and hence the best tolerance to thermal fatigue.
With the removal of grain boundaries, the creep behaviour of DS and SX alloys is therefore
mainly a result of intragranular deformation. The majority of the creep life of DS and SX Ni-
base superalloys is spent in the tertiary stage with a creep ductility in the order of 20~30%.
Therefore, Eq. (42) is appropriate to describe the creep behaviour of such alloys, or in other
words, ignore grain boundary sliding (GBS) from Eq. (43). Now, let
00
( )exp sinhi
VGA
kT kT
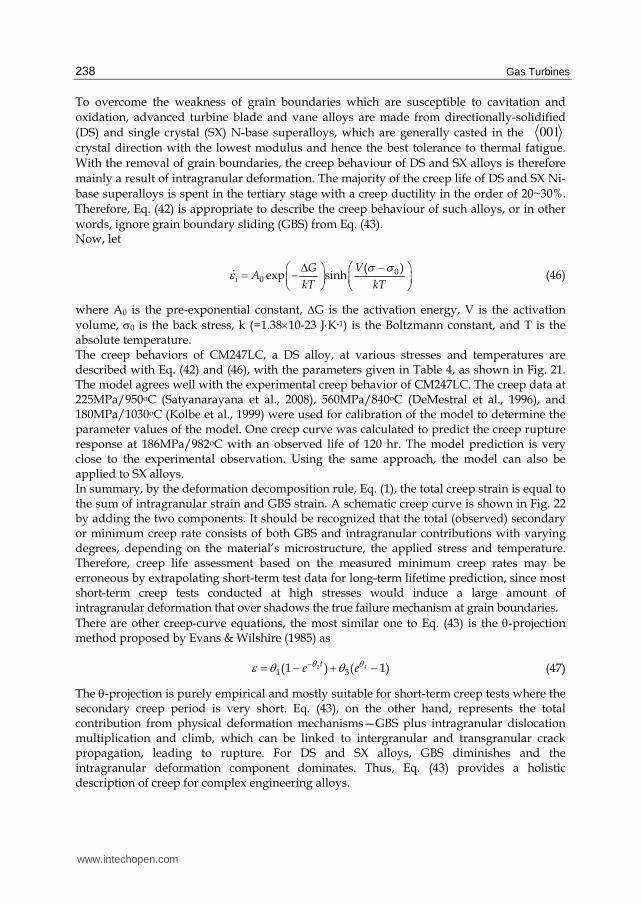
σ σε −Δ ⎛ ⎞⎛ ⎞= − ⎜ ⎟⎜ ⎟⎝ ⎠ ⎝ ⎠$ (46)
where A0 is the pre-exponential constant, ΔG is the activation energy, V is the activation
volume, σ0 is the back stress, k (=1.38×10⁻²³ J⋅K-1) is the Boltzmann constant, and T is the absolute temperature. The creep behaviors of CM247LC, a DS alloy, at various stresses and temperatures are described with Eq. (42) and (46), with the parameters given in Table 4, as shown in Fig. 21. The model agrees well with the experimental creep behavior of CM247LC. The creep data at 225MPa/950oC (Satyanarayana et al., 2008), 560MPa/840oC (DeMestral et al., 1996), and 180MPa/1030oC (Kolbe et al., 1999) were used for calibration of the model to determine the parameter values of the model. One creep curve was calculated to predict the creep rupture response at 186MPa/982oC with an observed life of 120 hr. The model prediction is very close to the experimental observation. Using the same approach, the model can also be applied to SX alloys. In summary, by the deformation decomposition rule, Eq. (1), the total creep strain is equal to the sum of intragranular strain and GBS strain. A schematic creep curve is shown in Fig. 22 by adding the two components. It should be recognized that the total (observed) secondary or minimum creep rate consists of both GBS and intragranular contributions with varying degrees, depending on the material’s microstructure, the applied stress and temperature. Therefore, creep life assessment based on the measured minimum creep rates may be erroneous by extrapolating short-term test data for long-term lifetime prediction, since most short-term creep tests conducted at high stresses would induce a large amount of intragranular deformation that over shadows the true failure mechanism at grain boundaries.
There are other creep-curve equations, the most similar one to Eq. (43) is the θ-projection method proposed by Evans & Wilshire (1985) as
2 4
1 3(1 ) ( 1)te eθ θε θ θ−= − + − (47)
The θ-projection is purely empirical and mostly suitable for short-term creep tests where the secondary creep period is very short. Eq. (43), on the other hand, represents the total contribution from physical deformation mechanisms—GBS plus intragranular dislocation multiplication and climb, which can be linked to intergranular and transgranular crack propagation, leading to rupture. For DS and SX alloys, GBS diminishes and the intragranular deformation component dominates. Thus, Eq. (43) provides a holistic description of creep for complex engineering alloys.
www.intechopen.com

Life Prediction of Gas Turbine Materials
239
A0 (hr.-1) ΔG (J) V (m3) σ0 (MPa) M
4.22×10¹² 6.896×10⁻¹⁹ 2.063×10⁻²⁸ 0 400
Table 4. Activation Parameters for the CM247LC Creep Model
0.00E+00
5.00E-02
1.00E-01
1.50E-01
2.00E-01
2.50E-01
3.00E-01
3.50E-01
4.00E-01
0 50 100 150 200
Time (hr.)
Cre
ep
Str
ain
225MPa/950C-Exp.
560MPa/840C-Exp.
180MPa/1030C-EXp
225MPa/950C-Model
560MPa/840C-Model
180MPa/1030C-Model
186MPa/982C-Model
Fig. 21. Experimental and model creep curves of CM247LC.
Fig. 22. Schematics of creep curves representing GBS strain, intragranular strain and the total creep strain
www.intechopen.com
Gas Turbines
240
4. Evolution of material life under thermomechanical loading
A gas turbine engine component generally experiences thermomechanical loading during start-up/shutdown (cyclic) and cruise (steady holds) which cause thermomechanical creep-fatigue damage to the material. Researchers have been trying to develop more descriptive, more accurate, and more efficient analytical models for the dwell/creep-fatigue phenomena, in order to understand the creep-fatigue interaction for component life prediction. Existing TMF models can be largely categorized into the following three groups: 1) the linear damage accumulation model (Neu & Sehitoglu, 1989; Sehitogulu, 1992), 2) the damage-rate model (Miller, 1993), and 3) the strain-range partitioning (SRP) method (Halford et al., 1977). Recently, a holistic model of dwell/creep-fatigue has been presented (Wu, 2009b), which describes the processes of surface /subsurface crack nucleation, propagation of the dominant crack and its coalescence with internal creep cavitation damage, leading to the final fracture.
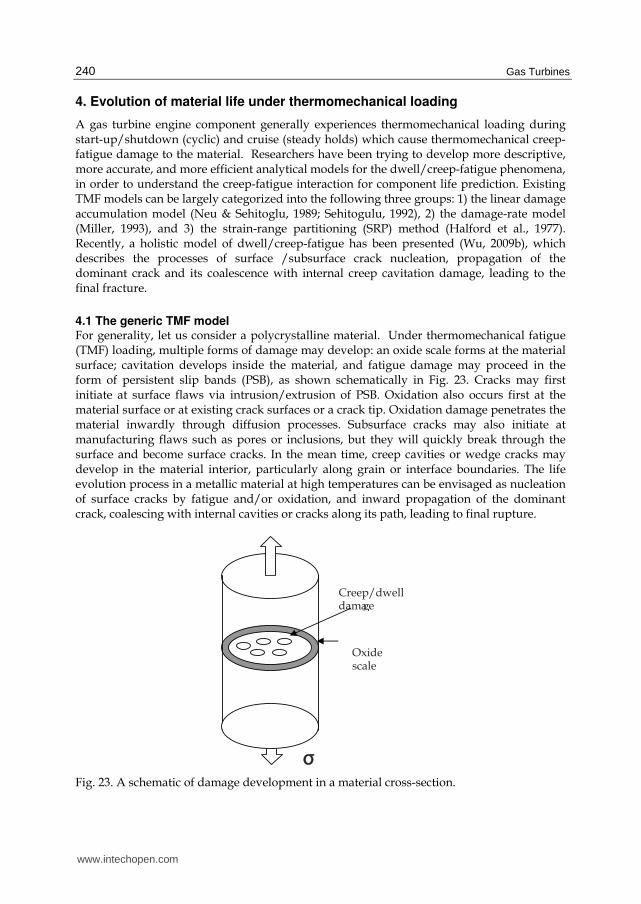
4.1 The generic TMF model For generality, let us consider a polycrystalline material. Under thermomechanical fatigue (TMF) loading, multiple forms of damage may develop: an oxide scale forms at the material surface; cavitation develops inside the material, and fatigue damage may proceed in the form of persistent slip bands (PSB), as shown schematically in Fig. 23. Cracks may first initiate at surface flaws via intrusion/extrusion of PSB. Oxidation also occurs first at the material surface or at existing crack surfaces or a crack tip. Oxidation damage penetrates the material inwardly through diffusion processes. Subsurface cracks may also initiate at manufacturing flaws such as pores or inclusions, but they will quickly break through the surface and become surface cracks. In the mean time, creep cavities or wedge cracks may develop in the material interior, particularly along grain or interface boundaries. The life evolution process in a metallic material at high temperatures can be envisaged as nucleation of surface cracks by fatigue and/or oxidation, and inward propagation of the dominant crack, coalescing with internal cavities or cracks along its path, leading to final rupture.
Oxide scale
Creep/dwell damage
σσ
Fig. 23. A schematic of damage development in a material cross-section.
www.intechopen.com
Life Prediction of Gas Turbine Materials
241
Fatigue damage can be regarded as accumulation of irreversible slip offsets on preferred slip systems. These slip offsets may occur at the surface of grains or grain boundaries or interface boundaries, which act as nuclei for cracks. Restricted slip reversal ahead of the crack tip is also recognized as the basic mechanism of transgranular fatigue crack propagation (Wu et al., 1993). Therefore, in a holistic sense, we can use the term da/dN to represent both the rate of accumulation of irreversible slip offsets leading to crack nucleation as well as the fatigue crack growth rate, bearing in mind that the functional dependencies of da/dN on the loading parameters are different for crack nucleation and crack growth. On the other hand, creep damage may develop in the forms of cavities and/or wedge cracks (Baik & Raj, 1982). Cavity growth has been recognized as a diffusion phenomenon, whereas wedge cracking is a result of dislocation pile-up, also called Zener-Stroh-Koehler (ZSK) crack. The coalescence of creep/dwell damage with a propagating fatigue crack will result in a total damage accumulation rate as expressed by
c z
f
l lda da
dN dN N
+⎛ ⎞= +⎜ ⎟ Δ⎝ ⎠ (48)
where lc is the collective cavity size per grain boundary facet, lz is the ZSK crack size, ΔN is the number of cycles during which the fatigue crack propagates between two cavities or
between two ZSK cracks separated by an average distance of λ (λ~grain size or grain boundary precipitate spacing). Note that usually creep cavitation occurs at a high temperature and ZSK cracks occur at a relatively low temperature. These two types of damage usually do not occur at the same time. Here they are added together as competitive mechanisms over the entire temperature range from ambient temperature to near melting temperature. Assume that during the period of ΔN, the dominant crack only propagates by pure fatigue, i.e., da/dN~λ/ΔN, then we can rewrite Eq. (48), as
1 c z
f
l lda da
dN dNλ+⎛ ⎞⎛ ⎞= +⎜ ⎟⎜ ⎟⎝ ⎠⎝ ⎠ (49)
With environmental effects such as oxidation contributing to propagation of the dominant crack in a cycle-by-cycle manner, the total crack growth rate is
1 c z
f env
l lda da da
dN dN dNλ⎧ ⎫+⎛ ⎞ ⎛ ⎞ ⎛ ⎞⎪ ⎪= + +⎨ ⎬⎜ ⎟ ⎜ ⎟ ⎜ ⎟⎝ ⎠ ⎝ ⎠⎝ ⎠⎪ ⎪⎩ ⎭
(50)
4.2 Cold-dwell fatigue Cold-dwell fatigue usually refers to fatigue with hold-times at ambient temperatures, and it could cause significant low cycle fatigue (LCF) life reduction, particularly pronounced in high strength titanium alloys such as IMI 685, IMI 829 and IMI 834, and Ti6242. Dwell fatigue of titanium alloys is often accompanied with faceted fracture along the basal planes
of the α phase, as seen in Fig. 24. It has been perceived that the faceted fracture of α grains is driven by dislocation pile-up (Bache et al., 1997). Wu & Au (2007) have treated the problem in terms of the kinetics of Zener-Stroh-Koehler crack formation.
www.intechopen.com

Gas Turbines
242
First of all, it should be recognized that the rate of dislocation pile-up accumulation is the net result of dislocation arriving by glide and leaving by climb in a unit time, which can be expressed as
dn
vs ndt
ρ κ= − (51)
where ρ is the dislocation density, v is the dislocation glide velocity, s is the slip band width,
κ is the rate of dislocation climb, and n is the number of dislocations in a pile-up at time t.
According to the Orowan relationship, pγ$ = ρbv (s ≈ b), Eq. (51) can be rewritten as
p
dnn
dtγ κ= −$ (52)
The number of dislocations in a pile-up at a steady-state can be obtained by integration of Eq. (52), as
[1 exp( )]p
n tγ κκ= − −$
(53)
Fig. 24. A SEM micrograph of the fracture surface of IMI 834 failed by dwell faituge
s vκ
Fig. 25. Schematic of the kinetic process of dislocation pile-up.
www.intechopen.com

Life Prediction of Gas Turbine Materials
243
Note that the energy release rate of a ZSK crack in an anisotropic material is given by (Wu, 2005)
( )( )11
2 8
jiijT T
i ij j
b F bG K F K
aπ−= = (54)
where Fij is an elastic matrix for anisotropic materials (F11 = F22 = μ/(1-ν), F33 = μ, μ⎯shear modulus, for isotropic materials), and bT = nb is the total Burgers vector in the pile-up group. Considering an average slip band angle of 45o, the dislocation pile-up may create a mix-mode I-II crack, by the Griffith’s criteria:
2
22 48
Ts
F bw
aπ = (55)
where ws is the surface energy, and 22 11 22( ) / 2F F F= + is the average modulus. From Eq. (55), we can find the crack size l (=2a) as
2 2
22
16 s
F n bl
wπ= (56)
Substituting Eq. (53) into Eq. (56), we obtain
22
222 1 exp( )16
zs
F bl
w
γ κτπ κ⎛ ⎞= − −⎡ ⎤⎜ ⎟ ⎣ ⎦⎝ ⎠
$ (57)
For constant amplitude fatigue with a constant holding period, substituting Eq. (57) into (49) and neglecting cavity formation, the integration of Eq. (49) leads to
22
2221 1 exp( )16
f
s
NN
F b
w
γ κτπλ κ= ⎛ ⎞⎛ ⎞⎜ ⎟+ − −⎡ ⎤⎜ ⎟ ⎣ ⎦⎜ ⎟⎝ ⎠⎝ ⎠
$ (58)
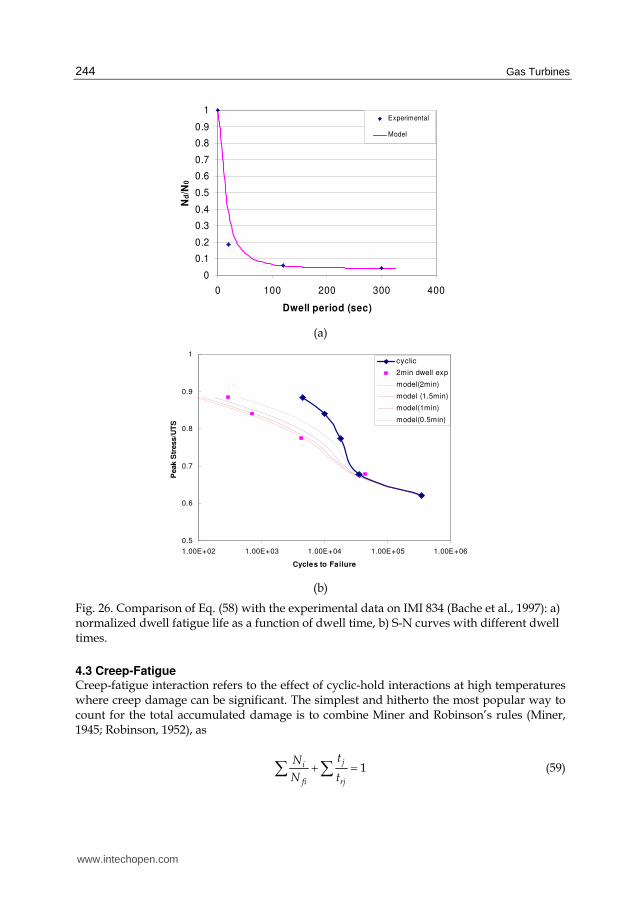
Equation (58) shows that the fatigue life is knocked down by a factor greater than one, when a dwell period is imposed on fatigue loading. This “knock down” factor depends on the material properties such as elastic constants, surface energy, and microstructure (λ), and most importantly it is controlled by the ratio of dislocation glide velocity to the climb rate in the material. This means that, if damage occurs in the form of dislocation pile-up, the dwell-effect will be more detrimental when the ratio of dislocation glide to climb is large, particularly in materials with fewer active slip systems at low temperatures. As temperature increases, climb will overwhelm glide such that dislocation pile-up can hardly form, and hence the dwell damage becomes minimal, but cavities may start to grow. Basically, this is the essence of “cold dwell” vs. “hot creep”. Bache et al. (1997) studied IMI834 and plotted the dwell fatigue life as function of dwell time and stress as shown in Figure 26 (a) and (b), respectively. The model, Eq. (58), describes the experimental behaviour very well. It shows that the dwell sensitivity, in terms of the ratio of dwell-fatigue life to the pure fatigue life, indeed follows an exponential function. Hence, given the pure fatigue life as the baseline, dwell fatigue life can be predicted, as shown in Figure 26 (b), in the form of S-N curves.
www.intechopen.com
Gas Turbines
244
0
0.1
0.2
0.3
0.4
0.5
0.6
0.7
0.8
0.9
1
0 100 200 300 400
Dwell period (sec)
Nd/N
0
Experimental
Model
(a)
0.5
0.6
0.7
0.8
0.9
1
1.00E+02 1.00E+03 1.00E+04 1.00E+05 1.00E+06
Cycles to Failure
Peak S
tress/U
TS
cyclic
2min dwell exp
model(2min)
model (1.5min)
model(1min)
model(0.5min)
(b)
Fig. 26. Comparison of Eq. (58) with the experimental data on IMI 834 (Bache et al., 1997): a) normalized dwell fatigue life as a function of dwell time, b) S-N curves with different dwell times.
4.3 Creep-Fatigue Creep-fatigue interaction refers to the effect of cyclic-hold interactions at high temperatures where creep damage can be significant. The simplest and hitherto the most popular way to count for the total accumulated damage is to combine Miner and Robinson’s rules (Miner, 1945; Robinson, 1952), as
1ji
fi rj
tN
N t+ =∑ ∑ (59)
www.intechopen.com

Life Prediction of Gas Turbine Materials
245
where Nfi is the pure fatigue life at the ith cyclic stress or strain amplitude, and trj is the creep rupture life at the jth holding stress level. The linear summation rule, as straightforward as it may be, is purely empirical and based on no physical mechanism. It does not differentiate the time spent under stress-control or strain-control conditions, or in tension or compression whatsoever, which causes different material response as stress relaxation vs. strain relaxation (creep). Many experimental investigations have shown that the fatigue life fraction vs. creep life fraction does not obey a linear relationship, as prescribed by Eq. (59), as cited by Viswanathan (1989). Other creep-fatigue models were also proposed such as the frequency modified equation
(Coffin, 1969), the hysteresis energy model (Ostergren, 1976), and the strain range
partitioning (SRP) approach (Halford et al., 1977). Instead of modifying empirical equations
with empirical factors accounting for the frequency effect, the SRP method tried to
rationalize the complex creep-fatigue phenomena with the partition of four components in
the total inelastic strain range: 1) plastic strain reversed by plasticity, Δεpp; 2) creep strain
reversed by creep, Δεcc; 3) plastic strain reversed by creep, Δεpc; and 4) creep strain reversed
by plasticity, Δεcp. A schematic of the occurrence of these strain components is shown in Fig.
27. Then, the total failure life is expressed as
1 pp pc cpcc
pp cc pc cp
F F FF
N N N N N= + + + (60a)
where
ijcij ij ijN D ε= Δ (60b)
Fij is the fraction of the named strain component, and Nij is the number of cycles to failure if
the entire inelastic strain is comprised of the named strain only, where Dij and cij are the
Manson-Coffin constants. The problem of this approach with respect to life prediction is that
the actual partition of these strain components is difficult to determine within the total strain
range imparted to the component by a random loading cycle.
Considering physically that the total inelastic strain, εin, is comprised of intragranular
deformation, εg, and grain boundary sliding (GBS), εgbs, as given by Eq. (1), we further assume that under cyclic-time hold conditions: 1. The intragranular deformation, when proceeds in a cyclic manner, leads to
transgranular damage accumulation, such as persistent slip bands and fatigue cracking, and therefore, it is equivalent to the pp strain under cyclic conditions.
2. For short-period holds, cc, pc and cp types of inelastic strains are contributed mainly from GBS during the transient creep, since purely tertiary creep would never start upon short cycle repeats. GBS contributes to intergranular fracture.
When GBS operates, the accumulation of grain boundary damage, either in the form of cavity nucleation and growth or as grain boundary cracks, is proportional to the GBS displacement, such that
c gbsl dε= (61)
where d is the grain size.
www.intechopen.com
Gas Turbines
246
)b )a
)d )c
)f )e
cp pp
pc pp pp
cc
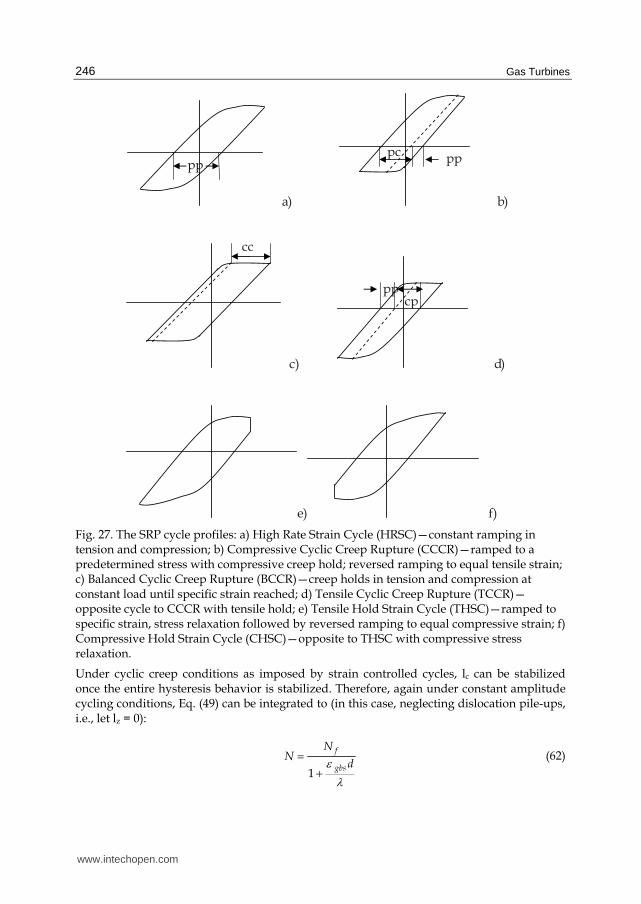
Fig. 27. The SRP cycle profiles: a) High Rate Strain Cycle (HRSC)—constant ramping in tension and compression; b) Compressive Cyclic Creep Rupture (CCCR)—ramped to a predetermined stress with compressive creep hold; reversed ramping to equal tensile strain; c) Balanced Cyclic Creep Rupture (BCCR)—creep holds in tension and compression at constant load until specific strain reached; d) Tensile Cyclic Creep Rupture (TCCR)—opposite cycle to CCCR with tensile hold; e) Tensile Hold Strain Cycle (THSC)—ramped to specific strain, stress relaxation followed by reversed ramping to equal compressive strain; f) Compressive Hold Strain Cycle (CHSC)—opposite to THSC with compressive stress relaxation.
Under cyclic creep conditions as imposed by strain controlled cycles, lc can be stabilized once the entire hysteresis behavior is stabilized. Therefore, again under constant amplitude cycling conditions, Eq. (49) can be integrated to (in this case, neglecting dislocation pile-ups, i.e., let lz = 0):
1
f
gbs
NN
dελ
=+
(62)
www.intechopen.com
Life Prediction of Gas Turbine Materials
247
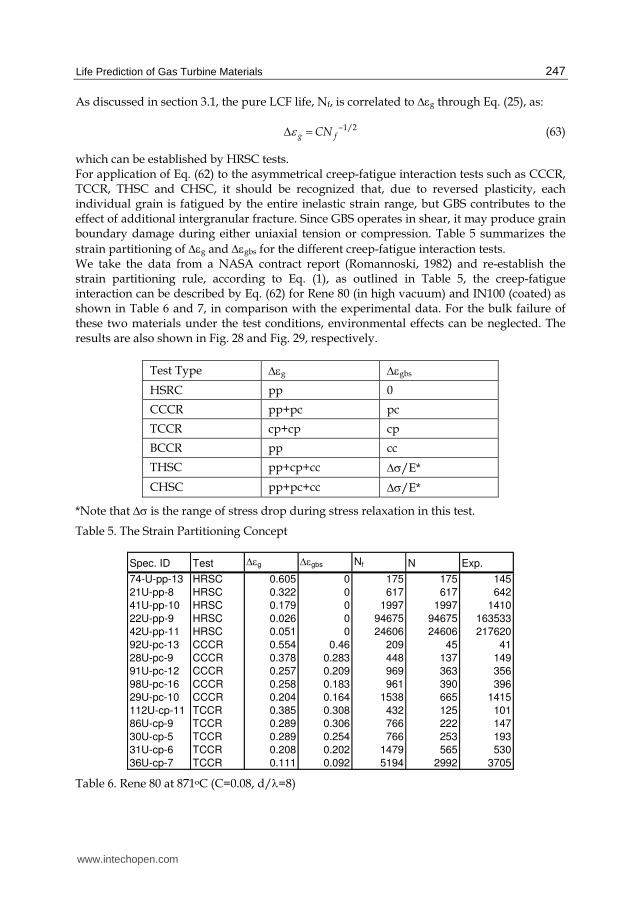
As discussed in section 3.1, the pure LCF life, Nf, is correlated to Δεg through Eq. (25), as:
1/2g fCNε −Δ = (63)
which can be established by HRSC tests. For application of Eq. (62) to the asymmetrical creep-fatigue interaction tests such as CCCR, TCCR, THSC and CHSC, it should be recognized that, due to reversed plasticity, each individual grain is fatigued by the entire inelastic strain range, but GBS contributes to the effect of additional intergranular fracture. Since GBS operates in shear, it may produce grain boundary damage during either uniaxial tension or compression. Table 5 summarizes the
strain partitioning of Δεg and Δεgbs for the different creep-fatigue interaction tests. We take the data from a NASA contract report (Romannoski, 1982) and re-establish the strain partitioning rule, according to Eq. (1), as outlined in Table 5, the creep-fatigue interaction can be described by Eq. (62) for Rene 80 (in high vacuum) and IN100 (coated) as shown in Table 6 and 7, in comparison with the experimental data. For the bulk failure of these two materials under the test conditions, environmental effects can be neglected. The results are also shown in Fig. 28 and Fig. 29, respectively.
Test Type Δεg Δεgbs
HSRC pp 0
CCCR pp+pc pc
TCCR cp+cp cp
BCCR pp cc
THSC pp+cp+cc Δσ/E*
CHSC pp+pc+cc Δσ/E*
*Note that Δσ is the range of stress drop during stress relaxation in this test.
Table 5. The Strain Partitioning Concept
Spec. ID Test Δεg Δεgbs Nf N Exp.
74-U-pp-13 HRSC 0.605 0 175 175 145
21U-pp-8 HRSC 0.322 0 617 617 642
41U-pp-10 HRSC 0.179 0 1997 1997 1410
22U-pp-9 HRSC 0.026 0 94675 94675 163533
42U-pp-11 HRSC 0.051 0 24606 24606 217620
92U-pc-13 CCCR 0.554 0.46 209 45 41
28U-pc-9 CCCR 0.378 0.283 448 137 149
91U-pc-12 CCCR 0.257 0.209 969 363 356
98U-pc-16 CCCR 0.258 0.183 961 390 396
29U-pc-10 CCCR 0.204 0.164 1538 665 1415
112U-cp-11 TCCR 0.385 0.308 432 125 101
86U-cp-9 TCCR 0.289 0.306 766 222 147
30U-cp-5 TCCR 0.289 0.254 766 253 193
31U-cp-6 TCCR 0.208 0.202 1479 565 530
36U-cp-7 TCCR 0.111 0.092 5194 2992 3705
Table 6. Rene 80 at 871oC (C=0.08, d/λ=8)
www.intechopen.com

Gas Turbines
248
Spec. ID Test Δεg Δεgbs Nf N Exp.
7 HRSC 0.129 0 796 796 635
6 HRSC 0.121 0 905 905 900
1 HRSC 0.138 0 696 696 1260
2 HRSC 0.086 0 1792 1792 2120
3 HRSC 0.059 0 3806 3806 3670
4 HRSC 0.05 0 5300 5300 9460
5 HRSC 0.031 0 13788 13788 12210
10 HRSC 0.026 0 19601 19601 17340
8 HRSC 0.028 0 16901 16901 27260
11 HRSC 0.014 0 67602 67602 48320
N12 CHSC 0.196 0.03375 345 128 250
N10 CHSC 0.105 0.02 1202 601 764
N9 CHSC 0.102 0.019375 1274 647 944
39 THSC 0.18 0.026875 409 174 239
N8 THSC 0.08 0.016875 2070 1123 1495
54 BCCR 0.09 0.168 1636 174 159
N5 BCCR 0.085 0.16 1834 204 200
56 BCCR 0.054 0.11 4544 699 383
Table. 7. IN 100(Coated) at 900oC (C=0.0364, d/λ=50)
0.01
0.1
1
10 100 1000 10000 100000 1000000
Cycles to Failure
Inela
sti
c S
train
Ran
ge
LCF Model
HRSC
Creep-Fatigue Model
CCCR
TCCR
Fig. 28. Comparisons of Eq. (62-63) with experimental data for Rene 80 at 871oC
It has been shown that Eq. (62-63) can describe well the creep-fatigue interaction in complicated loading cycles. The advantage of this physics-based strain decomposition model is that, once calibrated with coupon data, it can be applied to component life prediction with εg and εgbs values evaluated from the constitutive model as presented in
section 2. Mathematically, it unifies the SRP concept with the physical meaning that Δεg represents the intragranular damage and Δεgbs contributes to the intergranular fracture, thus it provides a complete description for the mix mode fracture.
www.intechopen.com

Life Prediction of Gas Turbine Materials
249
0.01
0.1
1
10 100 1000 10000 100000
Cycles to Failure
Inela
sti
c S
train
Ran
ge
LCF Model
HRSC
CHSC
THSC
Creep-Fatigue Model
Creep Fatigue Model
BCCR
Fig. 29. Comparisons of Eq. (62-63) with experimental data for IN 100 (coated) at 1000oC.
4.4 Fatigue-Oxidation When gas turbine components operate in a hot gas environment, an oxide scale typically forms on the material surface. This layer of oxide will be forced to deform compatibly with the substrate until it breaks, which may lead to premature crack nucleation. The stresses in both the substrate and oxide scale can be determined, by deformation compatibility:
( ) ( )ox sox o s o
ox s
T T T TE E
σ σα α+ − = + − (64)
and, by the force equilibrium
(1 )ox sf fσ σ σ+ − = (65)
where σox is the stress in the oxide scale, Eox is the elastic modulus and αox is the thermal
expansion coefficient of the oxide scale (~8μm/mK for Al2O3), σs is the stress in the
substrate, Es is the elastic modulus and αs is the thermal expansion coefficient of the
substrate material (~14μm/mK for Ni base superalloys), and f is the volume fraction of the oxide scale, To is the reference temperature at which the oxide formation is stress free. From the above relations, we can deduce that
0[ (1 ) ( )( )](1 )
oxox s s ox
ox s
Ef E T T
fE f Eσ σ α α= + − − −+ − (66)
In Ni-base superalloys, the oxide, e.g., Al2O3, may form with a negligible volume fraction,
i.e., f << 1, but usually has a higher modulus than the substrate. Therefore, according to Eq.
www.intechopen.com

Gas Turbines
250
(66), oxides act as stress raisers at the surface (multiplied by Eox/Es). During a TMF cycle, the
oxidation stress may change with temperature.
Suppose the oxide growth follows a parabolic relation, as
2h kt= (67)
Neglecting other damage, i.e., lc =lz = 0, then, from Eq. (50), the fatigue-oxidation interaction
results in the crack growth rate as:
cf
da dah
dN dN
⎡ ⎤⎛ ⎞⎢ ⎥= +⎜ ⎟⎢ ⎥⎝ ⎠⎣ ⎦ (68)
where hc is the critical penetration length. If we normalize the crack length with the critical crack length, acr, Eq. (68) should become
c
crf
hd d
dN dN a
φ φ⎡ ⎤⎛ ⎞⎢ ⎥= +⎜ ⎟⎢ ⎥⎝ ⎠⎣ ⎦ (69)
where acr is defined by
2
1 ICcr
Ka
Yπ σ⎛ ⎞= ⎜ ⎟⎝ ⎠ (70)
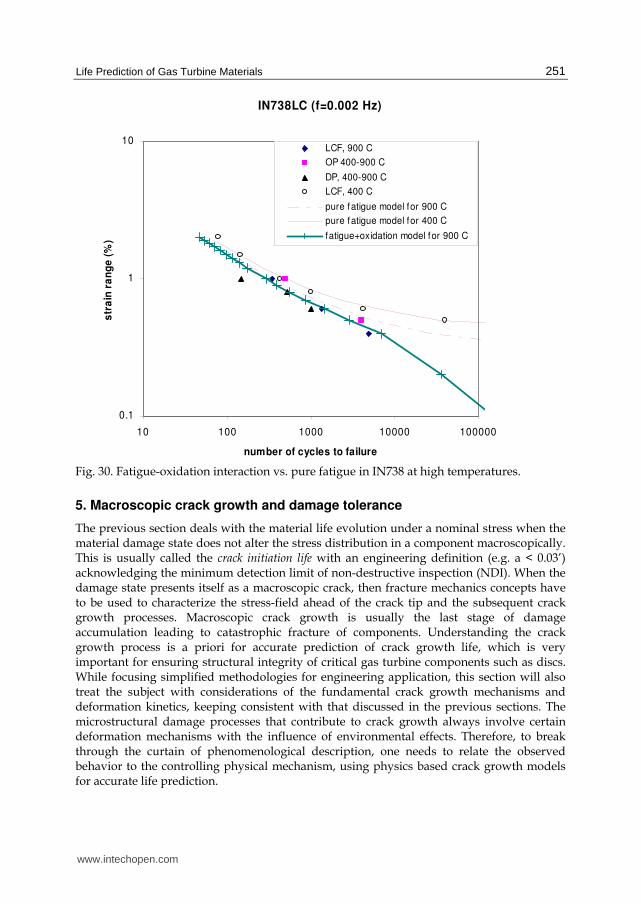
KIC is the material fracture toughness, Y is the crack configuration factor. Consider, for example, IN738, the pure mechanical fatigue component has been described
by Eq. (25) in section 3.1. With oxidation kinetics as described by Eq. (69) and the diffusion
constant given by Neu & Sehitoglu (1989), the life prediction for IN738 LCF at 900oC LCF is
shown in Fig. 30. Here, for simplicity, the shape factor Y is assumed to be unity and the
fracture toughness is 60 MPa√m. The prediction agrees well with the experimental data. As
the comparison shows, the high temperature effect on LCF and TMF life of IN738 can
largely be attributed to oxidation. Some OP and DP TMF data are also shown in Fig. 30,
these data fall closer to the line representing the oxidation-fatigue interaction.
4.5 Summary A nonlinear creep/dwell-fatigue-oxidation interaction model is derived based on nucleation
and propagation of a surface fatigue crack, with the assistance of oxidation, and its
coalescence with creep/dwell damages (cavities or wedge cracks) along its path inside the
material.
The model has been shown to be successful in correlating both “cold” dwell-fatigue and
“hot” creep-fatigue, as long as the respective damage accumulation processes are described
based on the relevant deformation mechanism. In cold dwell, the damage is envisaged as
dislocation pile-up, leading to formation of ZSK cracks. In hot creep, the damage
accumulation is related to grain boundary sliding. Particularly, for creep-fatigue interaction,
the model reconciles the SRP concept. Therefore, it provides a unified approach to deal with
dwell/creep-fatigue interactions.
www.intechopen.com
Life Prediction of Gas Turbine Materials
251
IN738LC (f=0.002 Hz)
0.1
1
10
10 100 1000 10000 100000
number of cycles to failure
str
ain
ra
ng
e (
%)
LCF, 900 C
OP 400-900 C
DP, 400-900 C
LCF, 400 C
pure fatigue model for 900 C
pure fatigue model for 400 C
fatigue+oxidation model for 900 C
Fig. 30. Fatigue-oxidation interaction vs. pure fatigue in IN738 at high temperatures.
5. Macroscopic crack growth and damage tolerance
The previous section deals with the material life evolution under a nominal stress when the material damage state does not alter the stress distribution in a component macroscopically. This is usually called the crack initiation life with an engineering definition (e.g. a < 0.03’) acknowledging the minimum detection limit of non-destructive inspection (NDI). When the damage state presents itself as a macroscopic crack, then fracture mechanics concepts have to be used to characterize the stress-field ahead of the crack tip and the subsequent crack growth processes. Macroscopic crack growth is usually the last stage of damage accumulation leading to catastrophic fracture of components. Understanding the crack growth process is a priori for accurate prediction of crack growth life, which is very important for ensuring structural integrity of critical gas turbine components such as discs. While focusing simplified methodologies for engineering application, this section will also treat the subject with considerations of the fundamental crack growth mechanisms and deformation kinetics, keeping consistent with that discussed in the previous sections. The microstructural damage processes that contribute to crack growth always involve certain deformation mechanisms with the influence of environmental effects. Therefore, to break through the curtain of phenomenological description, one needs to relate the observed behavior to the controlling physical mechanism, using physics based crack growth models for accurate life prediction.
www.intechopen.com
Gas Turbines
252
5.1 Fundamentals of fracture mechanics Fracture mechanics is the theory to describe the stress problems of cracks in continuum
solids. The solution is obtained by solving the stress equilibrium and strain compatibility
equations with given boundary conditions and the appropriate constitutive equations (such
as Hooke’s law for elasticity or some power-law for plasticity). Then, the parameter derived
from the crack-tip stress field or energy is used to characterize the fracture processes in
engineering materials. Depending on the material and the applied condition, fracture
mechanics are categorized into i) linear elastic fracture mechanics; and ii) non-linear fracture
mechanics, as briefly introduced in the following.
5.1.1 Linear-Elastic Fracture Mechanics Linear-elastic fracture mechanics (LEFM) has been developed for crack problems in elastic
continua, based on the theory of elasticity. For engineering practices, it is meant to be
applied to fracture of materials under the so-called small-scale yielding condition, that is, the
crack length is much longer than the plastic zone developed ahead of the crack tip. Details
of LEFM may be seen in the book—Fracture Mechanics: Fundamentals and Applications
(Anderson, 2005).
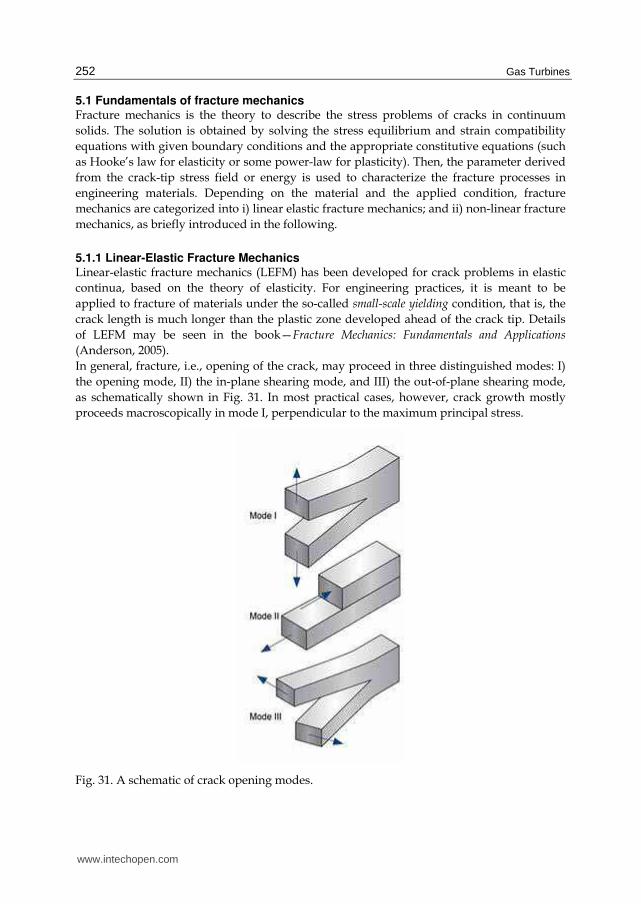
In general, fracture, i.e., opening of the crack, may proceed in three distinguished modes: I)
the opening mode, II) the in-plane shearing mode, and III) the out-of-plane shearing mode,
as schematically shown in Fig. 31. In most practical cases, however, crack growth mostly
proceeds macroscopically in mode I, perpendicular to the maximum principal stress.
Fig. 31. A schematic of crack opening modes.
www.intechopen.com

Life Prediction of Gas Turbine Materials
253
In a two dimensional (2D) crack configuration, the mode-I stress field ahead of the crack-tip (in the coordinate systems as shown in Fig. 32, where r is the distance from the crack-tip and
θ is the position angle) can be expressed as
( )2
Iij ij
Kf
rσ θπ= (71)
where KI is the (mode-I) stress intensity factor, and fij(θ) is an angular function. For a 2D crack of length 2a, the stress intensity factor is given by
IK Y aσ π= (71)
where σ is the nominal applied stress and Y is the component geometry factor. For a crack of elliptical shape with a short axis 2a and long axis 2c, the stress intensity factor is given by
I
aK Y
Q
πσ= (72a)
where
1.65
1 1.46a
Qc
⎛ ⎞= + ⎜ ⎟⎝ ⎠ (72b)
which is an approximation of the elliptical integral of the second kind to the 2nd power.
x
y
r
θ crack
Fig. 32. The crack-tip coordinate.
K-solutions for various standard configurations have been summarized in handbooks (e.g. Tada et al. 2000). Newman & Raju (1983) have also provided numerical solutions for elliptical cracks in some standard 3D bodies. But, in most cases for cracks in engineering components, the solution is sought numerically using finite element methods, meshing for the particular component-crack geometry, which can be quite tedious and time consuming. An alternative method to extract stress intensity factors is the weight function method (Bueckner, 1970; Rice, 1972). Based on the reciprocal theorem of elasticity, this method can be used to evaluate the stress intensity factor by integrating the stress distribution with a weight function over the crack plane for an elastic body under an arbitrary loading, as:
www.intechopen.com
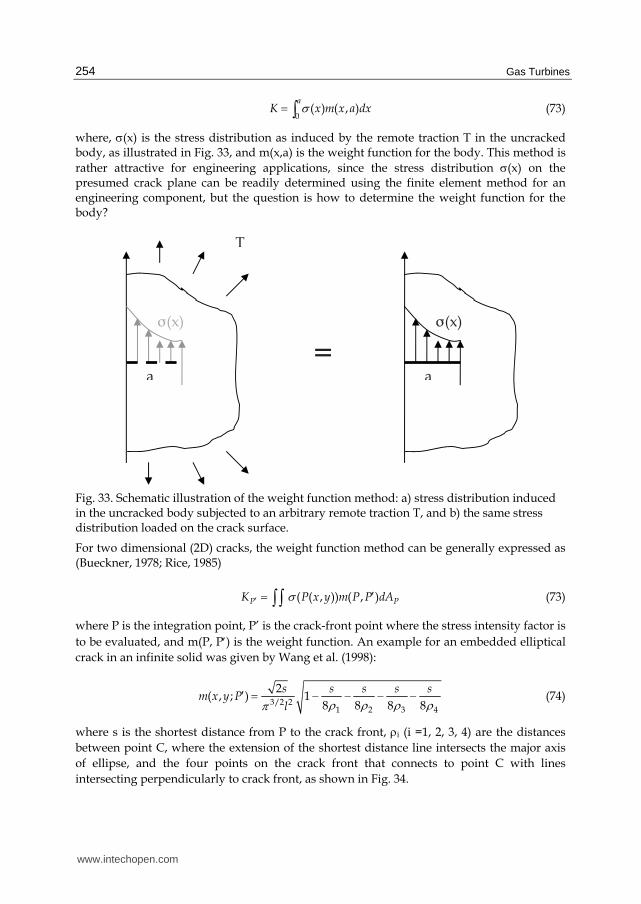
Gas Turbines
254
0
( ) ( , )a
K x m x a dxσ= ∫ (73)
where, σ(x) is the stress distribution as induced by the remote traction T in the uncracked body, as illustrated in Fig. 33, and m(x,a) is the weight function for the body. This method is
rather attractive for engineering applications, since the stress distribution σ(x) on the presumed crack plane can be readily determined using the finite element method for an engineering component, but the question is how to determine the weight function for the body?
T
a a
σ(x) σ(x)
=
Fig. 33. Schematic illustration of the weight function method: a) stress distribution induced in the uncracked body subjected to an arbitrary remote traction T, and b) the same stress distribution loaded on the crack surface.
For two dimensional (2D) cracks, the weight function method can be generally expressed as (Bueckner, 1978; Rice, 1985)
( ( , )) ( , )P PK P x y m P P dAσ′ ′= ∫ ∫ (73)
where P is the integration point, P’ is the crack-front point where the stress intensity factor is
to be evaluated, and m(P, P′) is the weight function. An example for an embedded elliptical
crack in an infinite solid was given by Wang et al. (1998):
3/2 2
1 2 3 4
2( , ; ) 1
8 8 8 8
s s s s sm x y P
l ρ ρ ρ ρπ′ = − − − − (74)
where s is the shortest distance from P to the crack front, ρi (i =1, 2, 3, 4) are the distances
between point C, where the extension of the shortest distance line intersects the major axis
of ellipse, and the four points on the crack front that connects to point C with lines
intersecting perpendicularly to crack front, as shown in Fig. 34.
www.intechopen.com

Life Prediction of Gas Turbine Materials
255
C
P
P�
s
ρ2
ρ1
ρ3 ρ4
l
Fig. 34. Weight function for an elliptical crack.
5.1.2 Non-linear fracture mechanics Nonlinear fracture mechanics generally deals with crack problems in materials with non-linear constitutive behaviours, e.g., monotonic plasticity. Then, the crack-tip stress field can be described by
1/( 1)
00 0
( , )
n
ij ijn
Jn
I rσ σ σ θσ ε
+⎛ ⎞= ⎜ ⎟⎜ ⎟⎝ ⎠ # (75)
which is known as the HRR field, after Hutchinson (1968) and Rice & Rosengren (1968). The singularity of the crack-tip stress field in a nonlinear material depends on the material’s
strain hardening exponent. Therefore, the way to extract the stress intensity as in the linear
elastic material is not desirable from the mechanics point of view, since it is not universally
valid for all materials. Hence, the crack-tip parameter for nonlinear materials is defined by
contour-independent energy integrals, in this case, the J-integral, which is defined by
J Wdy dsΓ∂⎛ ⎞= − ⋅⎜ ⎟∂⎝ ⎠∫ u
Tx
(76)
where u is the displacement vector, T is the surface traction vector, W is the strain energy
density, and s is the arc length along the contour Γ. For materials exhibiting time dependent deformation, similarly, the stress field can be found to be controlled by another time-dependent path-integral (Landes & Begley, 1976):
( )C t Wdy dsΓ∂⎛ ⎞= − ⋅⎜ ⎟∂⎝ ⎠∫ u
Tx
$$ (77)
www.intechopen.com

Gas Turbines
256
In elastic materials or under small-scale yielding conditions, the J-integral and the stress intensity factor can be related as:
2K
JE
= (78)
5.2 Fatigue crack growth Fatigue crack growth phenomena have been an important subject of study, particularly because of the structural integrity airworthiness requirements. The fatigue crack growth law or model is a cornerstone of the so-called damage tolerance design, which will be elaborated later. This section concentrates on fatigue crack growth mechanism and its rate equation. Fatigue crack growth mostly proceeds in a transgranular mode, following a power-law
relationship with the cycle stress intensity factor range, ΔK, as first observed by Paris (Paris, 1963):
3da= C( K ,)
dNΔ (79)
where C and n are empirical constants. It has been recognized that the alternating slip and slip reversal process is mostly responsible for fatigue crack nucleation and propagation (Neumann, 1974; Laird & Smith, 1982), which has been summarized as the restricted slip reversibility (RSR) concept, as schematically show in (Fong & Thomas, 1988). Based on the RSR concept and the deformation kinetics, Wu et al. (1993) have derived a transgranular fatigue crack growth rate equation as
2
f r r fth
f r y
( - )V Vda K= ( K - ) ,K
dN 12 (1 - R) HV V
α απ σ
⎛ ⎞Δ⎜ ⎟Δ Δ ⎜ ⎟⎝ ⎠ (80)
where
ln
f
r
kT
HVf of
ff r f rth of or kT
f r r f f rHVr or
r
HV
2f K(1 - R)HV V G1 G= - + - - .K
- HV V V VHV
2f K
γατ τα α γα
≠ ≠
⎡ ⎤⎛ ⎞⎢ ⎥⎜ ⎟⎢ ⎥⎜ ⎟Δ⎛ ⎞Δ Δ⎢ ⎥⎝ ⎠⎜ ⎟Δ ⎢ ⎥⎜ ⎟⎝ ⎠⎢ ⎥⎛ ⎞⎢ ⎥⎜ ⎟⎜ ⎟Δ⎢ ⎥⎝ ⎠⎣ ⎦
$
$
(81)
where 0γ$ is a pre-exponential strain rate constant, ΔG≠ is the activation energy, V is the
activation volume, τo is the slip resistance of the lattice, H is the work-hardening coefficient,
α is the fracture work factor, k is the Boltzmann constant, T is the absolute temperature, f is
the frequency, and the subscripts “f” and “r” refer slip-forward and reversal, respectively.
In mechanical fatigue, where the microstructure (grain size, precipitate size and shape) is
stable and environmental effects are absent, αf and αr are of the same order of magnitude,
and both forward and reverse slips occur by the same mechanism so that ΔG≠f = ΔG≠
r, Vf =
Vr = V, τ0f = τ0r and f0γ$ = r0γ$ , and hence ΔKth approaches zero, as kT/VH << 1. Therefore,
for pure mechanical fatigue:
www.intechopen.com
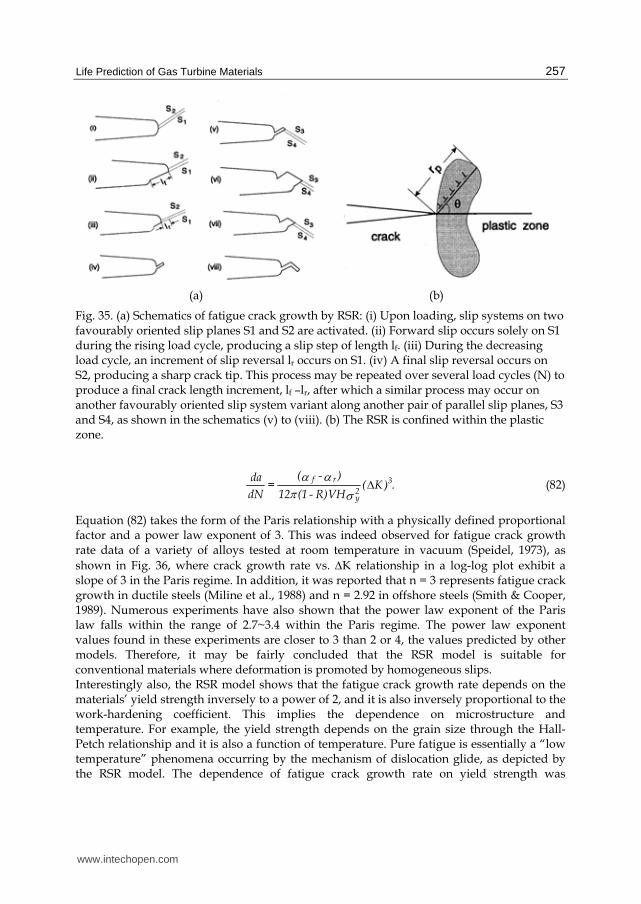
Life Prediction of Gas Turbine Materials
257
(a) (b)
Fig. 35. (a) Schematics of fatigue crack growth by RSR: (i) Upon loading, slip systems on two favourably oriented slip planes S1 and S2 are activated. (ii) Forward slip occurs solely on S1 during the rising load cycle, producing a slip step of length lf. (iii) During the decreasing load cycle, an increment of slip reversal lr occurs on S1. (iv) A final slip reversal occurs on S2, producing a sharp crack tip. This process may be repeated over several load cycles (N) to produce a final crack length increment, lf –lr, after which a similar process may occur on another favourably oriented slip system variant along another pair of parallel slip planes, S3 and S4, as shown in the schematics (v) to (viii). (b) The RSR is confined within the plastic zone.
f r 3
2y
( - )da= ( K .)
dN 12 (1 - R)VH
α απ σ Δ (82)
Equation (82) takes the form of the Paris relationship with a physically defined proportional factor and a power law exponent of 3. This was indeed observed for fatigue crack growth rate data of a variety of alloys tested at room temperature in vacuum (Speidel, 1973), as
shown in Fig. 36, where crack growth rate vs. ΔK relationship in a log-log plot exhibit a slope of 3 in the Paris regime. In addition, it was reported that n = 3 represents fatigue crack growth in ductile steels (Miline et al., 1988) and n = 2.92 in offshore steels (Smith & Cooper, 1989). Numerous experiments have also shown that the power law exponent of the Paris law falls within the range of 2.7~3.4 within the Paris regime. The power law exponent values found in these experiments are closer to 3 than 2 or 4, the values predicted by other models. Therefore, it may be fairly concluded that the RSR model is suitable for conventional materials where deformation is promoted by homogeneous slips. Interestingly also, the RSR model shows that the fatigue crack growth rate depends on the materials’ yield strength inversely to a power of 2, and it is also inversely proportional to the work-hardening coefficient. This implies the dependence on microstructure and temperature. For example, the yield strength depends on the grain size through the Hall-Petch relationship and it is also a function of temperature. Pure fatigue is essentially a “low temperature” phenomena occurring by the mechanism of dislocation glide, as depicted by the RSR model. The dependence of fatigue crack growth rate on yield strength was
www.intechopen.com

Gas Turbines
258
demonstrated by Benson and Edmonds (1978) on 0.5Cr-0.5Mo-0.25V steel. A range of yield strength values, varying between 466 MPa and 834 MPa, were obtained using different heat treatment procedures. The work hardening coefficient, H, for each heat-treated material is estimated by dividing the difference between the ultimate tensile strength and the yield strength with the elongation, typically 13%. Then, the H-compensated crack growth rates at
ΔK = 15.69 MPa√m, which is far above the fatigue threshold of this material, are plotted
against σy2 as shown in Fig. 37.
Fig. 36. Fatigue crack growth behaviours of a number of metals at room temperature in vacuum.
Fig. 37. H-compensated fatigue crack growth rate vs. σy2 for 0.5Cr-0.5Mo-0.25V steel.
www.intechopen.com

Life Prediction of Gas Turbine Materials
259
Equations (80)-(81) further predicts that the threshold in fatigue crack growth does not occur
in the absence of microstructural change and environmental effects ahead of the crack tip
such as in the case of pure mechanical fatigue. Some apparent thresholds ΔKth does occur in
coupon testing using load-decreasing procedures, due to crack closure, which will not be
discussed further, since load shedding conditions are not particularly relevant to the service
condition for fatigue crack growth to occur. According to Eq. (81), however, an intrinsic
fatigue threshold may arise as a result of environmental interactions in a way if the
environmental effects weaken the point obstacles after a new crack surface is exposed,
leading to reduction of the activation barrier ΔG≠r, and τ0r, and/or increase of Vr upon slip
reversal. Indeed, corrosion fatigue is a complex process and the detailed kinetics of the
involved chemical processes need to be considered.
Another important phenomenon of fatigue is the behaviour of short cracks (Miller, K. J. & de los Rios, 1986). While the underlying physical mechanism is the same as discussed above, the complexity of the behaviour and the scatter reflects the interaction of the crack propagation kinetics with the microstructure, which should be addressed with a probabilistic approach and it is beyond the scope of this chapter. It is noteworthy though, that small crack growth behaviour is often observed to occur below the fatigue threshold established for a long crack, which indeed supports the predication of Eq. (82).
5.3 Creep crack growth Creep crack growth resistance is also one of the important damage-tolerance properties
required for materials being used for high temperature applications (T ≥ 0.3 Tm, where Tm is
the absolute melting temperature). Most creep crack growth tests have been conducted
under constant load at high temperature in air, which is really a mixed creep-oxidation
condition. Because of its apparent time-dependence, early studies on creep crack growth
(CCG) mainly focused on correlating creep crack growth rates (CCGR) with some path-
independent energy integrals C(t) and C* (the steady-state value of C(t)), which were good
for creep-ductile materials such as Discaloy (Landes and Begley, 1976) and steels (Liu and
Hsu, 1985). On the other hand, the stress intensity factor (K) has also been used to correlate
CCGR, especially under small-scale creep deformation conditions and in the presence of
environmental embrittlement effects, for high strength heat resistant alloys such as
superalloys (Floreen, 1983; Sadananda & Shahinian, 1977).
Many mechanism based creep crack growth models have been proposed (e.g. Dimelfi & Nix, 1977; Vitek, 1978; Cocks & Ashby, 1982) and some general fracture mechanics treatments have also been given (Saxena, 1986; Riedel, 1989, Riedel, 1990), but these models did not sufficiently considered the contribution of grain boundary sliding, and therefore it is still lacking of a universal treatment to both creep-ductile and creep-brittle cases. Considering the crack-tip stress relaxation by two deformation mechanisms—intragranular
deformation and GBS, as schematically shown in Fig. 38, Xu et al. (1999) has derived a creep
crack growth equation in the following form:
2
2
1 22 211 11 111 1 ( )
( ) ( 1)1 2
p ppn pp ppn
Ip n
AIda d n C tC t p B K
dt n p BI Iλ π− −− −− −−
⎡ ⎤⎛ ⎞⎢ ⎥⎛ ⎞⎛ ⎞+ ⎜ ⎟= + + ⎜ ⎟⎢ ⎥⎜ ⎟ ⎜ ⎟⎜ ⎟− + ⎝ ⎠⎢ ⎥⎝ ⎠⎝ ⎠⎢ ⎥⎣ ⎦ (83)
www.intechopen.com

Gas Turbines
260
where n and p are power-law index, A and B are power-law constants, In and Ip are HHR field parameters associated with the HRR field of intragranular deformation and GBS,
respectively; d is the grain size and λ is the critical GBS distance between cavities.
Fig. 38. A schematic of stress distribution in three zones ahead of a creep crack tip.
5.3.1 Creep-ductile cases In creep ductile materials with small grain size, the creep zone may contain many grains,
and therefore intragranular deformation plays a significant role in stress relaxation, while
the contribution of GBS may be relatively small. For these cases, the first term in Eq. (83)
dominates such that
1
11( )
1
nn
p
AIda d nC t
dt n p BIλ−⎛ ⎞+ ⎜ ⎟= ⎜ ⎟− + ⎝ ⎠
(84)
This model basically agrees with that of Cocks & Ashby (1982).
5.3.2 Creep-brittle cases In creep brittle materials (e.g., cast Ni-base superalloys) containing large grains, the role of
intragranular deformation in crack-tip stress relaxation and creep crack growth will be
limited. In that case, crack-tip deformation will mostly be concentrated in the grain
boundary region, and therefore GBS plays a dominant role in the crack growth process. In
such cases, the second term of Eq. (83) dominates, and particularly, considering that for pure
GBS, p = 2, the rate equation reduces to:
22
3
4
da dBK
dt λπ= (85a)
The proportional constant B depends on grain boundary diffusion and microstructure, as
discussed in section 2&3, as given by
www.intechopen.com
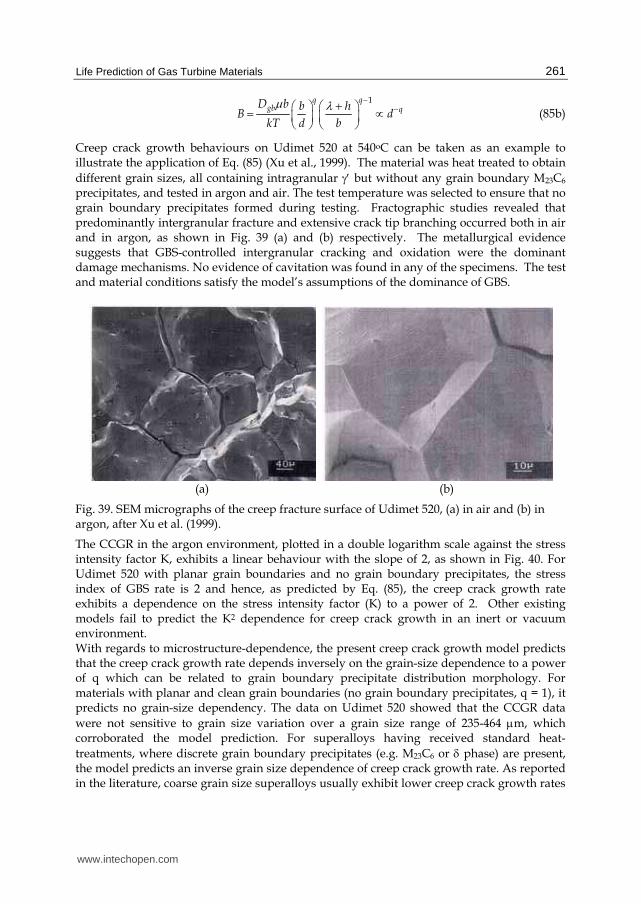
Life Prediction of Gas Turbine Materials
261
1q q
gb qD b b h
B dkT d b
μ λ − −+⎛ ⎞ ⎛ ⎞= ∝⎜ ⎟ ⎜ ⎟⎝ ⎠ ⎝ ⎠ (85b)
Creep crack growth behaviours on Udimet 520 at 540oC can be taken as an example to illustrate the application of Eq. (85) (Xu et al., 1999). The material was heat treated to obtain
different grain sizes, all containing intragranular γ′ but without any grain boundary M23C6 precipitates, and tested in argon and air. The test temperature was selected to ensure that no grain boundary precipitates formed during testing. Fractographic studies revealed that predominantly intergranular fracture and extensive crack tip branching occurred both in air and in argon, as shown in Fig. 39 (a) and (b) respectively. The metallurgical evidence suggests that GBS-controlled intergranular cracking and oxidation were the dominant damage mechanisms. No evidence of cavitation was found in any of the specimens. The test and material conditions satisfy the model’s assumptions of the dominance of GBS.
(a) (b)
Fig. 39. SEM micrographs of the creep fracture surface of Udimet 520, (a) in air and (b) in argon, after Xu et al. (1999).
The CCGR in the argon environment, plotted in a double logarithm scale against the stress intensity factor K, exhibits a linear behaviour with the slope of 2, as shown in Fig. 40. For Udimet 520 with planar grain boundaries and no grain boundary precipitates, the stress index of GBS rate is 2 and hence, as predicted by Eq. (85), the creep crack growth rate exhibits a dependence on the stress intensity factor (K) to a power of 2. Other existing models fail to predict the K2 dependence for creep crack growth in an inert or vacuum environment. With regards to microstructure-dependence, the present creep crack growth model predicts that the creep crack growth rate depends inversely on the grain-size dependence to a power of q which can be related to grain boundary precipitate distribution morphology. For materials with planar and clean grain boundaries (no grain boundary precipitates, q = 1), it predicts no grain-size dependency. The data on Udimet 520 showed that the CCGR data
were not sensitive to grain size variation over a grain size range of 235-464 μm, which corroborated the model prediction. For superalloys having received standard heat-
treatments, where discrete grain boundary precipitates (e.g. M23C6 or δ phase) are present, the model predicts an inverse grain size dependence of creep crack growth rate. As reported in the literature, coarse grain size superalloys usually exhibit lower creep crack growth rates
www.intechopen.com
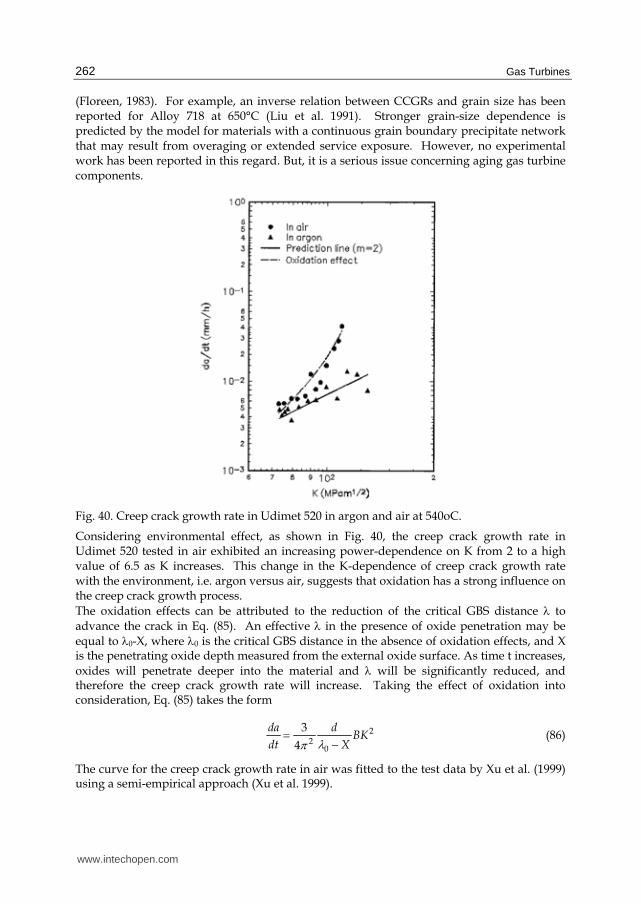
Gas Turbines
262
(Floreen, 1983). For example, an inverse relation between CCGRs and grain size has been reported for Alloy 718 at 650°C (Liu et al. 1991). Stronger grain-size dependence is predicted by the model for materials with a continuous grain boundary precipitate network that may result from overaging or extended service exposure. However, no experimental work has been reported in this regard. But, it is a serious issue concerning aging gas turbine components.
Fig. 40. Creep crack growth rate in Udimet 520 in argon and air at 540oC.
Considering environmental effect, as shown in Fig. 40, the creep crack growth rate in Udimet 520 tested in air exhibited an increasing power-dependence on K from 2 to a high value of 6.5 as K increases. This change in the K-dependence of creep crack growth rate with the environment, i.e. argon versus air, suggests that oxidation has a strong influence on the creep crack growth process.
The oxidation effects can be attributed to the reduction of the critical GBS distance λ to advance the crack in Eq. (85). An effective λ in the presence of oxide penetration may be equal to λ0-X, where λ0 is the critical GBS distance in the absence of oxidation effects, and X is the penetrating oxide depth measured from the external oxide surface. As time t increases,
oxides will penetrate deeper into the material and λ will be significantly reduced, and therefore the creep crack growth rate will increase. Taking the effect of oxidation into consideration, Eq. (85) takes the form
22
0
3
4
da dBK
dt Xλπ= − (86)
The curve for the creep crack growth rate in air was fitted to the test data by Xu et al. (1999) using a semi-empirical approach (Xu et al. 1999).
www.intechopen.com
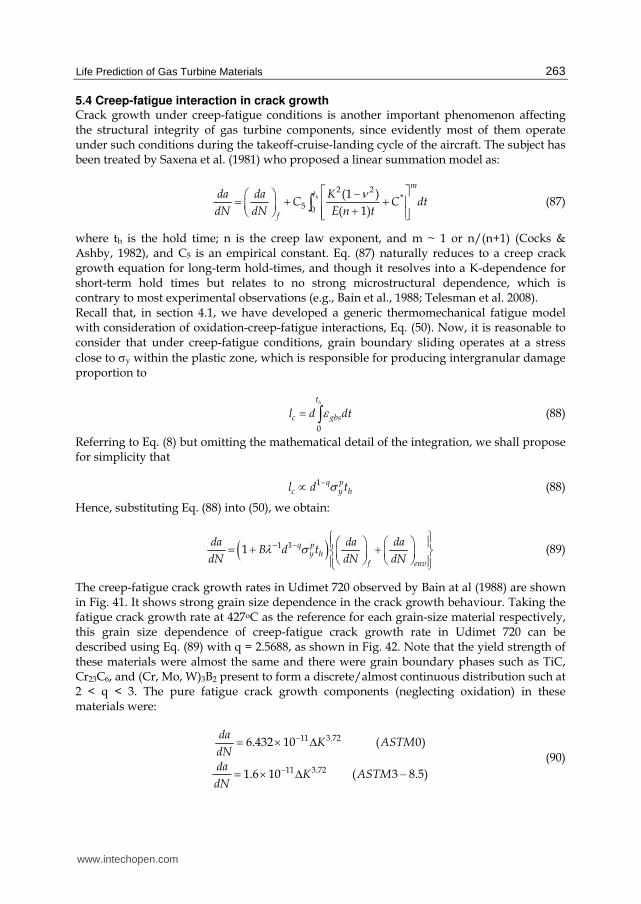
Life Prediction of Gas Turbine Materials
263
5.4 Creep-fatigue interaction in crack growth Crack growth under creep-fatigue conditions is another important phenomenon affecting the structural integrity of gas turbine components, since evidently most of them operate under such conditions during the takeoff-cruise-landing cycle of the aircraft. The subject has been treated by Saxena et al. (1981) who proposed a linear summation model as:
2 2
*5 0
(1 )
( 1)
h
mt
f
da da KC C dt
dN dN E n t
ν⎡ ⎤−⎛ ⎞= + +⎢ ⎥⎜ ⎟ +⎝ ⎠ ⎢ ⎥⎣ ⎦∫ (87)
where th is the hold time; n is the creep law exponent, and m ~ 1 or n/(n+1) (Cocks & Ashby, 1982), and C5 is an empirical constant. Eq. (87) naturally reduces to a creep crack growth equation for long-term hold-times, and though it resolves into a K-dependence for short-term hold times but relates to no strong microstructural dependence, which is contrary to most experimental observations (e.g., Bain et al., 1988; Telesman et al. 2008). Recall that, in section 4.1, we have developed a generic thermomechanical fatigue model with consideration of oxidation-creep-fatigue interactions, Eq. (50). Now, it is reasonable to consider that under creep-fatigue conditions, grain boundary sliding operates at a stress
close to σy within the plastic zone, which is responsible for producing intergranular damage proportion to
0
ht
c gbsl d dtε= ∫ (88)
Referring to Eq. (8) but omitting the mathematical detail of the integration, we shall propose for simplicity that
1 q pc y hl d tσ−∝ (88)
Hence, substituting Eq. (88) into (50), we obtain:
( )111 q py h
f env
da da daB d t
dN dN dNλ σ−− ⎧ ⎫⎛ ⎞ ⎛ ⎞⎪ ⎪= + +⎨ ⎬⎜ ⎟ ⎜ ⎟⎝ ⎠ ⎝ ⎠⎪ ⎪⎩ ⎭
(89)
The creep-fatigue crack growth rates in Udimet 720 observed by Bain at al (1988) are shown in Fig. 41. It shows strong grain size dependence in the crack growth behaviour. Taking the fatigue crack growth rate at 427oC as the reference for each grain-size material respectively, this grain size dependence of creep-fatigue crack growth rate in Udimet 720 can be described using Eq. (89) with q = 2.5688, as shown in Fig. 42. Note that the yield strength of these materials were almost the same and there were grain boundary phases such as TiC, Cr23C6, and (Cr, Mo, W)3B2 present to form a discrete/almost continuous distribution such at 2 < q < 3. The pure fatigue crack growth components (neglecting oxidation) in these materials were:
11 3.72
11 3.72
6.432 10 ( 0)
1.6 10 ( 3 8.5)
daK ASTM
dNda
K ASTMdN
−
−
= × Δ= × Δ −
(90)
www.intechopen.com
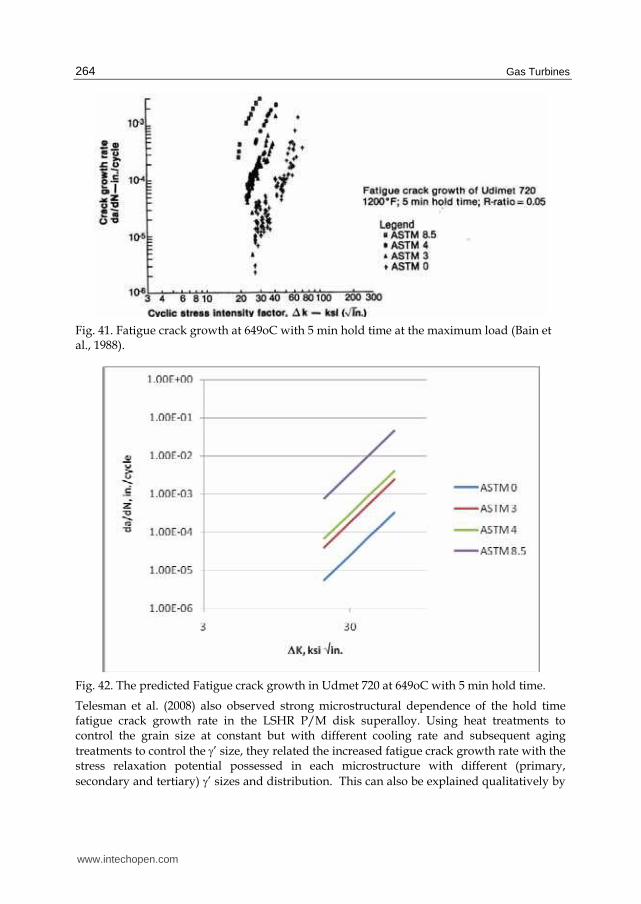
Gas Turbines
264
Fig. 41. Fatigue crack growth at 649oC with 5 min hold time at the maximum load (Bain et al., 1988).
Fig. 42. The predicted Fatigue crack growth in Udmet 720 at 649oC with 5 min hold time.
Telesman et al. (2008) also observed strong microstructural dependence of the hold time fatigue crack growth rate in the LSHR P/M disk superalloy. Using heat treatments to control the grain size at constant but with different cooling rate and subsequent aging
treatments to control the γ’ size, they related the increased fatigue crack growth rate with the stress relaxation potential possessed in each microstructure with different (primary,
secondary and tertiary) γ’ sizes and distribution. This can also be explained qualitatively by
www.intechopen.com

Life Prediction of Gas Turbine Materials
265
Eq. (89): stress relaxation would impart a lower grain boundary sliding rate, resulting in lesser grain boundary damage during the hold time and hence reducing the overall crack growth rate. Finally, it should be pointed out that none of the above phenomena could be sufficiently addressed with Eq. (87). In general, the present model, Eq. (89), also presents the effect of creep damage in a multiplication factor, for every fatigue crack increment will induce coalescence with the creep damage accumulated ahead of the propagating fatigue crack.
5.4 Damage tolerance analysis The damage-tolerance philosophy assumes materials or components entering into service have defects in their initial conditions. Then the component life is basically the life of crack propagation starting from an initial flaw, as:
( )0
fa
a
daN
f K= Δ∫ (91)
where a0 is the initial crack size, af is the final crack size at fracture (or sometimes, a
dysfunction crack size reduced by a safety factor), and the crack growth rate function f(ΔK) can be any of the aforementioned, particularly Eq. (79), (86) or (89), depending on the operating condition. In the simple case under pure mechanical fatigue condition, where the crack growth rate is expressed by the Paris law, Eq. (79), the damage tolerance life can be obtained by integration as
( ) ( ) ( )0 0 1 12 2 2
0
1 1 1
( 1)2
f fa a
n n n nna a n
f
da daN
nC K CC a a aσ πσ π − −
⎛ ⎞⎜ ⎟⎜ ⎟= = = −⎜ ⎟Δ − Δ ⎜ ⎟Δ ⎝ ⎠∫ ∫ (92)
Using this philosophy, components need to be inspected before and during service. If no actual cracks are found, it is usually assumed that the initial crack size is equal to the non-destructive inspection (NDI) limit, and hence the crack propagation life marks the safe inspection interval (SII) on the maintenance schedule. Since crack propagation life is apparently sensitive to the initial crack size, an economical maintenance plan requires more advanced NDI techniques with accuracy and lower detection limits. Taking advantage of the damage tolerance properties, a component can repeatedly enter into service, as long as it passes NDI, regardless of whether the usage has exceeded the safe-life limit, and it will retire only after cracks are found. This is called retire for cause (ROC). By virtue of damage tolerance, life extension can be achieved on safe-life expired parts, as shown schematically in Figure 5.1. The damage tolerance approach is not only meant to be used as a basis for life extension, but more so to ensure the structural integrity of safety-critical structures and components to prevent catastrophic fracture, as it is required by the Aircraft Structural Integrity Program (ASIP) and Engine Structural Integrity Program (ENSIP) of the United State Air Force. Due to the inherent properties of materials, detectable crack propagation periods are usually very short for most materials, and even more so for advanced materials such as intermetallic and ceramic materials, such that life management based on damage tolerance is totally unpractical (too many interruptions of service due to inspections, and therefore too costly). Besides, it is commonly recognized that damage accumulation spends most of its time
www.intechopen.com

Gas Turbines
266
undetectable non-destructively, i.e., at the microstructural level and in the small (short) crack regime. Thus, new life management philosophy is required, which should put emphasis on the physics-based understanding of the continuous evolution of damage from crack nucleation, to short crack growth and long crack growth (to eventual failure), which will be called the holistic structural integrity process.
Life
… …
n inspections if no crack are found
NDI limit
Dysfunction size
Fig. 43. Schematic of damage–tolerance life management.
6. Analyses of gas turbine components
This section demonstrates the application of the aforementioned models for two selected cases: (i) turbine blade creep and (ii) turbine blade crack growth, as follows.
6.1 Turbine blade creep A turbine blade is modelled using the finite element method, as shown in Fig. 44. The blade was represented by a solid airfoil attached to a solid platform. Since the present analysis focused on the airfoil portion, the platform only serves as the elastic boundary condition. The temperature and pressure distribution induced by the hot gas impingement is obtained from fluid dynamics and heat transfer analyses and is applied upon the blade as the boundary conditions as shown in Fig. 45 and Fig. 46, respectively. The turbine rotates at 13800 rpm. The turbine blade material is assumed to creep by GBS only, obeying the following creep law:
= 1 exp
2ssgbs
0 ssgbs 2gbs
H t + t + - -
( - 1)H
φβ εσε φε ε σ ββ⎡ ⎤⎛ ⎞⎢ ⎥⎜ ⎟⎜ ⎟⎢ ⎥⎝ ⎠⎣ ⎦
$$ (93)
where E = 100000 (MPa), Hgbs=25000 (MPa), β = 1.00925, and
2
8 16000 15010 exp 4ss
T E
σε −⎛ ⎞⎛ ⎞= − −⎜ ⎟⎜ ⎟⎝ ⎠⎝ ⎠$ (94)
www.intechopen.com

Life Prediction of Gas Turbine Materials
267
1119
818
560
302
1
9370
9468
9552
9636
9734
Fig. 44. FEM model of turbine blade. The numbers indicate some selected nodes. Numbers indicate the nodal points
Fig. 45. Temperature profile in the blade
www.intechopen.com

Gas Turbines
268
Fig. 46. Pressure profile as the boundary condition on the blade surface.
Creep simulation was conducted using MSC.Marc for 100 hours. The initial (at t = 0) and
final (t=100 hours) von Mises stress distribution contours are shown in Fig. 47 and Fig. 48,
respectively. The initial response of the blade is purely elastic, which results in a highly non-
uniform stress distribution in the blade with particular stress concentrations at the mid-
leading edge and mid-trailing edge and near the bottom attachment. After 100 hours, when
creep deformation proceeds into a steady state, stress distribution became more uniform
throughout the airfoil. Stress concentration remained at the bottom attachment, because, for
simplicity of demonstration, the platform was assumed to deform only elastically. The final
creep strain distribution contours are shown in Fig. 49. The creep strain accumulates the
most where the initial elastic stress concentration appears, which then leads to stress
relaxation. Creep deformation and stress relaxation curves at selected nodes along the
leading/trailing edges (the nodal numbers are indicated in Fig. 44) are shown in Fig. 50 -
Fig. 53, respectively. In both cases, the stress has dropped dramatically with the overall
increment of the creep strain. Except those creep strain concentration regions, the majority
of the airfoil, especially the upper half, practically remains in the elastic regime. The stress
relaxation or “stress shakedown” in a component have a two-fold meaning on the life of the
component: it may impact on the low cycle fatigue damage with a timely reduced stress, but
on the other hand, it is also accompanied with an increase of creep damage in the material.
From this analysis for this particular blade, it deems that the mid-leading edge and the
bottom of trailing edge are critical locations. After 50 hours, creep deformation proceeds in
steady state.
www.intechopen.com

Life Prediction of Gas Turbine Materials
269
(a)
(b)
Fig. 47. Stress distribution at t=0: a) the pressure side, and b) the suction side.
www.intechopen.com

Gas Turbines
270
(a)
(b)
Fig. 48. Stress distribution at t =100 hrs, a) the pressure side, and b) the suction side.
www.intechopen.com

Life Prediction of Gas Turbine Materials
271
(a)
(b) Fig. 49. Creep deformation of the blade after a 100 hr., a) the pressure side, and b) the suction side.
www.intechopen.com

Gas Turbines
272
Fig. 50. Deformation history at selected nodes along the leading edge.
Fig. 51. Stress relaxation at selected nodes along the leading edge.
www.intechopen.com
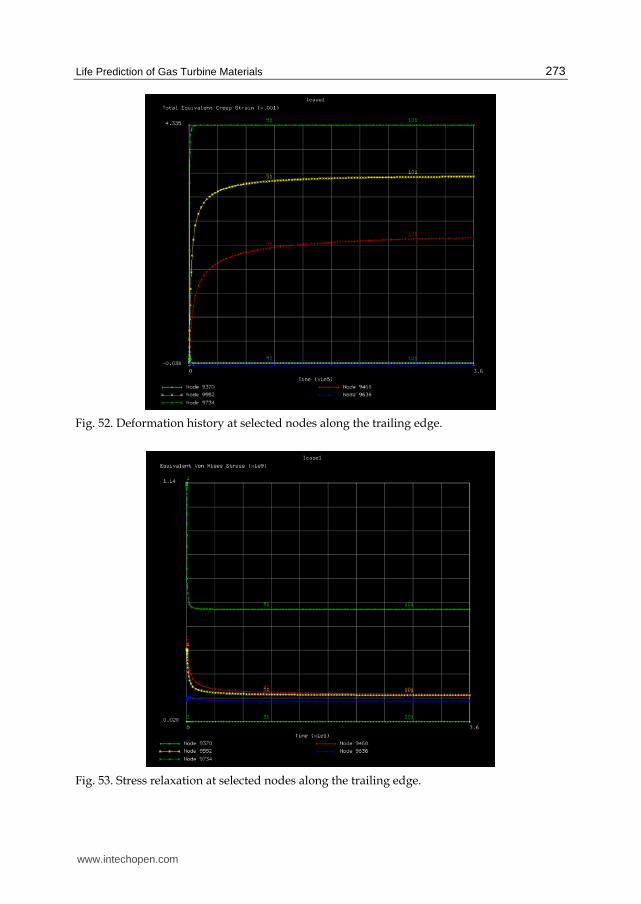
Life Prediction of Gas Turbine Materials
273
Fig. 52. Deformation history at selected nodes along the trailing edge.
Fig. 53. Stress relaxation at selected nodes along the trailing edge.
www.intechopen.com
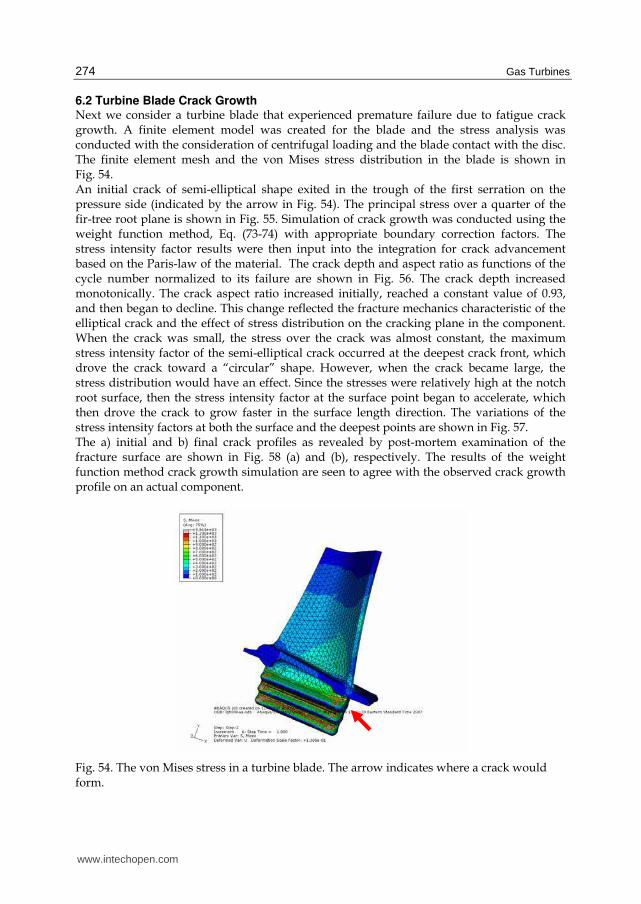
Gas Turbines
274
6.2 Turbine Blade Crack Growth Next we consider a turbine blade that experienced premature failure due to fatigue crack growth. A finite element model was created for the blade and the stress analysis was conducted with the consideration of centrifugal loading and the blade contact with the disc. The finite element mesh and the von Mises stress distribution in the blade is shown in Fig. 54. An initial crack of semi-elliptical shape exited in the trough of the first serration on the pressure side (indicated by the arrow in Fig. 54). The principal stress over a quarter of the fir-tree root plane is shown in Fig. 55. Simulation of crack growth was conducted using the weight function method, Eq. (73-74) with appropriate boundary correction factors. The stress intensity factor results were then input into the integration for crack advancement based on the Paris-law of the material. The crack depth and aspect ratio as functions of the cycle number normalized to its failure are shown in Fig. 56. The crack depth increased monotonically. The crack aspect ratio increased initially, reached a constant value of 0.93, and then began to decline. This change reflected the fracture mechanics characteristic of the elliptical crack and the effect of stress distribution on the cracking plane in the component. When the crack was small, the stress over the crack was almost constant, the maximum stress intensity factor of the semi-elliptical crack occurred at the deepest crack front, which drove the crack toward a “circular” shape. However, when the crack became large, the stress distribution would have an effect. Since the stresses were relatively high at the notch root surface, then the stress intensity factor at the surface point began to accelerate, which then drove the crack to grow faster in the surface length direction. The variations of the stress intensity factors at both the surface and the deepest points are shown in Fig. 57. The a) initial and b) final crack profiles as revealed by post-mortem examination of the fracture surface are shown in Fig. 58 (a) and (b), respectively. The results of the weight function method crack growth simulation are seen to agree with the observed crack growth profile on an actual component.
Fig. 54. The von Mises stress in a turbine blade. The arrow indicates where a crack would form.
www.intechopen.com
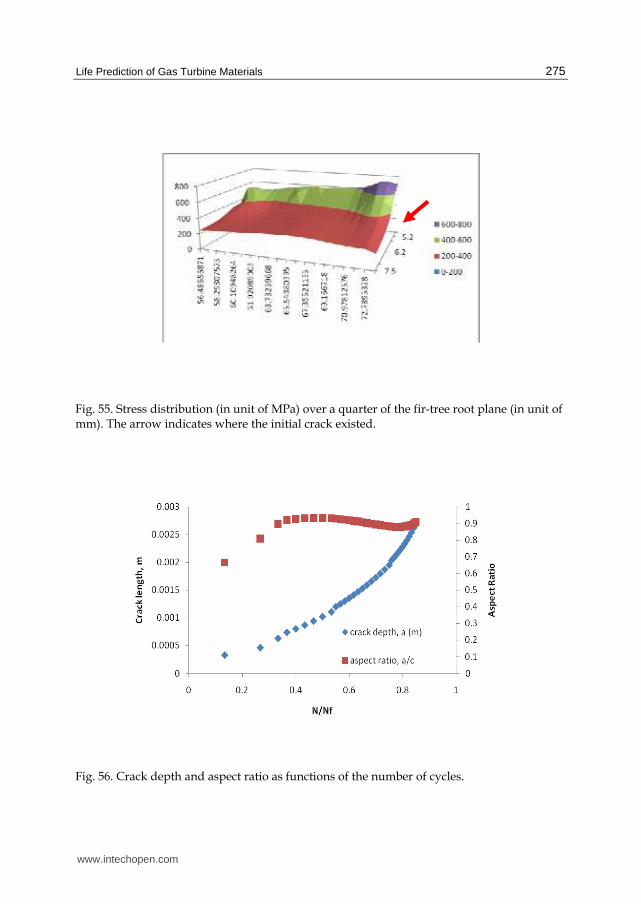
Life Prediction of Gas Turbine Materials
275
Fig. 55. Stress distribution (in unit of MPa) over a quarter of the fir-tree root plane (in unit of mm). The arrow indicates where the initial crack existed.
Fig. 56. Crack depth and aspect ratio as functions of the number of cycles.
www.intechopen.com

Gas Turbines
276
Fig. 57. Stress intensity factors at the surface and the deepest points.
(a)
(b)
Fig. 58. a) The initial crack profile, and b) the final crack profile.
www.intechopen.com
Life Prediction of Gas Turbine Materials
277
7. Conclusion
In this chapter, a framework of integrated creep-fatigue (ICF) constitutive modelling is
presented. The ICF model formulates deformation and damage accumulation in terms of
two inelastic strain components—intragranular deformation (ID) and grain boundary
sliding (GBS). This way, the model can reflect the microstructural (grain size, grain
boundary morphology, grain boundary precipitates and intragranular precipitates)
dependence of the deformation behaviour with respect to each deformation mechanism. As
regards to damage accumulation in the form of crack nucleation and propagation, the
decomposition rule founds the physical base to relate transgranular (fatigue) fracture to ID
and intergranular cavitation (creep) damage to GBS for polycrystalline materials. From this
premise, a general thermomechanical fatigue (TMF) model has been developed that
involves creep-fatigue and oxidation-fatigue interactions.
The TMF damage accumulation model physically depicts the process of fatigue crack
nucleation and propagation in coalescence with the creep/dwell damages (cavities or
wedge cracks) distributed along its path inside the material. According to the present
model, creep/dwell-fatigue interaction is nonlinear in nature. The model has been shown to
successfully correlate both “cold” dwell-fatigue and “hot” creep-fatigue. In cold dwell, the
damage is envisaged as dislocation pile-up, leading to formation of ZSK cracks. In hot creep,
the damage accumulation is related to grain boundary sliding. Particularly, for creep-fatigue
interaction, the model reconciles the SRP concept. Therefore, it provides a unified approach
to deal with dwell/creep-fatigue interactions.
Similarly, a fatigue crack growth equation is presented based on the transgranular restricted
slip reversal (RSR) mechanism, and a creep crack growth equation based on grain boundary
sliding with stress relaxation ahead of the crack tip. Crack growth in creep-fatigue is also
described within the same framework in association with fracture mechanics.
Overall, a physics-based holistic lifing approach has been developed; and when
incorporated with the finite element method, it offers an integrated methodology for life
prediction of gas turbine components, addressing a variety of failure modes under high
temperature loading conditions.
8. References
Anderson, T. L. (2005). Fracture Mechanics: Fundamentals and Applications. 3rd Ed., Taylor &
Francis Group. Boca Raton, FL.
Ashby, M.F. & Dyson, B.F. (1985). Advances in Fracture Research, Vol. 9 (eds. S. R. Valluri et
al.), Pergamon Press, Oxford, UK.
Bache, M.R., Cope, M., Davies, H.M., Evans W.J. & Harrison, G. (1997). Dwell sensitive
fatigue in a near alpha titanium alloy at ambient temperature. Int. J. Fatigue, 19, pp.
S83-S88.
Baik, S. & Raj, R. (1982). Mechanisms of creep-fatigue interaction. Metall. Trans. A, 13A, pp.
1215-1221.
Bain, K.R., Gambone, M.L., Hyzak, J.H. & Thoms, M.C. (1988). Development of damage
tolerant microstructure in Udimet 720. In: Superalloys 1988, pp. 13-22. The
Metallurgical Society, Warrendale, PA.
www.intechopen.com

Gas Turbines
278
Benson, J.P. & and Edmonds, D.V. (1978). Effects of microstructure on fatigue in threshold
region in low-alloy steels. Metal Sci., 12, pp. 223-232.
Bueckner, H.F. (1970). A novel principle for the computation of stress intensity factors.
Zeitschrift für Angewandte Mathematik und Mechanik, 50, pp.529-545.
Bueckner, H.F. (1987). Int. J. Solids & Struct., 23, pp. 57-93.
Carry, C. & Strudel, J.L. (1977). Apparent and effective creep parameters in single crystals of
a Ni-base superalloy⎯I: Incubation period. Acta Metall., 25, pp. 767-777.
Carry, C. & Strudel, J.L. (1978). Apparent and effective creep parameters in single crystals of
a Ni-base superalloy⎯II: Secondary creep. Acta Metall, 26, pp. 859-870.
Castillo, R., Koul, A.K. & Immarigeon, J.-P. (1988). The effect of service exposure on the
creep properties of cast IN-738LC subjected to low stress high temperature creep
conditions. In: Superalloys 1988, pp. 805-813. The Metallurgical Society, Warrendale,
PA.
Chaboche, J.L. & Gailetaud, G. (1986). On the calculation of structures in cyclic plasticity or
viscoplasticity. Computers & Structures, 23, pp. 23–31
Chang, M. Au, P., Terada, T. & Koul, A.K. (1992). Damage tolerance of alloy 718 turbine disc
material. In: Superalloys 1992, pp. 447-456. TMS, Warrendale, PA.
Cocks, A.C.F. & Ashby, M.F. (1982). The growth of a dominant crack in a creeping material.
Scripta Metall., 16, pp. 109-114.
Coffin, L.F. (1954). A study of the effects of cyclic thermal stresses on a ductile metal.
Transactions of the American Society of Mechanical Engineers, 76, pp. 931-950.
Coffin, L.F. (1969). Prediction parameters and their application to high temperature low
cycle fatigue. Proceedings of Second International Conference on Fracture, pp. 643-654,
Brighton, London, Chapmans Hall, 1969.
DeMestral, B. Eggeler, G. & Klam, H.-J. (1996). On the influence of grain morphology
on creep deformation and damage mechanisms in directionally solidified and
oxide dispersion strengthened superalloys, Metall. Mater. Trans. A, 27A, pp. 879-
890.
Dimelfi, R.J. and Nix, W.D. (1977). The stress dependence of crack growth rate during creep.
Int. J. Fract., 13, pp. 341-348.
Dyson, B.F. & McLean, M. (2000). Modelling the Effects of Damage and Microstructural
Evolution on the Creep Behaviour of Engineering Alloys. J. Eng. Mater. Technol.,
122, pp. 273-278.
Evans, R.W. & Wilshire, B. (1985). Creep of Metals and Alloys, The Institute of Metals, London,
UK.
Fleury, E. & Ha, J.S.(2001). Thermomechanical fatigue behaviour of nickel base superalloy
IN738LC: Part 2--Lifetime prediction. Material Science and Technology, 17, pp. 1087-
1092.
Floreen, S. (1983). Microstructural and environmental effects during creep crack growth in a
superalloy. In: Elastic-Plastic Fracture: Second Symposium, Volume I—Inealstic Crack
Analysis. ASTM STP 803, pp. I-708-720. American Society for Testing and Materials,
Philadelphia, PA.
Fong C., and Thomans, D. (1988). Stage I corrosion fatigue crack crystallography in
austenitic stainless steel (316L). Metall. Trans. A, 19A, 2765-2773.
www.intechopen.com

Life Prediction of Gas Turbine Materials
279
Frost, H.J. & Ashby, M.F. (1982). Deformation Mechanism Maps, Pergamon, Oxford.
Furrillo, F.T., Davidson, J.M., Tien, J.K. & Jackman, L.A. (1979), The effects of grain
boundary carbides on the creep and back stress of a Ni-base superalloy. Mater. Sci.
Eng., 39, pp. 267-273.
Halford, G.R., Saltsman, J.F. & Hirschberg, M.H. (1977). Ductility-Normalized Strain
Range Partitioning Life Relations for Creep-Fatigue Life Predictions. NASA
TM-73737.
Hutchinson, J.W. (1968). Singular behaviour at the end of a tensile crack in a hardening
material. J. Mech. Phys. Solids, 16, pp. 13-31.
Kolbe, M. Murken, J., Pistolek, D. Eggeler, G. & Klam, H.-J. (1999). Direct assessment of the
creep strength of DS cast turbine blades using miniature creep specimens. Mat.-
wiss. U. Werksofftech., 30, pp. 465-472.
Krausz, A.S. & Eyring, H. (1975). Deformation Kinetics, John Wiley& Sons, Inc.,
New York.
Laird, C. & Smith, G.C. (1982). Crack propagation in high stress fatigue. Phil. Mag., 7, pp.
847-857.
Landes, J.D. & Begley, J.A. (1976). A fracture mechanics approach to creep crack growth. In:
Mechanics of Crack Growth, ASTM STP 590, pp. 128-148. American Society for
Testing and Materials, Philadelphia, PA.
Liu, Y.J. & Hsu, T.R. (1985). A general treatment of creep crack growth. Eng. Fract. Mech., 21,
pp. 437-452.
Liu, C.D., Han, Y.F., Yan, M.G., and Chaturvedi, M.C. (1991), Proc. Superalloys 718, 625, and
Various Derivatives, E.A. Loria, ed., pp. 537-548. TMS, Warrendale, PA
Manson, S.S. (1954). Behaviour of materials under conditions of thermal stresses. National
Advisory Commision on Aeronautics Report 1170. Lewis Flight Propulsion Laboratory,
Cleveland, OH.
Miline, I., Ainsworth, R.A., Dowling, A.R. & Stewart, A.T. (1988). Int. J. Pressure Vessels and
Pipelines, 32, pp. 3-104.
Miller, M.P. (1993). Life prediction model for thermomechanical fatigue based on microcrack
propagation. In: ASTM STP 1186, pp. 35–49. American Society for Testing and
Materials, Philadelphia, PA.
Miller, K. J. & de los Rios, E. R. (Eds.) (1986). The Behaviour of Short Fatigue Cracks,
Mechanical Engineering Publisher, London.
Miner, M.A. (1945). Accumulative damage in fatigue. Transactions, ASME, Journal of Applied
Mechanics, 67, pp. A159-A167.
Neu, R. & Sehitoglu, H. (1989). Thermo-mechanical fatigue, oxidation and creep: part 2-life
prediction. Met. Trans. A, 20A, pp. 1769–1783.
Neumann, P. (1974). New experiments concerning the slip processes at propagating fatigue
crack-I. Acta Metall., 22, pp. 1155-1178.
Newman, J. C., Jr. & Raju, I. S. (1983). Stress-intensity factor equations for cracks in three-
dimensional finite bodies. In: Fracture Mechanics: Fourteenth Symposium – Vol. 1:
Theory and Analysis, ASTM STP 791, pp. 238-265. American Society for Testing and
Materials, Philadelphia, PA.
www.intechopen.com
Gas Turbines
280
Ostergren, W.J. (1976). A damage function and associated failure equations for predicting
hold time and frequency effects in elevated temperature low cycle fatigue. J. Testing
& Evaluation, 4, pp. 327-339.
Raj, R. & Ashby, M.F. (1975). Intergranular fracture at elevated temperature. Acta Metall.,
23, pp. 653-659.
Romannoski, G. R., Jr. (1982). Mechanisms of Deformation and Fracture in High Temperature
Low-Cycle Fatigue of Rene 80 and IN 100. NASA Contractor Report 165498.
Rice, J.R. (1972). Some remarks on elastic crack tip field. Int. J. Solids & Struct., 8, pp.
751-758.
Rice, J.R. (1985). J. Appl. Mech., 52, pp. 571-579.
Riedel, H. (1989). Creep crack growth. In: Fracture Mechanics: Perspectives and Directions
(Twentieth Symposium), ASTM STP 1020, pp. 101-126. American Society for Testing
and Materials, Philadelphia, PA.
Riedel, H. (1990). Creep crack growth under small-scale creep conditions. Int. J. Fract. 42, pp.
173-188.
Robinson, E.L. (1952). Effect of temperature variation on the long-time rupture strength of
steels. Transactions, ASME, 74, pp. 777-780.
Rice, J.R. and Rosengern, G.F. (1968). Plane strain deformation near a crack tip in a power-
law hardening material. J. Mech. Phys. Solids, 16, pp.1-12.
Sadananda, K. & Shahinian, P. (1977). Creep crack growth in Alloy 718. Metall. Trans. A, 8,
pp. 439-449.
Satyanarayana, D.V.V. Omprakash, C.M. Jagadeesan, B. & Niranjan Das (2008). Effect of
section thickness on creep and stress rupture behaviour of DS CN247 nickel base
superalloy. Materials at High Temperatures 25, pp. 17-26.
Saxena, A. (1986). Creep crack growth under non-steady-state conditions. In: Fracture
Mechanics, Seventeenth Volume, ASTM STP 905, pp. 185-201. American Society for
Testing and Materials, Philadelphia, PA.
Sanena, A., Williams, R.S. & Shih, T.T. (1981). A model for representing and predicting
the influence of hold times on fatigue crack growth behaviour at
elevated temperatures. In: Fracture Mechanics, Thirteenth Volume, ASTM
STP 743, pp. 86-99. American Society for Testing and Materials, Philadelphia,
PA.
Sehitoglu, H. (1992). Thermo-mechanical fatigue life prediction methods. In: Advances in
Fatigue Lifetime Predictive Techniques, ASTM STP 1122, pp. 47–76. American Society
for Testing and Materials, Philadelphia, PA.
Sessions, M.L., McMahon, C.J. & Walker, J.L. (1977). Further observations on the effect of
environment on the creep/rupture behaviour of a Ni-base high temperature alloys:
grain size effects. Material Sci. & Eng., 27, pp.17-24.
Schilke, P.W. (2004). Advanced Gas Turbine Materials and Coatings, GER-3569G (08/04), GE
Energy, Schenectady, NY.
Smith, R.A. & Cooper, J.F. (1989). Int. J. Pressure Vessels and Pipelines, 36, pp. 315-326.
Speidel, M.O. (1973). Modulus of elasticity and fatigue crack growth. In: High Temperature
Materials in Gas Turbine: Proceedinds of the Symposium on High Temperature Materials
www.intechopen.com

Life Prediction of Gas Turbine Materials
281
in Gas Turbines, Brow, Boveri & Company Limited, Baden, Switzerland, pp. 212-
221.
Tada, Hiroshi, Paris, P. C. & Irwin, G. R. (2000). The Stress Analysis of Cracks Handbook (3 ed.).
American Society of Mechanical Engineers.
Tanaka, K. & Mura, T. (1981). A dislocation model for fatigue crack initiation, J. App. Mech.,
48, pp. 97-103.
Telesman, J., Gabb, T.P., Garg, A., Bonacuse, P. & Gayda, J. (2008). Effect of microstructure
on time dependent fatigue crack growth behaviour in a P/M turbine disc alloy.
In: Superalloys 2008, pp. 807-816. The Metallurgical Society, Warrendale,
PA.
Viswanathan, R. (1989). Damage Mechanisms and Life Assessment of High-Temperature
Components. ASM International, Metals Park, OH.
Vitek, V. (1978). A theory of diffusion controlled intergranular creep crack growth. Acta
Metall., 3, pp.1345-1356.
Walker, K.P. (1981). Research and Development Program for Nonlinear Structural Modelling with
Advanced Time-Temperature Dependent Constitutive Relations, NASA Report CR-
165533, United Technologies Research Centre, East Hartford, CT.
Wang, X., Lambert, S. B. & Glinka, G. (1998). Approximate weight functions for embedded
elliptical cracks. Eng. Fract. Mech. 59 (3), pp 381-392.
Wu, X.J., Koul, A.K. & Krausz, A.S. (1993). A transgranular fatigue crack growth model
based on restricted slip reversibility. Metall. Trans. A, 24A, pp. 1373-1380.
Wu, X.J. & Krausz, A.K. (1994). A kinetics formulation for low-temperature plasticity. J.
Mater. Engng. Performance, 3, pp. 169-177.
Wu, X.J. & Koul, A.K. (1995). Grain boundary sliding in the presence of grain
boundary precipitates during transient creep,” Metall. Trans. A, 26A,
pp. 905-913.
Wu, X.J. & Koul, A.K. (1996). Modelling creep in complex engineering alloys. In: Creep and
Stress Relaxation in Miniature Structures and Components, pp. 3-19. The Metallurgical
Society, Warrendale, PA.
Wu, X.J. & Koul, A.K. (1997). Grain boundary sliding at serrated grain boundaries. Advanced
Performance Materials, 4, pp. 409-420.
Wu, X.J., Yandt, S., Au, P. & Immarigeon, J.-P. (2001). Modelling Thermomechanical Cyclic
Deformation by Evolution of Its Activation Energy, In: Thermomechanical Fatigue
Behaviour of Materials, 4th Volume, ASTM STP 1428, pp. 3-14. American Society for
Testing and Materials, Philadelphia, PA.
Wu, X.J. (2005). A continuously distributed dislocation model of Zener-Stroh-Koehler cracks
in anisotropic materials. Int. J. Solids & Struct. 42(7), pp. 1909-1921.
Wu, X.J. & Au, P. (2007). Deformation kinetics during dwell fatigue. Materials Science and
Technology, 23, pp. 1446-1449.
Wu, X.J., Beres, W. & Yandt, S. (2008). Challenges in life prediction of gas turbine critical
components. Can. Aeronaut. Space J., 54, pp. 31-39.
Wu, X.J., Yandt, S. & Zhang, Z. (2009). A Framework of Integrated Creep-Fatigue Modelling,
Proceedings of the ASME Turbo Expo 2009, GT2009-59087, June 8-12, 2009, Orlando,
Florida, USA.
www.intechopen.com

Gas Turbines
282
Wu, X.J. (2009a). Fatigue analysis for impact damaged Ti-6Al-4V material. LM-SMPL-2009-
0152. Institute for Aerospace Research, National Research Council Canada.
Wu, X.J. (2009b). A model of nonlinear fatigue-creep/dwell interactions. Trans. ASME
Journal of Engineering for Gas Turbines and Power, 131, pp. 032101/1-6.
www.intechopen.com

Gas TurbinesEdited by Gurrappa Injeti
ISBN 978-953-307-146-6Hard cover, 364 pagesPublisher SciyoPublished online 27, September, 2010Published in print edition September, 2010
InTech EuropeUniversity Campus STeP Ri Slavka Krautzeka 83/A 51000 Rijeka, Croatia Phone: +385 (51) 770 447 Fax: +385 (51) 686 166www.intechopen.com
InTech ChinaUnit 405, Office Block, Hotel Equatorial Shanghai No.65, Yan An Road (West), Shanghai, 200040, China
Phone: +86-21-62489820 Fax: +86-21-62489821
This book is intended to provide valuable information for the analysis and design of various gas turbineengines for different applications. The target audience for this book is design, maintenance, materials,aerospace and mechanical engineers. The design and maintenance engineers in the gas turbine and aircraftindustry will benefit immensely from the integration and system discussions in the book. The chapters are ofhigh relevance and interest to manufacturers, researchers and academicians as well.
How to referenceIn order to correctly reference this scholarly work, feel free to copy and paste the following:
Xijia Wu (2010). Life Prediction of Gas Turbine Materials, Gas Turbines, Gurrappa Injeti (Ed.), ISBN: 978-953-307-146-6, InTech, Available from: http://www.intechopen.com/books/gas-turbines/life-prediction-of-gas-turbine-materials

![YOUR PARTNER IN THE TURBINE INDUSTRY€¦ · VIPER Prokos Creep Feed CBN Grinding Creep Feed CD Non CD CD/IPD Non CD Max. material removal rate (mm3/smm) [inch3/min inch] 300 27,9](https://static.fdocuments.net/doc/165x107/6059bfa1fabd13333257ffb0/your-partner-in-the-turbine-industry-viper-prokos-creep-feed-cbn-grinding-creep.jpg)