Life Cycle Assessment of a LithiumIon Battery Vehicle...
12
RESEARCH AND ANALYSIS Life Cycle Assessment of a Lithium-Ion Battery Vehicle Pack Linda Ager-Wick Ellingsen, Guillaume Majeau-Bettez, Bhawna Singh, Akhilesh Kumar Srivastava, Lars Ole Valøen, and Anders Hammer Strømman Summary Electric vehicles (EVs) have no tailpipe emissions, but the production of their batteries leads to environmental burdens. In order to avoid problem shifting, a life cycle perspective should be applied in the environmental assessment of traction batteries. The aim of this study was to provide a transparent inventory for a lithium-ion nickel-cobalt-manganese traction battery based on primary data and to report its cradle-to-gate impacts. The study was carried out as a process-based attributional life cycle assessment. The environmental impacts were analyzed using midpoint indicators. The global warming potential of the 26.6 kilowatt- hour (kWh), 253-kilogram battery pack was found to be 4.6 tonnes of carbon dioxide equivalents. Regardless of impact category, the production impacts of the battery were caused mainly by the production chains of battery cell manufacture, positive electrode paste, and negative current collector. The robustness of the study was tested through sensitivity analysis, and results were compared with preceding studies. Sensitivity analysis indicated that the most effective approach to reducing climate change emissions would be to produce the battery cells with electricity from a cleaner energy mix. On a per-kWh basis, cradle-to-gate greenhouse gas emissions of the battery were within the range of those reported in preceding studies. Contribution and structural path analysis allowed for identification of the most impact-intensive processes and value chains. This article provides an inventory based mainly on primary data, which can easily be adapted to subsequent EV studies, and offers an improved understanding of environmental burdens pertaining to lithium-ion traction batteries. Keywords: climate change electric vehicles environmental impact assessment industrial ecology lithium-ion battery transportation Supporting information is available on the JIE Web site Introduction In the hope of mitigating climate change, both national and international goals have been set to reduce anthropogenic greenhouse gas (GHGs) emissions. Reaching these goals is made difficult by our dependence on the combustion of fossil fuels, a primary source of GHG emissions. Globally, light-duty vehi- cles are responsible for approximately 10% of energy use and GHG emissions (Solomon et al. 2007). A study commissioned by the World Business Council for Sustainable Development Address correspondence to: Linda Ager-Wick Ellingsen, Department of Energy and Process Engineering, Norwegian University of Science and Technology, E1-Høgskoleringen 5, Trondheim 7491, Norway. Email: [email protected] © 2013 by Yale University DOI: 10.1111/jiec.12072 Editor managing review: Ronald Williams Volume 18, Number 1 (2004) estimates that the number of light-duty vehicles in op- eration will rise from roughly 750 million currently to 2 billion by 2050. This projection entails a dramatic increase in demand for gasoline and diesel supplies, which raises concerns of energy security as well as implications for climate change and urban air quality. As a result, policy makers, advocacy groups, and the au- tomobile industry have promoted novel car technologies, such as electric vehicles (EVs), which, depending on the electric- ity mix used for charging, have the potential to reduce GHG www.wileyonlinelibrary.com/journal/jie Journal of Industrial Ecology 113
Transcript of Life Cycle Assessment of a LithiumIon Battery Vehicle...
R E S E A R C H A N D A N A LYS I S
Life Cycle Assessment of a Lithium-IonBattery Vehicle PackLinda Ager-Wick Ellingsen, Guillaume Majeau-Bettez, Bhawna Singh,Akhilesh Kumar Srivastava, Lars Ole Valøen, and Anders Hammer Strømman
Summary
Electric vehicles (EVs) have no tailpipe emissions, but the production of their batteries leadsto environmental burdens. In order to avoid problem shifting, a life cycle perspective shouldbe applied in the environmental assessment of traction batteries. The aim of this study was toprovide a transparent inventory for a lithium-ion nickel-cobalt-manganese traction batterybased on primary data and to report its cradle-to-gate impacts. The study was carriedout as a process-based attributional life cycle assessment. The environmental impacts wereanalyzed using midpoint indicators. The global warming potential of the 26.6 kilowatt-hour (kWh), 253-kilogram battery pack was found to be 4.6 tonnes of carbon dioxideequivalents. Regardless of impact category, the production impacts of the battery werecaused mainly by the production chains of battery cell manufacture, positive electrodepaste, and negative current collector. The robustness of the study was tested throughsensitivity analysis, and results were compared with preceding studies. Sensitivity analysisindicated that the most effective approach to reducing climate change emissions would beto produce the battery cells with electricity from a cleaner energy mix. On a per-kWhbasis, cradle-to-gate greenhouse gas emissions of the battery were within the range ofthose reported in preceding studies. Contribution and structural path analysis allowed foridentification of the most impact-intensive processes and value chains. This article providesan inventory based mainly on primary data, which can easily be adapted to subsequentEV studies, and offers an improved understanding of environmental burdens pertaining tolithium-ion traction batteries.
Keywords:
climate changeelectric vehiclesenvironmental impact assessmentindustrial ecologylithium-ion batterytransportation
Supporting information is availableon the JIE Web site
Introduction
In the hope of mitigating climate change, both nationaland international goals have been set to reduce anthropogenicgreenhouse gas (GHGs) emissions. Reaching these goals is madedifficult by our dependence on the combustion of fossil fuels,a primary source of GHG emissions. Globally, light-duty vehi-cles are responsible for approximately 10% of energy use andGHG emissions (Solomon et al. 2007). A study commissionedby the World Business Council for Sustainable Development
Address correspondence to: Linda Ager-Wick Ellingsen, Department of Energy and Process Engineering, Norwegian University of Science and Technology, E1-Høgskoleringen5, Trondheim 7491, Norway. Email: [email protected]
© 2013 by Yale UniversityDOI: 10.1111/jiec.12072 Editor managing review: Ronald Williams
Volume 18, Number 1
(2004) estimates that the number of light-duty vehicles in op-eration will rise from roughly 750 million currently to 2 billionby 2050. This projection entails a dramatic increase in demandfor gasoline and diesel supplies, which raises concerns of energysecurity as well as implications for climate change and urban airquality. As a result, policy makers, advocacy groups, and the au-tomobile industry have promoted novel car technologies, suchas electric vehicles (EVs), which, depending on the electric-ity mix used for charging, have the potential to reduce GHG
www.wileyonlinelibrary.com/journal/jie Journal of Industrial Ecology 113
eaven
Highlight

R E S E A R C H A N D A N A LYS I S
emissions, compared to internal combustion engine vehicles(ICEVs) (Hawkins et al. 2013; Samaras and Meisterling 2008).
The term electric vehicle covers several different typesof vehicles: hybrid electric vehicles (HEVs); plug-in hybridelectric vehicles (PHEVs); and purely battery-driven elec-tric vehicles (BEVs). Batteries used in PHEVs and BEVs arereferred to as traction batteries. Advances in battery technol-ogy have made lithium-ion (Li-ion) the preferred option oftraction batteries. There are various types of Li-ion batter-ies, using different compositions of cathode materials, suchas LiMn2O4 (LMO), LiFePO4 (LFP), Li(NiCoAl)O2, andLi(NixCoyMnz)O2 (NCM), where x, y, and z denote differ-ent possible ratios. In connection with these cathode materials,graphite is a commonly used anode material (Camean et al.2010; Park et al. 2013).
EVs are, on occasion, promoted as “zero-emission” vehicles,but studies have shown that the environmental contributionsof battery production and use phase can be significant (Hawkinset al. 2013; Samaras and Meisterling 2008). EVs have notailpipe emissions, but in order to avoid problem shifting, a lifecycle perspective should be applied in the environmental assess-ment of their traction batteries. Because limited accessibility tobattery industry data makes it difficult to openly evaluate theimpacts of EVs, open inventory studies on traction batteries aremostly based on secondary data. The most complete life cycle in-ventories (LCIs) are provided by Notter and colleagues (2010),Zackrisson and colleagues (2010), and Majeau-Bettez andcolleagues (2011). The U.S. Environmental Protection Agency(USEPA) (2013) compiled inventories based on both primaryand secondary data, but in order to protect the confidentialityof their primary data, they aggregated these data and completeinventories have not been provided. For their batteries, Dunnand colleagues (2012b) included a thorough investigation ofthe impact of recycling, but like the USEPA (2013), do not pro-vide a complete inventory. Bauer (2010), on behalf of the PaulScherrer Institut, performed a study commissioned by Volk-swagen. The inventory is partly based on primary data, but datahave been aggregated and the report is only available in Ger-man. In total, the existing literature varies with respect to theimportance of impacts associated with Li-ion traction batteries,but, more important, there is a low degree of transparency.
So far, the most complete traction battery inventories arebased on secondary data and do not converge to a consistentconclusion regarding the impacts pertaining to traction batter-ies. In order to obtain constructive insight into the environmen-tal footprint of these components, an inventory based mostlyon primary, rather than secondary, data has been compiled.This provides the opportunity for impact assessment of tractionbatteries to evolve beyond merely indicative academic studiesinto documentation based on more robust analysis. This studyoffers guidance as to where research and development (R&D)initiatives are likely to be rewarded with impact reductions.
A process-based attributional life cycle assessment (LCA)approach was used to report cradle-to-gate impact contribu-tions in terms of the most relevant components. In order toavoid problem shifting, multiple impact categories were cov-
ered. In addition to the conventional LCA method, struc-tural path analysis (SPA) was conducted to identify the mostemission-intensive value chains (Peters and Hertwich 2006).The basic idea behind an SPA is the unraveling of the Leontiefinverse by means of a series expansion, and this allows for impactinvestigation of different production chains (Wood and Lenzen2009). This article is divided into five sections, including the“Introduction.” First, system definition, battery characteristics,and battery inventory are described. Thereafter, the main re-sults of the cradle-to-gate analysis are presented. Subsequently,the findings are discussed and compared with preceding stud-ies; in this section, some of the implications of the study arecommented on. Finally, the main conclusions of the study arepresented.
Method
System Definition
The study was a cradle-to-gate life cycle assessment of anNCM traction battery and the related background processes;other EV components were outside the system boundary. Thefunctional unit was chosen as the production of one tractionbattery. Impacts were also reported for functional units based onmass measured in kilograms (kg) and in terms of nominal energycapacity measured in kilowatt-hours (kWh). A sensitivity anal-ysis reporting battery production impacts per kilometer (km)driven was also included in order to investigate the influenceof cycle life and powertrain efficiency on the environmentalperformance of the battery. A sensitivity analysis with respectto the source of the electricity was performed in order to assesshow the electricity mix used in production influences the totalimpact.
Battery Technology
Data in this section are provided by the battery producer(Miljøbil Grenland 2012). The battery is an NCM Li-ion bat-tery for use in BEVs. Each battery cell is made with a cathodebased on Li(NixCoyMnz)O2 and an anode based on graphite.One battery vehicle pack is made up of two battery subpacksconnected in parallel. The weight of the battery is 253 kg, ofwhich the battery cells makes up 60% of its total weight.1 Thebattery’s energy capacity is 26.6 kWh, and under normal usethe battery efficiency is 95% to 96%.2 The number of cycles thebattery can perform before its nominal capacity falls below 80%of its initial rated capacity is often referred to as the battery’scycle life (Kalhammer et al. 2007). With 100% depth of dis-charge (DOD), the battery is expected to reach a nominal cyclelife of 1,000 cycles, whereas 50% DOD extends the expectednumber to 5,000 cycles.
Battery Manufacture
The battery components were grouped into four main com-ponents: battery cell; packaging; battery management system
114 Journal of Industrial Ecology
eaven
Highlight
eaven
Highlight
eaven
Highlight
eaven
Highlight
eaven
Highlight
eaven
Highlight
eaven
Highlight
eaven
Highlight
R E S E A R C H A N D A N A LYS I S
BMS
Ba ery cell
Anode Cathode Electrolyte Seperator Cell container
Cooling system
One ba ery pack
BatteryassemblyBa ery
assembly
Radiator
Manifolds
Clamps
Pipe fi ng
Thermal gap pad
Coolant
Low voltage system
High voltage system
Fixings
IBIS
Module packaging
Ba ery reten on
Ba ery trayPackaging
BMB
Battery cellproductionp
Ba ery cell produc on
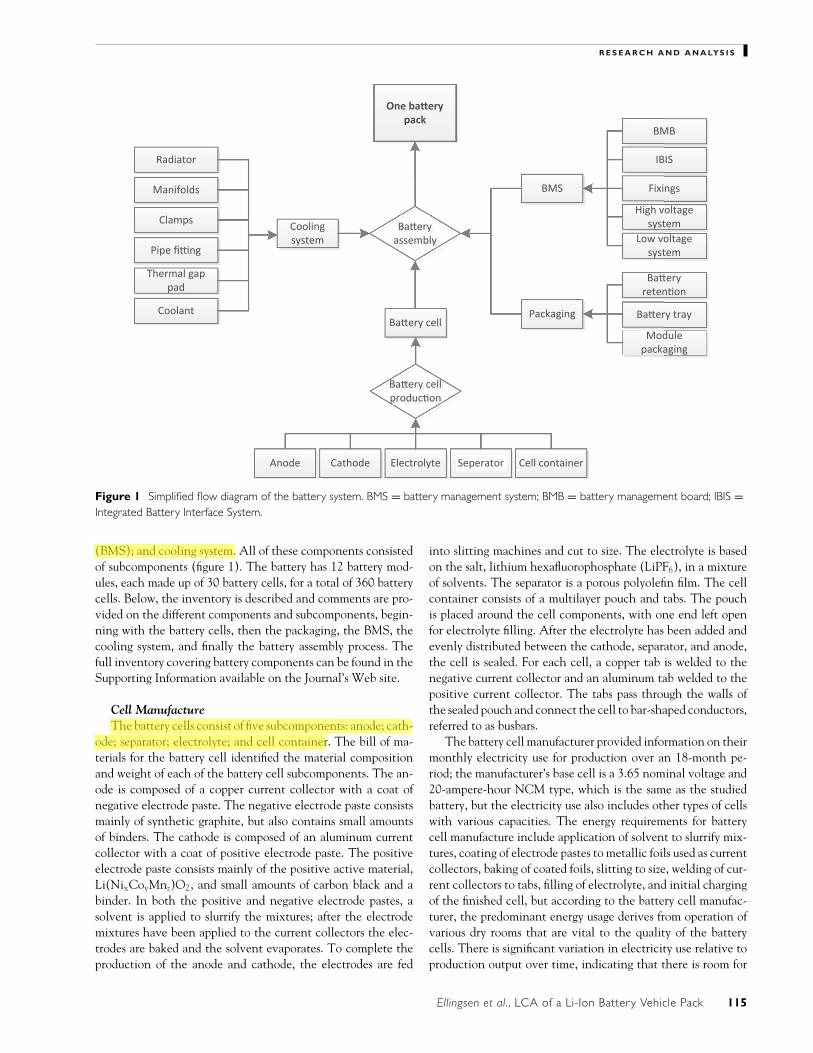
Figure 1 Simplified flow diagram of the battery system. BMS = battery management system; BMB = battery management board; IBIS =Integrated Battery Interface System.
(BMS); and cooling system. All of these components consistedof subcomponents (figure 1). The battery has 12 battery mod-ules, each made up of 30 battery cells, for a total of 360 batterycells. Below, the inventory is described and comments are pro-vided on the different components and subcomponents, begin-ning with the battery cells, then the packaging, the BMS, thecooling system, and finally the battery assembly process. Thefull inventory covering battery components can be found in theSupporting Information available on the Journal’s Web site.
Cell ManufactureThe battery cells consist of five subcomponents: anode; cath-
ode; separator; electrolyte; and cell container. The bill of ma-terials for the battery cell identified the material compositionand weight of each of the battery cell subcomponents. The an-ode is composed of a copper current collector with a coat ofnegative electrode paste. The negative electrode paste consistsmainly of synthetic graphite, but also contains small amountsof binders. The cathode is composed of an aluminum currentcollector with a coat of positive electrode paste. The positiveelectrode paste consists mainly of the positive active material,Li(NixCoyMnz)O2, and small amounts of carbon black and abinder. In both the positive and negative electrode pastes, asolvent is applied to slurrify the mixtures; after the electrodemixtures have been applied to the current collectors the elec-trodes are baked and the solvent evaporates. To complete theproduction of the anode and cathode, the electrodes are fed
into slitting machines and cut to size. The electrolyte is basedon the salt, lithium hexafluorophosphate (LiPF6), in a mixtureof solvents. The separator is a porous polyolefin film. The cellcontainer consists of a multilayer pouch and tabs. The pouchis placed around the cell components, with one end left openfor electrolyte filling. After the electrolyte has been added andevenly distributed between the cathode, separator, and anode,the cell is sealed. For each cell, a copper tab is welded to thenegative current collector and an aluminum tab welded to thepositive current collector. The tabs pass through the walls ofthe sealed pouch and connect the cell to bar-shaped conductors,referred to as busbars.
The battery cell manufacturer provided information on theirmonthly electricity use for production over an 18-month pe-riod; the manufacturer’s base cell is a 3.65 nominal voltage and20-ampere-hour NCM type, which is the same as the studiedbattery, but the electricity use also includes other types of cellswith various capacities. The energy requirements for batterycell manufacture include application of solvent to slurrify mix-tures, coating of electrode pastes to metallic foils used as currentcollectors, baking of coated foils, slitting to size, welding of cur-rent collectors to tabs, filling of electrolyte, and initial chargingof the finished cell, but according to the battery cell manufac-turer, the predominant energy usage derives from operation ofvarious dry rooms that are vital to the quality of the batterycells. There is significant variation in electricity use relative toproduction output over time, indicating that there is room for
Ellingsen et al., LCA of a Li-Ion Battery Vehicle Pack 115
eaven
Highlight
eaven
Highlight

R E S E A R C H A N D A N A LYS I S
improvement with respect to energy use. Three values for elec-tricity use are presented in this work: the lower-bound value(LBV); the asymptotic value (ASV); and the average value(AVV). The LBV is the value for the most energy-efficientmonth at 586 megajoules (MJ) per kWh (MJ/kWh) battery cellcapacity produced,3 the ASV represents the asymptotic valuefor the data set at 960 MJ/kWh battery cell−1, and the AVVis the average value for the data set at 2,318 MJ/kWh batterycell−1.
PackagingPackaging is divided into three subcomponents: module
packaging; battery retention; and battery tray. The modulepackaging consists of inner and outer frames, the aforemen-tioned busbars, module fasteners, and a module lid. The innerand outer frames form nylon cassettes that are placed aroundthe battery cell container to provide protection and structuralsupport. Additionally, each frame includes an aluminum heattransfer plate to ensure optimal thermal conduction. Thirty cas-settes stacked after one another form a battery module. At thetop of the cassettes, the tabs are welded to the busbars. For thetotal of 60 tabs per module, there are 30 busbars. There arethree types of busbars: copper end busbars; aluminum end bus-bars; and bimetallic busbars. Bimetallic busbars have a copperside and an aluminum side. At the negative terminal of thebattery, an end-busbar holder with a copper busbar is followedby seven double busbar holders, each with two bimetallic bus-bars, adding up to a total of 15 busbars. Similarly, on the positiveterminal, an end-busbar holder with one aluminum busbar is fol-lowed by seven double busbar holders, each with two bimetallicbusbars, also adding up to 15 busbars. The module fastenersinclude steel screws, caps, nuts, and retention rods, as well asnylon washers. Together with the module lid, the fasteners areused for assembly of the individual battery modules. There are12 battery modules in one battery, and the battery retentionsystem keeps the battery modules in place within the batterytray, using straps, restraints, and foams. In addition, eight heattransfer plates made of steel are considered a part of the batteryretention system. All battery components are placed inside asteel battery tray, which is closed with a sealed lid.
Battery Management SystemThe BMS includes battery module boards (BMBs), the In-
tegrated Battery Interface System (IBIS), fasteners, a high-voltage (HV) system, and a low-voltage system. In each bat-tery, there are 12 BMBs, one for each module. BMBs are placedunder module lids, situated between the two rows of busbars.The BMBs monitor the battery cells for voltage and tempera-ture limits, whereas the IBIS acts as a master controller for theBMBs, as well as overseeing the battery charge and dischargestrategies. Additionally, the IBIS provides vehicle-level HVprecharge, contactor control, system isolation monitoring, andcharge/discharge current measurements. Attached with steelscrews, the IBIS box is an integrated part of the HV system,which also contains cables, nylon clips, intermodule fuse, neo-prene gaskets, both plastic and aluminum connectors, and an
aluminum lid. The low-voltage system consists of nylon clipsand harnesses.
Cooling SystemFor thermal management, the battery is equipped with a
cooling system. An aluminum radiator is the main componentof the cooling system. For the convective heat medium, thecooling system includes a glycol coolant, which is containedwithin aluminum manifolds. Clamps and fasteners made of steelas well as pipe fittings of plastic and rubber are used for seal-ing. Thermal conductivity is further ensured with the use of athermal gap pad made of fiberglass-reinforced filler and polymer.
Battery AssemblyBattery assembly is performed at Miljøbil Grenland’s facility.
The assembly process itself requires little energy because theassembly of battery components to make one battery pack ismainly performed using manual labor. The only direct energyrequirement is for a welding process, which only amounts to0.014 MJ/kWh of battery capacity.
Inventory
An overview of the inventoried battery components arelisted in table 1. The inventory list indicates the extent oforiginal data collected for this study and which data are gath-ered from the literature. Forty-two elements are original data,whereas five are taken from Majeau-Bettez and colleagues(2011) and two from Notter and colleagues (2010)/Ecoinvent2.2. The subinventory for the positive active material wasbased on Majeau-Bettez and colleagues (2011), but the ra-tio of nickel, cobalt, and manganese has been modified fromLi(Ni0.4Co0.2Mn0.4)O2 to Li(Ni1/3Co1/3Mn1/3)O2 (c.f., Ngalaet al. 2004; Huang et al. 2011; Vayrynen and Salminen 2012;Wang and Chen 2012; Huang and Hitt 2013). Otherwise, nomodifications have been made to the original subinventories.
Copper products, in our study, were modeled as 85% of pri-mary and 15% secondary copper, a division based on the averagecopper consumption mix (International Institute for Sustain-able Development 2010). Aluminum products were modeled asa production mix consisting of 68% primary aluminum, 10%secondary aluminum from old scrap, and 22% secondary alu-minum from new scrap (Ecoinvent Centre 2010). Steel productswere modeled as low-alloyed steel, where 49% is made from re-cycled material (Ecoinvent Centre 2010). For the manufactureof battery cells, we established a medium voltage electricitymix, based on the following sources: 46% coal; 33% nuclear;15% gas; 4.4% oil; 1.4% hydro; 0.15% wind; 0.12% solar pho-tovoltaic; and 0.044% waste incineration. The assembly of thebattery is performed in Norway, and thus the Norwegian elec-tricity mix, at medium voltage, was used for the welding pro-cess. Transport was modeled as receiver input and was mainlybased on standard transport distances of materials (EcoinventCentre 2010). The transportation of battery cells and modulepackaging from the cell manufacturer in East Asia to MiljøbilGrenland in Norway included road transport and ocean freight.Choice of infrastructure required for production of the battery,
116 Journal of Industrial Ecology
eaven
Highlight
eaven
Highlight
eaven
Highlight
eaven
Highlight
eaven
Highlight
eaven
Highlight
eaven
Highlight

R E S E A R C H A N D A N A LYS I S
Table 1 List of inventories and subinventories
Inventory list
1 One battery pack2 Battery packaging3 BMS4 Cooling system5 Battery cell6 Battery tray7 Battery retention8 Tray with fasteners9 Tray lid10 Tray seal11 Strap retention12 Lower retention13 Propagation plate14 Low voltage system15 High voltage system16 Fasteners17 Integrated Battery Interface System (IBIS)18 Radiator19 Manifolds20 Clamps21 Pipe fitting22 Thermal pad23 Module packaging24 Module fasteners25 Outer frame26 Inner frame27 Bimetallic busbars, Al and Cu28 Busbars, Al29 Busbars, Cu30 Module lid31 Electrolyte32 Cathode33 Anode34 Cell container35 Separator36 Positive current collector, Al37 Positive electrode paste38 Negative current collector, Cu39 Negative electrode paste40 Tab, Al41 Tab, Cu42 Aluminum pouch43 Positive active materiala
44 Nickel cobalt manganese hydroxidea
45 Nickel sulfatea
46 Cobalt sulfatea
47 Manganese sulfatea
48 Lithium hexafluorophosphateb
49 Synthetic graphiteb
aMajeau-Bettez and colleagues (2011).bNotter and colleagues (2010).BMS = battery management system; Al = aluminum; Cu = copper.
battery components, and subcomponents was estimated basedon the recommendations published in the Ecoinvent reports(Ecoinvent Centre 2010).
Our inventory was linked to Ecoinvent 2.2 as a backgroundsystem (Ecoinvent Centre 2010) and included materials fromresource extraction. Using process-based attributional LCA, thecradle-to-gate impacts of the battery were calculated from thecompiled inventory. The battery was not attributed any bene-fits from second-life or end-of-life treatment. Characterizationof environmental releases and resource use was performed usingthe ReCiPe characterization method (version 1.08) for mid-point indicators from the hierarchical perspective (Goedkoopet al. 2009). SPA was performed to identify the value chain ofthe most emission-intensive processes and components.
Results and Analysis
In this section, the environmental impacts associated withthe production of the battery are presented. The total impactof the battery for 13 impact categories with additional resultsfor two alternative functional units is reported on (table 2), andthe cradle-to-gate impact contributions are broken down interms of key components (figure 2). The results of a sensitivityanalysis shows how different parameters influence the mannerin which production impacts are spread out over the use phase(figure 3). Another sensitivity analysis shows the impact ofdifferent electricity sources used for the manufacture of batterycells (figure 4).
Total Impacts and Contribution Analysis
The cradle-to-gate impact of our battery is highly depen-dent upon the energy requirements of battery cell manufacture.Therefore, impact at the LBV, ASV, and AVV of the batteryare all reported on (table 2). At the LBV, the cradle-to-gateglobal warming potential (GWP) of the battery is 4.6 tonnescarbon dioxide equivalents (CO2-eq.), whereas at the ASV it is6.4 tonnes CO2-eq, and at the AVV it is 13.0 tonnes CO2-eq.4
The results will hereafter be discussed in terms of the LBV,because this is likely to better reflect large-scale production vol-umes. The cradle-to-gate production impacts of the battery aremainly caused by the production chains of three key require-ments: the manufacture of battery cells; the positive electrodepaste; and the negative current collector (figure 2). For thevarious impact categories, these three production chains com-bined comprise 56% to 87% of the battery’s total impact. Withthe use of SPA, the value chains are tracked to find the dif-ferent sources of impacts. Combustion of hard coal and naturalgas in power plants to meet the energy requirements for themanufacture of battery cells make up 51% of the battery’s to-tal GWP impact. Extraction of hard coal and natural gas forthe same purpose make up 32% of the battery’s total fossil de-pletion potential (FDP). Natural gas, uranium, and crude oil,which are also used to meet the energy requirements for batterycell production, contribute to 31% of the battery’s total ozone
Ellingsen et al., LCA of a Li-Ion Battery Vehicle Pack 117
eaven
Highlight
eaven
Highlight
eaven
Highlight
eaven
Highlight

R E S E A R C H A N D A N A LYS I S
Table 2 Total impact of production
Alternative functional unitsFunctional unit
One battery pack Mass [kg−1] Cycle capacity [kWh−1]
Impact Units LBV ASV AVV LBV ASV AVV LBV ASV AVV
GWP100 kg CO2-eq 4,580 6,390 12,960 18 25 51 172 240 487FDP kg oil-eq 1,320 1,820 3,630 5.2 7.2 14 49.5 68.3 136.6ODPinf kg CFC-11-eq 2.8E-04 3.6E-04 6.5E-04 1.1E-06 1.4E-06 2.6E-06 1.1E-05 1.4E-05 2.4E-05POFP kg NMVOC 18 22 38 7.2E-02 8.9E-02 1.5E-01 6.8E-01 8.4E-01 1.4E+00PMFP kg PM10-eq 16 18 26 6.1E-02 7.0E-02 1.0E-01 5.8E-01 6.7E-01 9.7E-01TAP100 kg SO2-eq 51 59 85 2.0E-01 2.3E-01 3.4E-01 1.9 2.2 3.2FEP kg P-eq 8.0 8.7 11.0 3.2E-02 3.4E-02 4.4E-02 3.0E-01 3.3E-01 4.2E-01MEP kg N-eq 6.4 6.7 7.8 2.5E-02 2.6E-02 3.1E-02 2.4E-01 2.5E-01 2.9E-01FETPinf kg 1,4-DCB-eq 256 267 308 1.0 1.1 1.2 9.6 10.0 11.6METPinf kg 1,4-DCB-eq 276 287 329 1.1 1.1 1.3 10.4 10.8 12.4TETPinf kg 1,4 DCB-eq 1.3 1.4 1.6 5.2E-03 5.4E-03 6.2E-03 5.0E-02 5.2E-02 5.9E-02HTPinf kg 1,4-DCB-eq 15,900 16,340 18,110 63 64 71 596 614 681MDP kg Fe-eq 4,100 4,120 4,180 16 16 17 154 155 157
Note: Impact categories: global warming potential (GWP), fossil depletion potential (FDP), ozone depletion potential (ODP), photo oxidation formationpotential (POFP), particulate matter formation potential (PMFP), terrestrial acidification potential (TAP), freshwater eutrophication potential (FEP),marine eutrophication potential (MEP), freshwater toxicity potential (FETP), marine toxicity potential (METP), terrestrial eutrophication potential(TETP), human toxicity potential (HTP), and metal depletion potential (MDP). Suffixes “eq,” “100,” and “inf” refer to equivalents, 100 years, andinfinity, respectively.kg eq = kilograms equivalents; LBV = lower-bound value; ASV = asymptotic value; AVV = average value; kWh = kilowatt-hour; CO2 = carbondioxide; CFC-11 = trichlorofluoromethane; NMVOC = nonmethane volatile organic carbon; PM10 = particulate matter less than 10 µm in diameter;SO2 = sulfur dioxide; P = phosphor; N = nitrogen; 1,4-DCB = 1,4-dichlorobenzene; Fe = iron.
0% 10% 20% 30% 40% 50% 60% 70% 80% 90% 100%
CCP100
FDP
ODPinf
POFP
PMFP
TAP100
FEP
MEP
FETPinf
METPinf
TETPinf
HTPinf
MDP
Manufacture of ba ery cells Posi ve electrode paste Nega ve current collector (Cu)Posi ve current collector (Al) Nega ve electrode paste PackagingOther ba ery cell components BMS Cooling systemBa ery assembly
GWP100
FDP ODP
inf
POFP
PMFP TAP
100
FEP
MEP FETP
inf
METPinf
TETPinf
HTPinf
MDP
Figure 2 Contribution of cradle-to-gate impacts of the battery. Impact categories: global warming potential (GWP), fossil depletionpotential (FDP), ozone depletion potential (ODP), photo oxidation formation potential (POFP), particulate matter formation potential(PMFP), terrestrial acidification potential (TAP), freshwater eutrophication potential (FEP), marine eutrophication potential (MEP),freshwater toxicity potential (FETP), marine toxicity potential (METP), terrestrial eutrophication potential (TETP), human toxicity potential(HTP), and metal depletion potential (MDP). Suffixes “eq,” “100,” and “inf” refer to equivalents, 100 years, and infinity, respectively. CO2 =carbon dioxide; CFC-11 = trichlorofluoromethane; NMVOC = nonmethane volatile organic carbon; PM10 = particulate matter less than10 µm in diameter ; SO2 = sulfur dioxide; P = phosphor; N = nitrogen; 1,4-DCB = 1,4-dichlorobenzene; Fe = iron.
118 Journal of Industrial Ecology
eaven
Highlight
eaven
Highlight
eaven
Highlight
eaven
Highlight
eaven
Highlight

R E S E A R C H A N D A N A LYS I S
Figure 3 Sensitivity analysis on production impacts spread out over the use phase. Impact category: global warming potential (GWP).Suffixes “eq” and “100” refer to equivalents and 100 years, respectively. Abbreviations: g = gram; CO2 = carbon dioxide; MJ = megajoule;km = kilometer.
0
1000
2000
3000
4000
5000
6000
7000
Coal NG Current el.mix Hydro
GWP 1
00 p
rodu
con
impa
ct [k
g CO
2-eq
]
Electricity based on energy source
Manufacture of ba ery cell
Posi ve electrode paste
Nega ve current collector (Cu)
Posi ve current collector (Al)
Nega ve electrode paste
Packaging
Other cell components
BMS
Cooling system
Ba ery assembly
Figure 4 Sensitivity analysis with respect to source of electricity for battery cell manufacture. Impact category: global warming potential(GWP). Suffixes “eq” and “100” refer to equivalents and 100 years, respectively. Abbreviations: kg = kilogram; CO2 = carbon dioxide;NG = natural gas; Current el. mix = Current electricity mix.
depletion potential (ODP). Most impacts from the positiveelectrode paste are predominantly the result of the use of nickelsulfate, but manganese causes 86% of the paste’s metal depletionpotential (MDP). It should be noted that the ReCiPe methoddoes not include a depletion characterization factor for lithium,and therefore the use of lithium has no MDP impact, which,in turn, results in an underestimated absolute MDP value in
this study (see “Insights and implications” below). Primary cop-per used in the negative current collector adds a large shareof the battery’s total impact for many midpoint categories; itindirectly causes the disposal of sulfidic tailings that are toblame for 62% of freshwater eutrophication potential (FEP),65% of freshwater ecotoxicity potential (FETP), 54% of ma-rine ecotoxicity potential (METP), and 53% of human toxicity
Ellingsen et al., LCA of a Li-Ion Battery Vehicle Pack 119
eaven
Highlight

R E S E A R C H A N D A N A LYS I S
potential (HTP). The solvent, N-methyl-2-pyrrolidone(NMP), used in both the positive and negative electrode paste,causes the only significant contribution of the negative paste;production of dimethylamine used in the solvent contributesto 75% of the battery’s total marine eutrophication potential(MEP).
Sensitivity Analyses
To establish the GWP impact for a given distance driven,the total production impact of the battery is divided by the totaldistance the battery covers during its operating life in the vehi-cle. For a given initial nominal energy capacity, the distance isdependent upon the battery’s cycle life and the powertrain effi-ciency of the EV. For figure 3, an 80% DOD and a capacity lossof 0.008% per cycle from its initial capacity (see the SupportingInformation on the Web) were assumed.
The impact of production measured in grams (g) per km(g/km) is a decaying function of cycle number; because thebattery deteriorates slowly, doubling the number of charge-discharge cycles in the battery’s use phase almost doubles thedriving distance for the same initial impact (figure 3). Lowercycle numbers can be crucial for whether a BEV is environmen-tally preferable to an ICEV or not. Studies assessing the envi-ronmental performance of batteries can reach different conclu-sions, all depending on the assumptions regarding battery cyclenumbers or range; for our battery, a battery lifetime of 3,000 cy-cles (Majeau-Bettez et al. 2011) with a powertrain efficiency of0.50 MJ/km results in 11 g CO2-eq/km−1, whereas a lifetime of150,000 km (Notter et al. 2010), results in 31 g CO2-eq/km−1.5
Figure 3 also shows how, for a given number of charge-discharge cycles, different powertrain efficiencies allow for dif-ferent driving distances with the same initial battery produc-tion impact. For example, relative to a powertrain efficiency of0.5 MJ/km−1 as a starting point, every 0.1 MJ/km−1 change inpowertrain efficiency yields a 20% change in attributed produc-tion impact per km for any given cycle number.
Energy requirements met with a highly carbon-intensiveelectricity mix result in large GWP impacts (figure 4). Thelargest energy requirements in the production of the battery arefound in the manufacture of battery cells, and thus a sensitivityanalysis with respect to the electricity used in the productionof the cells is performed. In the first scenario, the battery cellsare produced with electricity based on coal, which results inan increase of the battery’s GWP by more than 40%. In thesecond scenario, the electricity is based on natural gas, whichhas similar carbon intensity as the current electricity mix andthus results in insignificant change in GWP. In the last sce-nario, the battery cells are produced using electricity based onhydroelectric power, which leads to a more than 60% decrease,compared to the battery’s current GWP.
Discussion
Result Analysis and Comparison with Preceding Studies
The aim of the study is to provide a detailed LCI of anNCM traction battery and report direct and indirect impacts of
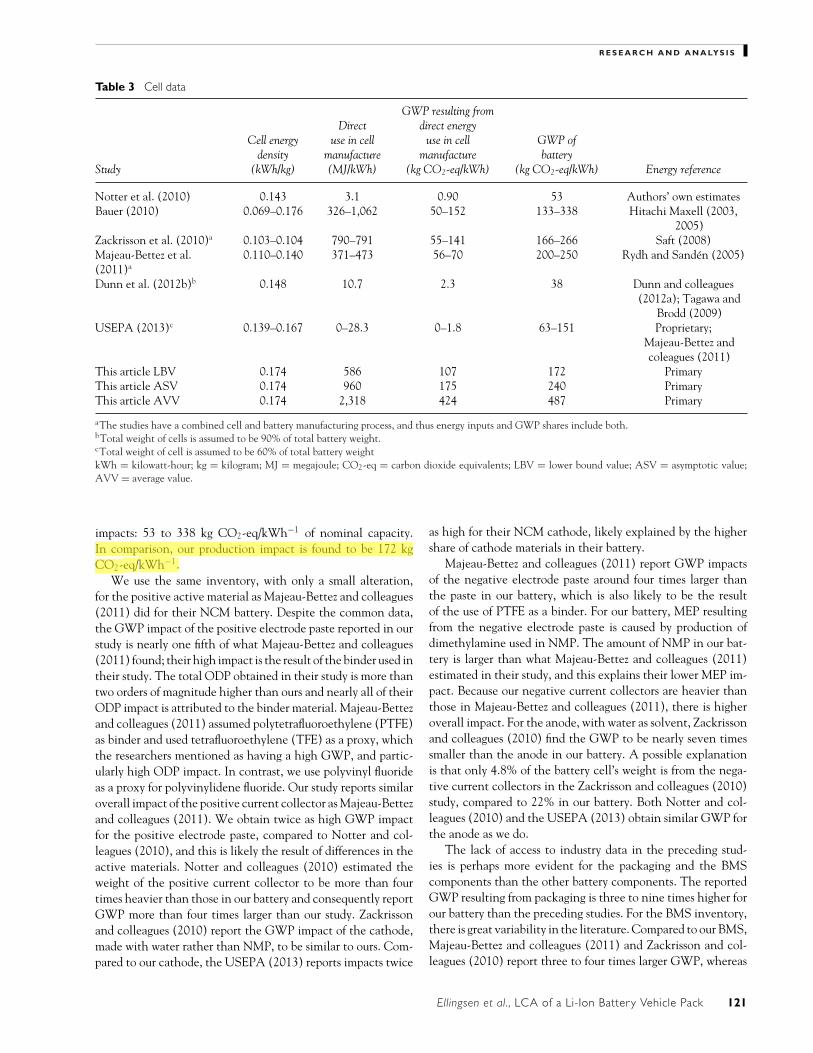
production for this battery. Battery capacity measured in kWhis used as a representative functional unit for batteries, whichallows a consistent comparison of the studies. Data from pre-ceding Li-ion traction battery studies have been compiled andinclude energy density of cell, direct energy requirements for cellmanufacture in terms of MJ/kWh, GWP resulting from directenergy use in cell manufacture, and GWP of the entire battery(table 3). Note that the focus is on the cell (not the battery),because energy requirements are significantly higher in cell pro-duction than in battery assembly.
The reported energy required for manufacture of bat-tery cells from preceding studies varies greatly, from 3.1 to1,060 MJ/kWh−1 (table 3). At the LBV, the presentstudy reports the corresponding energy requirements to be586 MJ/kWh−1. Notter and colleagues (2010) made theirown process-based energy estimations. Bauer (2010), Zackris-son and colleagues (2010), and Majeau-Bettez and colleagues(2011) based their energy data on industry reports from HitachiMaxell (2003, 2005), Saft (2008), and Rydh and Sanden(2005), respectively. Note that energy data reported in Za-ckrisson and colleagues (2010) and Majeau-Bettez and col-leagues (2011) include battery assembly as well as cell man-ufacture. Dunn and colleagues (2012b) based their energy dataon a quote for a dry room (provided by dry room manufacturerSCS Systems) and calculated energy required for formation cy-cling (Dunn et al. 2012a). The USEPA (2013) based theirenergy data partly on proprietary industry sources and partlyon Majeau-Bettez and colleagues (2011). The process-level ap-proach, used by Dunn and colleagues (2012b) and Notter andcolleagues (2010), has the advantage of being process specificand yields detailed results, but runs the risk of leaving out pro-cesses, and the lack of access to primary data may lead to uncer-tain estimates. The top-down approach, used by Bauer (2010),Zackrisson and colleagues (2010), and Majeau-Bettez and col-leagues (2011) has the advantage of being complete with respectto inclusion of all relevant activities related to the producingindustry, but data are often aggregated, which results in a lack ofdetail, and may include inhomogeneous products. In our study,the system boundaries for the battery cell manufacture are welldefined and products are homogenous (produces only Li-ionbattery cells), and thus we used a top-down approach to estab-lish energy usage. The different approaches have resulted in twoopposing understandings; we align with Bauer (2010), Zackris-son and colleagues (2010), and Majeau-Bettez and colleagues(2011) and find significantly higher energy requirements thanDunn and colleagues (2012b), Notter and colleagues (2010),and the USEPA (2013).
The environmental impacts of the cradle-to-gate analysisfor the LBV are compared with results reported in precedingstudies, but only limited comparison can be made with Bauer(2010) and Dunn and colleagues (2012b) because they reportresults for materials rather than components. There will be astronger emphasis on GWP than other impact categories, owingboth to GWP being the only common impact category in thereviewed literature, and the fact that EVs, to a large extent, arebeing promoted precisely as an alternative to ICEVs in orderto reduce GWP. The preceding studies report a wide range of
120 Journal of Industrial Ecology
eaven
Highlight
eaven
Highlight
R E S E A R C H A N D A N A LYS I S
Table 3 Cell data
GWP resulting fromDirect direct energy
Cell energy use in cell use in cell GWP ofdensity manufacture manufacture battery
Study (kWh/kg) (MJ/kWh) (kg CO2-eq/kWh) (kg CO2-eq/kWh) Energy reference
Notter et al. (2010) 0.143 3.1 0.90 53 Authors’ own estimatesBauer (2010) 0.069–0.176 326–1,062 50–152 133–338 Hitachi Maxell (2003,
2005)Zackrisson et al. (2010)a 0.103–0.104 790–791 55–141 166–266 Saft (2008)Majeau-Bettez et al.(2011)a
0.110–0.140 371–473 56–70 200–250 Rydh and Sanden (2005)
Dunn et al. (2012b)b 0.148 10.7 2.3 38 Dunn and colleagues(2012a); Tagawa and
Brodd (2009)USEPA (2013)c 0.139–0.167 0–28.3 0–1.8 63–151 Proprietary;
Majeau-Bettez andcoleagues (2011)
This article LBV 0.174 586 107 172 PrimaryThis article ASV 0.174 960 175 240 PrimaryThis article AVV 0.174 2,318 424 487 Primary
aThe studies have a combined cell and battery manufacturing process, and thus energy inputs and GWP shares include both.bTotal weight of cells is assumed to be 90% of total battery weight.cTotal weight of cell is assumed to be 60% of total battery weightkWh = kilowatt-hour; kg = kilogram; MJ = megajoule; CO2-eq = carbon dioxide equivalents; LBV = lower bound value; ASV = asymptotic value;AVV = average value.
impacts: 53 to 338 kg CO2-eq/kWh−1 of nominal capacity.In comparison, our production impact is found to be 172 kgCO2-eq/kWh−1.
We use the same inventory, with only a small alteration,for the positive active material as Majeau-Bettez and colleagues(2011) did for their NCM battery. Despite the common data,the GWP impact of the positive electrode paste reported in ourstudy is nearly one fifth of what Majeau-Bettez and colleagues(2011) found; their high impact is the result of the binder used intheir study. The total ODP obtained in their study is more thantwo orders of magnitude higher than ours and nearly all of theirODP impact is attributed to the binder material. Majeau-Bettezand colleagues (2011) assumed polytetrafluoroethylene (PTFE)as binder and used tetrafluoroethylene (TFE) as a proxy, whichthe researchers mentioned as having a high GWP, and partic-ularly high ODP impact. In contrast, we use polyvinyl fluorideas a proxy for polyvinylidene fluoride. Our study reports similaroverall impact of the positive current collector as Majeau-Bettezand colleagues (2011). We obtain twice as high GWP impactfor the positive electrode paste, compared to Notter and col-leagues (2010), and this is likely the result of differences in theactive materials. Notter and colleagues (2010) estimated theweight of the positive current collector to be more than fourtimes heavier than those in our battery and consequently reportGWP more than four times larger than our study. Zackrissonand colleagues (2010) report the GWP impact of the cathode,made with water rather than NMP, to be similar to ours. Com-pared to our cathode, the USEPA (2013) reports impacts twice
as high for their NCM cathode, likely explained by the highershare of cathode materials in their battery.
Majeau-Bettez and colleagues (2011) report GWP impactsof the negative electrode paste around four times larger thanthe paste in our battery, which is also likely to be the resultof the use of PTFE as a binder. For our battery, MEP resultingfrom the negative electrode paste is caused by production ofdimethylamine used in NMP. The amount of NMP in our bat-tery is larger than what Majeau-Bettez and colleagues (2011)estimated in their study, and this explains their lower MEP im-pact. Because our negative current collectors are heavier thanthose in Majeau-Bettez and colleagues (2011), there is higheroverall impact. For the anode, with water as solvent, Zackrissonand colleagues (2010) find the GWP to be nearly seven timessmaller than the anode in our battery. A possible explanationis that only 4.8% of the battery cell’s weight is from the nega-tive current collectors in the Zackrisson and colleagues (2010)study, compared to 22% in our battery. Both Notter and col-leagues (2010) and the USEPA (2013) obtain similar GWP forthe anode as we do.
The lack of access to industry data in the preceding stud-ies is perhaps more evident for the packaging and the BMScomponents than the other battery components. The reportedGWP resulting from packaging is three to nine times higher forour battery than the preceding studies. For the BMS inventory,there is great variability in the literature. Compared to our BMS,Majeau-Bettez and colleagues (2011) and Zackrisson and col-leagues (2010) report three to four times larger GWP, whereas
Ellingsen et al., LCA of a Li-Ion Battery Vehicle Pack 121
eaven
Highlight
R E S E A R C H A N D A N A LYS I S
the USEPA (2013) and Dunn and colleagues (2012b) estimatehalf the impact of ours. The BMS impact reported by Notterand colleagues (2010) is similar to the impact of our BMS.
The USEPA (2013) reported the impact of a cooling systemaggregated with the BMS impact. Dunn and colleagues (2012b)included glycol as a coolant fluid, but beyond this did not makean inventory for a cooling system. Because the cooling systemis a rather uncomplicated component material-wise and theinventory is based on primary industry data, we are confidentin the relatively low (5% of total GWP) impact generated bythe cooling system.
Insights and Implications
The production of the battery requires five kg of lithium.It is deemed unlikely that lithium in the battery will berecycled, because only selected materials, such as nickeland cobalt, are being recycled from Li-ion batteries (Dewulfet al. 2010). At present, the recovery of lithium is not efficientbecause of the low lithium content in batteries and the presentlow prices for lithium ore (Ziemann et al. 2012). Grosjean andcolleagues (2012) and Mohr and colleagues (2012) assessed theworld lithium resources and concluded that despite the tech-nological breakthrough of EVs, the planet is in no danger ofrunning out of lithium. In the study by Notter and colleagues(2010), it was concluded that although lithium can be con-sidered to be a geochemically scarce metal, assessment withabiotic depletion potential does not result in a high impact forthe lithium components of their battery.
By using our findings as a guide, the battery industry canreduce the environmental footprint of traction batteries. GWPof the battery will be reduced if the energy requirements are de-creased or met with less carbon-intensive electricity. The sensi-tivity analysis showed that it was possible to reduce the impactof production by more than 60% if the electricity used in cellmanufacture was based on hydroelectric power, rather than thecurrent electricity mix. For the studied NCM battery, the posi-tive electrode paste and the negative current collector made ofcopper have particularly high environmental impacts and reuseof these components is desirable because adverse environmen-tal effects can thereby be avoided. The current battery tech-nology has a limited functional lifetime; ideally, the batteriesshould last at least as long as the vehicles they drive. Extendingthe battery life may eliminate the necessity of replacement inthe vehicle lifetime, making the achievable cycle number of thebattery a crucial parameter. The sensitivity analysis performedon cycle number and impact per km driven (figure 3) showsthat not only total number of cycles delivered by the battery isimportant, but that powertrain efficiency is also a crucial param-eter. To drive a distance of 160,000 km (total driving distancegiven for the Mercedes-Benz A 180), 1,100 cycles will be de-manded of the battery by a vehicle with powertrain efficiencyof 0.50 MJ/km, whereas 1,800 cycles will be demanded by avehicle with powertrain efficiency of 0.80 MJ/km. This demon-strates that the number of cycles required from the battery bythe vehicle is dependent on the powertrain efficiency of the ve-
hicle. In this way, the powertrain efficiency directly influencesthe usable lifetime of the battery in the vehicle (figure 3).
The production of the battery causes 4.6 tonnes CO2-eqat LBV (table 2). This is close to the cradle-to-gate impactof a small personal vehicle, such as the A 180, which emits6.1 tonnes CO2-eq (Daimler AG 2012). In fact, production ofEVs have been found to have almost twice as large a GWP asICEVs (Hawkins et al. 2013; Volkswagen AG 2013). In orderfor EVs to be a viable alternative from a GWP perspective,EVs have to make up for the large production phase impacts byemitting less than ICEVs in the use phase.
Conclusion
A high-resolution inventory for an NCM traction batteryhas been compiled. In addition, the environmental impacts as-sociated with the production of the studied battery are assessedand analyzed (table 2). The most impact-intensive productionchains were the manufacture of the battery cells, the positiveelectrode paste, and the negative current collector (figure 2).Our main findings were comparable with those in precedingstudies; the observed discrepancies between our study and thepreceding studies can, to a large extent, be explained by thedifferences in battery design or the preceding studies’ lack ofaccess to primary data. Sensitivity analysis showed that pow-ertrain efficiency and cycle numbers are crucial when assessingthe environmental impact of traction batteries (figure 3). Thesensitivity analysis of electricity used for manufacture of batterycells showed that the most effective approach to reduce GWPis to focus on reducing the energy demand in cell manufactureand the carbon intensity of the electricity used in production(figure 4).
If the battery industry and policy makers use our results toprioritize R&D resources—decreasing the manufacturing en-ergy requirements or using cleaner electricity sources, clos-ing the material loop by recycling, and increasing the batterylifetime—impacts may be reduced to the point where EVs of-fer very clear advantages relative to ICEVs. EV producers, inturn, may improve the battery lifetime by improving powertrainefficiency.
With this work, original primary data are provided, and bydoing so, some of the key gaps in the existing literature on EVs,and particularly on traction batteries, are filled. Consequently,the study allows for a better understanding of the environmentalimpacts pertaining to traction batteries and, ultimately, EVs andpermits the discussion of traction batteries to move forward witha greater empirical foundation.
Acknowledgments
This research was made possible, in part, by the NorwegianResearch Council under the E-Car project and CenSES.
Notes
1. One kilogram (kg, SI) ≈ 2.204 pounds (lb).
122 Journal of Industrial Ecology
eaven
Highlight
eaven
Highlight
eaven
Highlight
eaven
Highlight
R E S E A R C H A N D A N A LYS I S
2. One kilowatt-hour (kWh) ≈ 3.6 × 10⁶ joules (J, SI) ≈ 3.412 × 10³
British Thermal Units (BTU).3. One megajoule (MJ) = 106 joules (J, SI) ≈ 239 kilocalories
(kcal) ≈ 948 British Thermal Units (BTU).4. One tonne (t) = 103 kilograms (kg, SI) ≈ 1.102 short tons. Car-
bon dioxide equivalent (CO2-eq) is a measure for describing theclimate-forcing strength of a quantity of greenhouse gases using thefunctionally equivalent amount of carbon dioxide as the reference.
5. One gram (g) = 10−3 kilograms (kg, SI) ≈ 0.035 ounces (oz). Onekilometer (km, SI) ≈ 0.621 miles (mi).
References
Bauer, C. 2010. Okobilanz von Lithium-Ionen Batterien. [Life cycle assess-ment of lithium-ion batteries.] Assessment. Paul Scherrer Institut, La-bor fur Energiesystem-Analysen. http://gabe.web.psi.ch/pdfs/PSI_Report/OekobilanzLiIonBatterien_PSI_Schlussbericht_2010.pdf.Accessed 13 November 2012.
Camean, I., P. Lavela, J. L. Tirado, and A. B. Garcıa. 2010. On the elec-trochemical performance of anthracite-based graphite materialsas anodes in lithium-ion batteries. Fuel 89(5): 986–991.
Daimler AG. 2012. Environmental certificate Mercedes-Benz A-class.Stuttgart, Germany: Global Communications Mercedes-Benz Cars. www.daimler.com/Projects/c2c/channel/documents/2240746_Environmental_Certificate_Mercedes_Benz_A_Class.pdf. Accessed 16 June 2012.
Dewulf, J., G. van der Vorst, K. Denturck, H. van Langenhove, W.Ghyoot, J. Tytgat, and K. Vandeputte. 2010. Recycling recharge-able lithium ion batteries: Critical analysis of natural resourcesavings. Resources, Conservation and Recycling 54(4): 229–234.
Dunn, J. B., M. Barnes, L. Gaines, J. Sullivan, and M. Q. Wang.2012a. Material and energy flows in the materials production, as-sembly, and end-of-life stages of the automative lithium-ion batterylife cycle. http://greet.es.anl.gov/publication-lib-lca. Accessed 30April 2013.
Dunn, J. B., L. Gaines, J. Sullivan, and M. Q. Wang. 2012b. Impact ofrecycling on cradle-to-gate energy consumption and greenhousegas emissions of automotive lithium-ion batteries. EnvironmentalScience & Technology 46(22): 12704–12710.
Ecoinvent Center. 2010. Ecoinvent data and reports v.2.2. Dubendorf,Switzerland: Swiss Center for Life Cycle Inventories.
Goedkoop, M., R. Heijungs, M. Huijbregts, A. De Schryver, J. Struijs,and R. van Zelm. 2009. ReCiPe 2008. A life cycle impact assessmentmethod which comprises harmonised category indicators at the midpointand the endpoint level. First edition report I: Characterisation. TheNetherlands: Ministerie van VROM. http://www.lcia-recipe.net/.Accessed 4 June 2013.
Grosjean, C., P. H. Miranda, M. Perrin, and P. Poggi. 2012. Assessmentof world lithium resources and consequences of their geographicdistribution on the expected development of the electric vehicleindustry. Renewable and Sustainable Energy Reviews 16(3): 1735–1744.
Hawkins, T. R., B. Singh, G. Majeau-Bettez, and A. H. Strømman.2013. Comparative environmental life cycle assessment of con-ventional and electric vehicles. Journal of Industrial Ecology 17(1):53–64.
Hitachi Maxell Ltd. 2003. Annual report. Tokyo, Japan: Hitachi Group.Hitachi Maxell Ltd. 2005. Environmental report. Tokyo, Japan: Hitachi
Group.
Huang, X. and J. Hitt. 2013. Lithium ion battery separators: Devel-opment and performance characterization of a composite mem-brane. Journal of Membrane Science 425–426: 163–168.
Huang, Z.-D., X.-M. Liu, B. Zhang, S.-W. Oh, P.-C. Ma, and J.-K. Kim.2011. LiNi1/3Co1/3Mn1/3O2 with a novel one-dimensionalporous structure: A high-power cathode material for recharge-able Li-ion batteries. Scripta Materialia 64(2): 122–125.
IISD (International Institute for Sustainable Development). 2010. Sus-tainable development and the global copper supply chain: Internationalresearch team report. Toronto, Canada: Five Winds International.
Kalhammer, F. R., B. M. Kopf, D. H. Swan, V. P. Roan, and M. P.Walsh. 2007. Status and prospects for zero emissions vehicle technol-ogy. Sacramento, CA, USA: State of California Air ResourcesBoard.
Majeau-Bettez, G., T. R. Hawkins, and A. H. Strømman. 2011. Lifecycle environmental assessment of lithium-ion and nickel metalhydride batteries for plug-in hybrid and battery electric vehicles.Environmental Science & Technology 45(10): 4548–4554.
Miljøbil Grenland. 2012. Bill of materials. Porsgrunn, Norway.Mohr, S. H., G. Mudd, and D. Giurco. 2012. Lithium resources and
production: Critical assessment and global projections. Minerals2(1): 65–84.
Ngala, J. K., N. A. Chernova, M. Ma, M. Mamak, P. Y. Zavalij, andM. S. Whittingham. 2004. The synthesis, characterization andelectrochemical behavior of the layered LiNi0.4Mn0.4Co0.2O2compound. Journal of Materials Chemistry 14(2): 214–220. http://xlink.rsc.org/?DOI=b309834f. Accessed 13 September 2010.
Notter, D. A., M. Gauch, R. Widmer, P. Wager, A. Stamp, R. Zah,and H.-J. Althaus. 2010. Contribution of Li-ion batteries to theenvironmental impact of electric vehicles. Environmental Science& Technology 44(17): 6550–6556.
Park, T.-H., J.-S. Yeo, M.-H. Seo, J. Miyawaki, I. Mochida, and S.-H.Yoon. 2013. Enhancing the rate performance of graphite anodesthrough addition of natural graphite/carbon nanofibers in lithium-ion batteries. Electrochimica Acta 93: 236–240.
Peters, G. P. and E. G. Hertwich. 2006. Structural analysis of interna-tional trade: Environmental impacts of Norway. Economic SystemsResearch 18(2): 155–181.
Rydh, C. J. and B. A. Sanden. 2005. Energy analysis of batteries in pho-tovoltaic systems. Part I: Performance and energy requirements.Energy Conversion and Management 46(11–12): 1957–1979.
Saft. 2008. Annual report 2008. Management. Bagnolet, France: SaftGroup SA.
Samaras, C. and K. Meisterling. 2008. Life cycle assessment of green-house gas emissions from plug-in hybrid vehicles: Implications forpolicy. Environmental Science & Technology 42(9): 3170–3176.
Solomon, S., D. Qin, M. Manning, Z. Chen, M. Marquis, K. B. Averyt,M. Tignor, and H. L. Miller. 2007. Contribution of Working GroupI to the Fourth Assessment Report of the Intergovernmental Panel onClimate Change. Cambridge, UK: Cambridge University Press.
USEPA (United States Environmental Protection Agency). 2013. Ap-plication of life-cycle assessment to nanoscale technology: Lithium-ionbatteries for electric vehicles. Nanotechnology. EPA 744-R-12-001.Washington, DC: National Service Center for EnvironmentalPublications. www.epa.gov/dfe/pubs/projects/lbnp/final-li-ion-battery-lca-report.pdf. Accessed 20 May 2013.
Volkswagen AG. 2013. The e-mission. Electric mobility and the envi-ronment. Production. www.volkswagenag.com/content/vwcorp/info_center/en/publications/2013/01/The_e-Mission_Electric_Mobility_and_the_Environment.bin.html/binarystorageitem/file/the_e-mission.pdf. Accessed 12 February 2013.
Ellingsen et al., LCA of a Li-Ion Battery Vehicle Pack 123

R E S E A R C H A N D A N A LYS I S
Vayrynen, A. and J. Salminen. 2012. Lithium ion battery production.The Journal of Chemical Thermodynamics 46: 80–85.
Wang, J. and T. Chen. 2012. Surface composition and electrochemicalbehavior of LiNi1/3Co1/3Mn1/3O2 cathode material with copperadditive. Rare Metals 31(4): 397–401.
Wood, R. and M. Lenzen. 2009. Structural path decomposition. En-ergy Economics 31(3): 335–341. http://linkinghub.elsevier.com/retrieve/pii/S0140988308001680. Accessed 26 March 2012.
World Business Council for Sustainable Development. 2004. Mobility2030: Meeting the challenges to sustainability. London, UK: Seven.www.wbcsd.org/Pages/EDocument/EDocumentDetails.aspx?ID=69&NoSearchContextKey=true. Accessed 23 October 2012.
Zackrisson, M., L. Avellan, and J. Orlenius. 2010. Life cycle assessmentof lithium-ion batteries for plug-in hybrid electric vehicles—Critical issues. Journal of Cleaner Production 18(15): 1519–1529.
Ziemann, S., M. Weil, and L. Schebek. 2012. Tracing the fate oflithium—The development of a material flow model. Resources,Conservation and Recycling 63: 26–34.
About the Authors
Linda Ager-Wick Ellingsen is a researcher at the Indus-trial Ecology Programme (IndEcol) in the Department of En-ergy and Process Engineering at the Norwegian Universityof Science and Technology (NTNU) in Trondheim, Nor-way. Guillaume Majeau-Bettez is a doctoral candidate at In-dEcol, NTNU. Bhawna Singh is a researcher at IndEcol,NTNU. Akhilesh Kumar Srivastava was a research scien-tist/test and validation manager at Miljøbil Grenland, in Pors-grunn, Norway, at the time the article was written. He iscurrently a senior scientist at Tel-Tek, Porsgrunn, Norway.Lars Ole Valøen was chief technical officer at Miljøbil Gren-land at the time the article was written. He is currentlychief technical officer at Grenland Energy AS, Porsgrunn,Norway. Anders Hammer Strømman is professor at IndEcol,NTNU.
Supporting Information
Additional supporting information may be found in the online version of this article at the publisher’s web site:
Supporting Information S1: This supporting information contains a system description and flowcharts, a full inventory ofthe battery components, complete numerical values of the battery pack, a sensitivity analysis of the number of cycles, anda structural path analysis related to the study presented in the main article.
124 Journal of Industrial Ecology