Life Cycle Assessment of a Lightweight Concrete Masonry ... · housing, LCA, LCI, life cycle, life...
168
Research & Development Information PCA R&D Serial No. 2573 Life Cycle Assessment of a Lightweight Concrete Masonry House Compared to a Wood Frame House by Medgar L. Marceau and Martha G. VanGeem © Portland Cement Association 2002 All rights reserved This information is copyright protected. PCA grants permission to electronically share this document with other professionals on the condition that no part of the file or document is changed
Transcript of Life Cycle Assessment of a Lightweight Concrete Masonry ... · housing, LCA, LCI, life cycle, life...
Research & Development Information
PCA R&D Serial No. 2573
Life Cycle Assessment of a Lightweight Concrete Masonry House Compared to a
Wood Frame House
by Medgar L. Marceau and Martha G. VanGeem
© Portland Cement Association 2002 All rights reserved
This information is copyright protected. PCA grants permission to electronically share this document with other professionals on the
condition that no part of the file or document is changed

ii
KEYWORDS Block, cement, concrete, concrete masonry unit, CMU, emissions, embodied energy, energy, housing, LCA, LCI, life cycle, life cycle assessment, life cycle characterization, life cycle impact assessment, life cycle inventory, lightweight concrete, lightweight concrete block, masonry, modeling, residential, wood ABSTRACT This report presents the results of an environmental life cycle assessment (LCA) on a house modeled with two types of exterior walls: a wood-framed wall and a lightweight concrete masonry unit (CMU) wall. The LCA was carried out according to the guidelines of the ISO 14040 series. The house was also modeled in five cities, representing a range of U.S. climates: Tampa, El Paso, Knoxville, Providence, and Detroit.
The house is a two-story single-family building with a contemporary design. The house system boundary includes the inputs and outputs of energy and material from construction, occupancy and maintenance. The life of the house is 100 years.
The LCA was conducted by first assembling the relevant LCI data from published reports and commercially available databases. The LCA software tool, SimaPro, was then used to perform a life cycle impact assessment. Impact assessment is not completely scientific; so three different methods were used: Eco-Indicator 99, EDIP/UMIP 96, and EPS 2000. Further, three versions of the Eco-Indicator 99 method were used—each one reflects a different cultural perspective: hierarchic, egalitarian, and individualist.
The data show similar results for the two houses. In most cases the lightweight CMU house has lower (better) impact indicators in the colder climates (El Paso, Knoxville, Providence, and Detroit). In the warmest climate (Tampa), the impact indicators are generally greater (worse) for the lightweight CMU house because household energy use is also greater. The exceptions are (i) in the categories “respiratory inorganics,” “land use,” and “minerals” in the Eco-Indicator methods and the categories “life expectancy,” “severe morbidity” “severe nuisance,” and “species extinction” in the EPS 2000 method, where impact indicators for the lightweight CMU house are greater, and (ii) “radiation” and “ozone” in the Eco-Indicator methods and the categories “ozone depletion,” “ecotoxicity,” and “human toxicity, water” in the EDIP/UMIP 96 method, where indicators for the wood house are greater.
The most significant environmental impacts are not from construction products but from the production and household-use of electricity and natural gas. Furthermore, the largest impacts are in the form of depletion of fossil fuel reserves (categorized as damage to natural resources) and release to the air of respiratory inorganics (categorized as damage to human health). Among the construction products used in the house, wood products have the largest environmental load, followed by cement-based materials for the lightweight CMU house, and followed by copper tubing then cement-based materials for the wood house. REFERENCE Marceau, Medgar L. and VanGeem, Martha G., “Life Cycle Assessment of a Lightweight Concrete Masonry House Compared to a Wood Frame House,” R&D Serial No. 2573, Portland Cement Association, Skokie, Illinois, USA, March 2002, 166 pages.
iii
TABLE OF CONTENTS Page Abstract ........................................................................................................................................... ii
Table of Contents........................................................................................................................... iii
List of Tables ................................................................................................................................. iv
List of Figures ................................................................................................................................ vi
Introduction..................................................................................................................................... 1
Life Cycle Assessment........................................................................................................... 1
Goal................................................................................................................................................. 2
Scope............................................................................................................................................... 2
House Description........................................................................................................................... 3
Assumptions.................................................................................................................................... 5
Life Cycle Inventory Analysis ........................................................................................................ 5
Household Occupant Energy-Use........................................................................................ 10
Life Cycle Impact Assessment...................................................................................................... 11
Life Cycle Interpretation............................................................................................................... 13
Conclusions................................................................................................................................... 19
Acknowledgements....................................................................................................................... 26
References..................................................................................................................................... 26
Appendix A – Target Audience and Information to be Communicated..................................... A-1
Appendix B – House Plans and Wall Cross-Sections ................................................................ B-1
Appendix C – LCI Data for Wood Houses and lightweight CMU Houses – SI Units .............. C-1
Appendix D – LCI Data for Wood Houses and lightweight CMU Houses – U.S. Customary Units ................................................................................................. D-1
Appendix E – The Eco-Indicator Impact Assessment Method.................................................. E-1
Appendix F – The EDIP/UMIP 96 Impact Assessment Method................................................F-1
Appendix G – The EPS 2000 Impact Assessment Method........................................................ G-1
Appendix H – LCA Summary of Wood Houses and lightweight CMU Houses (Output from SimaPro)..................................................................................................... H-1
Appendix I – Graphical Presentation of LCA Single-Score Summary ......................................I-1
Appendix J – LCA Single-Score Summary (Output from SimaPro) ......................................... J-1
Appendix K – Breakdown of Single-Score LCA of Building Materials (Output from SimaPro) ....................................................................................... K-1
iv
LIST OF TABLES
Table 1. International Energy Conservation Code Maximum U-Factors ............................. 4
Table 2. Assembly U-Factors................................................................................................ 5
Table 3. House Component Replacement Schedules............................................................ 6
Table 4. Sources of LCI Data................................................................................................ 7
Table 5. LCI Data and Assumptions..................................................................................... 8
Table 6. Materials Excluded from the LCA because of Insufficient Data.......................... 10
Table 7. Annual Occupant Energy-Use by Location .......................................................... 11
Table 8. Required HVAC System Capacity as Determines by Energy Simulation Software.............................................................................................. 11
Table 9. Impact Categories for Three Life Cycle Impact Assessment Methods ................ 13
Table 10. Characterization of Life Cycle Inventory Data Assuming an Egalitarian Perspective using the Eco-Indicator 99 Method of Characterization (Output from SimaPro) ......................................................................................... 14
Table 11. Characterization of Life Cycle Inventory Data Assuming a Hierarchic Perspective using the Eco-Indicator 99 Method of Characterization (Output from SimaPro) ......................................................................................... 15
Table 12. Characterization of Life Cycle Inventory Data Assuming an Individualist Perspective using the Eco-Indicator 99 Method of Characterization (Output from SimaPro) ......................................................................................... 16
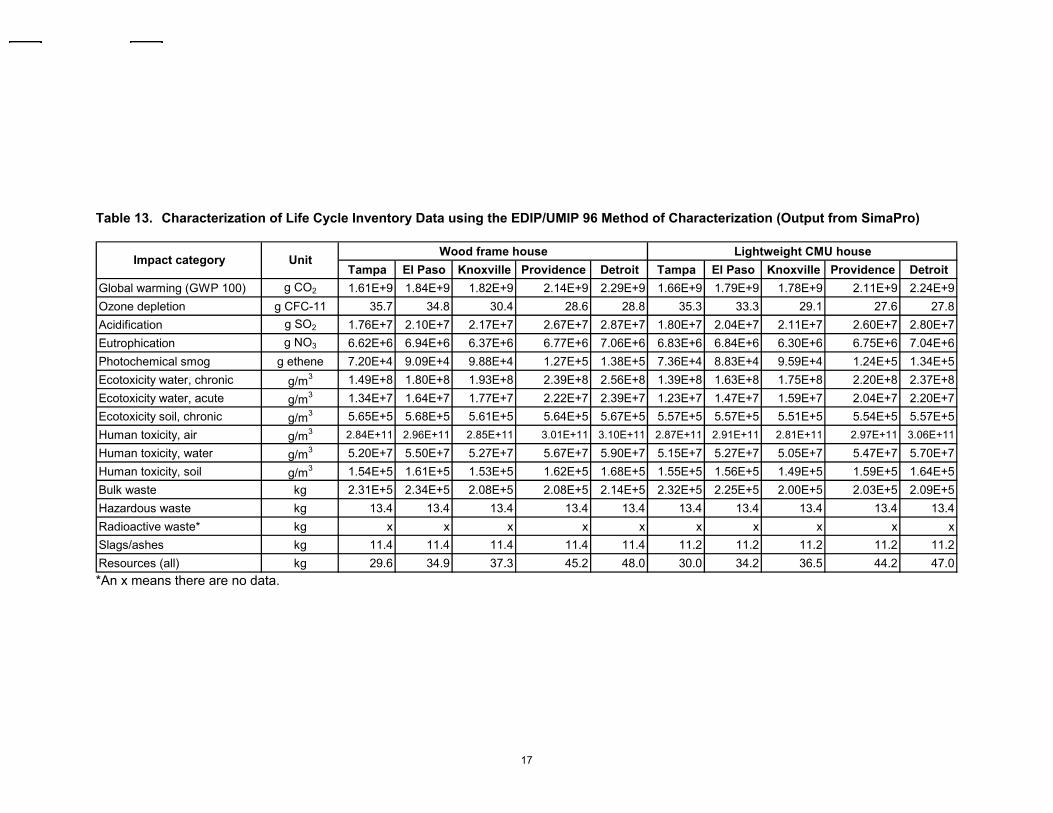
Table 13. Characterization of Life Cycle Inventory Data using the EDIP/UMIP 96 Method of Characterization (Output from SimaPro) ............................................ 17
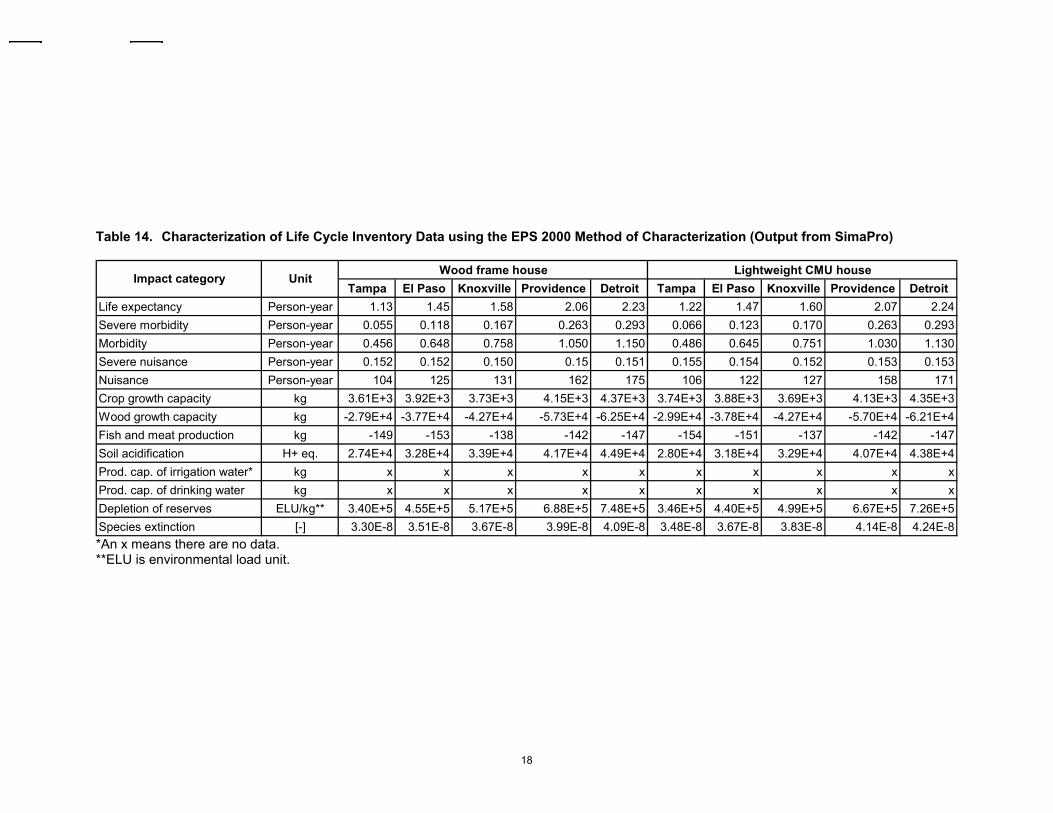
Table 14. Characterization of Life Cycle Inventory Data using the EPS 2000 Method of Characterization (Output from SimaPro) ............................................ 18
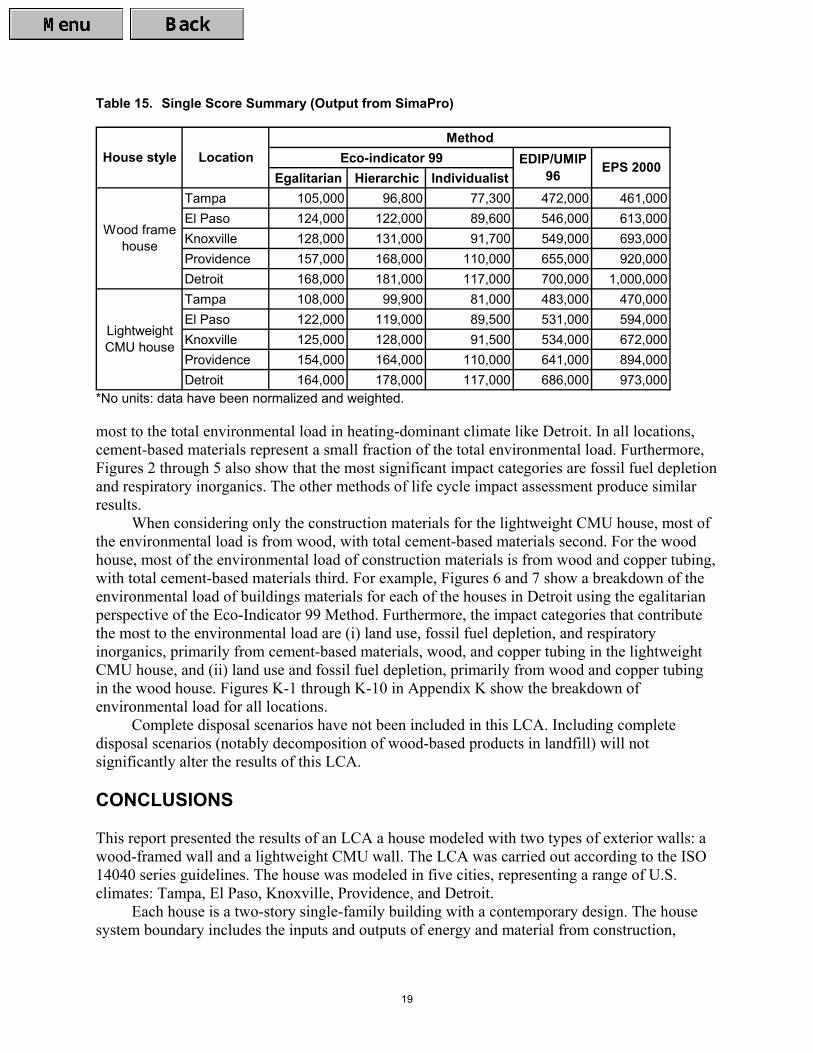
Table 15. Single Score Summary (Output from SimaPro) ................................................... 19
Table C-1. LCI Data for Wood House (SI Units) ................................................................. C-2
Table C-2. LCI Data for lightweight CMU House (SI Units) ............................................ C-23
Table D-1. LCI Data for Wood House (U.S. Customary Units)........................................... D-2
Table D-2. LCI Data for lightweight CMU House (U.S. Customary Units) ...................... D-23
Table H-1. Normalized and Weighted Life Cycle Results Assuming an Egalitarian Perspective using the Eco-Indicator 99 Method of Characterization (Output from SimaPro) ....................................................................................... H-2
Table H-2. Normalized and Weighted Life Cycle Results Assuming a Hierarchic Perspective using the Eco-Indicator 99 Method of Characterization (Output from SimaPro) ....................................................................................... H-3
v
Table H-3. Normalized and Weighted Life Cycle Results Assuming an Individualist Perspective using the Eco-Indicator 99 Method of Characterization (Output from SimaPro) ....................................................................................... H-4
Table H-4. Normalized and Weighted Life Cycle Results using the EDIP/UMIP 96 Method of Characterization (Output from SimaPro) .......................................... H-5
Table H-5. Normalized and Weighted Life Cycle Results using the EPS 2000 Method of Characterization (Output from SimaPro) .......................................... H-6
vi
LIST OF FIGURES Figure 1. System boundary for house life cycle assessment. ................................................. 2
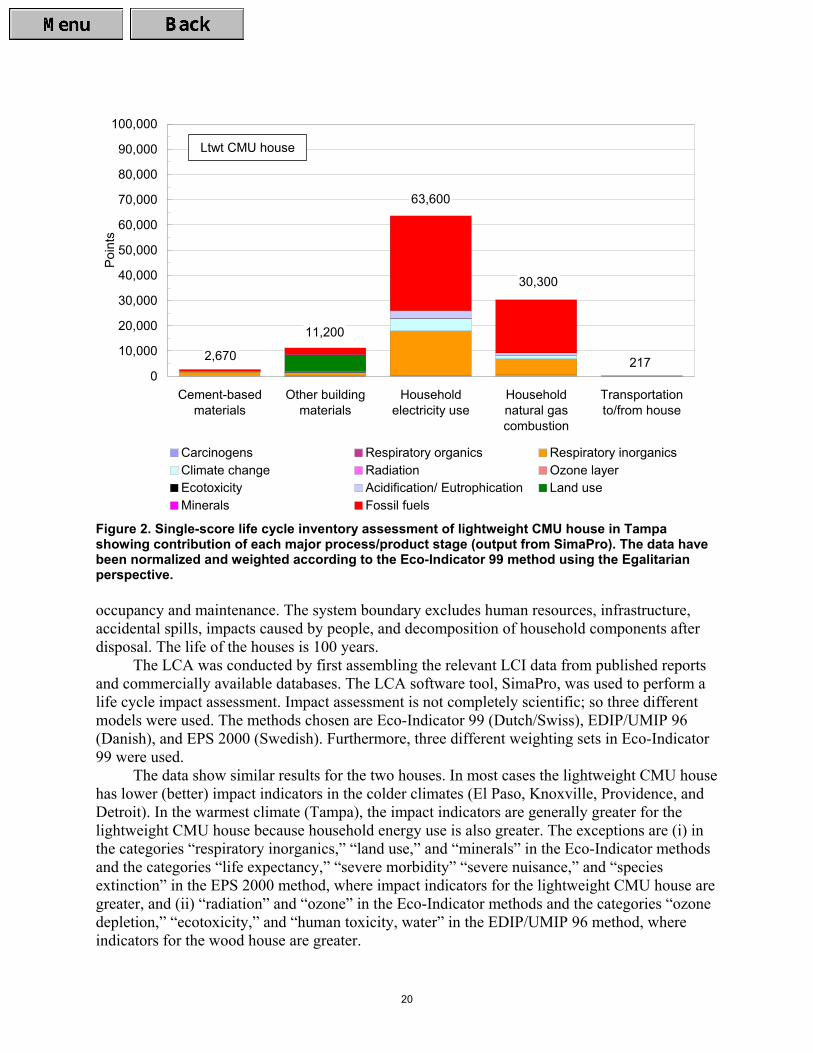
Figure 2. Single-score life cycle inventory assessment of lightweight CMU house in Tampa showing contribution of each major process/product stage (output from SimaPro). The data have been normalized and weighted according to the Eco-Indicator 99 method using the Egalitarian perspective. .......................... 20
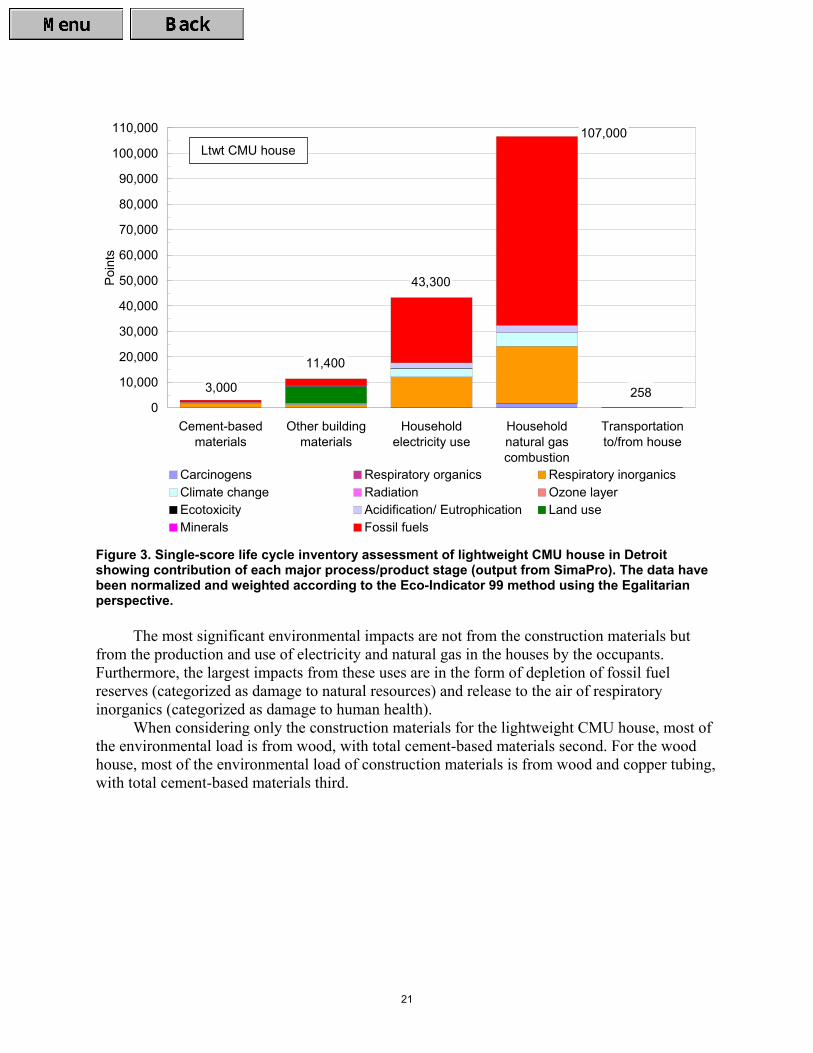
Figure 3. Single-score life cycle inventory assessment of lightweight CMU house in Detroit showing contribution of each major process/product stage (output from SimaPro). The data have been normalized and weighted according to the Eco-Indicator 99 method using the Egalitarian perspective. .......................... 21
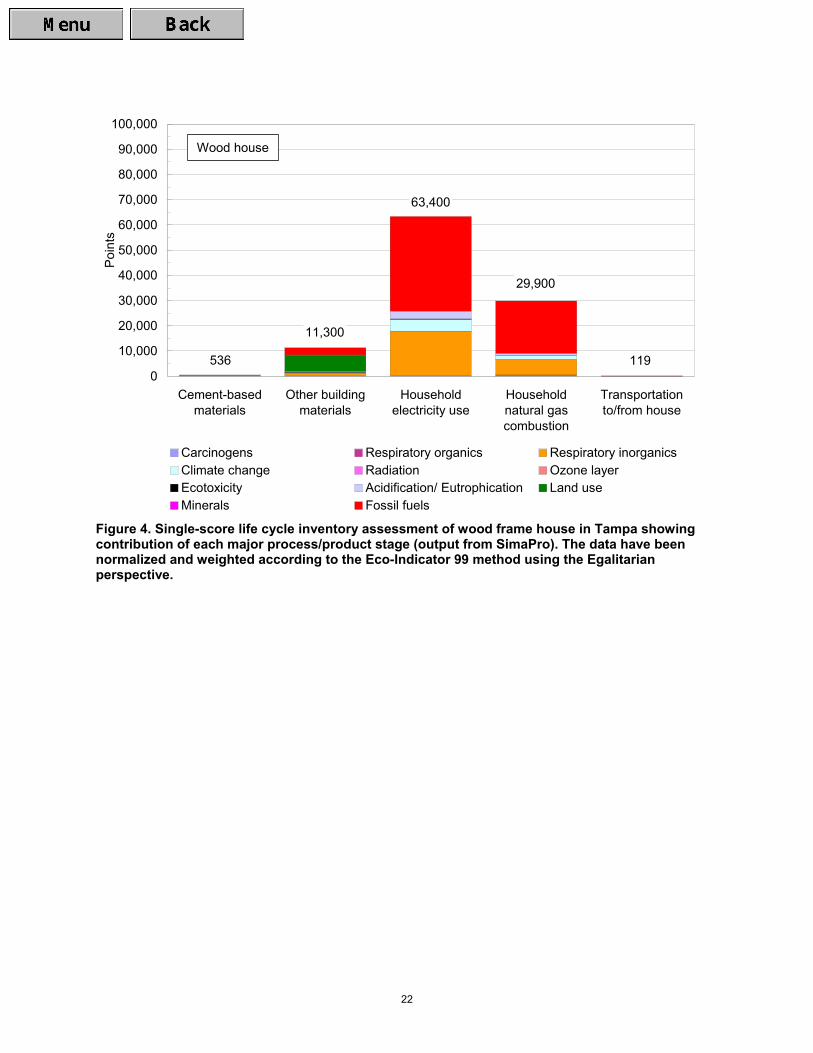
Figure 4. Single-score life cycle inventory assessment of wood frame house in Tampa showing contribution of each major process/product stage (output from SimaPro). The data have been normalized and weighted according to the Eco-Indicator 99 method using the Egalitarian perspective. ........................................................................................................... 22
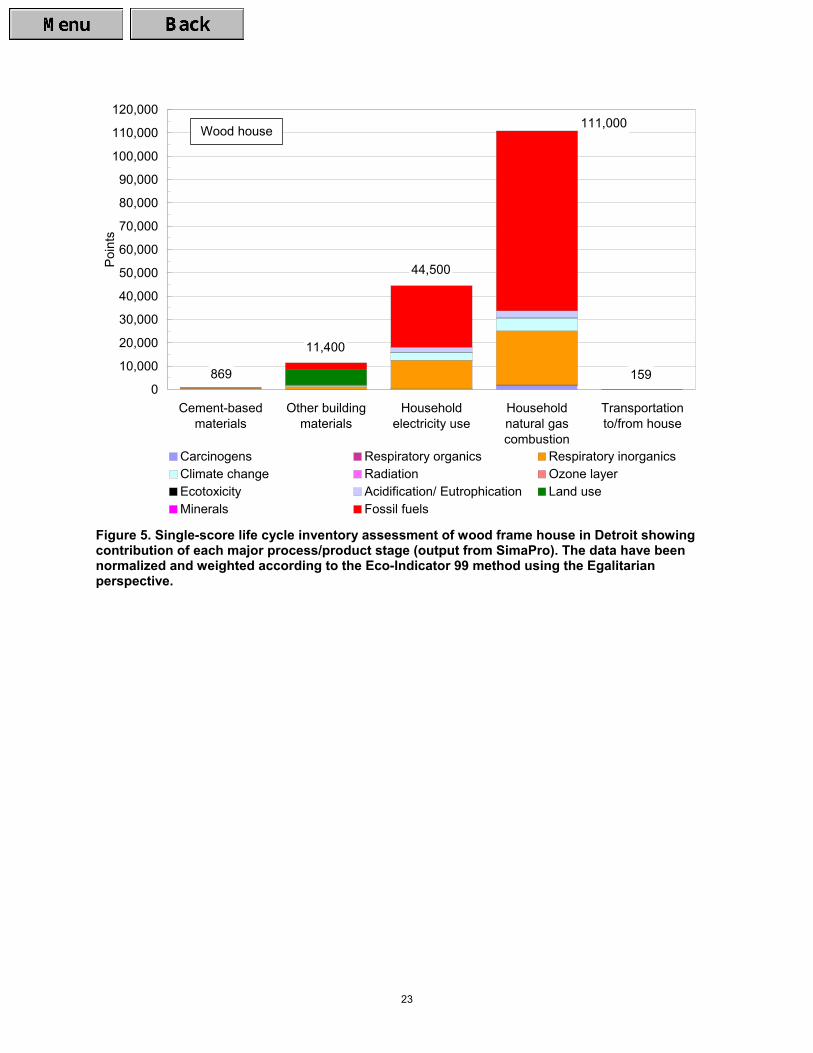
Figure 5. Single-score life cycle inventory assessment of wood frame house in Detroit showing contribution of each major process/product stage (output from SimaPro). The data have been normalized and weighted according to the Eco-Indicator 99 method using the Egalitarian perspective. ........................................................................................................... 23
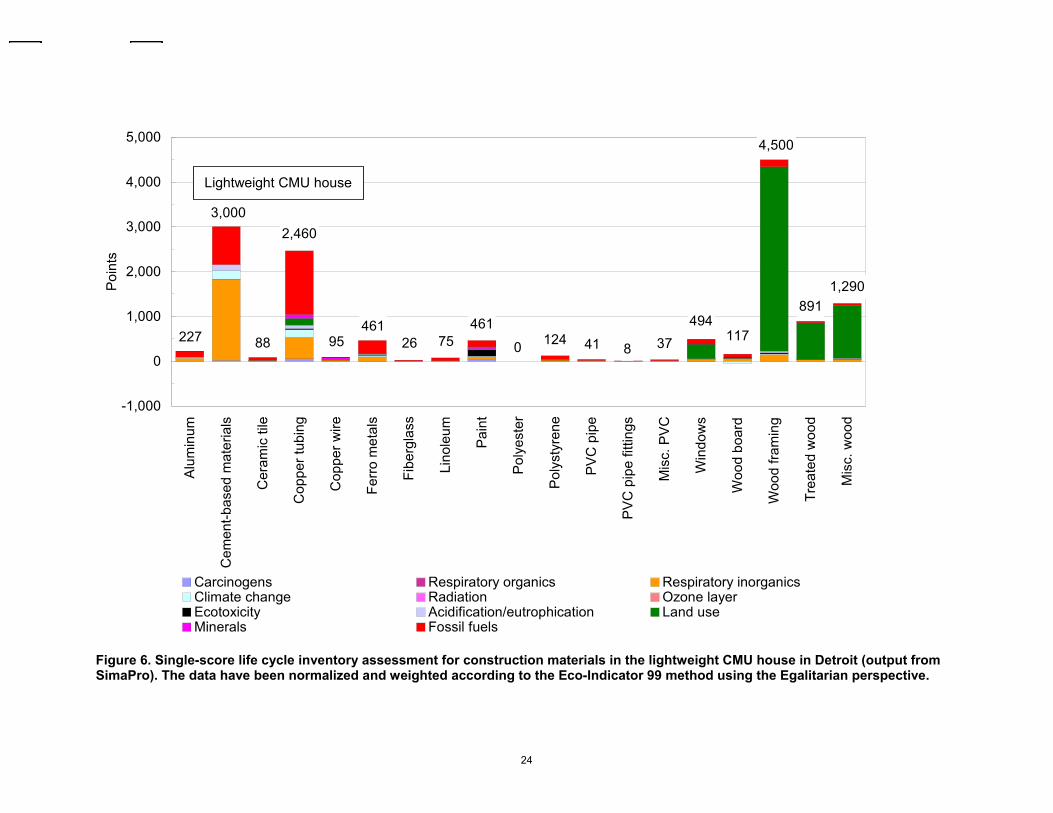
Figure 6. Single-score life cycle inventory assessment for construction materials in the lightweight CMU house in Detroit (output from SimaPro). The data have been normalized and weighted according to the Eco-Indicator 99 method using the Egalitarian perspective. ............................................................ 24
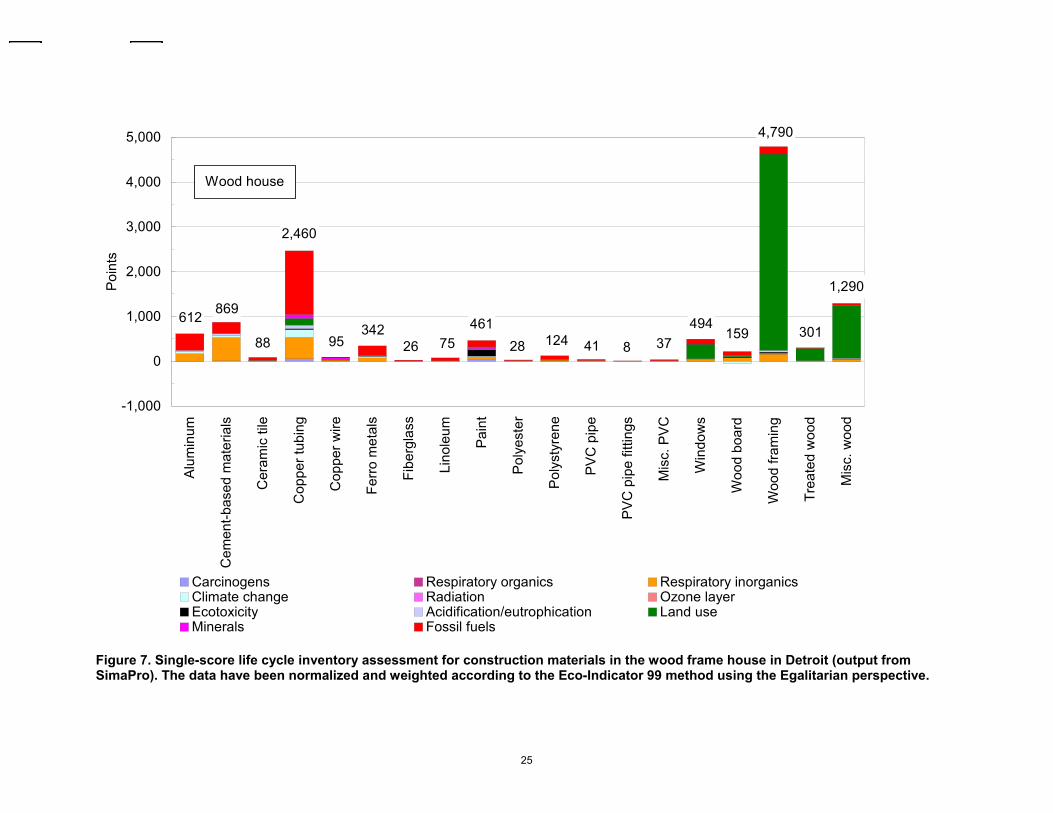
Figure 7. Single-score life cycle inventory assessment for construction materials in the wood frame house in Detroit (output from SimaPro). The data have been normalized and weighted according to the Eco-Indicator 99 method using the Egalitarian perspective. ......................................................................... 25
Figure B-1. Floor plan of the lower level............................................................................... B-2
Figure B-2. Floor plan of the upper level............................................................................... B-3
Figure B-3. Front elevation .................................................................................................... B-4
Figure B-4. Rear elevation ..................................................................................................... B-4
Figure B-5. Right elevation .................................................................................................... B-5
Figure B-6. Left elevation ...................................................................................................... B-5
Figure B-7. Wood frame wall cross-section........................................................................... B-6
Figure B-8. Lightweight CMU wall cross-section ................................................................. B-6
Figure I-1. LCA single score summary using the Eco-Indicator 99 method of impact assessment (there are no units because the data have been weighted and normalized). ..........................................................................................................I-2
vii
Figure I-2. LCA single score summary using the EDIP/UMIP 96 method of impact assessment (there are no units because the data have been weighted and normalized). ..........................................................................................................I-3
Figure I-3. LCA single score summary using the EPS 2000 method of impact assessment (there are no units because the data have been weighted and normalized). ..........................................................................................................I-4
Figure J-1. Single-score life cycle inventory assessment of lightweight CMU house in El Paso showing contribution of each major process/product stage (output from SimaPro). The data have been normalized and weighted according to the Eco-Indicator 99 method using the Egalitarian perspective. ......................... J-2
Figure J-2. Single-score life cycle inventory assessment of lightweight CMU house in Knoxville showing contribution of each major process/product stage (output from SimaPro). The data have been normalized and weighted according to the Eco-Indicator 99 method using the Egalitarian perspective. .... J-3
Figure J-3. Single-score life cycle inventory assessment of lightweight CMU house in Providence showing contribution of each major process/product stage (output from SimaPro). The data have been normalized and weighted according to the Eco-Indicator 99 method using the Egalitarian perspective. .... J-4
Figure J-4. Single-score life cycle inventory assessment of wood house in El Paso showing contribution of each major process/product stage (output from SimaPro). The data have been normalized and weighted according to the Eco-Indicator 99 method using the Egalitarian perspective. ............................... J-5
Figure J-5. Single-score life cycle inventory assessment of wood house in Knoxville showing contribution of each major process/product stage (output from SimaPro). The data have been normalized and weighted according to the Eco-Indicator 99 method using the Egalitarian perspective. ............................... J-6
Figure J-6. Single-score life cycle inventory assessment of wood house in Providence showing contribution of each major process/product stage (output from SimaPro). The data have been normalized and weighted according to the Eco-Indicator 99 method using the Egalitarian perspective. ............................... J-7
Figure K-1. Single-score life cycle inventory assessment for construction materials in the lightweight CMU house in Tampa (output from SimaPro). The data have been normalized and weighted according to the Eco-Indicator 99 method using the Egalitarian perspective. ....................................................................... K-2
Figure K-2. Single-score life cycle inventory assessment for construction materials in the lightweight CMU house in El Paso (output from SimaPro). The data have been normalized and weighted according to the Eco-Indicator 99 method using the Egalitarian perspective. .......................................................... K-3
Figure K-3. Single-score life cycle inventory assessment for construction materials in the lightweight CMU house in Knoxville (output from SimaPro). The data have been normalized and weighted according to the Eco-Indicator 99 method using the Egalitarian perspective. .......................................................... K-4
viii
Figure K-4. Single-score life cycle inventory assessment for construction materials in the lightweight CMU house in Providence (output from SimaPro). The data have been normalized and weighted according to the Eco-Indicator 99 method using the Egalitarian perspective. .......................................................... K-5
Figure K-5. Single-score life cycle inventory assessment for construction materials in the wood frame house in Tampa (output from SimaPro). The data have been normalized and weighted according to the Eco-Indicator 99 method using the Egalitarian perspective. ....................................................................... K-6
Figure K-6. Single-score life cycle inventory assessment for construction materials in the wood frame house in El Paso (output from SimaPro). The data have been normalized and weighted according to the Eco-Indicator 99 method using the Egalitarian perspective. ....................................................................... K-7
Figure K-7. Single-score life cycle inventory assessment for construction materials in the wood frame house in Knoxville (output from SimaPro). The data have been normalized and weighted according to the Eco-Indicator 99 method using the Egalitarian perspective. ....................................................................... K-8
Figure K-8. Single-score life cycle inventory assessment for construction materials in the wood frame house in Providence (output from SimaPro). The data have been normalized and weighted according to the Eco-Indicator 99 method using the Egalitarian perspective. ....................................................................... K-9
1
LIFE CYCLE ASSESSMENT OF A LIGHTWEIGHT CONCRETE MASONRY
HOUSE COMPARED TO A WOOD FRAME HOUSE
by Medgar L. Marceau and Martha G. VanGeem*
INTRODUCTION The Portland Cement Association (PCA) has developed environmental life cycle inventory data to evaluate the environmental aspects of various concrete products. The objective has been to promote the environmental benefits of building with concrete. The life cycle inventory of three concrete houses has been published by PCA and others.[1, 2, 3, 4] Each house has the same layout but they are modeled with different concrete exterior wall systems: insulating concrete forms, concrete masonry units, and lightweight concrete masonry units. These reports constituted the first phase of a life cycle assessment (LCA). Each report presented a comparison between a concrete house and a similar wood-framed house. The reports described the life cycle inventory of the cement-based materials (concrete, concrete masonry units, mortar, grout, and stucco) and the household occupant energy-use that make up the life cycle of a house. This report is one of three reports that present the results of an assessment of the environmental attributes of concrete construction compared to wood-framed construction. Life Cycle Assessment Performing an LCA is one way to assess the impacts a product has on the natural environment. The International Organization for Standardization (ISO) has developed international standards that describe how to conduct an LCA (ISO 14040 series). An LCA is a study of the environmental aspects and potential impacts throughout a product’s life—from raw material acquisition through production, use and disposal.[5] The ISO standards describe three phases of an LCA. The first phase is an inventory of the inputs and outputs of a product system. The second phase is the assessment of the potential environmental impacts associated with those inputs and outputs. The third phase is the interpretation of the result of the inventory analysis and impact assessment phases in relation to the objectives of the study.[5] These three phases are commonly referred to as (i) life cycle inventory analysis, (ii) life cycle impact assessment, and (iii) life cycle interpretation. In this report, “LCA” will refer to all three phases. The LCA in this report adheres to the requirements in the ISO 14040 series. However, there are some technical limitations to LCAs: according to ISO 14041,
The models used for inventory analysis and to assess environmental impacts are limited by their assumptions, and may not be available for all potential impacts or
*Project Assistant and Principal Engineer, Construction Technology Laboratories, Inc., 5420 Old Orchard Road, Skokie, IL, 60077 USA (847) 965-7500, www.ctlgroup.com.
2
applications. Results of LCA studies focused on global or regional issues may not be appropriate for local applications, i.e. local conditions might not be adequately represented by regional or global conditions. The accuracy of LCA studies may be limited by accessibility or availability of relevant data, or by data quality, e.g. gaps, types of data, aggregation, average, site-specific. The lack of spatial and temporal dimensions in the inventory data used for impact assessment introduces uncertainly in impact results. This uncertainty varies with the spatial and temporal characteristics of each impact category.[5]
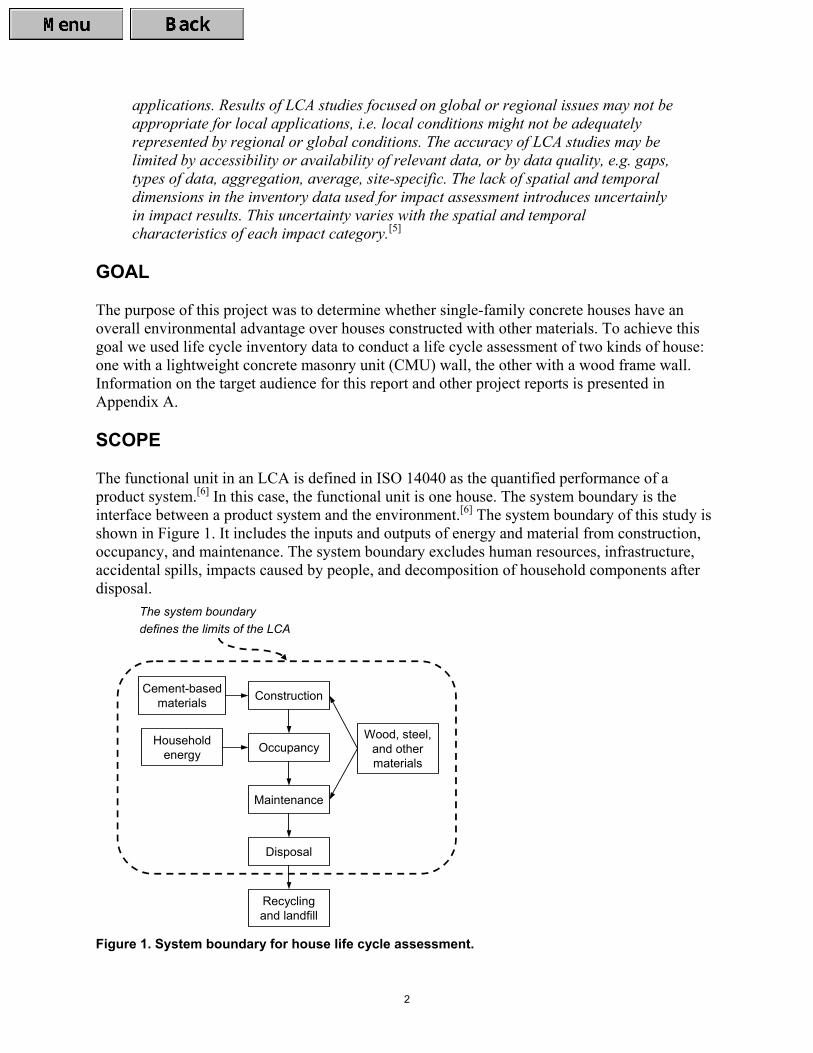
GOAL The purpose of this project was to determine whether single-family concrete houses have an overall environmental advantage over houses constructed with other materials. To achieve this goal we used life cycle inventory data to conduct a life cycle assessment of two kinds of house: one with a lightweight concrete masonry unit (CMU) wall, the other with a wood frame wall. Information on the target audience for this report and other project reports is presented in Appendix A. SCOPE The functional unit in an LCA is defined in ISO 14040 as the quantified performance of a product system.[6] In this case, the functional unit is one house. The system boundary is the interface between a product system and the environment.[6] The system boundary of this study is shown in Figure 1. It includes the inputs and outputs of energy and material from construction, occupancy, and maintenance. The system boundary excludes human resources, infrastructure, accidental spills, impacts caused by people, and decomposition of household components after disposal.
The system boundarydefines the limits of the LCA
ConstructionCement-basedmaterials
Occupancy
Maintenance
Disposal
Recyclingand landfill
Householdenergy
Wood, steel,and othermaterials
Figure 1. System boundary for house life cycle assessment.
3
The same layout is assumed for both the wood frame and the lightweight CMU houses. The houses are designed to meet the requirements of the 1998 International Energy Conservation Code (IECC)[7] because it is the most widely used energy code in the United States. The long-term energy consumption of a building depends on local climate, so the houses are modeled in a variety of regions. Five cities were chosen that represent the range of climates in the United States: Tampa, Florida; El Paso, Texas; Knoxville, Tennessee; Providence, Rhode Island; and Detroit, Michigan.[8] House energy consumption is modeled using Visual DOE 2.6 energy simulation software.[9]
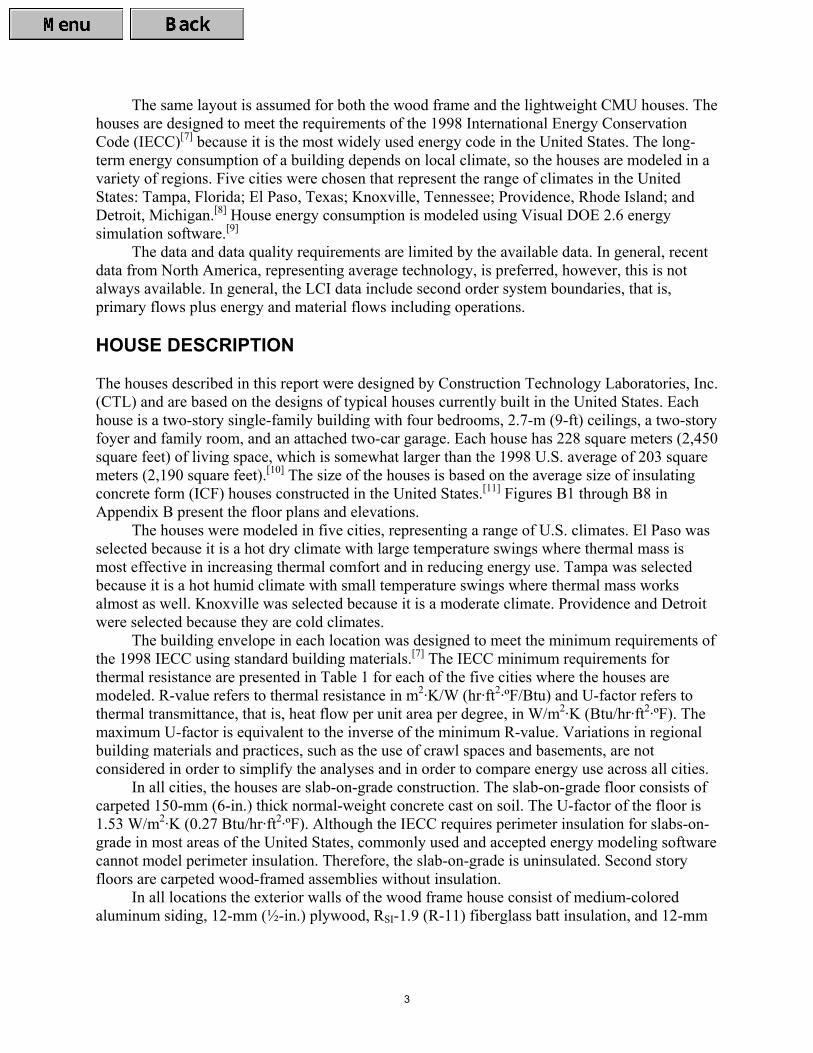
The data and data quality requirements are limited by the available data. In general, recent data from North America, representing average technology, is preferred, however, this is not always available. In general, the LCI data include second order system boundaries, that is, primary flows plus energy and material flows including operations. HOUSE DESCRIPTION The houses described in this report were designed by Construction Technology Laboratories, Inc. (CTL) and are based on the designs of typical houses currently built in the United States. Each house is a two-story single-family building with four bedrooms, 2.7-m (9-ft) ceilings, a two-story foyer and family room, and an attached two-car garage. Each house has 228 square meters (2,450 square feet) of living space, which is somewhat larger than the 1998 U.S. average of 203 square meters (2,190 square feet).[10] The size of the houses is based on the average size of insulating concrete form (ICF) houses constructed in the United States.[11] Figures B1 through B8 in Appendix B present the floor plans and elevations.
The houses were modeled in five cities, representing a range of U.S. climates. El Paso was selected because it is a hot dry climate with large temperature swings where thermal mass is most effective in increasing thermal comfort and in reducing energy use. Tampa was selected because it is a hot humid climate with small temperature swings where thermal mass works almost as well. Knoxville was selected because it is a moderate climate. Providence and Detroit were selected because they are cold climates.
The building envelope in each location was designed to meet the minimum requirements of the 1998 IECC using standard building materials.[7] The IECC minimum requirements for thermal resistance are presented in Table 1 for each of the five cities where the houses are modeled. R-value refers to thermal resistance in m2·K/W (hr·ft2·ºF/Btu) and U-factor refers to thermal transmittance, that is, heat flow per unit area per degree, in W/m2·K (Btu/hr·ft2·ºF). The maximum U-factor is equivalent to the inverse of the minimum R-value. Variations in regional building materials and practices, such as the use of crawl spaces and basements, are not considered in order to simplify the analyses and in order to compare energy use across all cities.
In all cities, the houses are slab-on-grade construction. The slab-on-grade floor consists of carpeted 150-mm (6-in.) thick normal-weight concrete cast on soil. The U-factor of the floor is 1.53 W/m2·K (0.27 Btu/hr·ft2·ºF). Although the IECC requires perimeter insulation for slabs-on-grade in most areas of the United States, commonly used and accepted energy modeling software cannot model perimeter insulation. Therefore, the slab-on-grade is uninsulated. Second story floors are carpeted wood-framed assemblies without insulation.
In all locations the exterior walls of the wood frame house consist of medium-colored aluminum siding, 12-mm (½-in.) plywood, RSI-1.9 (R-11) fiberglass batt insulation, and 12-mm
4
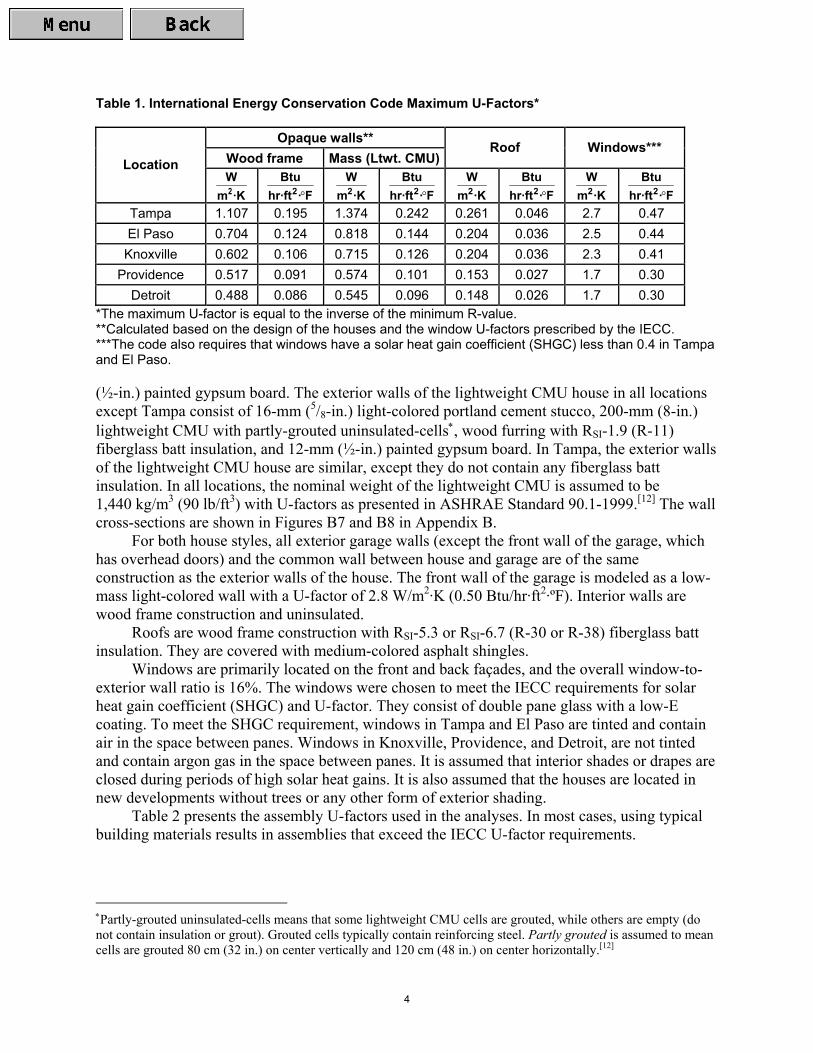
Table 1. International Energy Conservation Code Maximum U-Factors*
Opaque walls** Wood frame Mass (Ltwt. CMU)
Roof Windows*** Location
·KmW2 F·hr·ft
Btu2 ° ·Km
W2 F·hr·ft
Btu2 ° ·Km
W2 F·hr·ft
Btu2 ° ·Km
W2 F·hr·ft
Btu2 °
Tampa 1.107 0.195 1.374 0.242 0.261 0.046 2.7 0.47 El Paso 0.704 0.124 0.818 0.144 0.204 0.036 2.5 0.44 Knoxville 0.602 0.106 0.715 0.126 0.204 0.036 2.3 0.41
Providence 0.517 0.091 0.574 0.101 0.153 0.027 1.7 0.30 Detroit 0.488 0.086 0.545 0.096 0.148 0.026 1.7 0.30
*The maximum U-factor is equal to the inverse of the minimum R-value. **Calculated based on the design of the houses and the window U-factors prescribed by the IECC. ***The code also requires that windows have a solar heat gain coefficient (SHGC) less than 0.4 in Tampa and El Paso.
(½-in.) painted gypsum board. The exterior walls of the lightweight CMU house in all locations except Tampa consist of 16-mm (5/8-in.) light-colored portland cement stucco, 200-mm (8-in.) lightweight CMU with partly-grouted uninsulated-cells∗, wood furring with RSI-1.9 (R-11) fiberglass batt insulation, and 12-mm (½-in.) painted gypsum board. In Tampa, the exterior walls of the lightweight CMU house are similar, except they do not contain any fiberglass batt insulation. In all locations, the nominal weight of the lightweight CMU is assumed to be 1,440 kg/m3 (90 lb/ft3) with U-factors as presented in ASHRAE Standard 90.1-1999.[12] The wall cross-sections are shown in Figures B7 and B8 in Appendix B.
For both house styles, all exterior garage walls (except the front wall of the garage, which has overhead doors) and the common wall between house and garage are of the same construction as the exterior walls of the house. The front wall of the garage is modeled as a low-mass light-colored wall with a U-factor of 2.8 W/m2·K (0.50 Btu/hr·ft2·ºF). Interior walls are wood frame construction and uninsulated.
Roofs are wood frame construction with RSI-5.3 or RSI-6.7 (R-30 or R-38) fiberglass batt insulation. They are covered with medium-colored asphalt shingles.
Windows are primarily located on the front and back façades, and the overall window-to-exterior wall ratio is 16%. The windows were chosen to meet the IECC requirements for solar heat gain coefficient (SHGC) and U-factor. They consist of double pane glass with a low-E coating. To meet the SHGC requirement, windows in Tampa and El Paso are tinted and contain air in the space between panes. Windows in Knoxville, Providence, and Detroit, are not tinted and contain argon gas in the space between panes. It is assumed that interior shades or drapes are closed during periods of high solar heat gains. It is also assumed that the houses are located in new developments without trees or any other form of exterior shading.
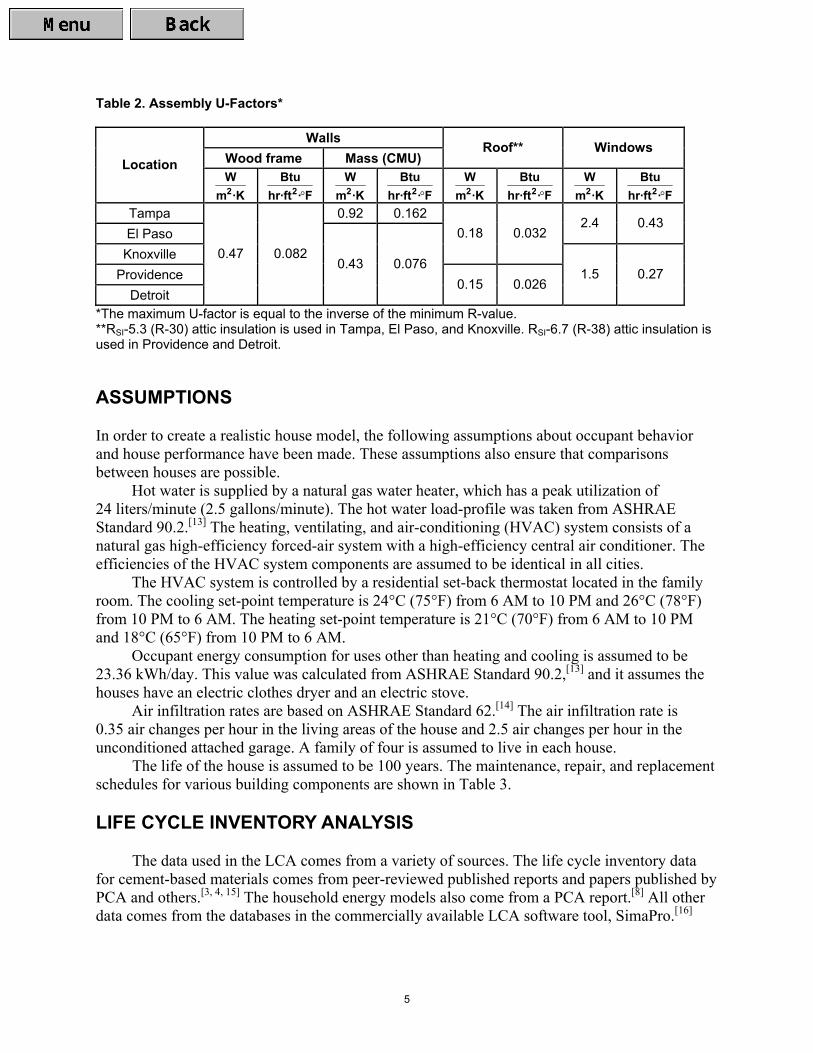
Table 2 presents the assembly U-factors used in the analyses. In most cases, using typical building materials results in assemblies that exceed the IECC U-factor requirements.
∗Partly-grouted uninsulated-cells means that some lightweight CMU cells are grouted, while others are empty (do not contain insulation or grout). Grouted cells typically contain reinforcing steel. Partly grouted is assumed to mean cells are grouted 80 cm (32 in.) on center vertically and 120 cm (48 in.) on center horizontally.[12]
5
Table 2. Assembly U-Factors*
Walls Wood frame Mass (CMU)
Roof** Windows Location
·KmW2
F·hr·ft
Btu2 °
·Km
W2
F·hr·ft
Btu2 ° ·Km
W2
F·hr·ft
Btu2 ° ·Km
W2
F·hr·ft
Btu2 °
Tampa 0.92 0.162 El Paso
2.4 0.43
Knoxville 0.18 0.032
Providence Detroit
0.47 0.082 0.43 0.076
0.15 0.026 1.5 0.27
*The maximum U-factor is equal to the inverse of the minimum R-value. **RSI-5.3 (R-30) attic insulation is used in Tampa, El Paso, and Knoxville. RSI-6.7 (R-38) attic insulation is used in Providence and Detroit.
ASSUMPTIONS In order to create a realistic house model, the following assumptions about occupant behavior and house performance have been made. These assumptions also ensure that comparisons between houses are possible.
Hot water is supplied by a natural gas water heater, which has a peak utilization of 24 liters/minute (2.5 gallons/minute). The hot water load-profile was taken from ASHRAE Standard 90.2.[13] The heating, ventilating, and air-conditioning (HVAC) system consists of a natural gas high-efficiency forced-air system with a high-efficiency central air conditioner. The efficiencies of the HVAC system components are assumed to be identical in all cities.
The HVAC system is controlled by a residential set-back thermostat located in the family room. The cooling set-point temperature is 24°C (75°F) from 6 AM to 10 PM and 26°C (78°F) from 10 PM to 6 AM. The heating set-point temperature is 21°C (70°F) from 6 AM to 10 PM and 18°C (65°F) from 10 PM to 6 AM.
Occupant energy consumption for uses other than heating and cooling is assumed to be 23.36 kWh/day. This value was calculated from ASHRAE Standard 90.2,[13] and it assumes the houses have an electric clothes dryer and an electric stove.
Air infiltration rates are based on ASHRAE Standard 62.[14] The air infiltration rate is 0.35 air changes per hour in the living areas of the house and 2.5 air changes per hour in the unconditioned attached garage. A family of four is assumed to live in each house.
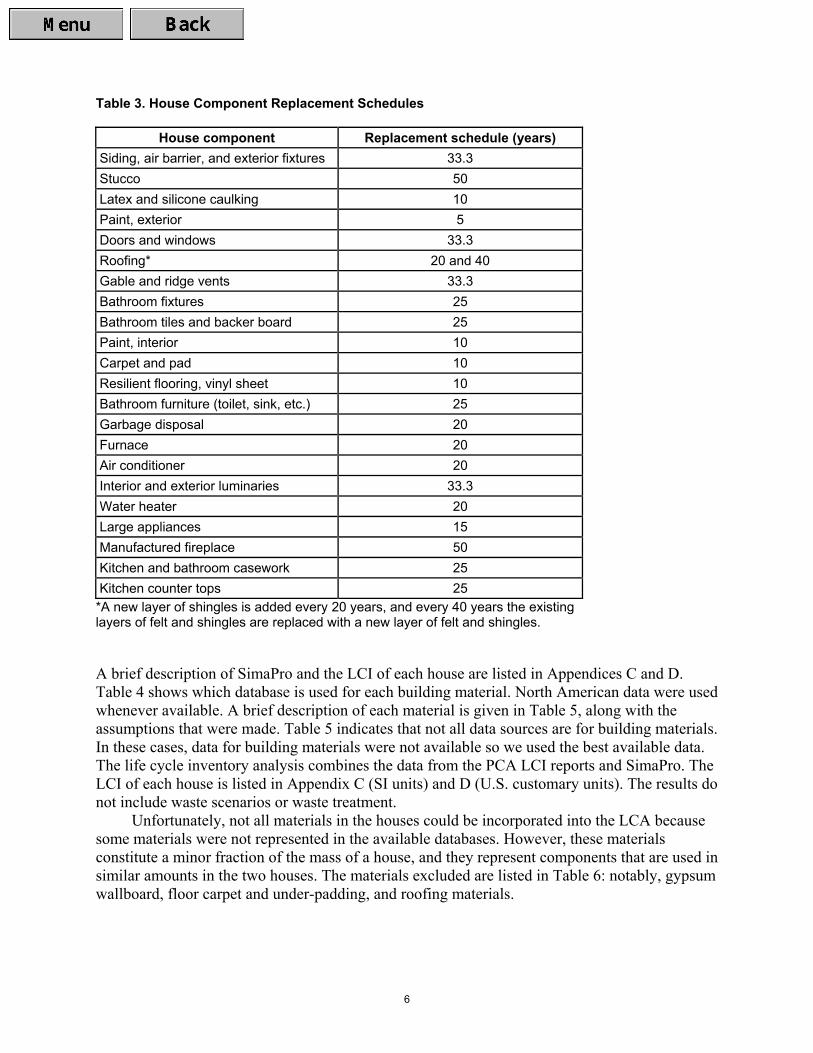
The life of the house is assumed to be 100 years. The maintenance, repair, and replacement schedules for various building components are shown in Table 3.
LIFE CYCLE INVENTORY ANALYSIS
The data used in the LCA comes from a variety of sources. The life cycle inventory data for cement-based materials comes from peer-reviewed published reports and papers published by PCA and others.[3, 4, 15] The household energy models also come from a PCA report.[8] All other data comes from the databases in the commercially available LCA software tool, SimaPro.[16]
6
Table 3. House Component Replacement Schedules
House component Replacement schedule (years) Siding, air barrier, and exterior fixtures 33.3 Stucco 50 Latex and silicone caulking 10 Paint, exterior 5 Doors and windows 33.3 Roofing* 20 and 40 Gable and ridge vents 33.3 Bathroom fixtures 25 Bathroom tiles and backer board 25 Paint, interior 10 Carpet and pad 10 Resilient flooring, vinyl sheet 10 Bathroom furniture (toilet, sink, etc.) 25 Garbage disposal 20 Furnace 20 Air conditioner 20 Interior and exterior luminaries 33.3 Water heater 20 Large appliances 15 Manufactured fireplace 50 Kitchen and bathroom casework 25 Kitchen counter tops 25
*A new layer of shingles is added every 20 years, and every 40 years the existing layers of felt and shingles are replaced with a new layer of felt and shingles.
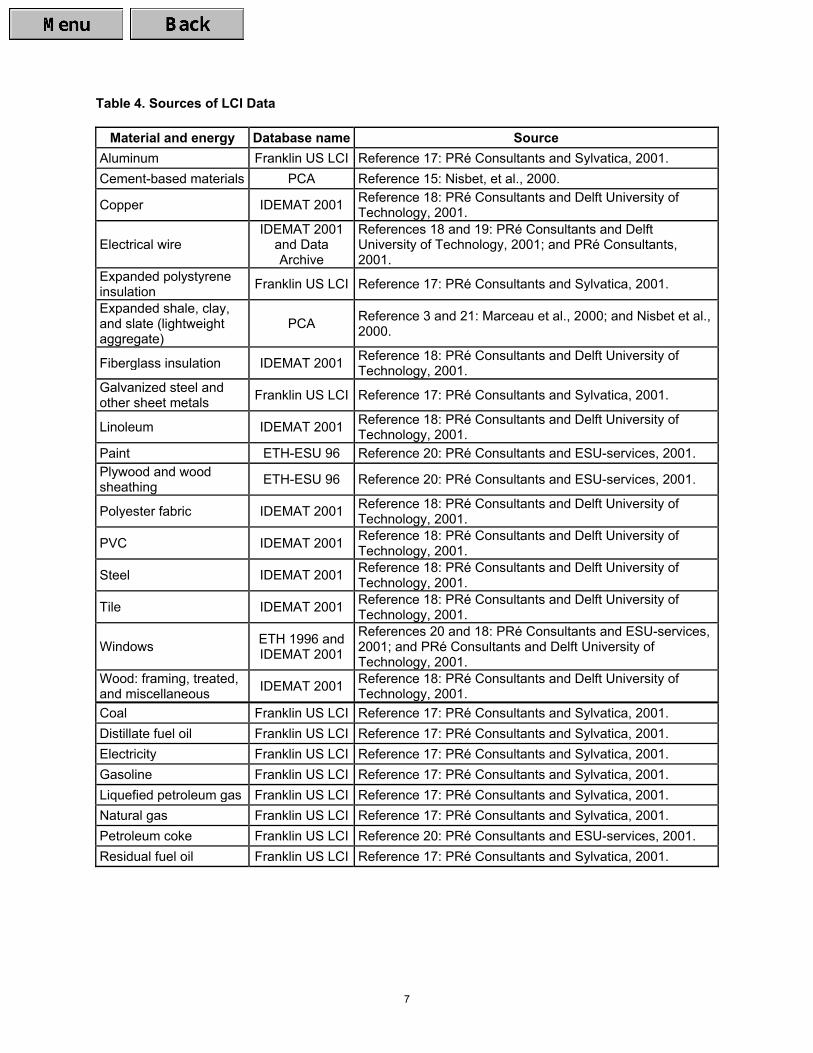
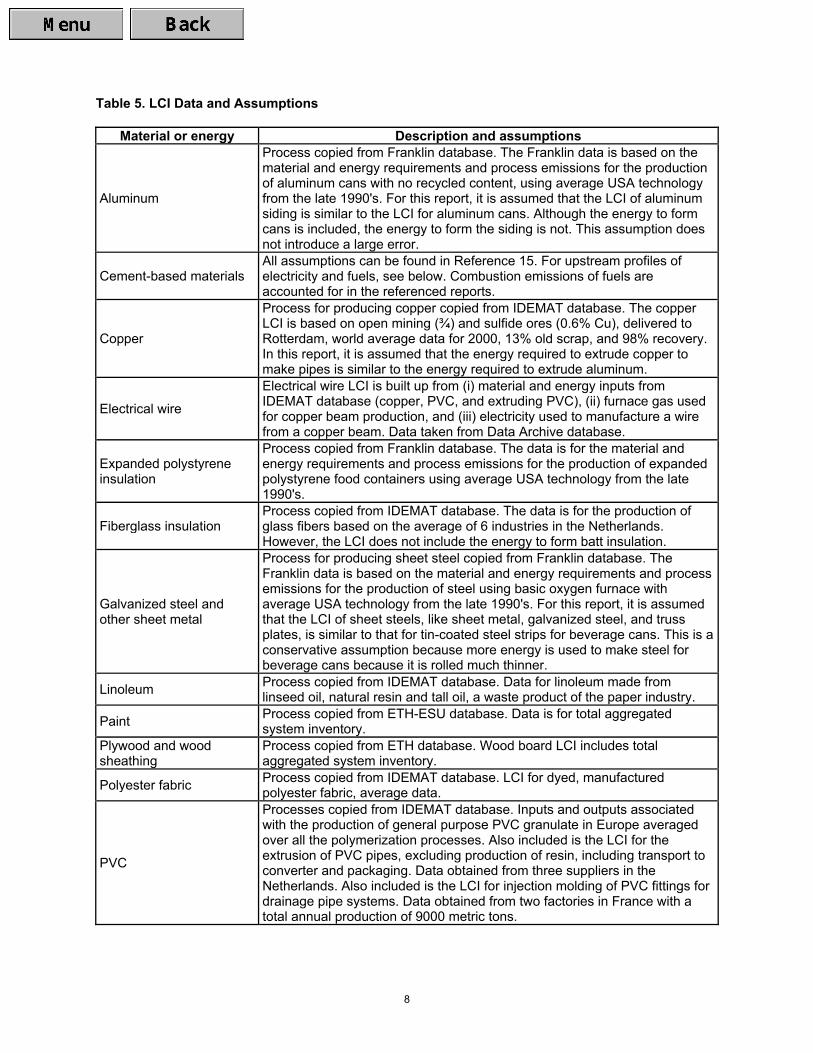
A brief description of SimaPro and the LCI of each house are listed in Appendices C and D. Table 4 shows which database is used for each building material. North American data were used whenever available. A brief description of each material is given in Table 5, along with the assumptions that were made. Table 5 indicates that not all data sources are for building materials. In these cases, data for building materials were not available so we used the best available data. The life cycle inventory analysis combines the data from the PCA LCI reports and SimaPro. The LCI of each house is listed in Appendix C (SI units) and D (U.S. customary units). The results do not include waste scenarios or waste treatment.
Unfortunately, not all materials in the houses could be incorporated into the LCA because some materials were not represented in the available databases. However, these materials constitute a minor fraction of the mass of a house, and they represent components that are used in similar amounts in the two houses. The materials excluded are listed in Table 6: notably, gypsum wallboard, floor carpet and under-padding, and roofing materials.
7
Table 4. Sources of LCI Data
Material and energy Database name Source Aluminum Franklin US LCI Reference 17: PRé Consultants and Sylvatica, 2001. Cement-based materials PCA Reference 15: Nisbet, et al., 2000.
Copper IDEMAT 2001 Reference 18: PRé Consultants and Delft University of Technology, 2001.
Electrical wire IDEMAT 2001
and Data Archive
References 18 and 19: PRé Consultants and Delft University of Technology, 2001; and PRé Consultants, 2001.
Expanded polystyrene insulation Franklin US LCI Reference 17: PRé Consultants and Sylvatica, 2001.
Expanded shale, clay, and slate (lightweight aggregate)
PCA Reference 3 and 21: Marceau et al., 2000; and Nisbet et al., 2000.
Fiberglass insulation IDEMAT 2001 Reference 18: PRé Consultants and Delft University of Technology, 2001.
Galvanized steel and other sheet metals Franklin US LCI Reference 17: PRé Consultants and Sylvatica, 2001.
Linoleum IDEMAT 2001 Reference 18: PRé Consultants and Delft University of Technology, 2001.
Paint ETH-ESU 96 Reference 20: PRé Consultants and ESU-services, 2001. Plywood and wood sheathing ETH-ESU 96 Reference 20: PRé Consultants and ESU-services, 2001.
Polyester fabric IDEMAT 2001 Reference 18: PRé Consultants and Delft University of Technology, 2001.
PVC IDEMAT 2001 Reference 18: PRé Consultants and Delft University of Technology, 2001.
Steel IDEMAT 2001 Reference 18: PRé Consultants and Delft University of Technology, 2001.
Tile IDEMAT 2001 Reference 18: PRé Consultants and Delft University of Technology, 2001.
Windows ETH 1996 and IDEMAT 2001
References 20 and 18: PRé Consultants and ESU-services, 2001; and PRé Consultants and Delft University of Technology, 2001.
Wood: framing, treated, and miscellaneous IDEMAT 2001 Reference 18: PRé Consultants and Delft University of
Technology, 2001. Coal Franklin US LCI Reference 17: PRé Consultants and Sylvatica, 2001. Distillate fuel oil Franklin US LCI Reference 17: PRé Consultants and Sylvatica, 2001. Electricity Franklin US LCI Reference 17: PRé Consultants and Sylvatica, 2001. Gasoline Franklin US LCI Reference 17: PRé Consultants and Sylvatica, 2001. Liquefied petroleum gas Franklin US LCI Reference 17: PRé Consultants and Sylvatica, 2001. Natural gas Franklin US LCI Reference 17: PRé Consultants and Sylvatica, 2001. Petroleum coke Franklin US LCI Reference 20: PRé Consultants and ESU-services, 2001. Residual fuel oil Franklin US LCI Reference 17: PRé Consultants and Sylvatica, 2001.
8
Table 5. LCI Data and Assumptions
Material or energy Description and assumptions
Aluminum
Process copied from Franklin database. The Franklin data is based on the material and energy requirements and process emissions for the production of aluminum cans with no recycled content, using average USA technology from the late 1990's. For this report, it is assumed that the LCI of aluminum siding is similar to the LCI for aluminum cans. Although the energy to form cans is included, the energy to form the siding is not. This assumption does not introduce a large error.
Cement-based materials All assumptions can be found in Reference 15. For upstream profiles of electricity and fuels, see below. Combustion emissions of fuels are accounted for in the referenced reports.
Copper
Process for producing copper copied from IDEMAT database. The copper LCI is based on open mining (¾) and sulfide ores (0.6% Cu), delivered to Rotterdam, world average data for 2000, 13% old scrap, and 98% recovery. In this report, it is assumed that the energy required to extrude copper to make pipes is similar to the energy required to extrude aluminum.
Electrical wire
Electrical wire LCI is built up from (i) material and energy inputs from IDEMAT database (copper, PVC, and extruding PVC), (ii) furnace gas used for copper beam production, and (iii) electricity used to manufacture a wire from a copper beam. Data taken from Data Archive database.
Expanded polystyrene insulation
Process copied from Franklin database. The data is for the material and energy requirements and process emissions for the production of expanded polystyrene food containers using average USA technology from the late 1990's.
Fiberglass insulation Process copied from IDEMAT database. The data is for the production of glass fibers based on the average of 6 industries in the Netherlands. However, the LCI does not include the energy to form batt insulation.
Galvanized steel and other sheet metal
Process for producing sheet steel copied from Franklin database. The Franklin data is based on the material and energy requirements and process emissions for the production of steel using basic oxygen furnace with average USA technology from the late 1990's. For this report, it is assumed that the LCI of sheet steels, like sheet metal, galvanized steel, and truss plates, is similar to that for tin-coated steel strips for beverage cans. This is a conservative assumption because more energy is used to make steel for beverage cans because it is rolled much thinner.
Linoleum Process copied from IDEMAT database. Data for linoleum made from linseed oil, natural resin and tall oil, a waste product of the paper industry.
Paint Process copied from ETH-ESU database. Data is for total aggregated system inventory.
Plywood and wood sheathing
Process copied from ETH database. Wood board LCI includes total aggregated system inventory.
Polyester fabric Process copied from IDEMAT database. LCI for dyed, manufactured polyester fabric, average data.
PVC
Processes copied from IDEMAT database. Inputs and outputs associated with the production of general purpose PVC granulate in Europe averaged over all the polymerization processes. Also included is the LCI for the extrusion of PVC pipes, excluding production of resin, including transport to converter and packaging. Data obtained from three suppliers in the Netherlands. Also included is the LCI for injection molding of PVC fittings for drainage pipe systems. Data obtained from two factories in France with a total annual production of 9000 metric tons.
9
Table 5. LCI Data and Assumptions (continued)
Material or energy Description and assumptions
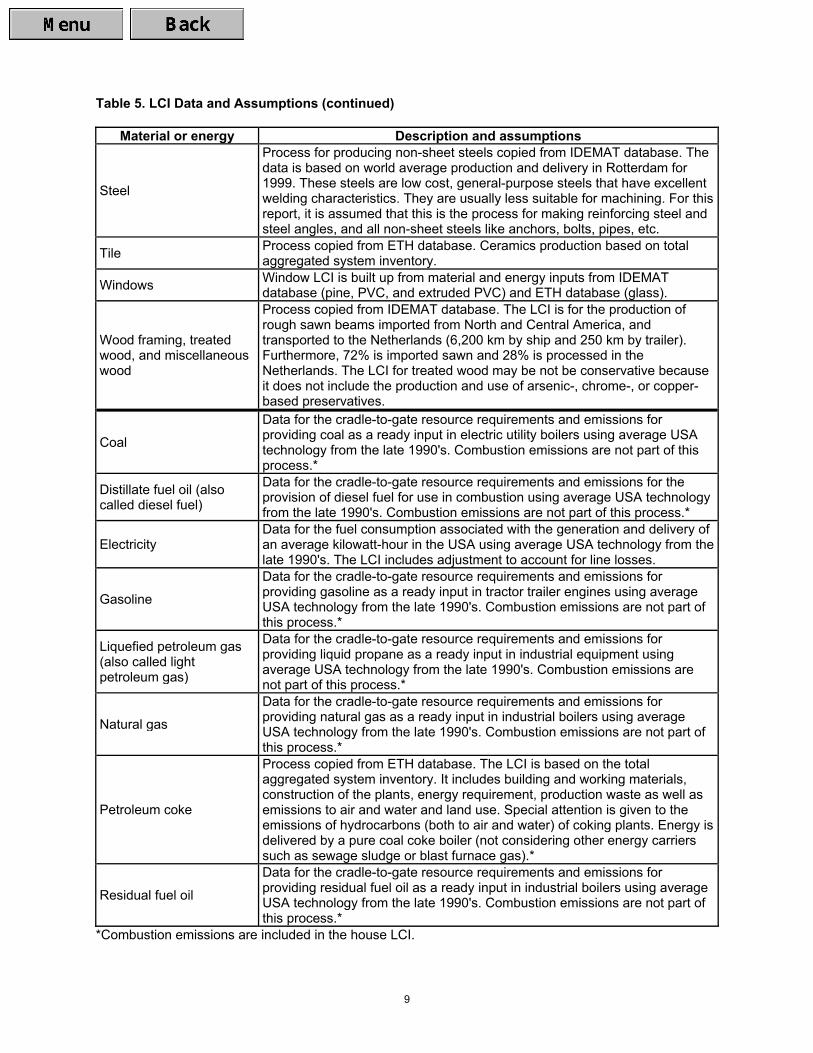
Steel
Process for producing non-sheet steels copied from IDEMAT database. The data is based on world average production and delivery in Rotterdam for 1999. These steels are low cost, general-purpose steels that have excellent welding characteristics. They are usually less suitable for machining. For this report, it is assumed that this is the process for making reinforcing steel and steel angles, and all non-sheet steels like anchors, bolts, pipes, etc.
Tile Process copied from ETH database. Ceramics production based on total aggregated system inventory.
Windows Window LCI is built up from material and energy inputs from IDEMAT database (pine, PVC, and extruded PVC) and ETH database (glass).
Wood framing, treated wood, and miscellaneous wood
Process copied from IDEMAT database. The LCI is for the production of rough sawn beams imported from North and Central America, and transported to the Netherlands (6,200 km by ship and 250 km by trailer). Furthermore, 72% is imported sawn and 28% is processed in the Netherlands. The LCI for treated wood may be not be conservative because it does not include the production and use of arsenic-, chrome-, or copper-based preservatives.
Coal
Data for the cradle-to-gate resource requirements and emissions for providing coal as a ready input in electric utility boilers using average USA technology from the late 1990's. Combustion emissions are not part of this process.*
Distillate fuel oil (also called diesel fuel)
Data for the cradle-to-gate resource requirements and emissions for the provision of diesel fuel for use in combustion using average USA technology from the late 1990's. Combustion emissions are not part of this process.*
Electricity Data for the fuel consumption associated with the generation and delivery of an average kilowatt-hour in the USA using average USA technology from the late 1990's. The LCI includes adjustment to account for line losses.
Gasoline
Data for the cradle-to-gate resource requirements and emissions for providing gasoline as a ready input in tractor trailer engines using average USA technology from the late 1990's. Combustion emissions are not part of this process.*
Liquefied petroleum gas (also called light petroleum gas)
Data for the cradle-to-gate resource requirements and emissions for providing liquid propane as a ready input in industrial equipment using average USA technology from the late 1990's. Combustion emissions are not part of this process.*
Natural gas
Data for the cradle-to-gate resource requirements and emissions for providing natural gas as a ready input in industrial boilers using average USA technology from the late 1990's. Combustion emissions are not part of this process.*
Petroleum coke
Process copied from ETH database. The LCI is based on the total aggregated system inventory. It includes building and working materials, construction of the plants, energy requirement, production waste as well as emissions to air and water and land use. Special attention is given to the emissions of hydrocarbons (both to air and water) of coking plants. Energy is delivered by a pure coal coke boiler (not considering other energy carriers such as sewage sludge or blast furnace gas).*
Residual fuel oil
Data for the cradle-to-gate resource requirements and emissions for providing residual fuel oil as a ready input in industrial boilers using average USA technology from the late 1990's. Combustion emissions are not part of this process.*
*Combustion emissions are included in the house LCI.
10
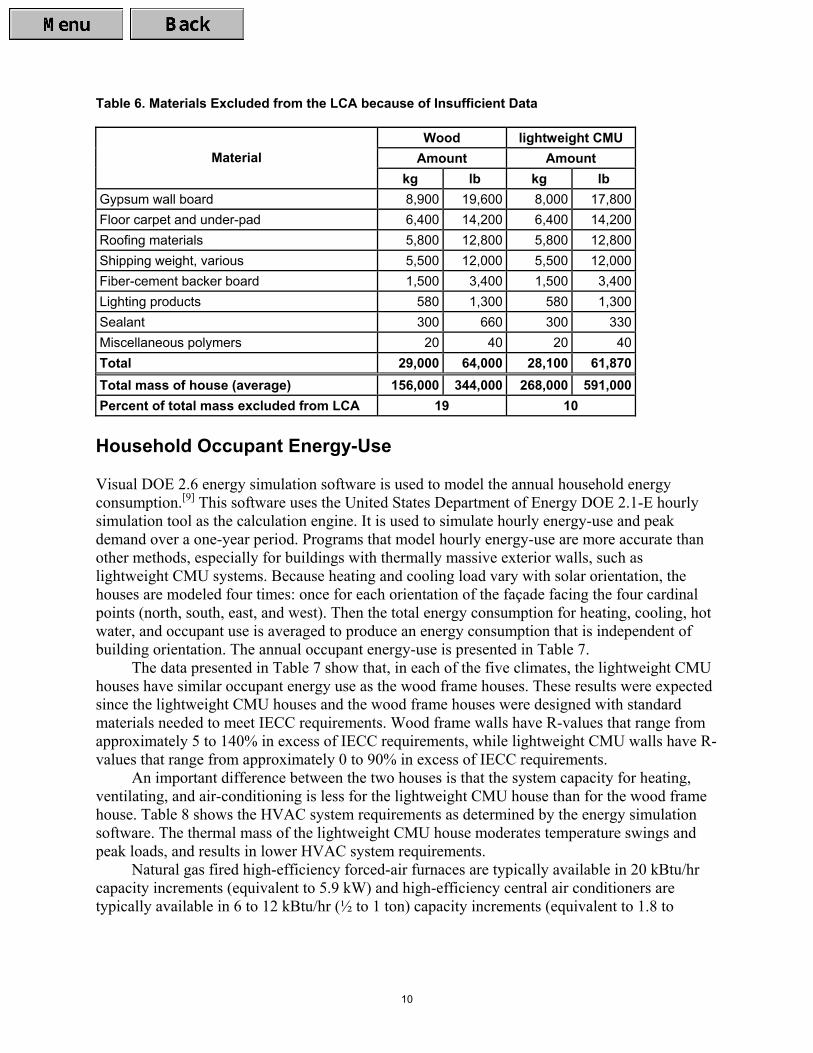
Table 6. Materials Excluded from the LCA because of Insufficient Data
Wood lightweight CMU Amount Amount Material
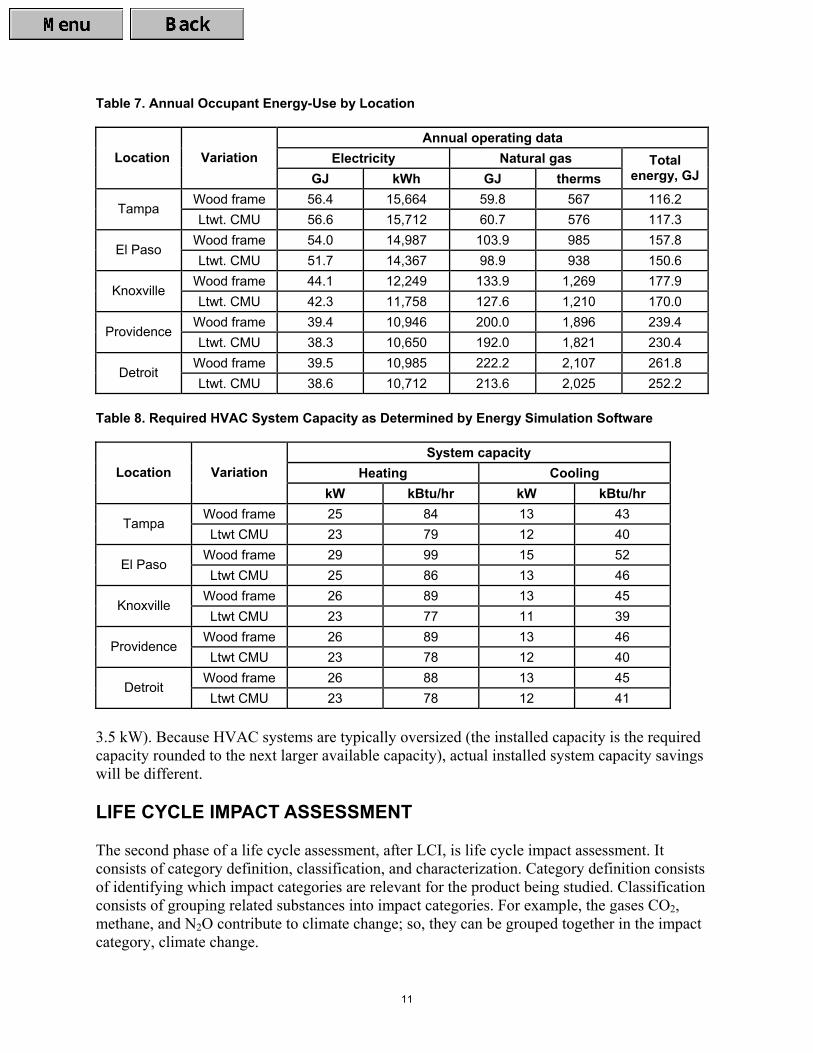
kg lb kg lb Gypsum wall board 8,900 19,600 8,000 17,800 Floor carpet and under-pad 6,400 14,200 6,400 14,200 Roofing materials 5,800 12,800 5,800 12,800 Shipping weight, various 5,500 12,000 5,500 12,000 Fiber-cement backer board 1,500 3,400 1,500 3,400 Lighting products 580 1,300 580 1,300 Sealant 300 660 300 330 Miscellaneous polymers 20 40 20 40 Total 29,000 64,000 28,100 61,870 Total mass of house (average) 156,000 344,000 268,000 591,000 Percent of total mass excluded from LCA 19 10 Household Occupant Energy-Use Visual DOE 2.6 energy simulation software is used to model the annual household energy consumption.[9] This software uses the United States Department of Energy DOE 2.1-E hourly simulation tool as the calculation engine. It is used to simulate hourly energy-use and peak demand over a one-year period. Programs that model hourly energy-use are more accurate than other methods, especially for buildings with thermally massive exterior walls, such as lightweight CMU systems. Because heating and cooling load vary with solar orientation, the houses are modeled four times: once for each orientation of the façade facing the four cardinal points (north, south, east, and west). Then the total energy consumption for heating, cooling, hot water, and occupant use is averaged to produce an energy consumption that is independent of building orientation. The annual occupant energy-use is presented in Table 7.
The data presented in Table 7 show that, in each of the five climates, the lightweight CMU houses have similar occupant energy use as the wood frame houses. These results were expected since the lightweight CMU houses and the wood frame houses were designed with standard materials needed to meet IECC requirements. Wood frame walls have R-values that range from approximately 5 to 140% in excess of IECC requirements, while lightweight CMU walls have R-values that range from approximately 0 to 90% in excess of IECC requirements.
An important difference between the two houses is that the system capacity for heating, ventilating, and air-conditioning is less for the lightweight CMU house than for the wood frame house. Table 8 shows the HVAC system requirements as determined by the energy simulation software. The thermal mass of the lightweight CMU house moderates temperature swings and peak loads, and results in lower HVAC system requirements.
Natural gas fired high-efficiency forced-air furnaces are typically available in 20 kBtu/hr capacity increments (equivalent to 5.9 kW) and high-efficiency central air conditioners are typically available in 6 to 12 kBtu/hr (½ to 1 ton) capacity increments (equivalent to 1.8 to
11
Table 7. Annual Occupant Energy-Use by Location
Annual operating data Electricity Natural gas Location Variation
GJ kWh GJ therms Total
energy, GJ
Wood frame 56.4 15,664 59.8 567 116.2 Tampa
Ltwt. CMU 56.6 15,712 60.7 576 117.3 Wood frame 54.0 14,987 103.9 985 157.8
El Paso Ltwt. CMU 51.7 14,367 98.9 938 150.6
Wood frame 44.1 12,249 133.9 1,269 177.9 Knoxville
Ltwt. CMU 42.3 11,758 127.6 1,210 170.0 Wood frame 39.4 10,946 200.0 1,896 239.4
Providence Ltwt. CMU 38.3 10,650 192.0 1,821 230.4
Wood frame 39.5 10,985 222.2 2,107 261.8 Detroit
Ltwt. CMU 38.6 10,712 213.6 2,025 252.2
Table 8. Required HVAC System Capacity as Determined by Energy Simulation Software
System capacity Heating Cooling Location Variation
kW kBtu/hr kW kBtu/hr Wood frame 25 84 13 43
Tampa Ltwt CMU 23 79 12 40
Wood frame 29 99 15 52 El Paso
Ltwt CMU 25 86 13 46 Wood frame 26 89 13 45
Knoxville Ltwt CMU 23 77 11 39
Wood frame 26 89 13 46 Providence
Ltwt CMU 23 78 12 40 Wood frame 26 88 13 45
Detroit Ltwt CMU 23 78 12 41
3.5 kW). Because HVAC systems are typically oversized (the installed capacity is the required capacity rounded to the next larger available capacity), actual installed system capacity savings will be different. LIFE CYCLE IMPACT ASSESSMENT The second phase of a life cycle assessment, after LCI, is life cycle impact assessment. It consists of category definition, classification, and characterization. Category definition consists of identifying which impact categories are relevant for the product being studied. Classification consists of grouping related substances into impact categories. For example, the gases CO2, methane, and N2O contribute to climate change; so, they can be grouped together in the impact category, climate change.
12
According to ISO 14041, the mandatory step in life cycle impact assessment is characterization. In characterization, weighting factors are assigned according to a substance’s relative contribution to the impact category. For example, the gases CO2, methane, and N2O contribute to climate change. In terms of global warming potential, one pound of methane is 20 times more potent than one pound of CO2, and one pound of N2O is 320 times more potent than one pound of CO2. Therefore, in assessing the potential for global warming, CO2 is assigned a weighting factor of 1, methane a factor of 20, and N2O a factor of 320. It is important to remember that there is no scientific basis for comparing across impact categories.[22]
According to ISO 14042, life cycle impact assessment is not intended to identify, measure or predict actual impacts or estimate threshold limits, or measure margins of safety.[22] The methodology is still being developed, and there is no general and widespread practice of life cycle impact assessment at this time or an agreement on specific methodologies.[22] Therefore, several of the available methods were used to measure the life cycle impact assessment. The methods chosen are Eco-Indicator 99 (Dutch/Swiss), EDIP/UMIP 96 (Danish), and EPS 2000 (Swedish). Furthermore, three different weighting sets in Eco-Indicator 99 were used.
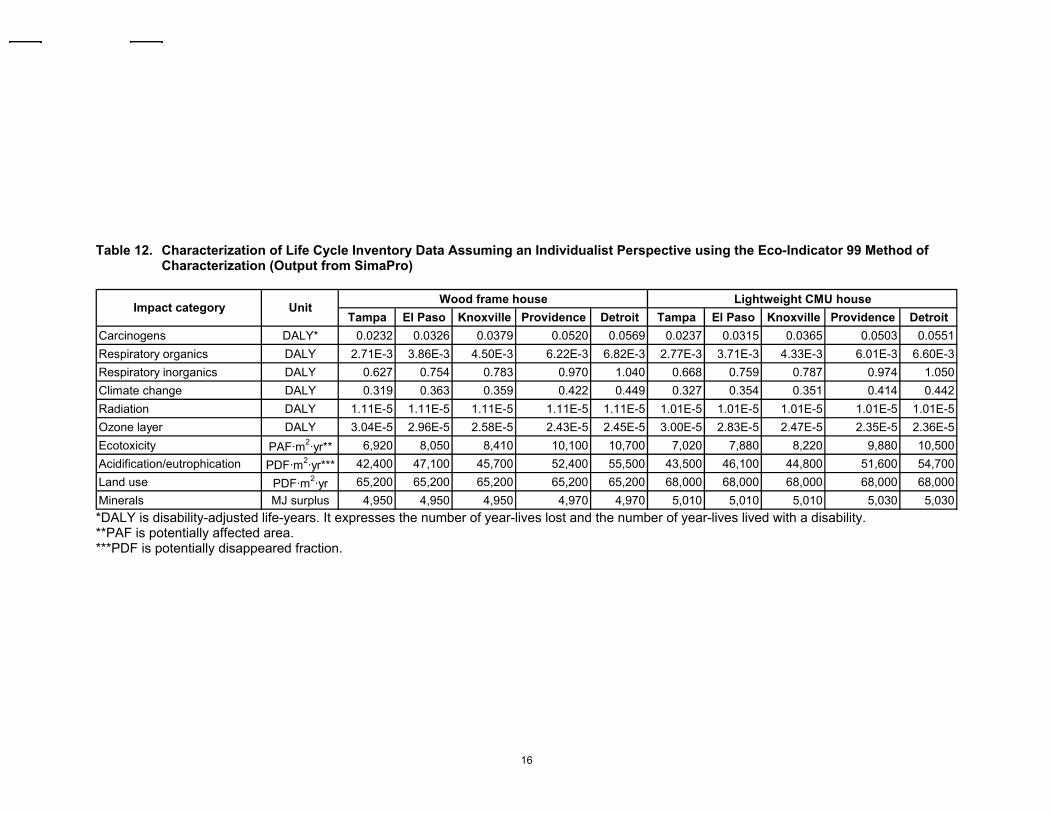
The Eco-Indicator 99 method is a damage-oriented approach, which is based on how a panel of experts weighted the different types of damage caused by the impact categories. The three versions of Eco-Indicator 99 reflect the subjective uncertainty inherent in LCA. Each one takes a different perspective on how to consider the potential damage from a particular substance. The egalitarian perspective takes an extremely long-term look at substances if there is any indication that they have some effect. The hierarchic perspective takes a long-term look at all substances if there is consensus regarding their effect. The individualist perspective takes a short-term look (100 years or less) at substances if there is complete proof regarding their effect.
The EDIP/UMIP 96 method is based on normalizing values to person-equivalents in 1990 and weighting factors are equivalent to politically-set target-emissions per person in 2000. The EPS method was designed as a tool for a company's internal product development process, and the weighting factors are based on a willingness to pay to avoid change. A listing of the impact categories in each method is shown in Table 9. A complete description of the category definitions, classification methods, and characterization factors for each of the three methods is too voluminous to be reproduced in this report. Please refer to Appendices E through G for a summary of each method and further references.
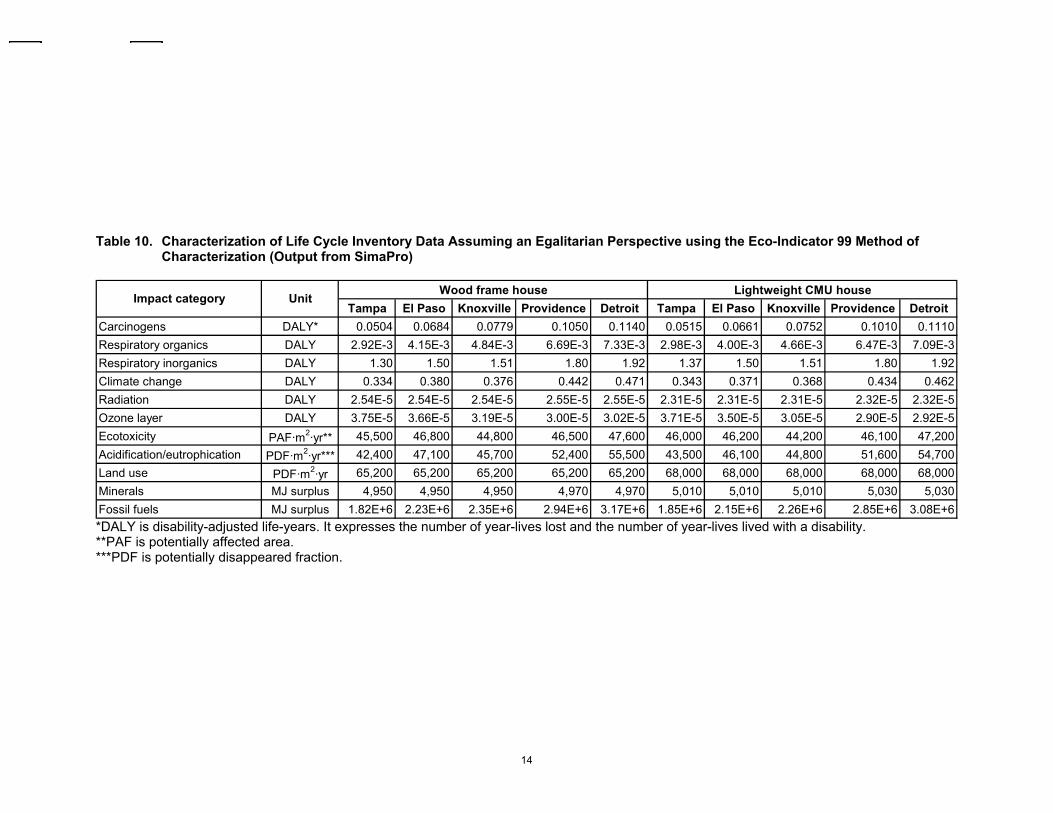
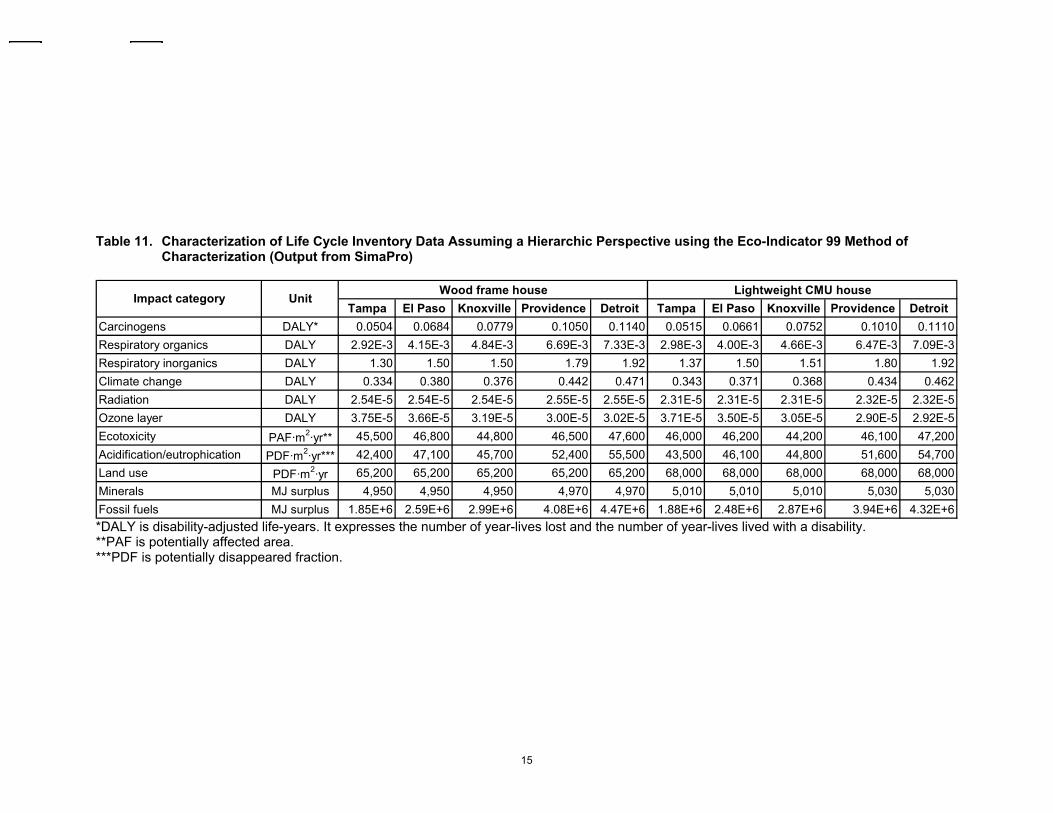
Results of the characterization phase for each method are shown in Tables 10 through 14. The data show similar results for the two houses. In most cases the lightweight CMU house has lower (better) impact indicators in the colder climates (El Paso, Knoxville, Providence, and Detroit). In the warmest climate (Tampa), the impact indicators are generally greater for the lightweight CMU house because household energy use is also greater. The exceptions are (i) in the categories “respiratory inorganics,” “land use,” and “minerals” in the Eco-Indicator methods and the categories “life expectancy,” “severe morbidity” “severe nuisance,” and “species extinction” in the EPS 2000 method, where impact indicators for the lightweight CMU house are greater, and (ii) “radiation” and “ozone” in the Eco-Indicator methods and the categories “ozone depletion,” “ecotoxicity,” and “human toxicity, water” in the EDIP/UMIP 96 method, where indicators for the wood house are greater.
Other methods of impact assessment, such as damage assessment, normalization, and weighting, are optional. In damage assessment, impact categories that have equivalent units are added. In normalization, the impact assessment values are compared to some reference, such as the average yearly environmental load in a country divided by the number of people in the
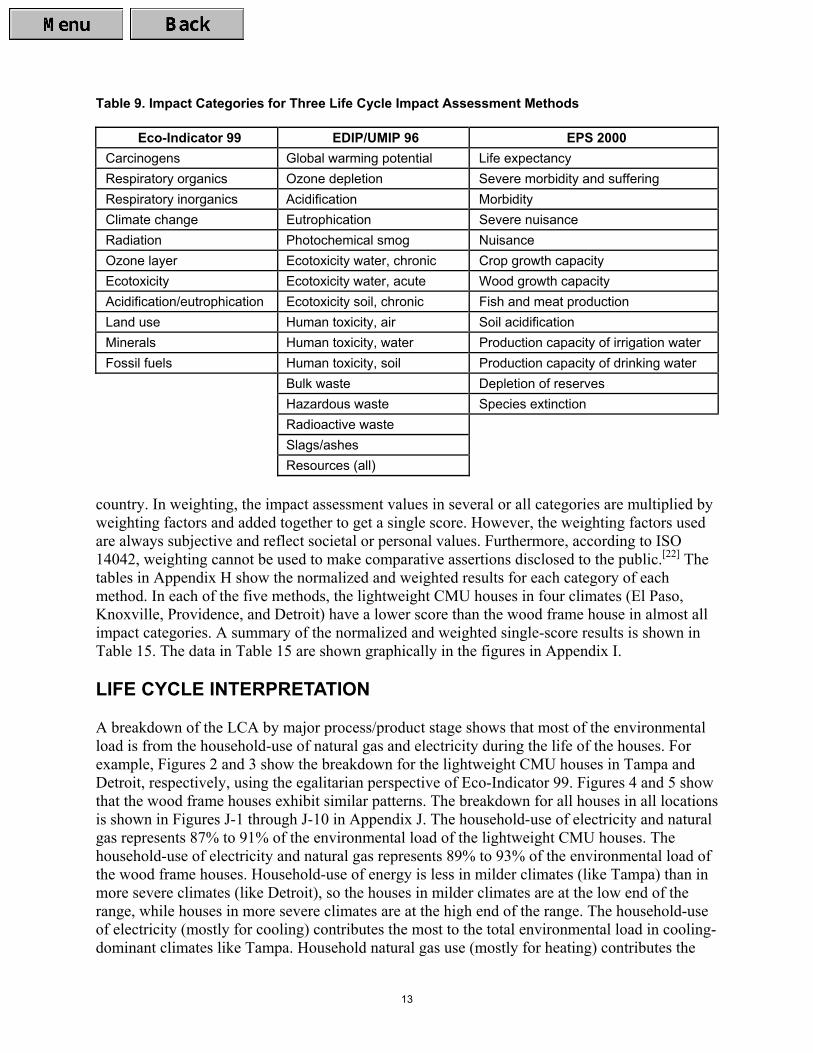
13
Table 9. Impact Categories for Three Life Cycle Impact Assessment Methods
Eco-Indicator 99 EDIP/UMIP 96 EPS 2000 Carcinogens Global warming potential Life expectancy Respiratory organics Ozone depletion Severe morbidity and suffering Respiratory inorganics Acidification Morbidity Climate change Eutrophication Severe nuisance Radiation Photochemical smog Nuisance Ozone layer Ecotoxicity water, chronic Crop growth capacity Ecotoxicity Ecotoxicity water, acute Wood growth capacity Acidification/eutrophication Ecotoxicity soil, chronic Fish and meat production Land use Human toxicity, air Soil acidification Minerals Human toxicity, water Production capacity of irrigation water Fossil fuels Human toxicity, soil Production capacity of drinking water Bulk waste Depletion of reserves Hazardous waste Species extinction Radioactive waste Slags/ashes Resources (all)
country. In weighting, the impact assessment values in several or all categories are multiplied by weighting factors and added together to get a single score. However, the weighting factors used are always subjective and reflect societal or personal values. Furthermore, according to ISO 14042, weighting cannot be used to make comparative assertions disclosed to the public.[22] The tables in Appendix H show the normalized and weighted results for each category of each method. In each of the five methods, the lightweight CMU houses in four climates (El Paso, Knoxville, Providence, and Detroit) have a lower score than the wood frame house in almost all impact categories. A summary of the normalized and weighted single-score results is shown in Table 15. The data in Table 15 are shown graphically in the figures in Appendix I. LIFE CYCLE INTERPRETATION A breakdown of the LCA by major process/product stage shows that most of the environmental load is from the household-use of natural gas and electricity during the life of the houses. For example, Figures 2 and 3 show the breakdown for the lightweight CMU houses in Tampa and Detroit, respectively, using the egalitarian perspective of Eco-Indicator 99. Figures 4 and 5 show that the wood frame houses exhibit similar patterns. The breakdown for all houses in all locations is shown in Figures J-1 through J-10 in Appendix J. The household-use of electricity and natural gas represents 87% to 91% of the environmental load of the lightweight CMU houses. The household-use of electricity and natural gas represents 89% to 93% of the environmental load of the wood frame houses. Household-use of energy is less in milder climates (like Tampa) than in more severe climates (like Detroit), so the houses in milder climates are at the low end of the range, while houses in more severe climates are at the high end of the range. The household-use of electricity (mostly for cooling) contributes the most to the total environmental load in cooling-dominant climates like Tampa. Household natural gas use (mostly for heating) contributes the
14
Table 10. Characterization of Life Cycle Inventory Data Assuming an Egalitarian Perspective using the Eco-Indicator 99 Method of Characterization (Output from SimaPro)
Wood frame house Lightweight CMU houseTampa El Paso Knoxville Providence Detroit Tampa El Paso Knoxville Providence Detroit
Carcinogens DALY* 0.0504 0.0684 0.0779 0.1050 0.1140 0.0515 0.0661 0.0752 0.1010 0.1110Respiratory organics DALY 2.92E-3 4.15E-3 4.84E-3 6.69E-3 7.33E-3 2.98E-3 4.00E-3 4.66E-3 6.47E-3 7.09E-3Respiratory inorganics DALY 1.30 1.50 1.51 1.80 1.92 1.37 1.50 1.51 1.80 1.92Climate change DALY 0.334 0.380 0.376 0.442 0.471 0.343 0.371 0.368 0.434 0.462Radiation DALY 2.54E-5 2.54E-5 2.54E-5 2.55E-5 2.55E-5 2.31E-5 2.31E-5 2.31E-5 2.32E-5 2.32E-5Ozone layer DALY 3.75E-5 3.66E-5 3.19E-5 3.00E-5 3.02E-5 3.71E-5 3.50E-5 3.05E-5 2.90E-5 2.92E-5Ecotoxicity PAF·m2·yr** 45,500 46,800 44,800 46,500 47,600 46,000 46,200 44,200 46,100 47,200Acidification/eutrophication PDF·m2·yr*** 42,400 47,100 45,700 52,400 55,500 43,500 46,100 44,800 51,600 54,700Land use PDF·m2·yr 65,200 65,200 65,200 65,200 65,200 68,000 68,000 68,000 68,000 68,000Minerals MJ surplus 4,950 4,950 4,950 4,970 4,970 5,010 5,010 5,010 5,030 5,030Fossil fuels MJ surplus 1.82E+6 2.23E+6 2.35E+6 2.94E+6 3.17E+6 1.85E+6 2.15E+6 2.26E+6 2.85E+6 3.08E+6
Impact category Unit
*DALY is disability-adjusted life-years. It expresses the number of year-lives lost and the number of year-lives lived with a disability. **PAF is potentially affected area. ***PDF is potentially disappeared fraction.
15
Table 11. Characterization of Life Cycle Inventory Data Assuming a Hierarchic Perspective using the Eco-Indicator 99 Method of Characterization (Output from SimaPro)
Wood frame house Lightweight CMU houseTampa El Paso Knoxville Providence Detroit Tampa El Paso Knoxville Providence Detroit
Carcinogens DALY* 0.0504 0.0684 0.0779 0.1050 0.1140 0.0515 0.0661 0.0752 0.1010 0.1110Respiratory organics DALY 2.92E-3 4.15E-3 4.84E-3 6.69E-3 7.33E-3 2.98E-3 4.00E-3 4.66E-3 6.47E-3 7.09E-3Respiratory inorganics DALY 1.30 1.50 1.50 1.79 1.92 1.37 1.50 1.51 1.80 1.92Climate change DALY 0.334 0.380 0.376 0.442 0.471 0.343 0.371 0.368 0.434 0.462Radiation DALY 2.54E-5 2.54E-5 2.54E-5 2.55E-5 2.55E-5 2.31E-5 2.31E-5 2.31E-5 2.32E-5 2.32E-5Ozone layer DALY 3.75E-5 3.66E-5 3.19E-5 3.00E-5 3.02E-5 3.71E-5 3.50E-5 3.05E-5 2.90E-5 2.92E-5Ecotoxicity PAF·m2·yr** 45,500 46,800 44,800 46,500 47,600 46,000 46,200 44,200 46,100 47,200Acidification/eutrophication PDF·m2·yr*** 42,400 47,100 45,700 52,400 55,500 43,500 46,100 44,800 51,600 54,700Land use PDF·m2·yr 65,200 65,200 65,200 65,200 65,200 68,000 68,000 68,000 68,000 68,000Minerals MJ surplus 4,950 4,950 4,950 4,970 4,970 5,010 5,010 5,010 5,030 5,030Fossil fuels MJ surplus 1.85E+6 2.59E+6 2.99E+6 4.08E+6 4.47E+6 1.88E+6 2.48E+6 2.87E+6 3.94E+6 4.32E+6
Impact category Unit
*DALY is disability-adjusted life-years. It expresses the number of year-lives lost and the number of year-lives lived with a disability. **PAF is potentially affected area. ***PDF is potentially disappeared fraction.
16
Table 12. Characterization of Life Cycle Inventory Data Assuming an Individualist Perspective using the Eco-Indicator 99 Method of Characterization (Output from SimaPro)
Wood frame house Lightweight CMU houseTampa El Paso Knoxville Providence Detroit Tampa El Paso Knoxville Providence Detroit
Carcinogens DALY* 0.0232 0.0326 0.0379 0.0520 0.0569 0.0237 0.0315 0.0365 0.0503 0.0551Respiratory organics DALY 2.71E-3 3.86E-3 4.50E-3 6.22E-3 6.82E-3 2.77E-3 3.71E-3 4.33E-3 6.01E-3 6.60E-3Respiratory inorganics DALY 0.627 0.754 0.783 0.970 1.040 0.668 0.759 0.787 0.974 1.050Climate change DALY 0.319 0.363 0.359 0.422 0.449 0.327 0.354 0.351 0.414 0.442Radiation DALY 1.11E-5 1.11E-5 1.11E-5 1.11E-5 1.11E-5 1.01E-5 1.01E-5 1.01E-5 1.01E-5 1.01E-5Ozone layer DALY 3.04E-5 2.96E-5 2.58E-5 2.43E-5 2.45E-5 3.00E-5 2.83E-5 2.47E-5 2.35E-5 2.36E-5Ecotoxicity PAF·m2·yr** 6,920 8,050 8,410 10,100 10,700 7,020 7,880 8,220 9,880 10,500Acidification/eutrophication PDF·m2·yr*** 42,400 47,100 45,700 52,400 55,500 43,500 46,100 44,800 51,600 54,700Land use PDF·m2·yr 65,200 65,200 65,200 65,200 65,200 68,000 68,000 68,000 68,000 68,000Minerals MJ surplus 4,950 4,950 4,950 4,970 4,970 5,010 5,010 5,010 5,030 5,030
Impact category Unit
*DALY is disability-adjusted life-years. It expresses the number of year-lives lost and the number of year-lives lived with a disability. **PAF is potentially affected area. ***PDF is potentially disappeared fraction.
17
Table 13. Characterization of Life Cycle Inventory Data using the EDIP/UMIP 96 Method of Characterization (Output from SimaPro)
Wood frame house Lightweight CMU houseTampa El Paso Knoxville Providence Detroit Tampa El Paso Knoxville Providence Detroit
Global warming (GWP 100) g CO2 1.61E+9 1.84E+9 1.82E+9 2.14E+9 2.29E+9 1.66E+9 1.79E+9 1.78E+9 2.11E+9 2.24E+9Ozone depletion g CFC-11 35.7 34.8 30.4 28.6 28.8 35.3 33.3 29.1 27.6 27.8Acidification g SO2 1.76E+7 2.10E+7 2.17E+7 2.67E+7 2.87E+7 1.80E+7 2.04E+7 2.11E+7 2.60E+7 2.80E+7Eutrophication g NO3 6.62E+6 6.94E+6 6.37E+6 6.77E+6 7.06E+6 6.83E+6 6.84E+6 6.30E+6 6.75E+6 7.04E+6Photochemical smog g ethene 7.20E+4 9.09E+4 9.88E+4 1.27E+5 1.38E+5 7.36E+4 8.83E+4 9.59E+4 1.24E+5 1.34E+5Ecotoxicity water, chronic g/m3 1.49E+8 1.80E+8 1.93E+8 2.39E+8 2.56E+8 1.39E+8 1.63E+8 1.75E+8 2.20E+8 2.37E+8Ecotoxicity water, acute g/m3 1.34E+7 1.64E+7 1.77E+7 2.22E+7 2.39E+7 1.23E+7 1.47E+7 1.59E+7 2.04E+7 2.20E+7Ecotoxicity soil, chronic g/m3 5.65E+5 5.68E+5 5.61E+5 5.64E+5 5.67E+5 5.57E+5 5.57E+5 5.51E+5 5.54E+5 5.57E+5Human toxicity, air g/m3 2.84E+11 2.96E+11 2.85E+11 3.01E+11 3.10E+11 2.87E+11 2.91E+11 2.81E+11 2.97E+11 3.06E+11
Human toxicity, water g/m3 5.20E+7 5.50E+7 5.27E+7 5.67E+7 5.90E+7 5.15E+7 5.27E+7 5.05E+7 5.47E+7 5.70E+7Human toxicity, soil g/m3 1.54E+5 1.61E+5 1.53E+5 1.62E+5 1.68E+5 1.55E+5 1.56E+5 1.49E+5 1.59E+5 1.64E+5Bulk waste kg 2.31E+5 2.34E+5 2.08E+5 2.08E+5 2.14E+5 2.32E+5 2.25E+5 2.00E+5 2.03E+5 2.09E+5Hazardous waste kg 13.4 13.4 13.4 13.4 13.4 13.4 13.4 13.4 13.4 13.4Radioactive waste* kg x x x x x x x x x xSlags/ashes kg 11.4 11.4 11.4 11.4 11.4 11.2 11.2 11.2 11.2 11.2Resources (all) kg 29.6 34.9 37.3 45.2 48.0 30.0 34.2 36.5 44.2 47.0
Impact category Unit
*An x means there are no data.
18
Table 14. Characterization of Life Cycle Inventory Data using the EPS 2000 Method of Characterization (Output from SimaPro)
Wood frame house Lightweight CMU houseTampa El Paso Knoxville Providence Detroit Tampa El Paso Knoxville Providence Detroit
Life expectancy Person-year 1.13 1.45 1.58 2.06 2.23 1.22 1.47 1.60 2.07 2.24Severe morbidity Person-year 0.055 0.118 0.167 0.263 0.293 0.066 0.123 0.170 0.263 0.293Morbidity Person-year 0.456 0.648 0.758 1.050 1.150 0.486 0.645 0.751 1.030 1.130Severe nuisance Person-year 0.152 0.152 0.150 0.15 0.151 0.155 0.154 0.152 0.153 0.153Nuisance Person-year 104 125 131 162 175 106 122 127 158 171Crop growth capacity kg 3.61E+3 3.92E+3 3.73E+3 4.15E+3 4.37E+3 3.74E+3 3.88E+3 3.69E+3 4.13E+3 4.35E+3Wood growth capacity kg -2.79E+4 -3.77E+4 -4.27E+4 -5.73E+4 -6.25E+4 -2.99E+4 -3.78E+4 -4.27E+4 -5.70E+4 -6.21E+4Fish and meat production kg -149 -153 -138 -142 -147 -154 -151 -137 -142 -147Soil acidification H+ eq. 2.74E+4 3.28E+4 3.39E+4 4.17E+4 4.49E+4 2.80E+4 3.18E+4 3.29E+4 4.07E+4 4.38E+4Prod. cap. of irrigation water* kg x x x x x x x x x xProd. cap. of drinking water kg x x x x x x x x x xDepletion of reserves ELU/kg** 3.40E+5 4.55E+5 5.17E+5 6.88E+5 7.48E+5 3.46E+5 4.40E+5 4.99E+5 6.67E+5 7.26E+5Species extinction [-] 3.30E-8 3.51E-8 3.67E-8 3.99E-8 4.09E-8 3.48E-8 3.67E-8 3.83E-8 4.14E-8 4.24E-8
Impact category Unit
*An x means there are no data. **ELU is environmental load unit.
19
Table 15. Single Score Summary (Output from SimaPro)
MethodEco-indicator 99
Egalitarian Hierarchic IndividualistTampa 105,000 96,800 77,300 472,000 461,000El Paso 124,000 122,000 89,600 546,000 613,000Knoxville 128,000 131,000 91,700 549,000 693,000Providence 157,000 168,000 110,000 655,000 920,000Detroit 168,000 181,000 117,000 700,000 1,000,000Tampa 108,000 99,900 81,000 483,000 470,000El Paso 122,000 119,000 89,500 531,000 594,000Knoxville 125,000 128,000 91,500 534,000 672,000Providence 154,000 164,000 110,000 641,000 894,000Detroit 164,000 178,000 117,000 686,000 973,000
Wood frame house
Lightweight CMU house
EDIP/UMIP 96 EPS 2000
LocationHouse style
*No units: data have been normalized and weighted.
most to the total environmental load in heating-dominant climate like Detroit. In all locations, cement-based materials represent a small fraction of the total environmental load. Furthermore, Figures 2 through 5 also show that the most significant impact categories are fossil fuel depletion and respiratory inorganics. The other methods of life cycle impact assessment produce similar results.
When considering only the construction materials for the lightweight CMU house, most of the environmental load is from wood, with total cement-based materials second. For the wood house, most of the environmental load of construction materials is from wood and copper tubing, with total cement-based materials third. For example, Figures 6 and 7 show a breakdown of the environmental load of buildings materials for each of the houses in Detroit using the egalitarian perspective of the Eco-Indicator 99 Method. Furthermore, the impact categories that contribute the most to the environmental load are (i) land use, fossil fuel depletion, and respiratory inorganics, primarily from cement-based materials, wood, and copper tubing in the lightweight CMU house, and (ii) land use and fossil fuel depletion, primarily from wood and copper tubing in the wood house. Figures K-1 through K-10 in Appendix K show the breakdown of environmental load for all locations.
Complete disposal scenarios have not been included in this LCA. Including complete disposal scenarios (notably decomposition of wood-based products in landfill) will not significantly alter the results of this LCA.
CONCLUSIONS This report presented the results of an LCA a house modeled with two types of exterior walls: a wood-framed wall and a lightweight CMU wall. The LCA was carried out according to the ISO 14040 series guidelines. The house was modeled in five cities, representing a range of U.S. climates: Tampa, El Paso, Knoxville, Providence, and Detroit.
Each house is a two-story single-family building with a contemporary design. The house system boundary includes the inputs and outputs of energy and material from construction,
20
217
30,300
63,600
11,200
2,6700
10,000
20,000
30,000
40,000
50,000
60,000
70,000
80,000
90,000
100,000
Cement-basedmaterials
Other buildingmaterials
Householdelectricity use
Householdnatural gascombustion
Transportationto/from house
Poi
nts
Carcinogens Respiratory organics Respiratory inorganicsClimate change Radiation Ozone layerEcotoxicity Acidification/ Eutrophication Land useMinerals Fossil fuels
Ltwt CMU house
Figure 2. Single-score life cycle inventory assessment of lightweight CMU house in Tampa showing contribution of each major process/product stage (output from SimaPro). The data have been normalized and weighted according to the Eco-Indicator 99 method using the Egalitarian perspective.
occupancy and maintenance. The system boundary excludes human resources, infrastructure, accidental spills, impacts caused by people, and decomposition of household components after disposal. The life of the houses is 100 years.
The LCA was conducted by first assembling the relevant LCI data from published reports and commercially available databases. The LCA software tool, SimaPro, was used to perform a life cycle impact assessment. Impact assessment is not completely scientific; so three different models were used. The methods chosen are Eco-Indicator 99 (Dutch/Swiss), EDIP/UMIP 96 (Danish), and EPS 2000 (Swedish). Furthermore, three different weighting sets in Eco-Indicator 99 were used.
The data show similar results for the two houses. In most cases the lightweight CMU house has lower (better) impact indicators in the colder climates (El Paso, Knoxville, Providence, and Detroit). In the warmest climate (Tampa), the impact indicators are generally greater for the lightweight CMU house because household energy use is also greater. The exceptions are (i) in the categories “respiratory inorganics,” “land use,” and “minerals” in the Eco-Indicator methods and the categories “life expectancy,” “severe morbidity” “severe nuisance,” and “species extinction” in the EPS 2000 method, where impact indicators for the lightweight CMU house are greater, and (ii) “radiation” and “ozone” in the Eco-Indicator methods and the categories “ozone depletion,” “ecotoxicity,” and “human toxicity, water” in the EDIP/UMIP 96 method, where indicators for the wood house are greater.
21
3,000
11,400
43,300
107,000
2580
10,000
20,000
30,000
40,000
50,000
60,000
70,000
80,000
90,000
100,000
110,000
Cement-basedmaterials
Other buildingmaterials
Householdelectricity use
Householdnatural gascombustion
Transportationto/from house
Poi
nts
Carcinogens Respiratory organics Respiratory inorganicsClimate change Radiation Ozone layerEcotoxicity Acidification/ Eutrophication Land useMinerals Fossil fuels
Ltwt CMU house
Figure 3. Single-score life cycle inventory assessment of lightweight CMU house in Detroit showing contribution of each major process/product stage (output from SimaPro). The data have been normalized and weighted according to the Eco-Indicator 99 method using the Egalitarian perspective.
The most significant environmental impacts are not from the construction materials but
from the production and use of electricity and natural gas in the houses by the occupants. Furthermore, the largest impacts from these uses are in the form of depletion of fossil fuel reserves (categorized as damage to natural resources) and release to the air of respiratory inorganics (categorized as damage to human health).
When considering only the construction materials for the lightweight CMU house, most of the environmental load is from wood, with total cement-based materials second. For the wood house, most of the environmental load of construction materials is from wood and copper tubing, with total cement-based materials third.
22
119
29,900
63,400
11,300
5360
10,000
20,000
30,000
40,000
50,000
60,000
70,000
80,000
90,000
100,000
Cement-basedmaterials
Other buildingmaterials
Householdelectricity use
Householdnatural gascombustion
Transportationto/from house
Poi
nts
Carcinogens Respiratory organics Respiratory inorganicsClimate change Radiation Ozone layerEcotoxicity Acidification/ Eutrophication Land useMinerals Fossil fuels
Wood house
Figure 4. Single-score life cycle inventory assessment of wood frame house in Tampa showing contribution of each major process/product stage (output from SimaPro). The data have been normalized and weighted according to the Eco-Indicator 99 method using the Egalitarian perspective.
23
869
11,400
44,500
111,000
1590
10,000
20,000
30,000
40,000
50,000
60,000
70,000
80,000
90,000
100,000
110,000
120,000
Cement-basedmaterials
Other buildingmaterials
Householdelectricity use
Householdnatural gascombustion
Transportationto/from house
Poi
nts
Carcinogens Respiratory organics Respiratory inorganicsClimate change Radiation Ozone layerEcotoxicity Acidification/ Eutrophication Land useMinerals Fossil fuels
Wood house
Figure 5. Single-score life cycle inventory assessment of wood frame house in Detroit showing contribution of each major process/product stage (output from SimaPro). The data have been normalized and weighted according to the Eco-Indicator 99 method using the Egalitarian perspective.
24
1,290891
4,500
117494
378411240
4617526
46195
2,460
88
3,000
227
-1,000
0
1,000
2,000
3,000
4,000
5,000
Alu
min
um
Cem
ent-b
ased
mat
eria
ls
Cer
amic
tile
Cop
per t
ubin
g
Cop
per w
ire
Ferr
o m
etal
s
Fibe
rgla
ss
Lino
leum
Pai
nt
Pol
yest
er
Pol
ysty
rene
PV
C p
ipe
PV
C p
ipe
fittin
gs
Mis
c. P
VC
Win
dow
s
Woo
d bo
ard
Woo
d fra
min
g
Trea
ted
woo
d
Mis
c. w
ood
Poi
nts
Carcinogens Respiratory organics Respiratory inorganicsClimate change Radiation Ozone layerEcotoxicity Acidification/eutrophication Land useMinerals Fossil fuels
Lightweight CMU house
Figure 6. Single-score life cycle inventory assessment for construction materials in the lightweight CMU house in Detroit (output from SimaPro). The data have been normalized and weighted according to the Eco-Indicator 99 method using the Egalitarian perspective.
25
1,290
301
4,790
159494
3784112428461
7526342
95
2,460
88
869612
-1,000
0
1,000
2,000
3,000
4,000
5,000
Alu
min
um
Cem
ent-b
ased
mat
eria
ls
Cer
amic
tile
Cop
per t
ubin
g
Cop
per w
ire
Ferr
o m
etal
s
Fibe
rgla
ss
Lino
leum
Pai
nt
Pol
yest
er
Pol
ysty
rene
PV
C p
ipe
PV
C p
ipe
fittin
gs
Mis
c. P
VC
Win
dow
s
Woo
d bo
ard
Woo
d fra
min
g
Trea
ted
woo
d
Mis
c. w
ood
Poi
nts
Carcinogens Respiratory organics Respiratory inorganicsClimate change Radiation Ozone layerEcotoxicity Acidification/eutrophication Land useMinerals Fossil fuels
Wood house
Figure 7. Single-score life cycle inventory assessment for construction materials in the wood frame house in Detroit (output from SimaPro). The data have been normalized and weighted according to the Eco-Indicator 99 method using the Egalitarian perspective.
26
ACKNOWLEDGEMENTS The research reported in this paper (PCA R&D Serial No. 2571) was conducted by Construction Technology Laboratories, Inc. with the sponsorship of the Portland Cement Association (PCA Project Index No. 94-04). The contents of this report reflect the views of the authors, who are responsible for the facts and accuracy of the data presented. The contents do not necessarily reflect the views of the Portland Cement Association. REFERENCES 1. Marceau, Medgar L., Gajda, John, VanGeem, Martha G., Gentry, Thomas, and Nisbet,
Michael A., “Partial Environmental Life Cycle Inventory of an Insulating Concrete Form House Compared to a Wood Frame House,” R&D Serial No. 2464, Portland Cement Association, Skokie, Illinois, 2000, 42 pages.
2. Marceau, Medgar L., Gajda, John, VanGeem, Martha G., Gentry, Thomas, and Nisbet,
Michael A., “Partial Environmental Life Cycle Inventory of a Concrete Masonry House Compared to a Wood Frame House,” R&D Serial No. 2465, Portland Cement Association, Skokie, Illinois, USA, 2000, 48 pages.
3. Marceau, Medgar L., Gajda, John, VanGeem, Martha G., Gentry, Thomas, and Nisbet,
Michael A., “Partial Environmental Life Cycle Inventory of a Lightweight Concrete Masonry House Compared to a Wood Frame House,” R&D Serial No. 2466, Portland Cement Association, Skokie, Illinois, USA, 2000, 49 pages.
4. VanGeem, Martha G., Marceau, Medgar L., Gajda, John, and Nisbet, Michael A., “Partial
Environmental Life-Cycle Inventory of Single-Family Houses,” Performance of Exterior Envelopes of Whole Buildings VIII, American Society of Heating, Refrigerating and Air Conditioning Engineers, Clearwater Beach, Florida, 2001, 18 pages.
5. “Environmental Management – Life Cycle Assessment – Goal and Scope Definition and
Inventory Analysis,” ISO 14041, International Organization for Standardization, Geneva, Switzerland, 1998.
6. “Environmental Management – Life Cycle Assessment – Principles and Framework,” ISO
14040, International Organization for Standardization, Geneva, Switzerland, 1997. 7. 1998 International Energy Conservation Code, International Code Council, Falls Church, VA,
March 1998. 8. Gajda, John, and VanGeem, Martha G., “Energy Use in Residential Housing: A Comparison
of Lightweight Concrete Masonry and Wood Frame Walls,” PCA R&D Serial No. 2439, Portland Cement Association, Skokie, IL, June 2000.
9. Visual DOE 2.6, Version 2.61, Eley Associates, San Francisco, CA, 1999.
http://www.eley.com/gdt/visualdoe/index.htm
27
10. “1998 Characteristics of New Housing - Current Construction Reports,” Publication No. C25/98-A, U.S. Department of Housing and Urban Development and U.S. Department of Commerce, Washington, DC, July 1999.
11. PCA Economic Department, Portland Cement Association, Skokie, IL, 1999. 12. “Energy Efficient Design of New Buildings, Except Low-Rise Residential Buildings,”
ASHRAE Standard 90.1-1999, American Society of Heating, Refrigerating and Air Conditioning Engineers, Atlanta, GA, 1999.
13. “Energy Efficient Design of New Low-Rise Residential Buildings,” ASHRAE Standard
90.2-1993, American Society of Heating, Refrigerating and Air Conditioning Engineers, Atlanta, GA, 1993.
14. “Ventilation for Acceptable Indoor Air Quality,” ASHRAE Standard 62-1989, American
Society of Heating, Refrigerating and Air Conditioning Engineers, Atlanta, GA, 1989. 15. Nisbet, Michael A., VanGeem, Martha G., Gajda, John, Marceau, Medgar L.,
“Environmental Life Cycle Inventory of Portland Cement Concrete,” R&D Serial No. 2137, Portland Cement Association, Skokie, Illinois, 2000.
16. SimaPro, Version 5.0, PRé Consultants, Amersfoort, The Netherlands, 2001.
www.pre.nl/simapro/ 17. PRé Consultants and Sylvatica, Database Manual: The Franklin US LCI Library, PRé
Consultants, Amersfoort, The Netherlands, 2001. www.pre.nl/simapro/inventory_databases.htm
18. PRé Consultants and Delft University of Technology, IDEMAT Database, PRé Consultants,
Amersfoort, The Netherlands, 2001. www.pre.nl/simapro/inventory_databases.htm 19. PRé Consultants, Database Manual: Data Archive, PRé Consultants, Amersfoort, The
Netherlands, 2001. www.pre.nl/simapro/inventory_databases.htm 20. PRé Consultants and ESU-services, Database Manual: The ETH-ESU 96 Library, PRé
Consultants, Amersfoort, The Netherlands, 2001. www.pre.nl/simapro/inventory_databases.htm
21. Nisbet, Michael A., and VanGeem, Martha G., “The Life Cycle Inventory of the Lightweight
Aggregate Manufacturing Process,” Prepared for The Expanded Shale, Clay, and Slate Institute, Construction Technology Laboratories, Inc., Skokie, Illinois, February 2000.
22. “Environmental Management – Life Cycle Assessment – Life Cycle Impact Assessment,”
ISO 14042, Committee Draft, International Organization for Standardization, Geneva, Switzerland, 1999.
A-1
APPENDIX A – TARGET AUDIENCES AND INFORMATION TO BE COMMUNICATED
A-2
This report is one of many for the Environmental Life Cycle Assessment (LCA) of Portland Cement Concrete project sponsored by the Portland Cement Association. The objectives of publishing reports and disseminating information are to:
• Determine the environmental life cycle benefits associated with the use of these products. • Produce comparisons of concrete and other building materials. • Provide information about these benefits to manufacturers and users of these products. • Provide life cycle inventory (LCI) and LCA information to practitioners and others, such
as data base providers in need of accurate data on cement and concrete.
The contents of the reports will provide information for the following audiences: • Members of the Portland Cement Association (PCA) and other organizations that
promote the use of cement and concrete, generally called “allied industries.” • Members of the Environmental Council of Concrete Organizations (ECCO). • LCA practitioners and database developers. • Engineers, architects, and designers. • Public agencies (Departments of Transportation [DOTs], Energy Star, Environmentally
Preferable Purchasing Program). • General public.
The report formats are not particularly suited for all audiences. The reports are intended to document the particular partial LCI, LCI, or LCA. They provide data in a transparent, traceable format for documentation purposes. The intent is that abbreviated papers, brochures, data packages, presentations, or press releases can be developed from the project reports. The materials presenting the results of this project will be matched, in form and format, to the needs of the target audience. The materials have been categorized as follows: • General Information: Purpose of life cycle assessments (LCAs) and how they are done. Limited life cycle results of portland cement concrete products from production through
use to demolition and recycling. • Summary Results: Presentation of selected life cycle inventory (LCI) data in the form of summary
information, bar charts or other diagrams; for example PowerPoint™ presentations. Published papers or articles.
• Detailed Results: LCI results for databases or LCA models, such as BEES or Athena. Description of the LCI methodology used in the project and specific assumptions,
information sources/references, and detailed results.
B-1
APPENDIX B – HOUSE PLANS AND WALL CROSS-SECTIONS
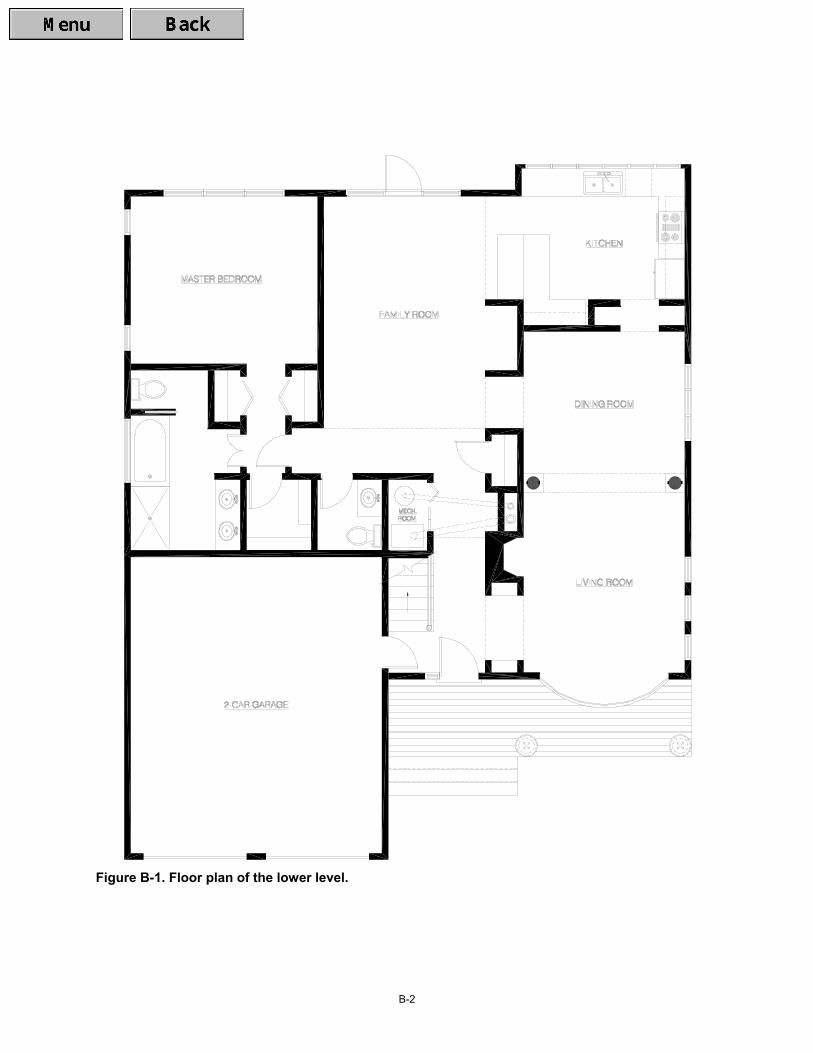
B-2
Figure B-1. Floor plan of the lower level.
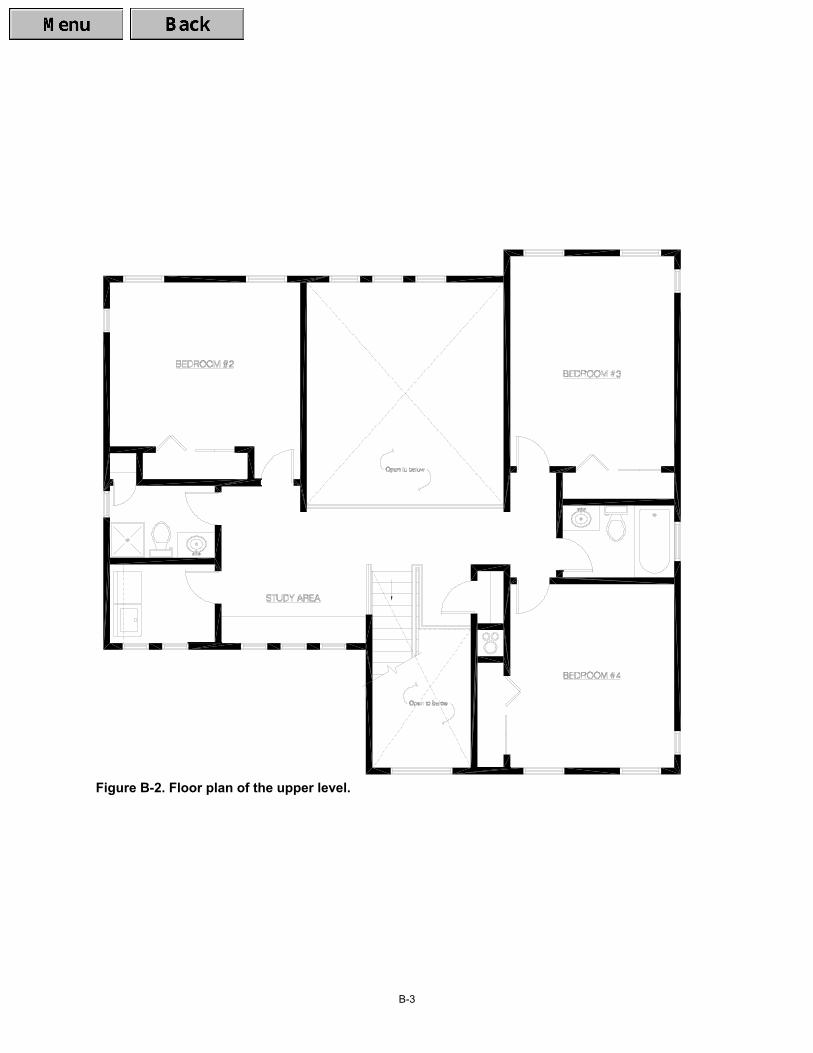
B-3
Figure B-2. Floor plan of the upper level.
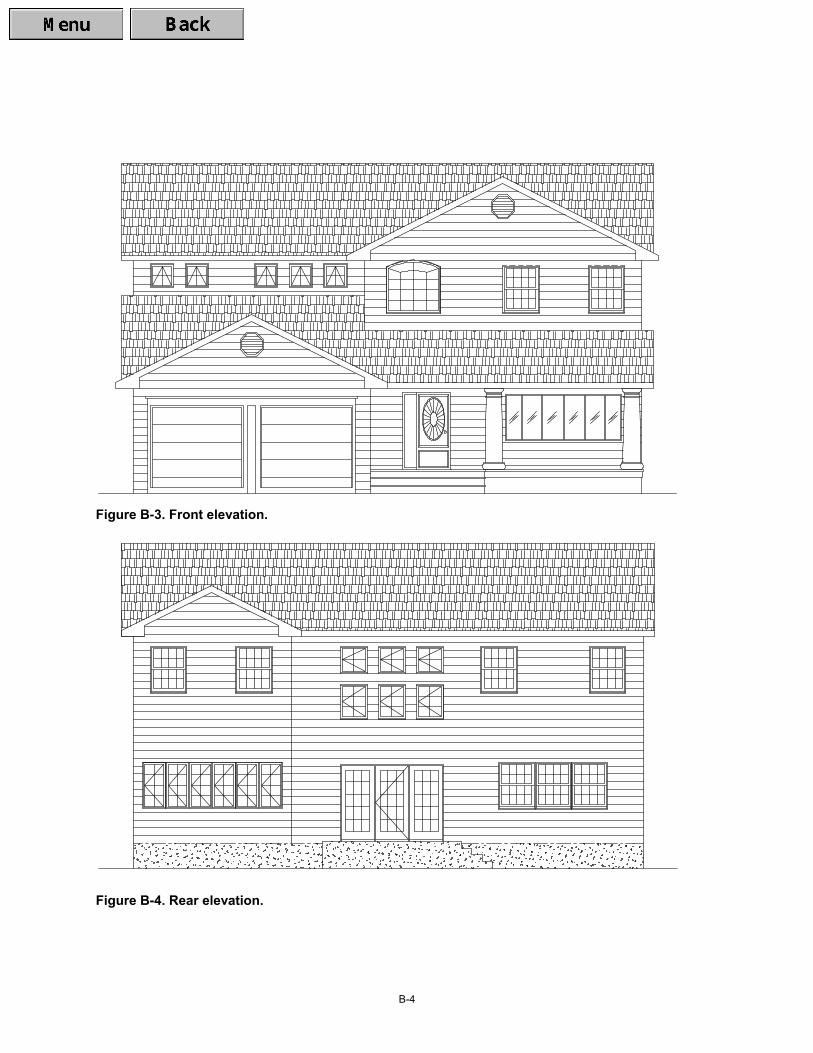
B-4
Figure B-3. Front elevation.
Figure B-4. Rear elevation.
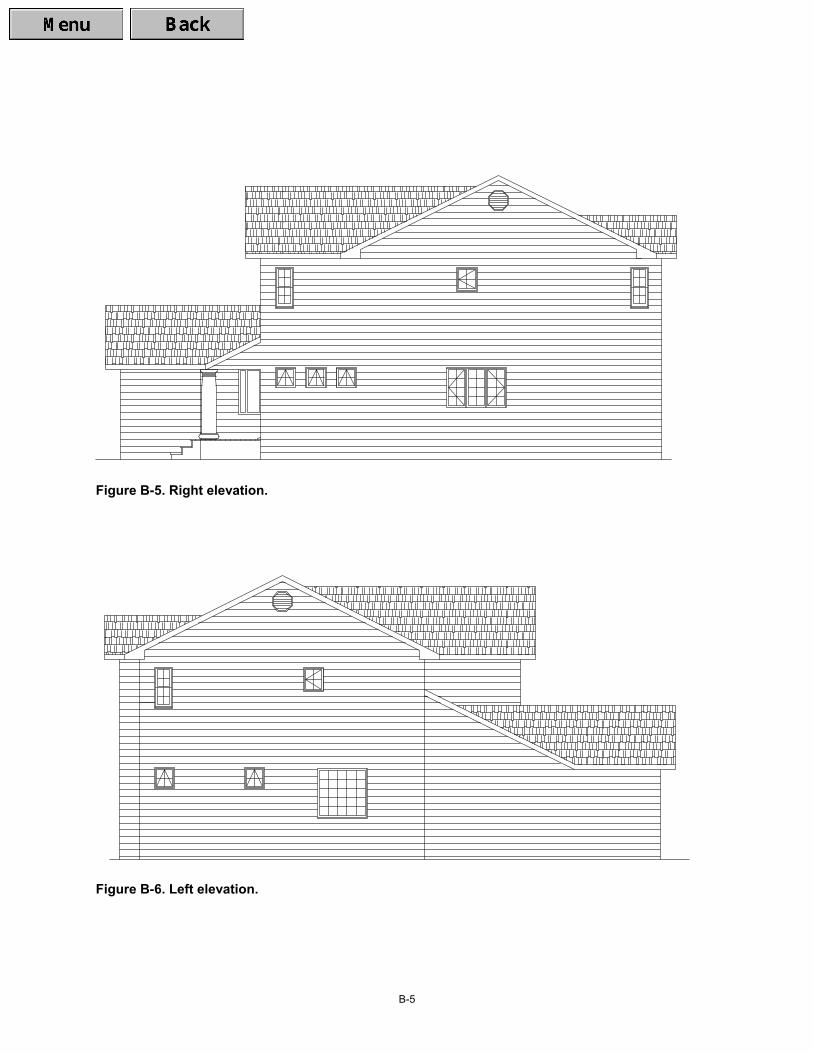
B-5
Figure B-5. Right elevation.
Figure B-6. Left elevation.
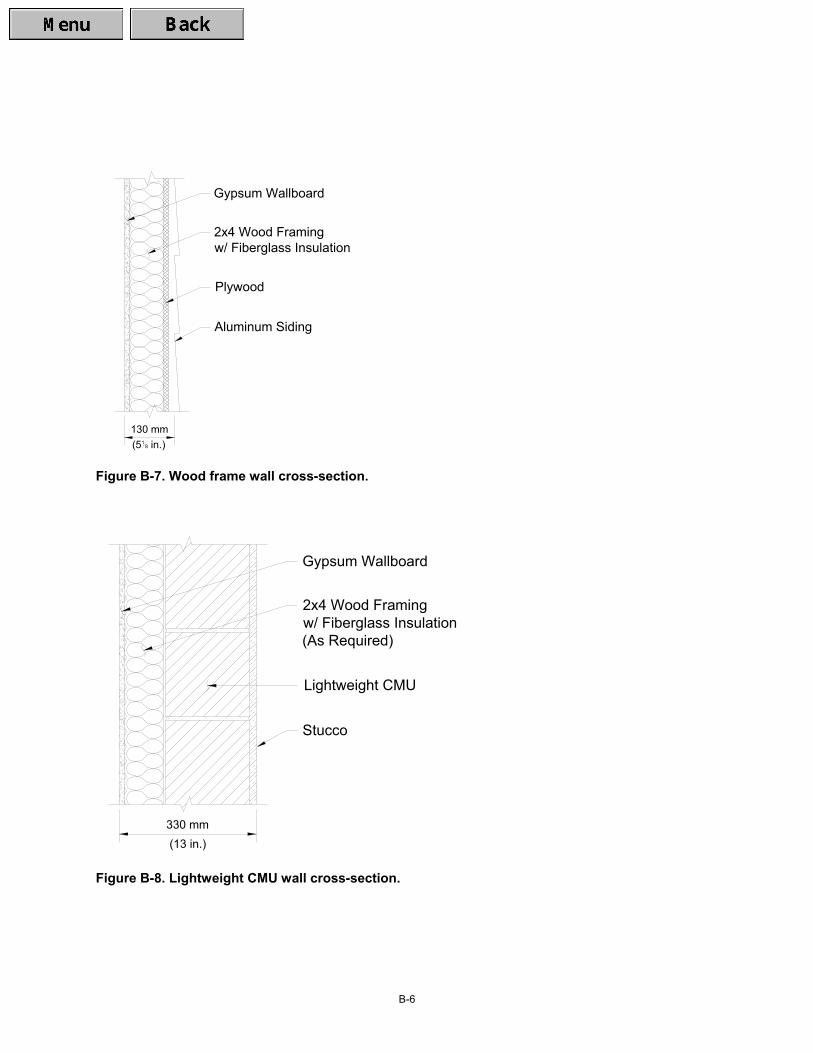
B-6
Gypsum Wallboard
2x4 Wood Framingw/ Fiberglass Insulation
Plywood
Aluminum Siding
(518 in.)
130 mm
Figure B-7. Wood frame wall cross-section.
Lightweight CMU
Stucco
2x4 Wood Framingw/ Fiberglass Insulation(As Required)
Gypsum Wallboard
(13 in.)330 mm
Figure B-8. Lightweight CMU wall cross-section.

C-1
APPENDIX C – LCI DATA FOR WOOD HOUSES AND LIGHTWEIGHT CMU HOUSES – SI UNITS

C-2
SIMAPRO: A LIFE CYCLE ASSESSMENT TOOL The Dutch company PRé Consultants is a leader in developing tools for life cycle assessment. They created and continue to develop SimaPro, the most widely used life cycle assessment tool (www.pre.nl/simapro). SimaPro can be used to perform detailed and robust life cycle assessments of materials, components, buildings, and processes. It contains a large database of products and processes and seven comprehensive, widely-accepted impact assessment methods. The user can either build up a product or process from scratch using the databases supplied with SimaPro, or the LCI of an existing product or process can be augmented with upstream and downstream profiles for other processes to determine a life cycle assessment. The impact assessment methods can be utilized to determine the impacts of materials, energy use, and pollutants. For example, upstream profiles can be the energy sources or extraction of raw materials. Downstream profiles can be other manufacturing steps used to make a final product.
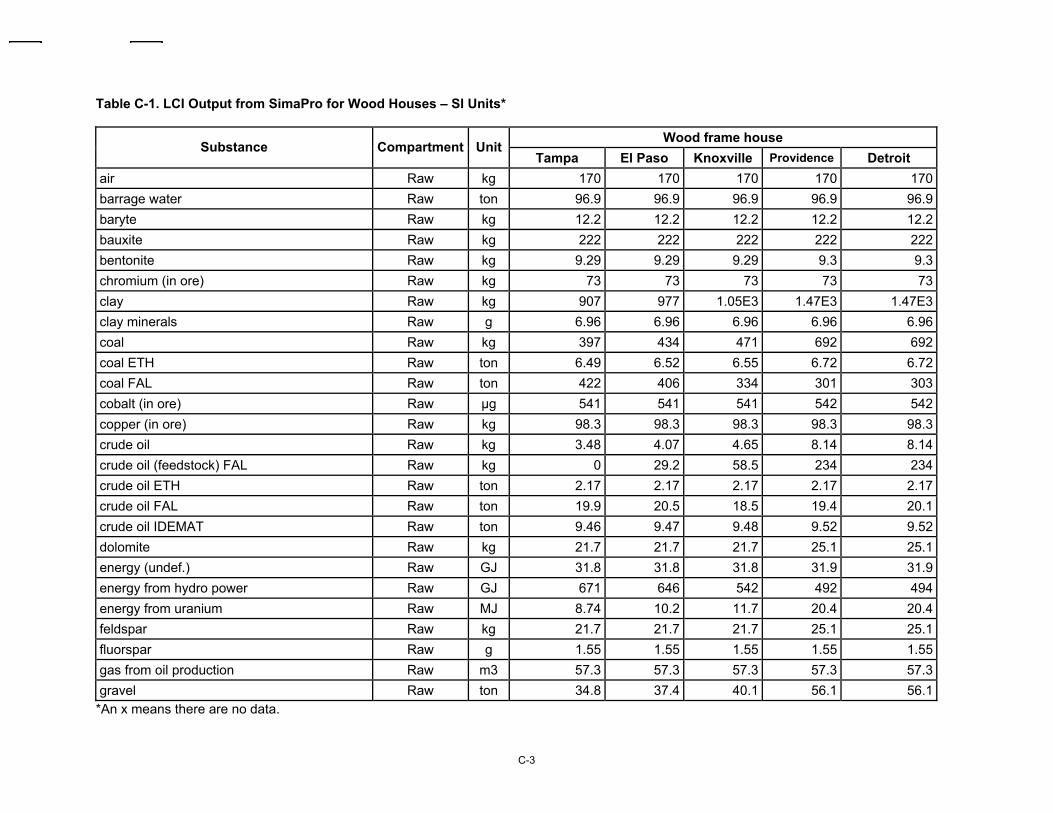
C-3
Table C-1. LCI Output from SimaPro for Wood Houses – SI Units*
Wood frame house Substance Compartment Unit
Tampa El Paso Knoxville Providence Detroit air Raw kg 170 170 170 170 170barrage water Raw ton 96.9 96.9 96.9 96.9 96.9baryte Raw kg 12.2 12.2 12.2 12.2 12.2bauxite Raw kg 222 222 222 222 222bentonite Raw kg 9.29 9.29 9.29 9.3 9.3chromium (in ore) Raw kg 73 73 73 73 73clay Raw kg 907 977 1.05E3 1.47E3 1.47E3clay minerals Raw g 6.96 6.96 6.96 6.96 6.96coal Raw kg 397 434 471 692 692coal ETH Raw ton 6.49 6.52 6.55 6.72 6.72coal FAL Raw ton 422 406 334 301 303cobalt (in ore) Raw µg 541 541 541 542 542copper (in ore) Raw kg 98.3 98.3 98.3 98.3 98.3crude oil Raw kg 3.48 4.07 4.65 8.14 8.14crude oil (feedstock) FAL Raw kg 0 29.2 58.5 234 234crude oil ETH Raw ton 2.17 2.17 2.17 2.17 2.17crude oil FAL Raw ton 19.9 20.5 18.5 19.4 20.1crude oil IDEMAT Raw ton 9.46 9.47 9.48 9.52 9.52dolomite Raw kg 21.7 21.7 21.7 25.1 25.1energy (undef.) Raw GJ 31.8 31.8 31.8 31.9 31.9energy from hydro power Raw GJ 671 646 542 492 494energy from uranium Raw MJ 8.74 10.2 11.7 20.4 20.4feldspar Raw kg 21.7 21.7 21.7 25.1 25.1fluorspar Raw g 1.55 1.55 1.55 1.55 1.55gas from oil production Raw m3 57.3 57.3 57.3 57.3 57.3gravel Raw ton 34.8 37.4 40.1 56.1 56.1
*An x means there are no data.
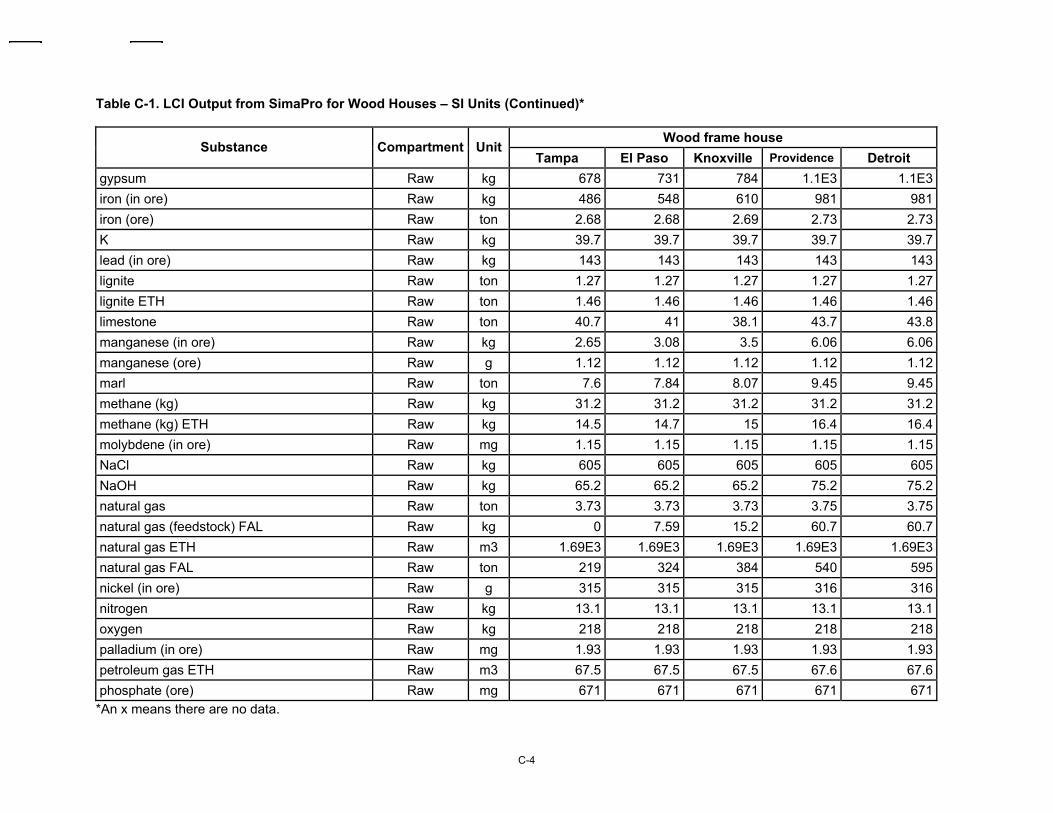
C-4
Table C-1. LCI Output from SimaPro for Wood Houses – SI Units (Continued)*
Wood frame house Substance Compartment Unit
Tampa El Paso Knoxville Providence Detroit gypsum Raw kg 678 731 784 1.1E3 1.1E3iron (in ore) Raw kg 486 548 610 981 981iron (ore) Raw ton 2.68 2.68 2.69 2.73 2.73K Raw kg 39.7 39.7 39.7 39.7 39.7lead (in ore) Raw kg 143 143 143 143 143lignite Raw ton 1.27 1.27 1.27 1.27 1.27lignite ETH Raw ton 1.46 1.46 1.46 1.46 1.46limestone Raw ton 40.7 41 38.1 43.7 43.8manganese (in ore) Raw kg 2.65 3.08 3.5 6.06 6.06manganese (ore) Raw g 1.12 1.12 1.12 1.12 1.12marl Raw ton 7.6 7.84 8.07 9.45 9.45methane (kg) Raw kg 31.2 31.2 31.2 31.2 31.2methane (kg) ETH Raw kg 14.5 14.7 15 16.4 16.4molybdene (in ore) Raw mg 1.15 1.15 1.15 1.15 1.15NaCl Raw kg 605 605 605 605 605NaOH Raw kg 65.2 65.2 65.2 75.2 75.2natural gas Raw ton 3.73 3.73 3.73 3.75 3.75natural gas (feedstock) FAL Raw kg 0 7.59 15.2 60.7 60.7natural gas ETH Raw m3 1.69E3 1.69E3 1.69E3 1.69E3 1.69E3natural gas FAL Raw ton 219 324 384 540 595nickel (in ore) Raw g 315 315 315 316 316nitrogen Raw kg 13.1 13.1 13.1 13.1 13.1oxygen Raw kg 218 218 218 218 218palladium (in ore) Raw mg 1.93 1.93 1.93 1.93 1.93petroleum gas ETH Raw m3 67.5 67.5 67.5 67.6 67.6phosphate (ore) Raw mg 671 671 671 671 671
*An x means there are no data.
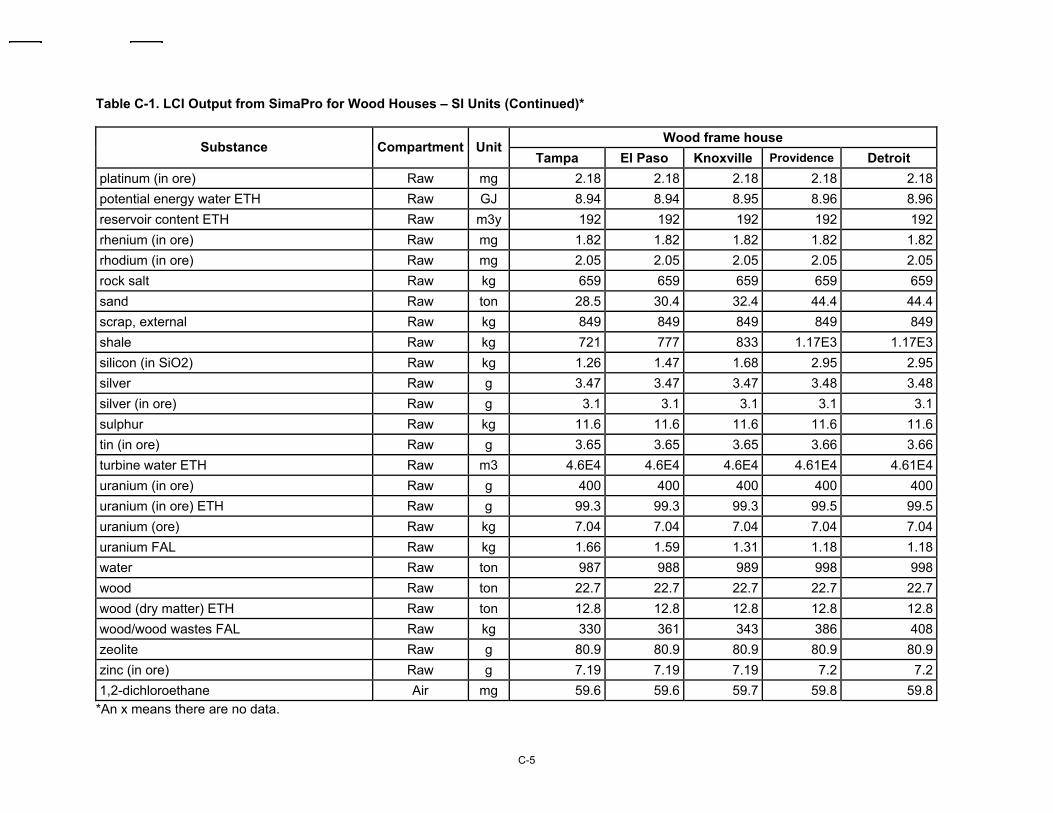
C-5
Table C-1. LCI Output from SimaPro for Wood Houses – SI Units (Continued)*
Wood frame house Substance Compartment Unit
Tampa El Paso Knoxville Providence Detroit platinum (in ore) Raw mg 2.18 2.18 2.18 2.18 2.18potential energy water ETH Raw GJ 8.94 8.94 8.95 8.96 8.96reservoir content ETH Raw m3y 192 192 192 192 192rhenium (in ore) Raw mg 1.82 1.82 1.82 1.82 1.82rhodium (in ore) Raw mg 2.05 2.05 2.05 2.05 2.05rock salt Raw kg 659 659 659 659 659sand Raw ton 28.5 30.4 32.4 44.4 44.4scrap, external Raw kg 849 849 849 849 849shale Raw kg 721 777 833 1.17E3 1.17E3silicon (in SiO2) Raw kg 1.26 1.47 1.68 2.95 2.95silver Raw g 3.47 3.47 3.47 3.48 3.48silver (in ore) Raw g 3.1 3.1 3.1 3.1 3.1sulphur Raw kg 11.6 11.6 11.6 11.6 11.6tin (in ore) Raw g 3.65 3.65 3.65 3.66 3.66turbine water ETH Raw m3 4.6E4 4.6E4 4.6E4 4.61E4 4.61E4uranium (in ore) Raw g 400 400 400 400 400uranium (in ore) ETH Raw g 99.3 99.3 99.3 99.5 99.5uranium (ore) Raw kg 7.04 7.04 7.04 7.04 7.04uranium FAL Raw kg 1.66 1.59 1.31 1.18 1.18water Raw ton 987 988 989 998 998wood Raw ton 22.7 22.7 22.7 22.7 22.7wood (dry matter) ETH Raw ton 12.8 12.8 12.8 12.8 12.8wood/wood wastes FAL Raw kg 330 361 343 386 408zeolite Raw g 80.9 80.9 80.9 80.9 80.9zinc (in ore) Raw g 7.19 7.19 7.19 7.2 7.21,2-dichloroethane Air mg 59.6 59.6 59.7 59.8 59.8
*An x means there are no data.
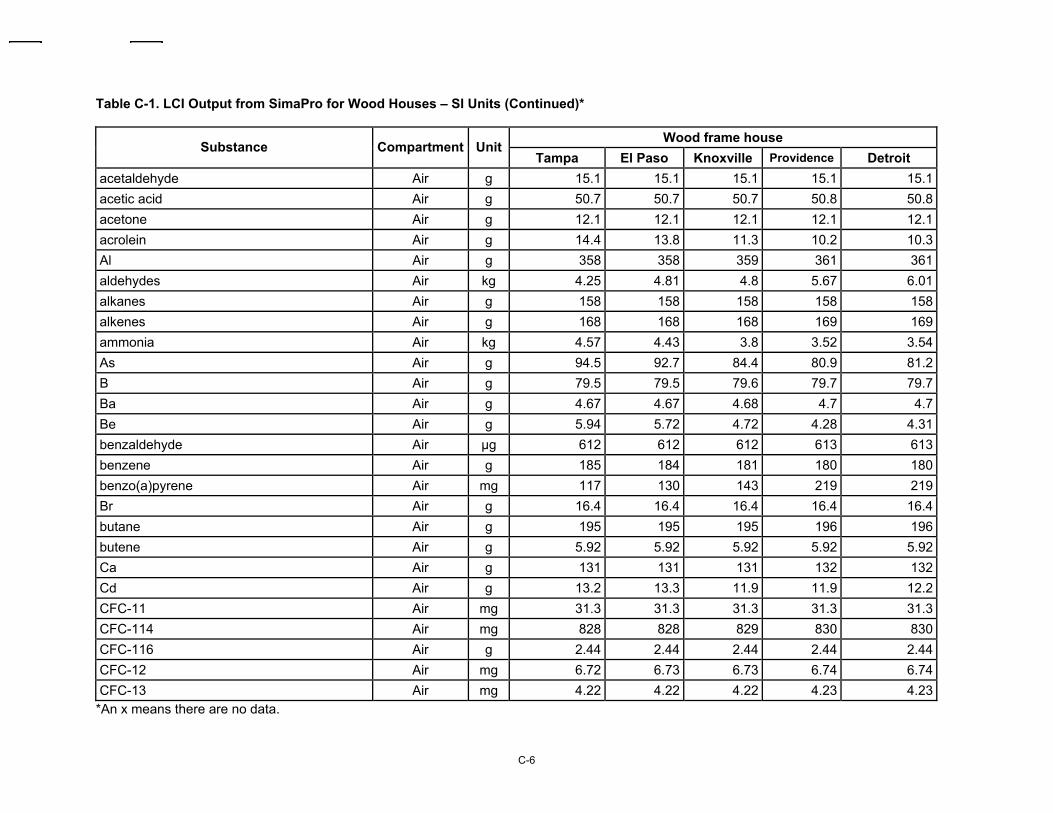
C-6
Table C-1. LCI Output from SimaPro for Wood Houses – SI Units (Continued)*
Wood frame house Substance Compartment Unit
Tampa El Paso Knoxville Providence Detroit acetaldehyde Air g 15.1 15.1 15.1 15.1 15.1acetic acid Air g 50.7 50.7 50.7 50.8 50.8acetone Air g 12.1 12.1 12.1 12.1 12.1acrolein Air g 14.4 13.8 11.3 10.2 10.3Al Air g 358 358 359 361 361aldehydes Air kg 4.25 4.81 4.8 5.67 6.01alkanes Air g 158 158 158 158 158alkenes Air g 168 168 168 169 169ammonia Air kg 4.57 4.43 3.8 3.52 3.54As Air g 94.5 92.7 84.4 80.9 81.2B Air g 79.5 79.5 79.6 79.7 79.7Ba Air g 4.67 4.67 4.68 4.7 4.7Be Air g 5.94 5.72 4.72 4.28 4.31benzaldehyde Air µg 612 612 612 613 613benzene Air g 185 184 181 180 180benzo(a)pyrene Air mg 117 130 143 219 219Br Air g 16.4 16.4 16.4 16.4 16.4butane Air g 195 195 195 196 196butene Air g 5.92 5.92 5.92 5.92 5.92Ca Air g 131 131 131 132 132Cd Air g 13.2 13.3 11.9 11.9 12.2CFC-11 Air mg 31.3 31.3 31.3 31.3 31.3CFC-114 Air mg 828 828 829 830 830CFC-116 Air g 2.44 2.44 2.44 2.44 2.44CFC-12 Air mg 6.72 6.73 6.73 6.74 6.74CFC-13 Air mg 4.22 4.22 4.22 4.23 4.23
*An x means there are no data.
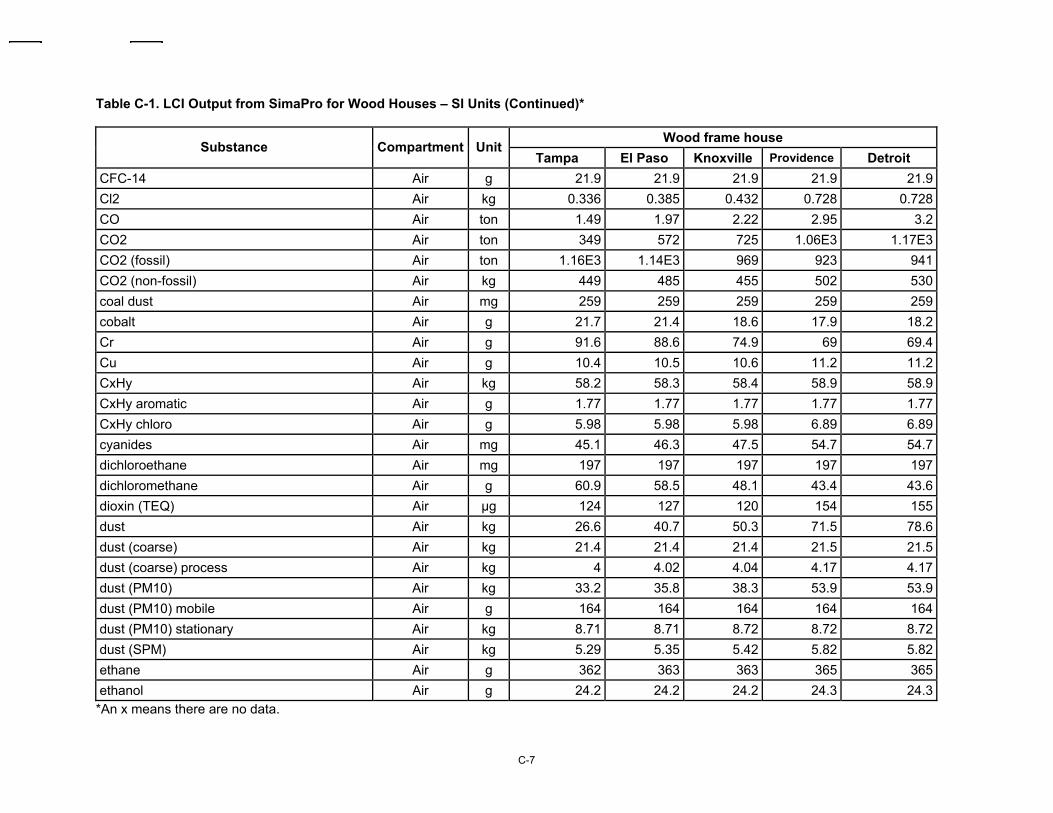
C-7
Table C-1. LCI Output from SimaPro for Wood Houses – SI Units (Continued)*
Wood frame house Substance Compartment Unit
Tampa El Paso Knoxville Providence Detroit CFC-14 Air g 21.9 21.9 21.9 21.9 21.9Cl2 Air kg 0.336 0.385 0.432 0.728 0.728CO Air ton 1.49 1.97 2.22 2.95 3.2CO2 Air ton 349 572 725 1.06E3 1.17E3CO2 (fossil) Air ton 1.16E3 1.14E3 969 923 941CO2 (non-fossil) Air kg 449 485 455 502 530coal dust Air mg 259 259 259 259 259cobalt Air g 21.7 21.4 18.6 17.9 18.2Cr Air g 91.6 88.6 74.9 69 69.4Cu Air g 10.4 10.5 10.6 11.2 11.2CxHy Air kg 58.2 58.3 58.4 58.9 58.9CxHy aromatic Air g 1.77 1.77 1.77 1.77 1.77CxHy chloro Air g 5.98 5.98 5.98 6.89 6.89cyanides Air mg 45.1 46.3 47.5 54.7 54.7dichloroethane Air mg 197 197 197 197 197dichloromethane Air g 60.9 58.5 48.1 43.4 43.6dioxin (TEQ) Air µg 124 127 120 154 155dust Air kg 26.6 40.7 50.3 71.5 78.6dust (coarse) Air kg 21.4 21.4 21.4 21.5 21.5dust (coarse) process Air kg 4 4.02 4.04 4.17 4.17dust (PM10) Air kg 33.2 35.8 38.3 53.9 53.9dust (PM10) mobile Air g 164 164 164 164 164dust (PM10) stationary Air kg 8.71 8.71 8.72 8.72 8.72dust (SPM) Air kg 5.29 5.35 5.42 5.82 5.82ethane Air g 362 363 363 365 365ethanol Air g 24.2 24.2 24.2 24.3 24.3
*An x means there are no data.
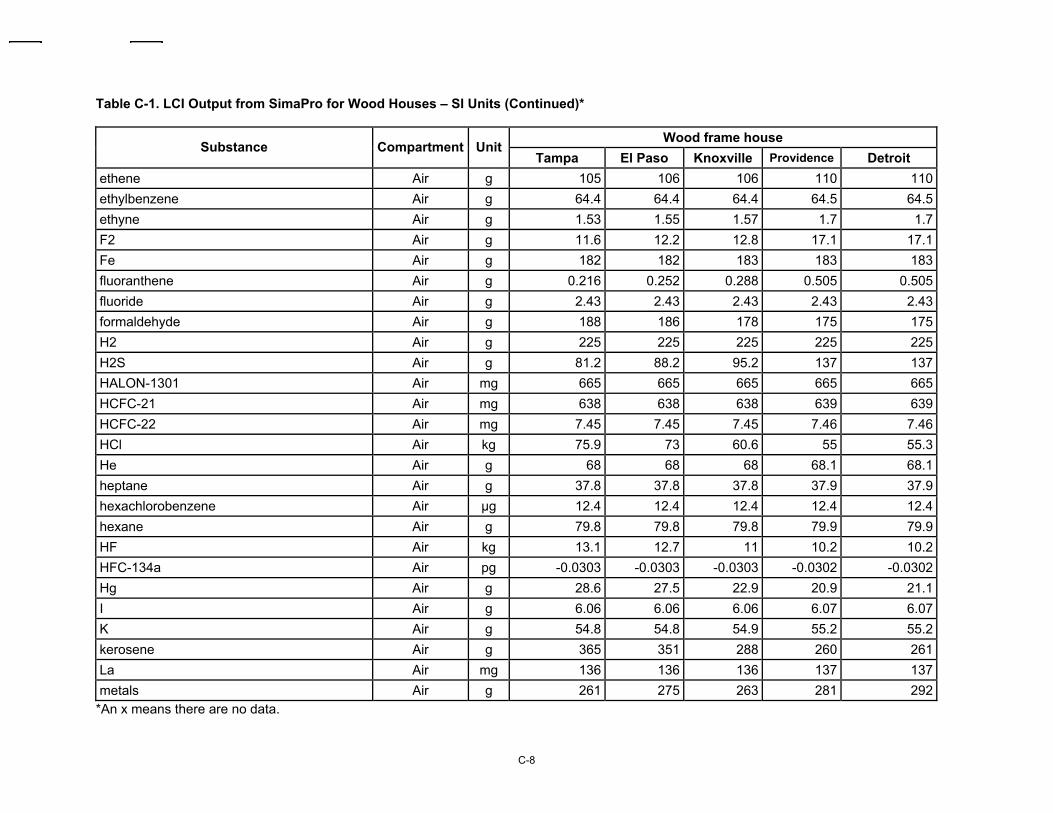
C-8
Table C-1. LCI Output from SimaPro for Wood Houses – SI Units (Continued)*
Wood frame house Substance Compartment Unit
Tampa El Paso Knoxville Providence Detroit ethene Air g 105 106 106 110 110ethylbenzene Air g 64.4 64.4 64.4 64.5 64.5ethyne Air g 1.53 1.55 1.57 1.7 1.7F2 Air g 11.6 12.2 12.8 17.1 17.1Fe Air g 182 182 183 183 183fluoranthene Air g 0.216 0.252 0.288 0.505 0.505fluoride Air g 2.43 2.43 2.43 2.43 2.43formaldehyde Air g 188 186 178 175 175H2 Air g 225 225 225 225 225H2S Air g 81.2 88.2 95.2 137 137HALON-1301 Air mg 665 665 665 665 665HCFC-21 Air mg 638 638 638 639 639HCFC-22 Air mg 7.45 7.45 7.45 7.46 7.46HCl Air kg 75.9 73 60.6 55 55.3He Air g 68 68 68 68.1 68.1heptane Air g 37.8 37.8 37.8 37.9 37.9hexachlorobenzene Air µg 12.4 12.4 12.4 12.4 12.4hexane Air g 79.8 79.8 79.8 79.9 79.9HF Air kg 13.1 12.7 11 10.2 10.2HFC-134a Air pg -0.0303 -0.0303 -0.0303 -0.0302 -0.0302Hg Air g 28.6 27.5 22.9 20.9 21.1I Air g 6.06 6.06 6.06 6.07 6.07K Air g 54.8 54.8 54.9 55.2 55.2kerosene Air g 365 351 288 260 261La Air mg 136 136 136 137 137metals Air g 261 275 263 281 292
*An x means there are no data.
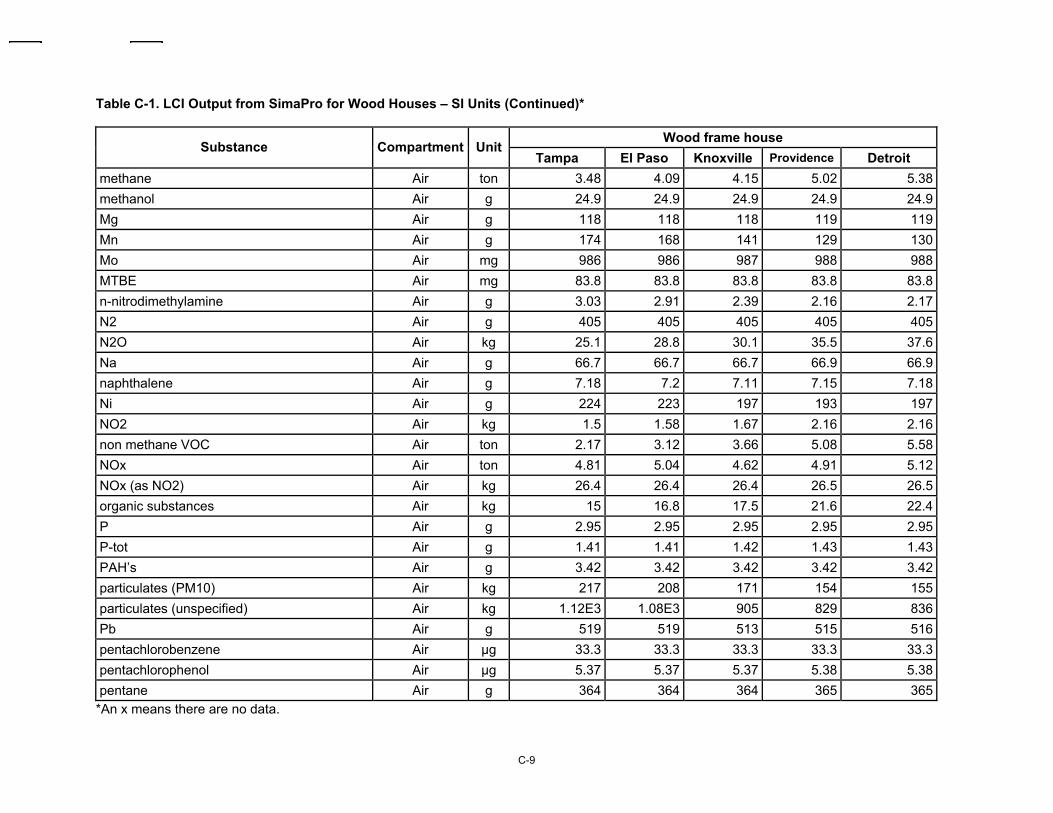
C-9
Table C-1. LCI Output from SimaPro for Wood Houses – SI Units (Continued)*
Wood frame house Substance Compartment Unit
Tampa El Paso Knoxville Providence Detroit methane Air ton 3.48 4.09 4.15 5.02 5.38methanol Air g 24.9 24.9 24.9 24.9 24.9Mg Air g 118 118 118 119 119Mn Air g 174 168 141 129 130Mo Air mg 986 986 987 988 988MTBE Air mg 83.8 83.8 83.8 83.8 83.8n-nitrodimethylamine Air g 3.03 2.91 2.39 2.16 2.17N2 Air g 405 405 405 405 405N2O Air kg 25.1 28.8 30.1 35.5 37.6Na Air g 66.7 66.7 66.7 66.9 66.9naphthalene Air g 7.18 7.2 7.11 7.15 7.18Ni Air g 224 223 197 193 197NO2 Air kg 1.5 1.58 1.67 2.16 2.16non methane VOC Air ton 2.17 3.12 3.66 5.08 5.58NOx Air ton 4.81 5.04 4.62 4.91 5.12NOx (as NO2) Air kg 26.4 26.4 26.4 26.5 26.5organic substances Air kg 15 16.8 17.5 21.6 22.4P Air g 2.95 2.95 2.95 2.95 2.95P-tot Air g 1.41 1.41 1.42 1.43 1.43PAH’s Air g 3.42 3.42 3.42 3.42 3.42particulates (PM10) Air kg 217 208 171 154 155particulates (unspecified) Air kg 1.12E3 1.08E3 905 829 836Pb Air g 519 519 513 515 516pentachlorobenzene Air µg 33.3 33.3 33.3 33.3 33.3pentachlorophenol Air µg 5.37 5.37 5.37 5.38 5.38pentane Air g 364 364 364 365 365
*An x means there are no data.
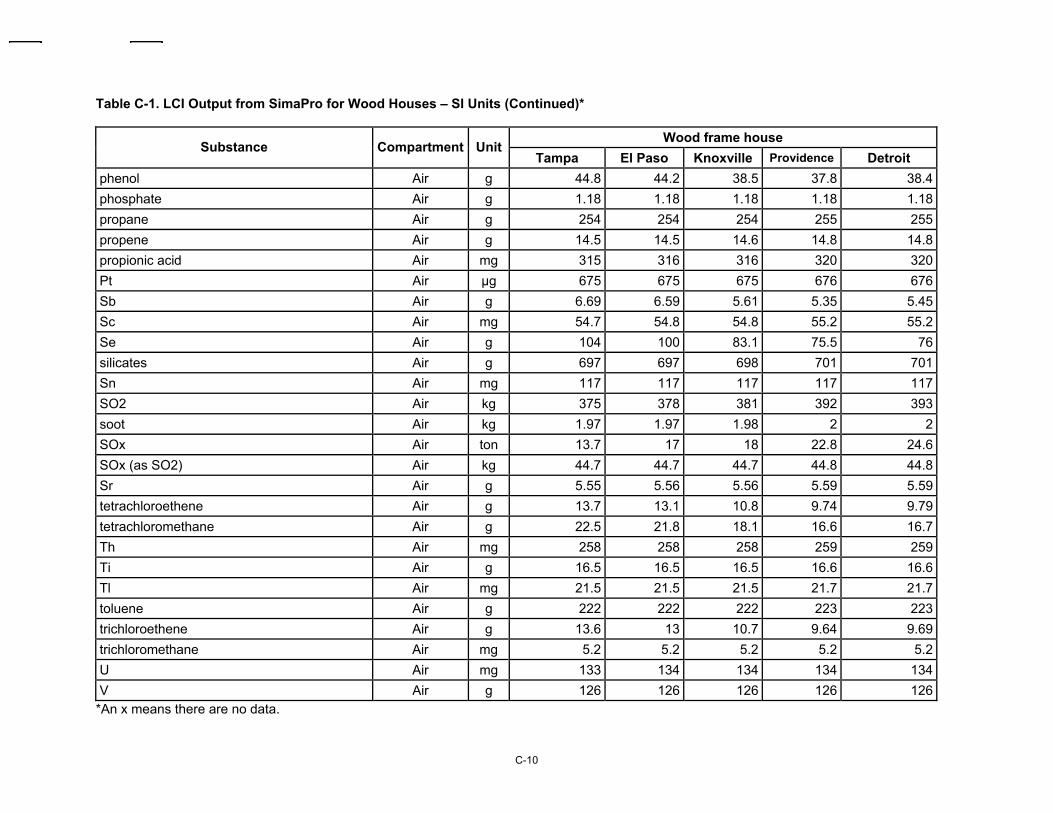
C-10
Table C-1. LCI Output from SimaPro for Wood Houses – SI Units (Continued)*
Wood frame house Substance Compartment Unit
Tampa El Paso Knoxville Providence Detroit phenol Air g 44.8 44.2 38.5 37.8 38.4phosphate Air g 1.18 1.18 1.18 1.18 1.18propane Air g 254 254 254 255 255propene Air g 14.5 14.5 14.6 14.8 14.8propionic acid Air mg 315 316 316 320 320Pt Air µg 675 675 675 676 676Sb Air g 6.69 6.59 5.61 5.35 5.45Sc Air mg 54.7 54.8 54.8 55.2 55.2Se Air g 104 100 83.1 75.5 76silicates Air g 697 697 698 701 701Sn Air mg 117 117 117 117 117SO2 Air kg 375 378 381 392 393soot Air kg 1.97 1.97 1.98 2 2SOx Air ton 13.7 17 18 22.8 24.6SOx (as SO2) Air kg 44.7 44.7 44.7 44.8 44.8Sr Air g 5.55 5.56 5.56 5.59 5.59tetrachloroethene Air g 13.7 13.1 10.8 9.74 9.79tetrachloromethane Air g 22.5 21.8 18.1 16.6 16.7Th Air mg 258 258 258 259 259Ti Air g 16.5 16.5 16.5 16.6 16.6Tl Air mg 21.5 21.5 21.5 21.7 21.7toluene Air g 222 222 222 223 223trichloroethene Air g 13.6 13 10.7 9.64 9.69trichloromethane Air mg 5.2 5.2 5.2 5.2 5.2U Air mg 133 134 134 134 134V Air g 126 126 126 126 126
*An x means there are no data.
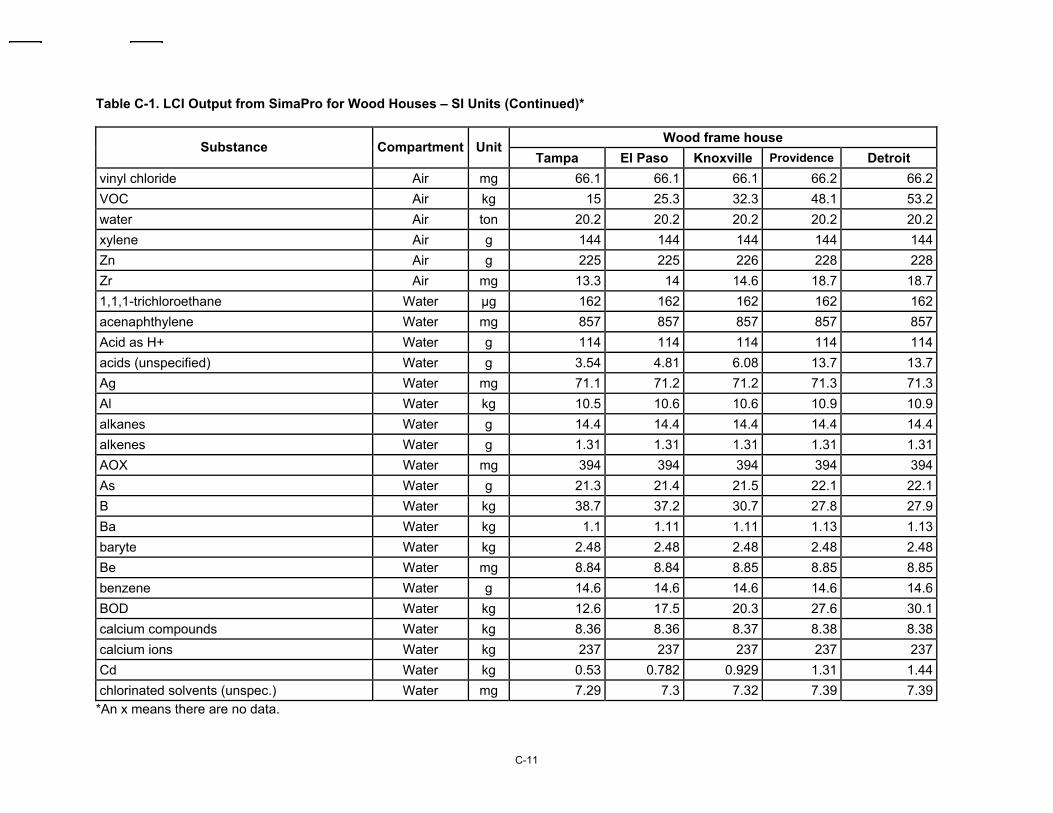
C-11
Table C-1. LCI Output from SimaPro for Wood Houses – SI Units (Continued)*
Wood frame house Substance Compartment Unit
Tampa El Paso Knoxville Providence Detroit vinyl chloride Air mg 66.1 66.1 66.1 66.2 66.2VOC Air kg 15 25.3 32.3 48.1 53.2water Air ton 20.2 20.2 20.2 20.2 20.2xylene Air g 144 144 144 144 144Zn Air g 225 225 226 228 228Zr Air mg 13.3 14 14.6 18.7 18.71,1,1-trichloroethane Water µg 162 162 162 162 162acenaphthylene Water mg 857 857 857 857 857Acid as H+ Water g 114 114 114 114 114acids (unspecified) Water g 3.54 4.81 6.08 13.7 13.7Ag Water mg 71.1 71.2 71.2 71.3 71.3Al Water kg 10.5 10.6 10.6 10.9 10.9alkanes Water g 14.4 14.4 14.4 14.4 14.4alkenes Water g 1.31 1.31 1.31 1.31 1.31AOX Water mg 394 394 394 394 394As Water g 21.3 21.4 21.5 22.1 22.1B Water kg 38.7 37.2 30.7 27.8 27.9Ba Water kg 1.1 1.11 1.11 1.13 1.13baryte Water kg 2.48 2.48 2.48 2.48 2.48Be Water mg 8.84 8.84 8.85 8.85 8.85benzene Water g 14.6 14.6 14.6 14.6 14.6BOD Water kg 12.6 17.5 20.3 27.6 30.1calcium compounds Water kg 8.36 8.36 8.37 8.38 8.38calcium ions Water kg 237 237 237 237 237Cd Water kg 0.53 0.782 0.929 1.31 1.44chlorinated solvents (unspec.) Water mg 7.29 7.3 7.32 7.39 7.39
*An x means there are no data.
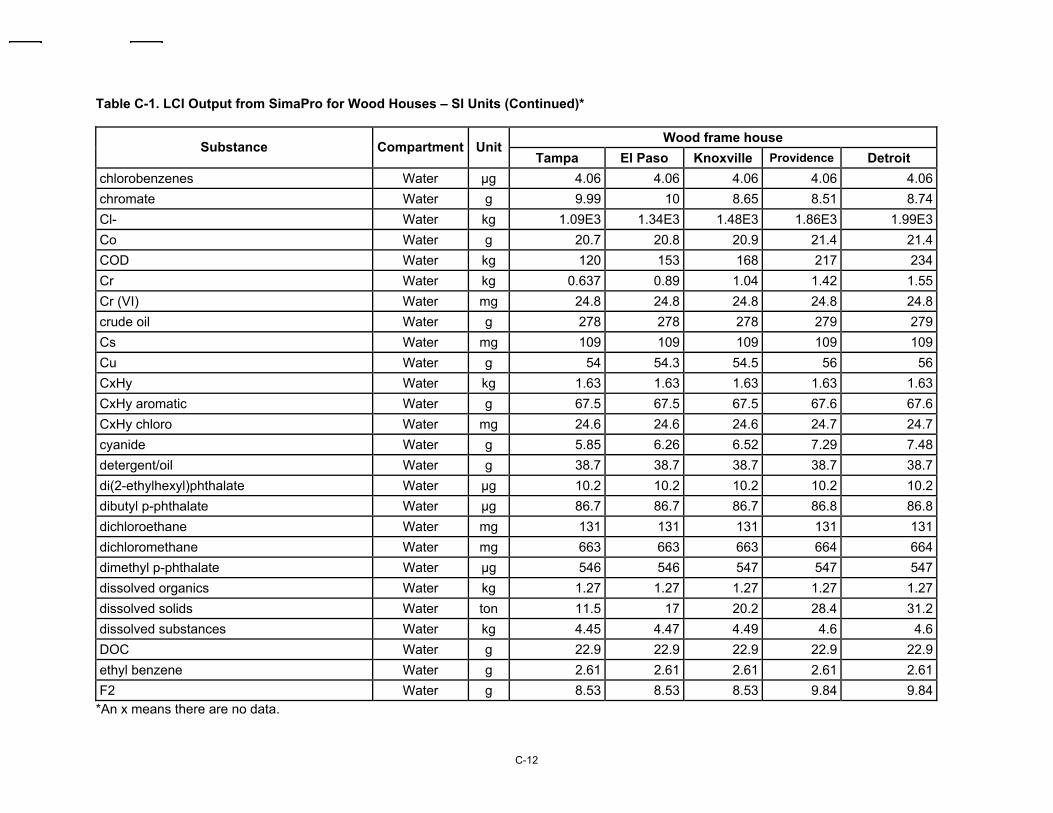
C-12
Table C-1. LCI Output from SimaPro for Wood Houses – SI Units (Continued)*
Wood frame house Substance Compartment Unit
Tampa El Paso Knoxville Providence Detroit chlorobenzenes Water µg 4.06 4.06 4.06 4.06 4.06chromate Water g 9.99 10 8.65 8.51 8.74Cl- Water kg 1.09E3 1.34E3 1.48E3 1.86E3 1.99E3Co Water g 20.7 20.8 20.9 21.4 21.4COD Water kg 120 153 168 217 234Cr Water kg 0.637 0.89 1.04 1.42 1.55Cr (VI) Water mg 24.8 24.8 24.8 24.8 24.8crude oil Water g 278 278 278 279 279Cs Water mg 109 109 109 109 109Cu Water g 54 54.3 54.5 56 56CxHy Water kg 1.63 1.63 1.63 1.63 1.63CxHy aromatic Water g 67.5 67.5 67.5 67.6 67.6CxHy chloro Water mg 24.6 24.6 24.6 24.7 24.7cyanide Water g 5.85 6.26 6.52 7.29 7.48detergent/oil Water g 38.7 38.7 38.7 38.7 38.7di(2-ethylhexyl)phthalate Water µg 10.2 10.2 10.2 10.2 10.2dibutyl p-phthalate Water µg 86.7 86.7 86.7 86.8 86.8dichloroethane Water mg 131 131 131 131 131dichloromethane Water mg 663 663 663 664 664dimethyl p-phthalate Water µg 546 546 547 547 547dissolved organics Water kg 1.27 1.27 1.27 1.27 1.27dissolved solids Water ton 11.5 17 20.2 28.4 31.2dissolved substances Water kg 4.45 4.47 4.49 4.6 4.6DOC Water g 22.9 22.9 22.9 22.9 22.9ethyl benzene Water g 2.61 2.61 2.61 2.61 2.61F2 Water g 8.53 8.53 8.53 9.84 9.84
*An x means there are no data.
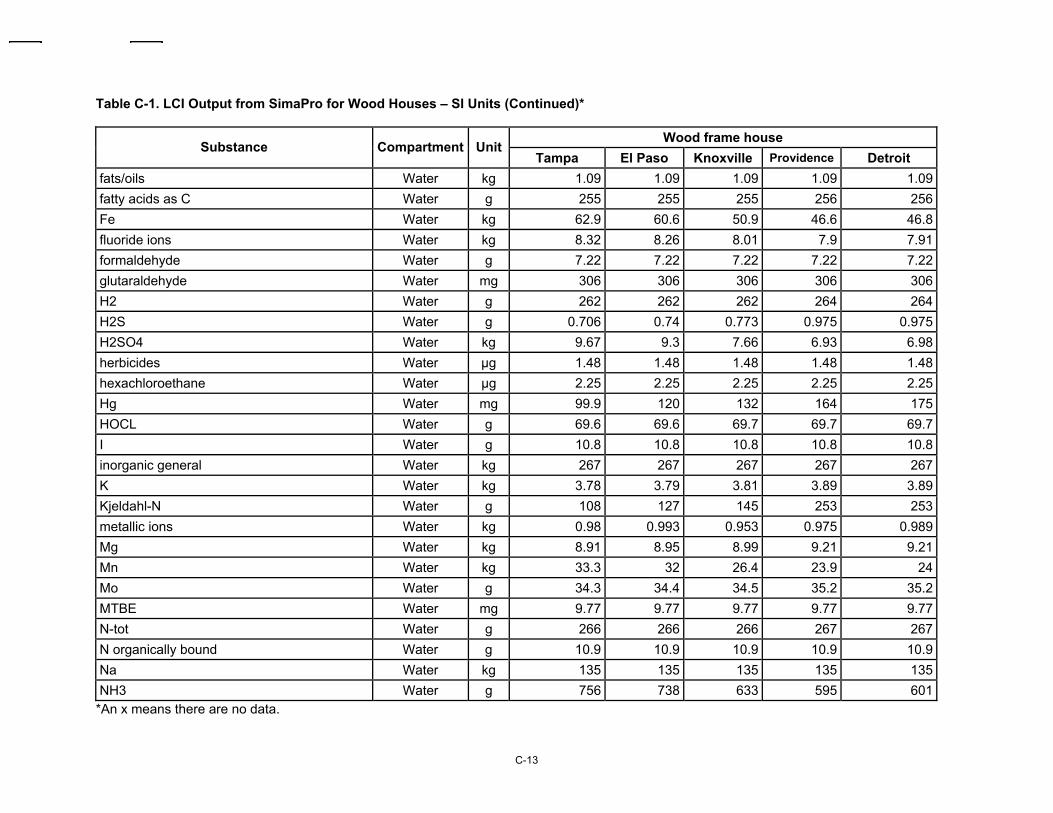
C-13
Table C-1. LCI Output from SimaPro for Wood Houses – SI Units (Continued)*
Wood frame house Substance Compartment Unit
Tampa El Paso Knoxville Providence Detroit fats/oils Water kg 1.09 1.09 1.09 1.09 1.09fatty acids as C Water g 255 255 255 256 256Fe Water kg 62.9 60.6 50.9 46.6 46.8fluoride ions Water kg 8.32 8.26 8.01 7.9 7.91formaldehyde Water g 7.22 7.22 7.22 7.22 7.22glutaraldehyde Water mg 306 306 306 306 306H2 Water g 262 262 262 264 264H2S Water g 0.706 0.74 0.773 0.975 0.975H2SO4 Water kg 9.67 9.3 7.66 6.93 6.98herbicides Water µg 1.48 1.48 1.48 1.48 1.48hexachloroethane Water µg 2.25 2.25 2.25 2.25 2.25Hg Water mg 99.9 120 132 164 175HOCL Water g 69.6 69.6 69.7 69.7 69.7I Water g 10.8 10.8 10.8 10.8 10.8inorganic general Water kg 267 267 267 267 267K Water kg 3.78 3.79 3.81 3.89 3.89Kjeldahl-N Water g 108 127 145 253 253metallic ions Water kg 0.98 0.993 0.953 0.975 0.989Mg Water kg 8.91 8.95 8.99 9.21 9.21Mn Water kg 33.3 32 26.4 23.9 24Mo Water g 34.3 34.4 34.5 35.2 35.2MTBE Water mg 9.77 9.77 9.77 9.77 9.77N-tot Water g 266 266 266 267 267N organically bound Water g 10.9 10.9 10.9 10.9 10.9Na Water kg 135 135 135 135 135NH3 Water g 756 738 633 595 601
*An x means there are no data.
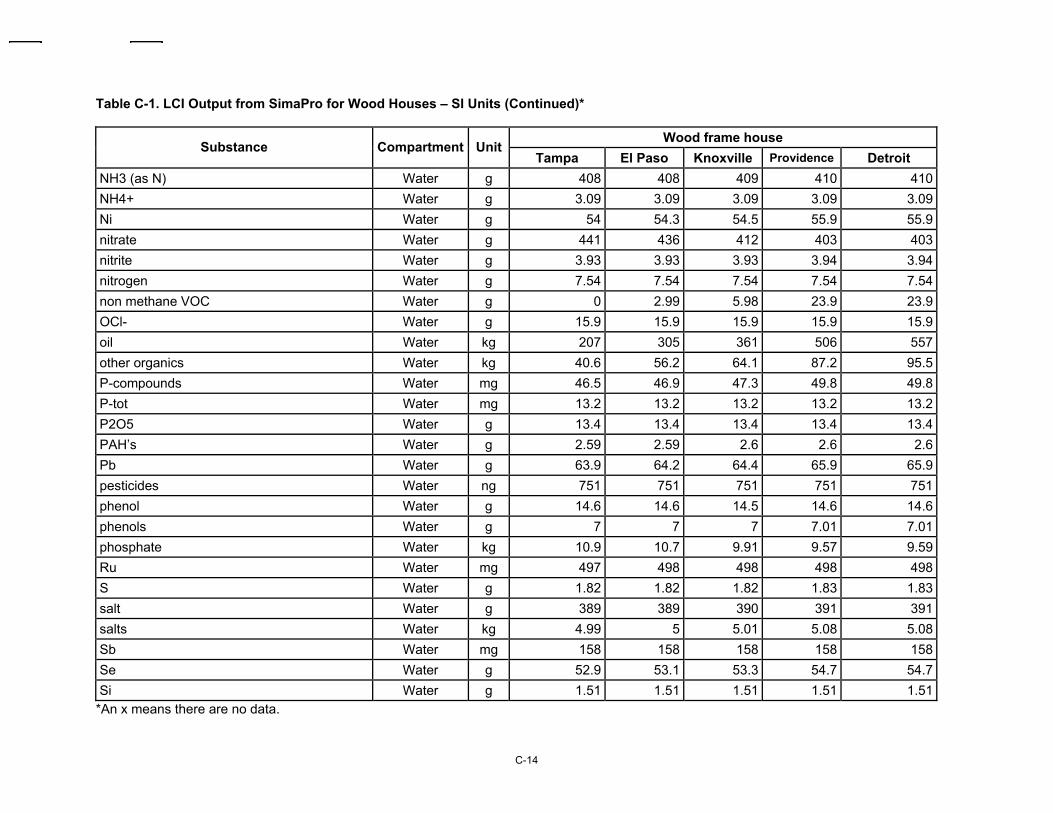
C-14
Table C-1. LCI Output from SimaPro for Wood Houses – SI Units (Continued)*
Wood frame house Substance Compartment Unit
Tampa El Paso Knoxville Providence Detroit NH3 (as N) Water g 408 408 409 410 410NH4+ Water g 3.09 3.09 3.09 3.09 3.09Ni Water g 54 54.3 54.5 55.9 55.9nitrate Water g 441 436 412 403 403nitrite Water g 3.93 3.93 3.93 3.94 3.94nitrogen Water g 7.54 7.54 7.54 7.54 7.54non methane VOC Water g 0 2.99 5.98 23.9 23.9OCl- Water g 15.9 15.9 15.9 15.9 15.9oil Water kg 207 305 361 506 557other organics Water kg 40.6 56.2 64.1 87.2 95.5P-compounds Water mg 46.5 46.9 47.3 49.8 49.8P-tot Water mg 13.2 13.2 13.2 13.2 13.2P2O5 Water g 13.4 13.4 13.4 13.4 13.4PAH’s Water g 2.59 2.59 2.6 2.6 2.6Pb Water g 63.9 64.2 64.4 65.9 65.9pesticides Water ng 751 751 751 751 751phenol Water g 14.6 14.6 14.5 14.6 14.6phenols Water g 7 7 7 7.01 7.01phosphate Water kg 10.9 10.7 9.91 9.57 9.59Ru Water mg 497 498 498 498 498S Water g 1.82 1.82 1.82 1.83 1.83salt Water g 389 389 390 391 391salts Water kg 4.99 5 5.01 5.08 5.08Sb Water mg 158 158 158 158 158Se Water g 52.9 53.1 53.3 54.7 54.7Si Water g 1.51 1.51 1.51 1.51 1.51
*An x means there are no data.
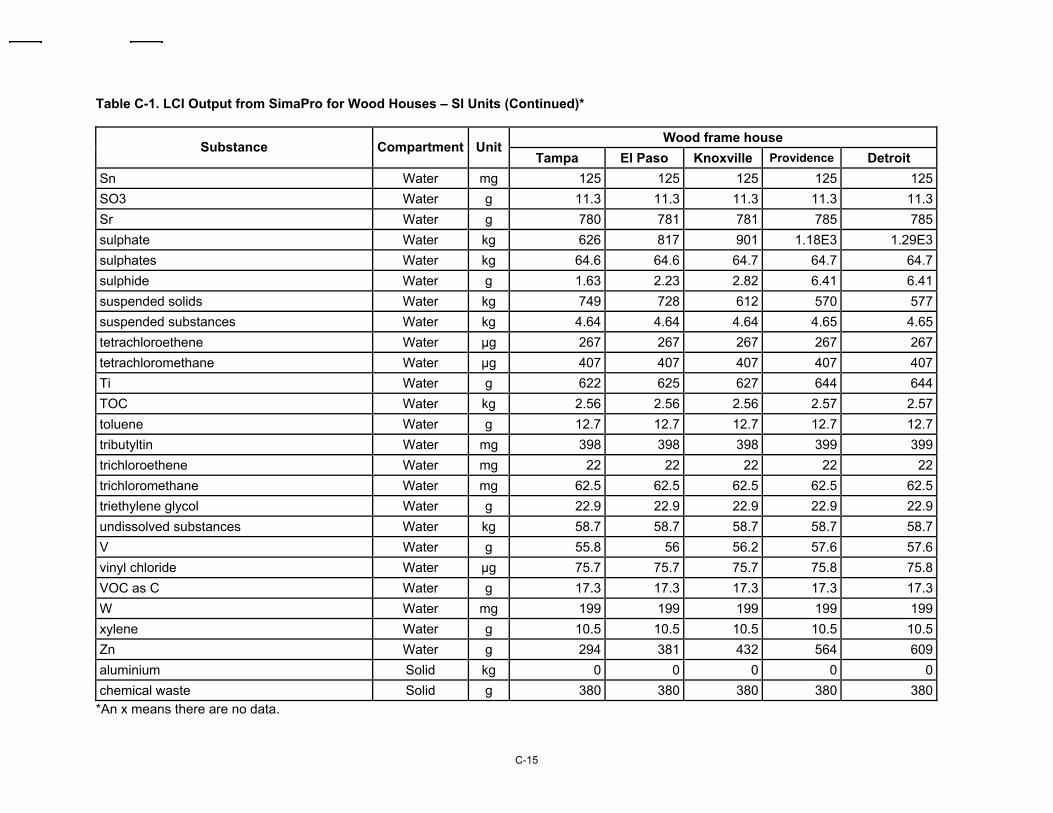
C-15
Table C-1. LCI Output from SimaPro for Wood Houses – SI Units (Continued)*
Wood frame house Substance Compartment Unit
Tampa El Paso Knoxville Providence Detroit Sn Water mg 125 125 125 125 125SO3 Water g 11.3 11.3 11.3 11.3 11.3Sr Water g 780 781 781 785 785sulphate Water kg 626 817 901 1.18E3 1.29E3sulphates Water kg 64.6 64.6 64.7 64.7 64.7sulphide Water g 1.63 2.23 2.82 6.41 6.41suspended solids Water kg 749 728 612 570 577suspended substances Water kg 4.64 4.64 4.64 4.65 4.65tetrachloroethene Water µg 267 267 267 267 267tetrachloromethane Water µg 407 407 407 407 407Ti Water g 622 625 627 644 644TOC Water kg 2.56 2.56 2.56 2.57 2.57toluene Water g 12.7 12.7 12.7 12.7 12.7tributyltin Water mg 398 398 398 399 399trichloroethene Water mg 22 22 22 22 22trichloromethane Water mg 62.5 62.5 62.5 62.5 62.5triethylene glycol Water g 22.9 22.9 22.9 22.9 22.9undissolved substances Water kg 58.7 58.7 58.7 58.7 58.7V Water g 55.8 56 56.2 57.6 57.6vinyl chloride Water µg 75.7 75.7 75.7 75.8 75.8VOC as C Water g 17.3 17.3 17.3 17.3 17.3W Water mg 199 199 199 199 199xylene Water g 10.5 10.5 10.5 10.5 10.5Zn Water g 294 381 432 564 609aluminium Solid kg 0 0 0 0 0chemical waste Solid g 380 380 380 380 380
*An x means there are no data.
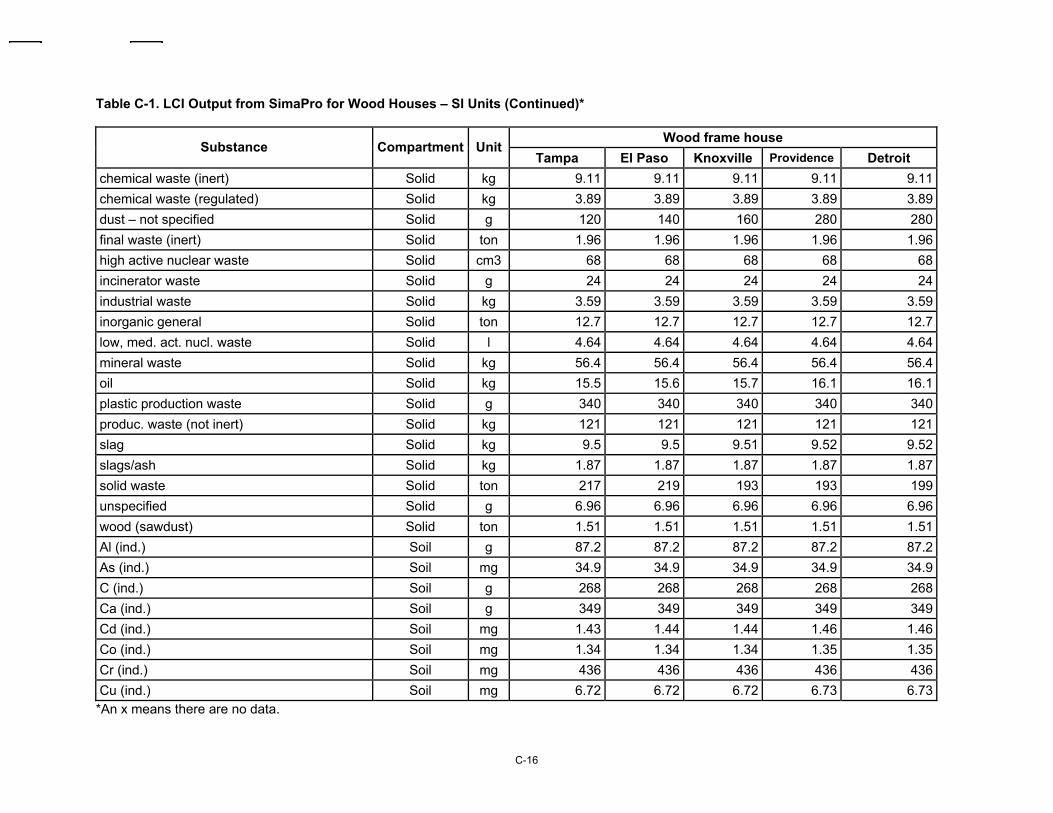
C-16
Table C-1. LCI Output from SimaPro for Wood Houses – SI Units (Continued)*
Wood frame house Substance Compartment Unit
Tampa El Paso Knoxville Providence Detroit chemical waste (inert) Solid kg 9.11 9.11 9.11 9.11 9.11chemical waste (regulated) Solid kg 3.89 3.89 3.89 3.89 3.89dust – not specified Solid g 120 140 160 280 280final waste (inert) Solid ton 1.96 1.96 1.96 1.96 1.96high active nuclear waste Solid cm3 68 68 68 68 68incinerator waste Solid g 24 24 24 24 24industrial waste Solid kg 3.59 3.59 3.59 3.59 3.59inorganic general Solid ton 12.7 12.7 12.7 12.7 12.7low, med. act. nucl. waste Solid l 4.64 4.64 4.64 4.64 4.64mineral waste Solid kg 56.4 56.4 56.4 56.4 56.4oil Solid kg 15.5 15.6 15.7 16.1 16.1plastic production waste Solid g 340 340 340 340 340produc. waste (not inert) Solid kg 121 121 121 121 121slag Solid kg 9.5 9.5 9.51 9.52 9.52slags/ash Solid kg 1.87 1.87 1.87 1.87 1.87solid waste Solid ton 217 219 193 193 199unspecified Solid g 6.96 6.96 6.96 6.96 6.96wood (sawdust) Solid ton 1.51 1.51 1.51 1.51 1.51Al (ind.) Soil g 87.2 87.2 87.2 87.2 87.2As (ind.) Soil mg 34.9 34.9 34.9 34.9 34.9C (ind.) Soil g 268 268 268 268 268Ca (ind.) Soil g 349 349 349 349 349Cd (ind.) Soil mg 1.43 1.44 1.44 1.46 1.46Co (ind.) Soil mg 1.34 1.34 1.34 1.35 1.35Cr (ind.) Soil mg 436 436 436 436 436Cu (ind.) Soil mg 6.72 6.72 6.72 6.73 6.73
*An x means there are no data.
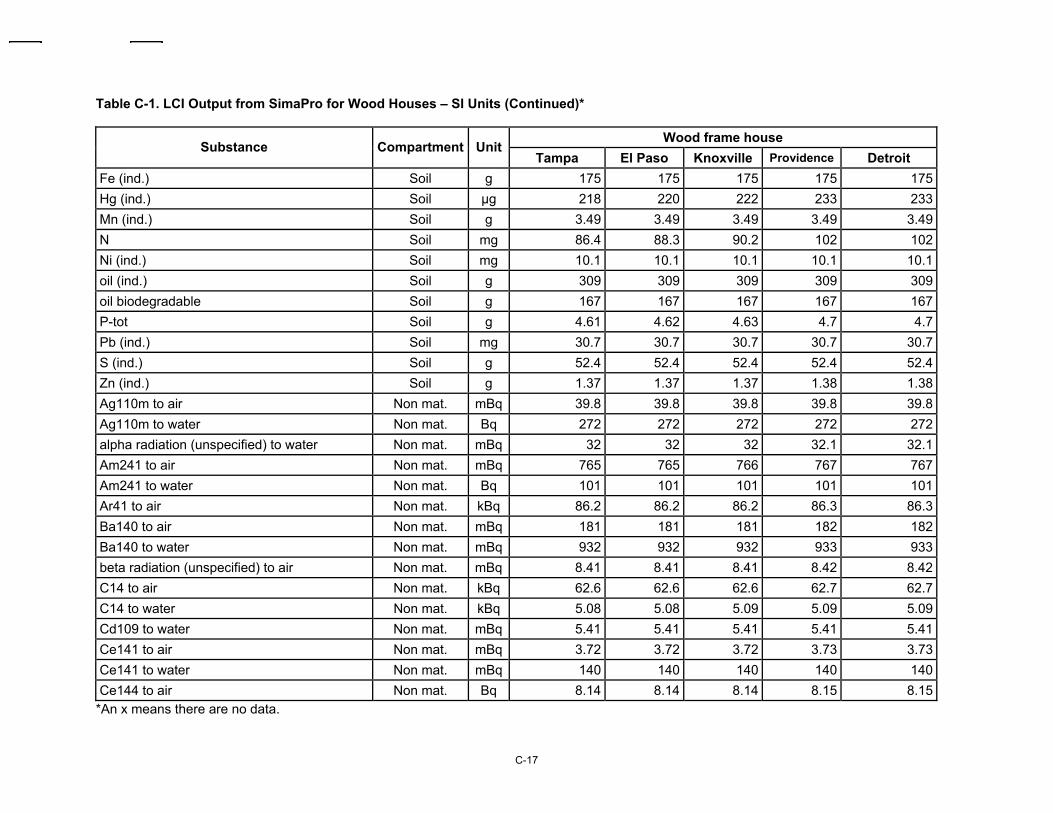
C-17
Table C-1. LCI Output from SimaPro for Wood Houses – SI Units (Continued)*
Wood frame house Substance Compartment Unit
Tampa El Paso Knoxville Providence Detroit Fe (ind.) Soil g 175 175 175 175 175Hg (ind.) Soil µg 218 220 222 233 233Mn (ind.) Soil g 3.49 3.49 3.49 3.49 3.49N Soil mg 86.4 88.3 90.2 102 102Ni (ind.) Soil mg 10.1 10.1 10.1 10.1 10.1oil (ind.) Soil g 309 309 309 309 309oil biodegradable Soil g 167 167 167 167 167P-tot Soil g 4.61 4.62 4.63 4.7 4.7Pb (ind.) Soil mg 30.7 30.7 30.7 30.7 30.7S (ind.) Soil g 52.4 52.4 52.4 52.4 52.4Zn (ind.) Soil g 1.37 1.37 1.37 1.38 1.38Ag110m to air Non mat. mBq 39.8 39.8 39.8 39.8 39.8Ag110m to water Non mat. Bq 272 272 272 272 272alpha radiation (unspecified) to water Non mat. mBq 32 32 32 32.1 32.1Am241 to air Non mat. mBq 765 765 766 767 767Am241 to water Non mat. Bq 101 101 101 101 101Ar41 to air Non mat. kBq 86.2 86.2 86.2 86.3 86.3Ba140 to air Non mat. mBq 181 181 181 182 182Ba140 to water Non mat. mBq 932 932 932 933 933beta radiation (unspecified) to air Non mat. mBq 8.41 8.41 8.41 8.42 8.42C14 to air Non mat. kBq 62.6 62.6 62.6 62.7 62.7C14 to water Non mat. kBq 5.08 5.08 5.09 5.09 5.09Cd109 to water Non mat. mBq 5.41 5.41 5.41 5.41 5.41Ce141 to air Non mat. mBq 3.72 3.72 3.72 3.73 3.73Ce141 to water Non mat. mBq 140 140 140 140 140Ce144 to air Non mat. Bq 8.14 8.14 8.14 8.15 8.15
*An x means there are no data.
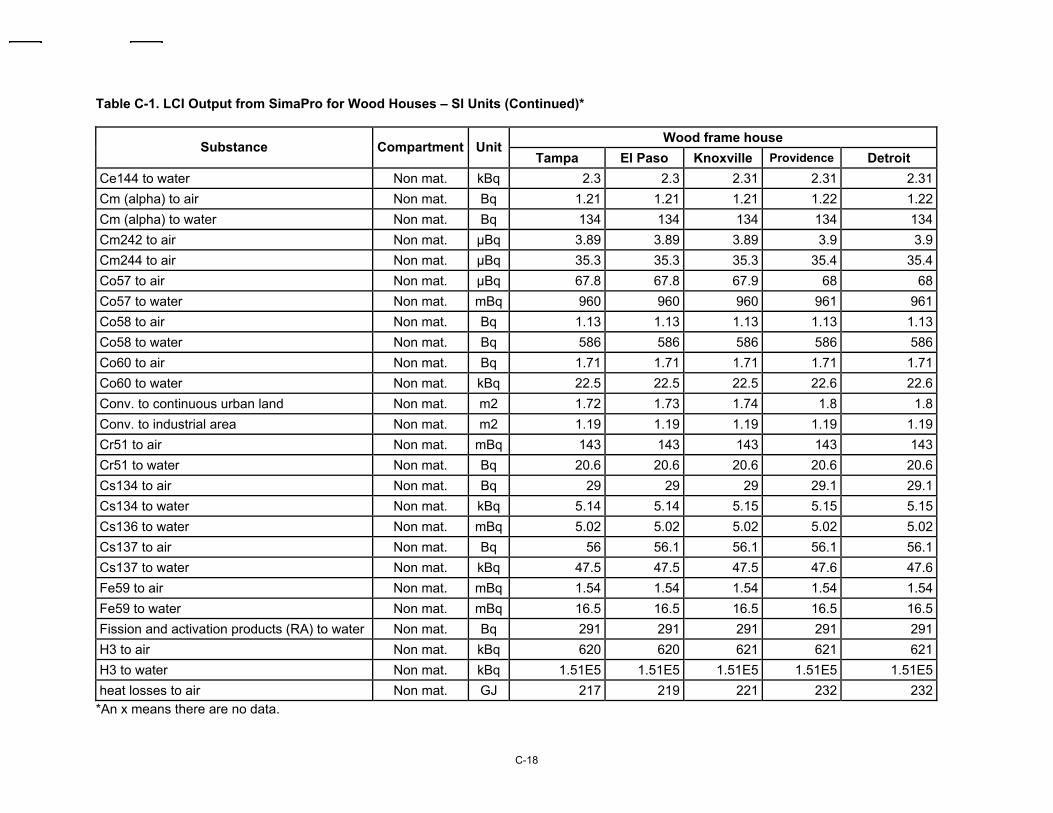
C-18
Table C-1. LCI Output from SimaPro for Wood Houses – SI Units (Continued)*
Wood frame house Substance Compartment Unit
Tampa El Paso Knoxville Providence Detroit Ce144 to water Non mat. kBq 2.3 2.3 2.31 2.31 2.31Cm (alpha) to air Non mat. Bq 1.21 1.21 1.21 1.22 1.22Cm (alpha) to water Non mat. Bq 134 134 134 134 134Cm242 to air Non mat. µBq 3.89 3.89 3.89 3.9 3.9Cm244 to air Non mat. µBq 35.3 35.3 35.3 35.4 35.4Co57 to air Non mat. µBq 67.8 67.8 67.9 68 68Co57 to water Non mat. mBq 960 960 960 961 961Co58 to air Non mat. Bq 1.13 1.13 1.13 1.13 1.13Co58 to water Non mat. Bq 586 586 586 586 586Co60 to air Non mat. Bq 1.71 1.71 1.71 1.71 1.71Co60 to water Non mat. kBq 22.5 22.5 22.5 22.6 22.6Conv. to continuous urban land Non mat. m2 1.72 1.73 1.74 1.8 1.8Conv. to industrial area Non mat. m2 1.19 1.19 1.19 1.19 1.19Cr51 to air Non mat. mBq 143 143 143 143 143Cr51 to water Non mat. Bq 20.6 20.6 20.6 20.6 20.6Cs134 to air Non mat. Bq 29 29 29 29.1 29.1Cs134 to water Non mat. kBq 5.14 5.14 5.15 5.15 5.15Cs136 to water Non mat. mBq 5.02 5.02 5.02 5.02 5.02Cs137 to air Non mat. Bq 56 56.1 56.1 56.1 56.1Cs137 to water Non mat. kBq 47.5 47.5 47.5 47.6 47.6Fe59 to air Non mat. mBq 1.54 1.54 1.54 1.54 1.54Fe59 to water Non mat. mBq 16.5 16.5 16.5 16.5 16.5Fission and activation products (RA) to water Non mat. Bq 291 291 291 291 291H3 to air Non mat. kBq 620 620 621 621 621H3 to water Non mat. kBq 1.51E5 1.51E5 1.51E5 1.51E5 1.51E5heat losses to air Non mat. GJ 217 219 221 232 232
*An x means there are no data.
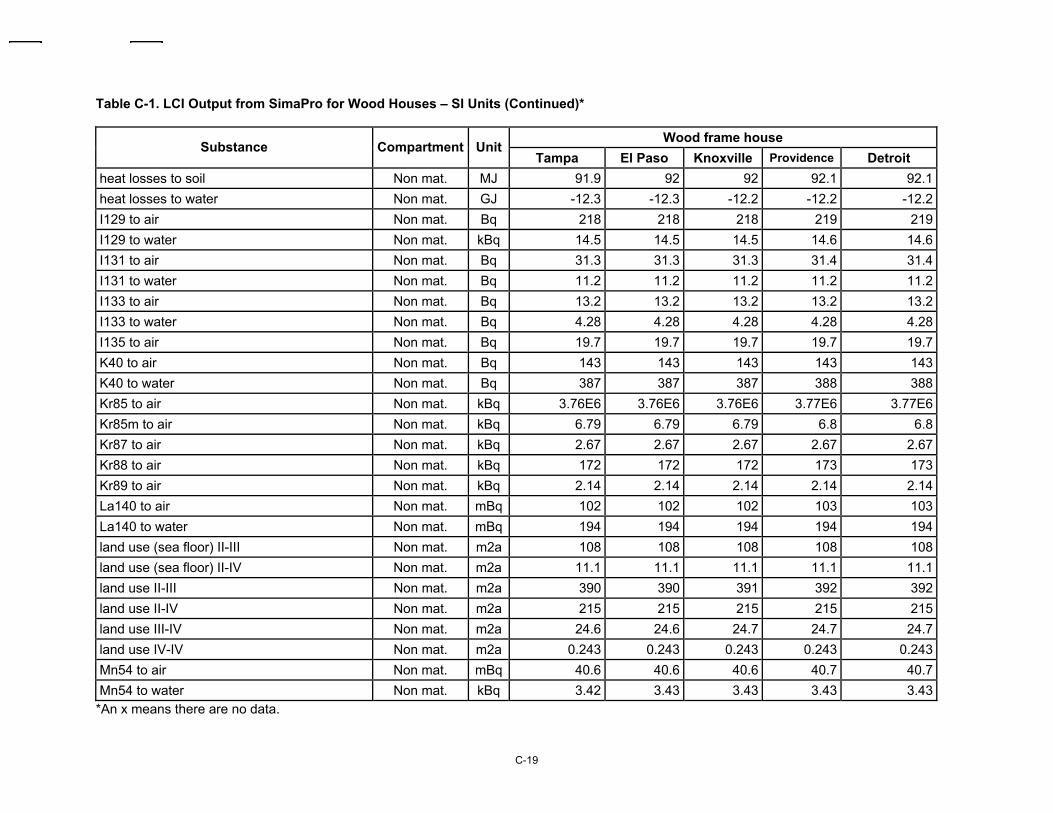
C-19
Table C-1. LCI Output from SimaPro for Wood Houses – SI Units (Continued)*
Wood frame house Substance Compartment Unit
Tampa El Paso Knoxville Providence Detroit heat losses to soil Non mat. MJ 91.9 92 92 92.1 92.1heat losses to water Non mat. GJ -12.3 -12.3 -12.2 -12.2 -12.2I129 to air Non mat. Bq 218 218 218 219 219I129 to water Non mat. kBq 14.5 14.5 14.5 14.6 14.6I131 to air Non mat. Bq 31.3 31.3 31.3 31.4 31.4I131 to water Non mat. Bq 11.2 11.2 11.2 11.2 11.2I133 to air Non mat. Bq 13.2 13.2 13.2 13.2 13.2I133 to water Non mat. Bq 4.28 4.28 4.28 4.28 4.28I135 to air Non mat. Bq 19.7 19.7 19.7 19.7 19.7K40 to air Non mat. Bq 143 143 143 143 143K40 to water Non mat. Bq 387 387 387 388 388Kr85 to air Non mat. kBq 3.76E6 3.76E6 3.76E6 3.77E6 3.77E6Kr85m to air Non mat. kBq 6.79 6.79 6.79 6.8 6.8Kr87 to air Non mat. kBq 2.67 2.67 2.67 2.67 2.67Kr88 to air Non mat. kBq 172 172 172 173 173Kr89 to air Non mat. kBq 2.14 2.14 2.14 2.14 2.14La140 to air Non mat. mBq 102 102 102 103 103La140 to water Non mat. mBq 194 194 194 194 194land use (sea floor) II-III Non mat. m2a 108 108 108 108 108land use (sea floor) II-IV Non mat. m2a 11.1 11.1 11.1 11.1 11.1land use II-III Non mat. m2a 390 390 391 392 392land use II-IV Non mat. m2a 215 215 215 215 215land use III-IV Non mat. m2a 24.6 24.6 24.7 24.7 24.7land use IV-IV Non mat. m2a 0.243 0.243 0.243 0.243 0.243Mn54 to air Non mat. mBq 40.6 40.6 40.6 40.7 40.7Mn54 to water Non mat. kBq 3.42 3.43 3.43 3.43 3.43
*An x means there are no data.
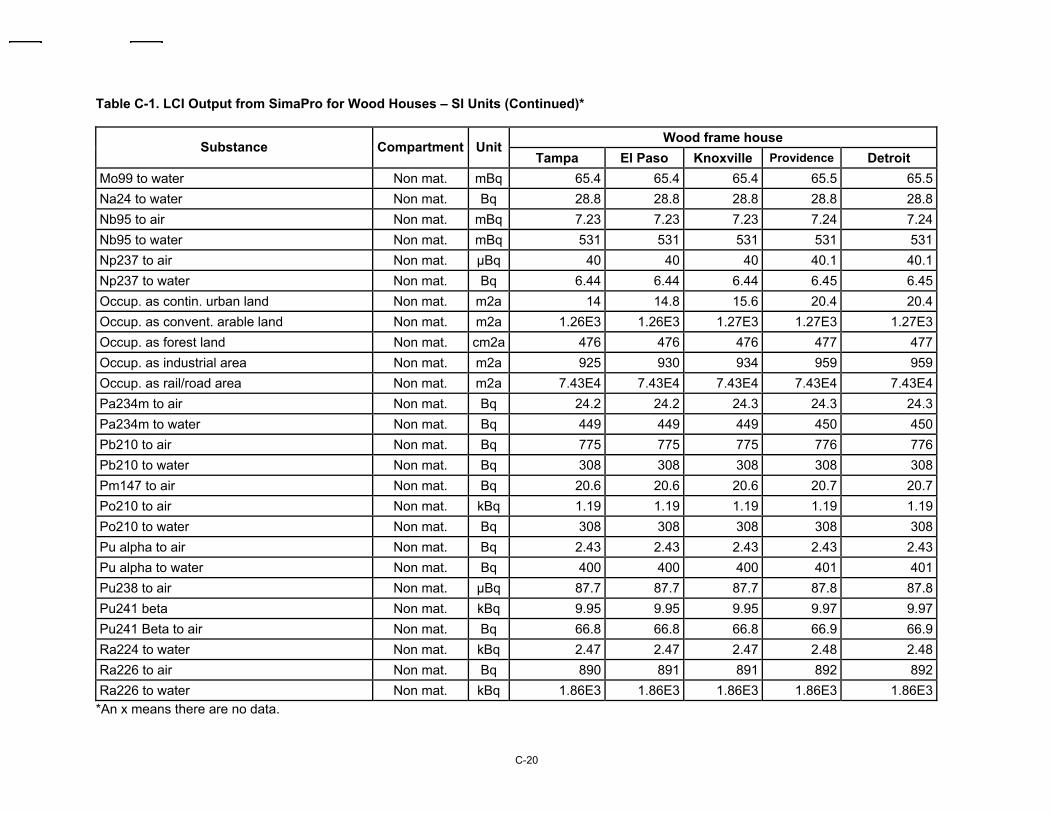
C-20
Table C-1. LCI Output from SimaPro for Wood Houses – SI Units (Continued)*
Wood frame house Substance Compartment Unit
Tampa El Paso Knoxville Providence Detroit Mo99 to water Non mat. mBq 65.4 65.4 65.4 65.5 65.5Na24 to water Non mat. Bq 28.8 28.8 28.8 28.8 28.8Nb95 to air Non mat. mBq 7.23 7.23 7.23 7.24 7.24Nb95 to water Non mat. mBq 531 531 531 531 531Np237 to air Non mat. µBq 40 40 40 40.1 40.1Np237 to water Non mat. Bq 6.44 6.44 6.44 6.45 6.45Occup. as contin. urban land Non mat. m2a 14 14.8 15.6 20.4 20.4Occup. as convent. arable land Non mat. m2a 1.26E3 1.26E3 1.27E3 1.27E3 1.27E3Occup. as forest land Non mat. cm2a 476 476 476 477 477Occup. as industrial area Non mat. m2a 925 930 934 959 959Occup. as rail/road area Non mat. m2a 7.43E4 7.43E4 7.43E4 7.43E4 7.43E4Pa234m to air Non mat. Bq 24.2 24.2 24.3 24.3 24.3Pa234m to water Non mat. Bq 449 449 449 450 450Pb210 to air Non mat. Bq 775 775 775 776 776Pb210 to water Non mat. Bq 308 308 308 308 308Pm147 to air Non mat. Bq 20.6 20.6 20.6 20.7 20.7Po210 to air Non mat. kBq 1.19 1.19 1.19 1.19 1.19Po210 to water Non mat. Bq 308 308 308 308 308Pu alpha to air Non mat. Bq 2.43 2.43 2.43 2.43 2.43Pu alpha to water Non mat. Bq 400 400 400 401 401Pu238 to air Non mat. µBq 87.7 87.7 87.7 87.8 87.8Pu241 beta Non mat. kBq 9.95 9.95 9.95 9.97 9.97Pu241 Beta to air Non mat. Bq 66.8 66.8 66.8 66.9 66.9Ra224 to water Non mat. kBq 2.47 2.47 2.47 2.48 2.48Ra226 to air Non mat. Bq 890 891 891 892 892Ra226 to water Non mat. kBq 1.86E3 1.86E3 1.86E3 1.86E3 1.86E3
*An x means there are no data.
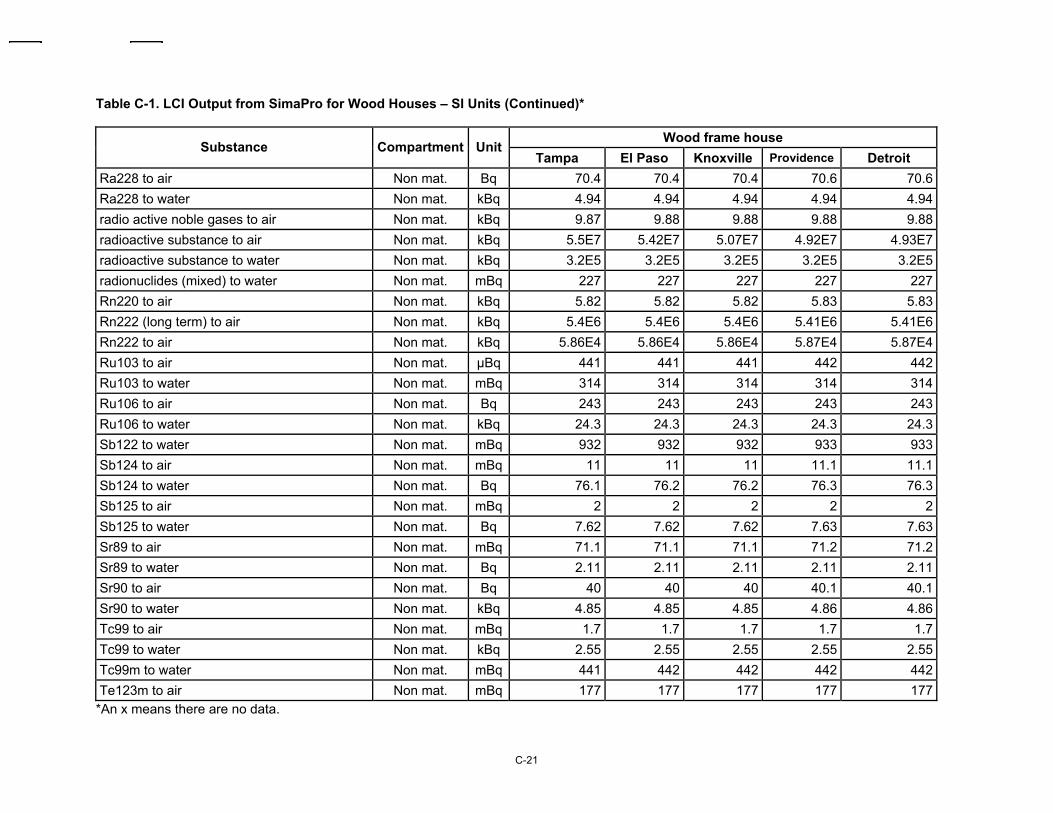
C-21
Table C-1. LCI Output from SimaPro for Wood Houses – SI Units (Continued)*
Wood frame house Substance Compartment Unit
Tampa El Paso Knoxville Providence Detroit Ra228 to air Non mat. Bq 70.4 70.4 70.4 70.6 70.6Ra228 to water Non mat. kBq 4.94 4.94 4.94 4.94 4.94radio active noble gases to air Non mat. kBq 9.87 9.88 9.88 9.88 9.88radioactive substance to air Non mat. kBq 5.5E7 5.42E7 5.07E7 4.92E7 4.93E7radioactive substance to water Non mat. kBq 3.2E5 3.2E5 3.2E5 3.2E5 3.2E5radionuclides (mixed) to water Non mat. mBq 227 227 227 227 227Rn220 to air Non mat. kBq 5.82 5.82 5.82 5.83 5.83Rn222 (long term) to air Non mat. kBq 5.4E6 5.4E6 5.4E6 5.41E6 5.41E6Rn222 to air Non mat. kBq 5.86E4 5.86E4 5.86E4 5.87E4 5.87E4Ru103 to air Non mat. µBq 441 441 441 442 442Ru103 to water Non mat. mBq 314 314 314 314 314Ru106 to air Non mat. Bq 243 243 243 243 243Ru106 to water Non mat. kBq 24.3 24.3 24.3 24.3 24.3Sb122 to water Non mat. mBq 932 932 932 933 933Sb124 to air Non mat. mBq 11 11 11 11.1 11.1Sb124 to water Non mat. Bq 76.1 76.2 76.2 76.3 76.3Sb125 to air Non mat. mBq 2 2 2 2 2Sb125 to water Non mat. Bq 7.62 7.62 7.62 7.63 7.63Sr89 to air Non mat. mBq 71.1 71.1 71.1 71.2 71.2Sr89 to water Non mat. Bq 2.11 2.11 2.11 2.11 2.11Sr90 to air Non mat. Bq 40 40 40 40.1 40.1Sr90 to water Non mat. kBq 4.85 4.85 4.85 4.86 4.86Tc99 to air Non mat. mBq 1.7 1.7 1.7 1.7 1.7Tc99 to water Non mat. kBq 2.55 2.55 2.55 2.55 2.55Tc99m to water Non mat. mBq 441 442 442 442 442Te123m to air Non mat. mBq 177 177 177 177 177
*An x means there are no data.
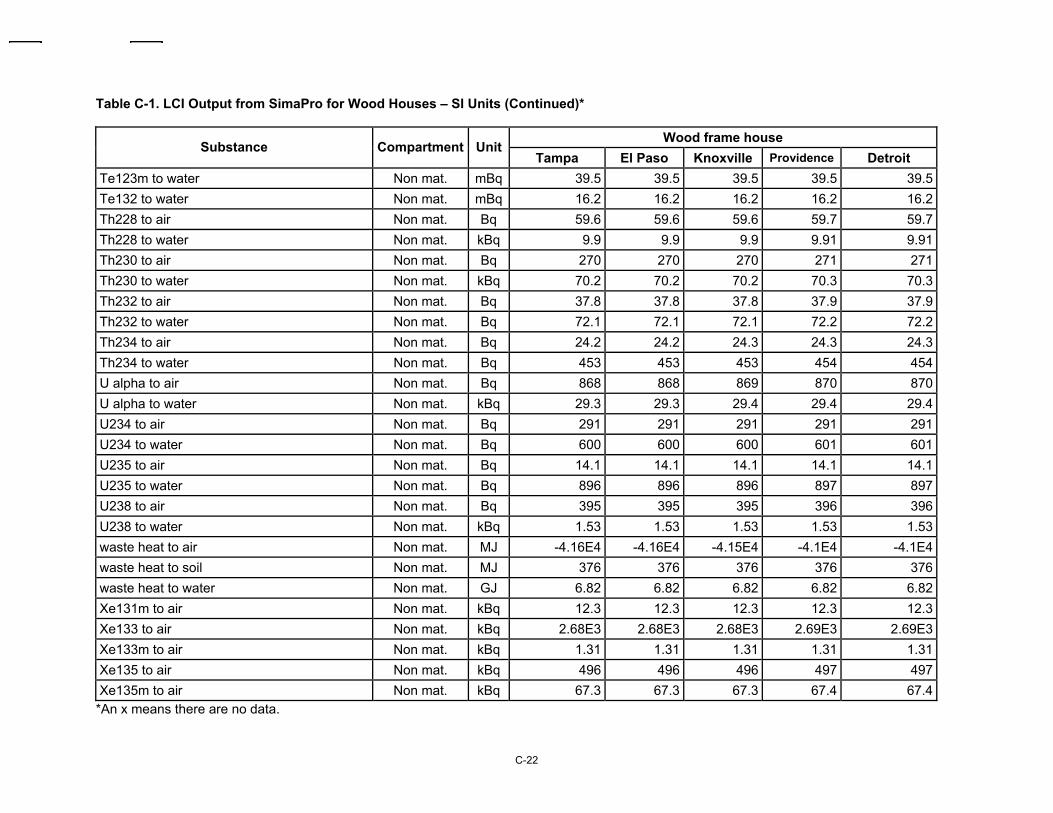
C-22
Table C-1. LCI Output from SimaPro for Wood Houses – SI Units (Continued)*
Wood frame house Substance Compartment Unit
Tampa El Paso Knoxville Providence Detroit Te123m to water Non mat. mBq 39.5 39.5 39.5 39.5 39.5Te132 to water Non mat. mBq 16.2 16.2 16.2 16.2 16.2Th228 to air Non mat. Bq 59.6 59.6 59.6 59.7 59.7Th228 to water Non mat. kBq 9.9 9.9 9.9 9.91 9.91Th230 to air Non mat. Bq 270 270 270 271 271Th230 to water Non mat. kBq 70.2 70.2 70.2 70.3 70.3Th232 to air Non mat. Bq 37.8 37.8 37.8 37.9 37.9Th232 to water Non mat. Bq 72.1 72.1 72.1 72.2 72.2Th234 to air Non mat. Bq 24.2 24.2 24.3 24.3 24.3Th234 to water Non mat. Bq 453 453 453 454 454U alpha to air Non mat. Bq 868 868 869 870 870U alpha to water Non mat. kBq 29.3 29.3 29.4 29.4 29.4U234 to air Non mat. Bq 291 291 291 291 291U234 to water Non mat. Bq 600 600 600 601 601U235 to air Non mat. Bq 14.1 14.1 14.1 14.1 14.1U235 to water Non mat. Bq 896 896 896 897 897U238 to air Non mat. Bq 395 395 395 396 396U238 to water Non mat. kBq 1.53 1.53 1.53 1.53 1.53waste heat to air Non mat. MJ -4.16E4 -4.16E4 -4.15E4 -4.1E4 -4.1E4waste heat to soil Non mat. MJ 376 376 376 376 376waste heat to water Non mat. GJ 6.82 6.82 6.82 6.82 6.82Xe131m to air Non mat. kBq 12.3 12.3 12.3 12.3 12.3Xe133 to air Non mat. kBq 2.68E3 2.68E3 2.68E3 2.69E3 2.69E3Xe133m to air Non mat. kBq 1.31 1.31 1.31 1.31 1.31Xe135 to air Non mat. kBq 496 496 496 497 497Xe135m to air Non mat. kBq 67.3 67.3 67.3 67.4 67.4
*An x means there are no data.
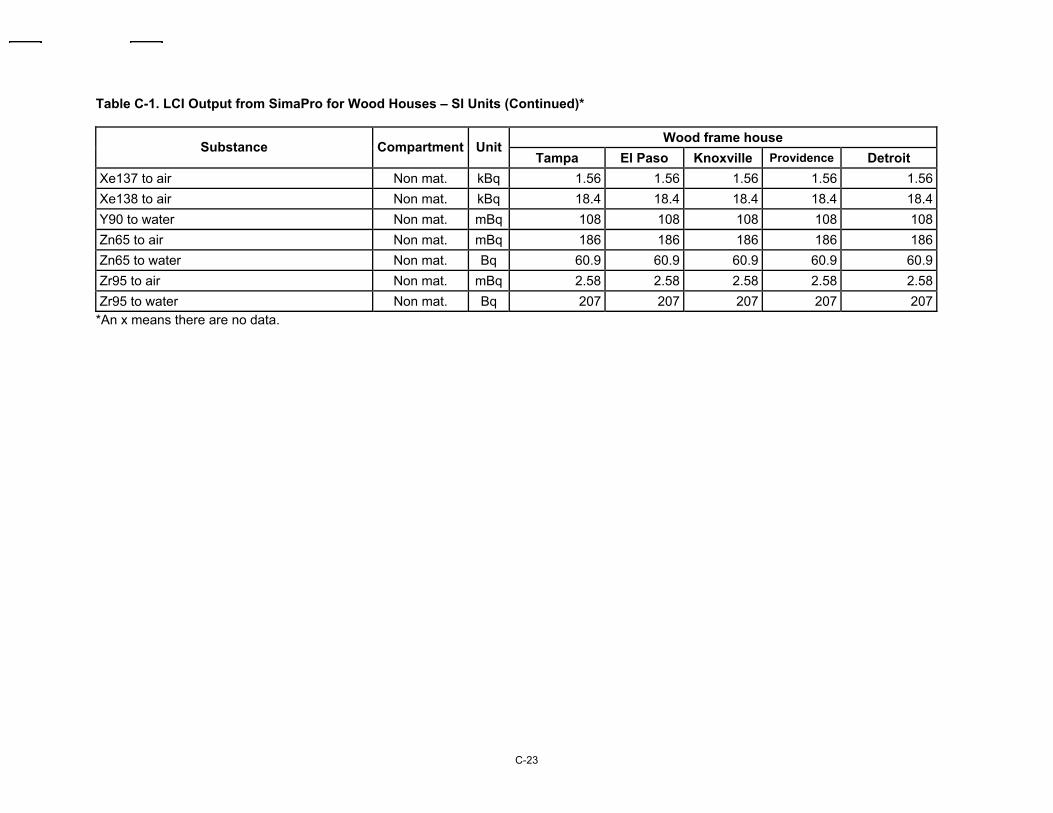
C-23
Table C-1. LCI Output from SimaPro for Wood Houses – SI Units (Continued)*
Wood frame house Substance Compartment Unit
Tampa El Paso Knoxville Providence Detroit Xe137 to air Non mat. kBq 1.56 1.56 1.56 1.56 1.56Xe138 to air Non mat. kBq 18.4 18.4 18.4 18.4 18.4Y90 to water Non mat. mBq 108 108 108 108 108Zn65 to air Non mat. mBq 186 186 186 186 186Zn65 to water Non mat. Bq 60.9 60.9 60.9 60.9 60.9Zr95 to air Non mat. mBq 2.58 2.58 2.58 2.58 2.58Zr95 to water Non mat. Bq 207 207 207 207 207
*An x means there are no data.
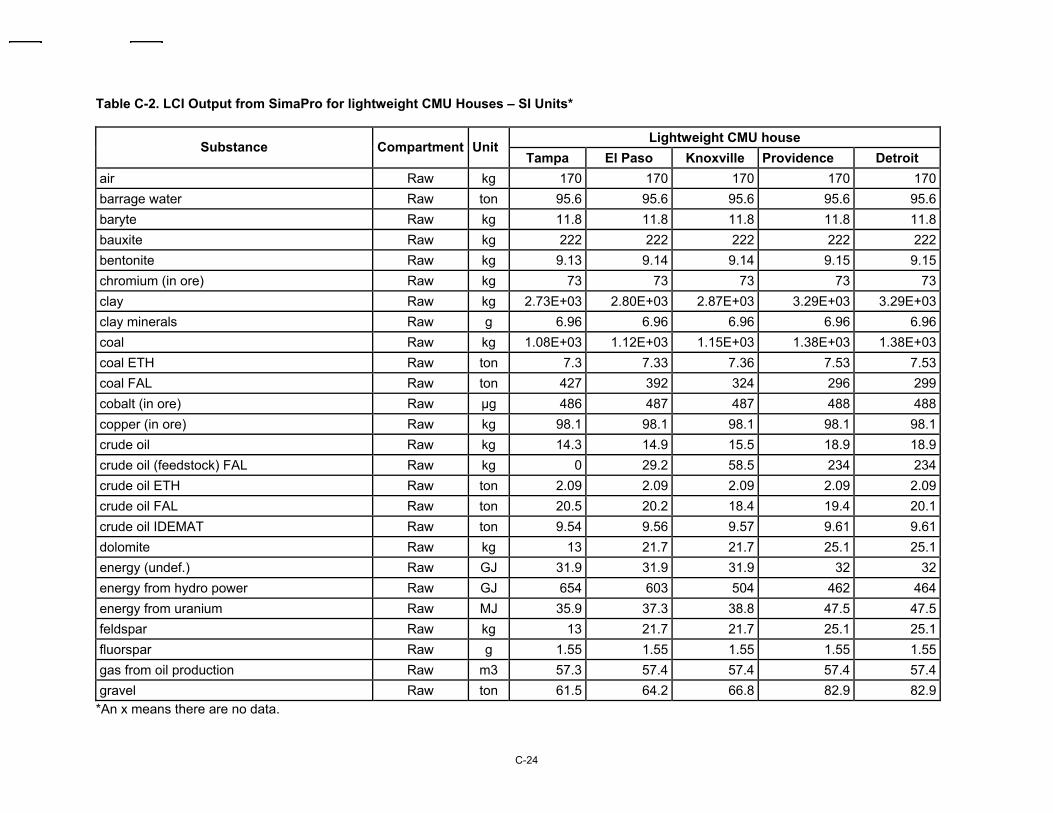
C-24
Table C-2. LCI Output from SimaPro for lightweight CMU Houses – SI Units*
Lightweight CMU house Substance Compartment Unit
Tampa El Paso Knoxville Providence Detroit air Raw kg 170 170 170 170 170barrage water Raw ton 95.6 95.6 95.6 95.6 95.6baryte Raw kg 11.8 11.8 11.8 11.8 11.8bauxite Raw kg 222 222 222 222 222bentonite Raw kg 9.13 9.14 9.14 9.15 9.15chromium (in ore) Raw kg 73 73 73 73 73clay Raw kg 2.73E+03 2.80E+03 2.87E+03 3.29E+03 3.29E+03clay minerals Raw g 6.96 6.96 6.96 6.96 6.96coal Raw kg 1.08E+03 1.12E+03 1.15E+03 1.38E+03 1.38E+03coal ETH Raw ton 7.3 7.33 7.36 7.53 7.53coal FAL Raw ton 427 392 324 296 299cobalt (in ore) Raw µg 486 487 487 488 488copper (in ore) Raw kg 98.1 98.1 98.1 98.1 98.1crude oil Raw kg 14.3 14.9 15.5 18.9 18.9crude oil (feedstock) FAL Raw kg 0 29.2 58.5 234 234crude oil ETH Raw ton 2.09 2.09 2.09 2.09 2.09crude oil FAL Raw ton 20.5 20.2 18.4 19.4 20.1crude oil IDEMAT Raw ton 9.54 9.56 9.57 9.61 9.61dolomite Raw kg 13 21.7 21.7 25.1 25.1energy (undef.) Raw GJ 31.9 31.9 31.9 32 32energy from hydro power Raw GJ 654 603 504 462 464energy from uranium Raw MJ 35.9 37.3 38.8 47.5 47.5feldspar Raw kg 13 21.7 21.7 25.1 25.1fluorspar Raw g 1.55 1.55 1.55 1.55 1.55gas from oil production Raw m3 57.3 57.4 57.4 57.4 57.4gravel Raw ton 61.5 64.2 66.8 82.9 82.9
*An x means there are no data.
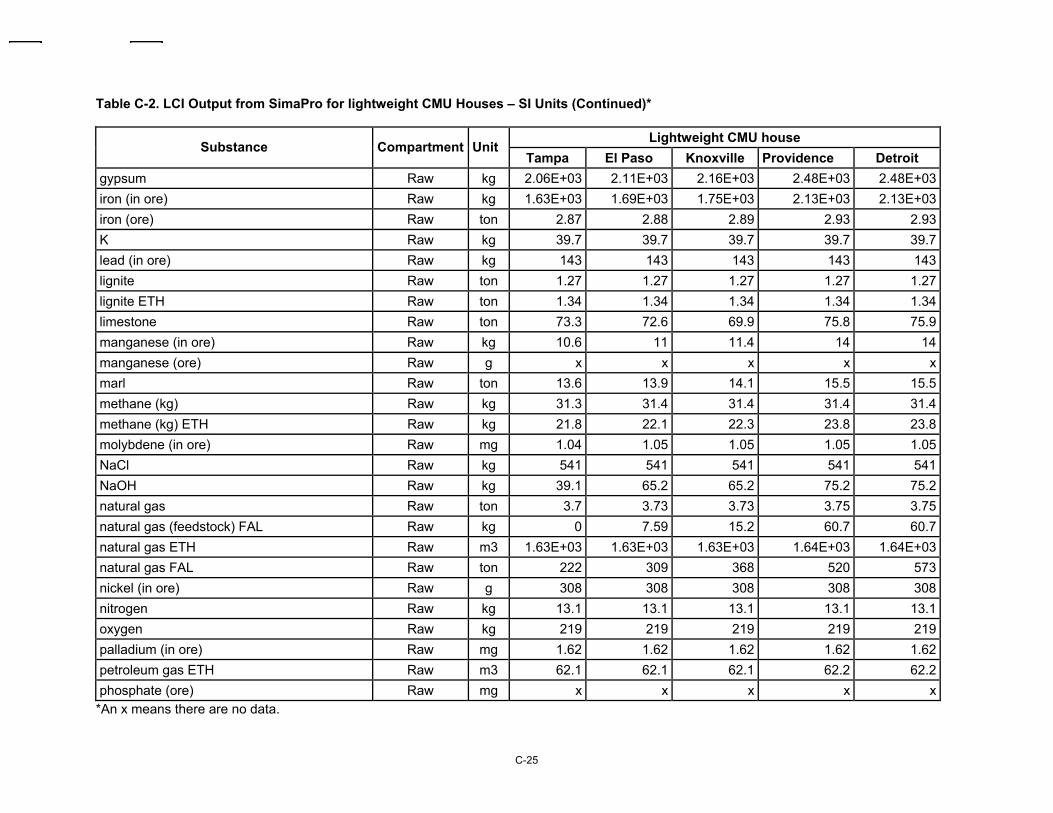
C-25
Table C-2. LCI Output from SimaPro for lightweight CMU Houses – SI Units (Continued)*
Lightweight CMU house Substance Compartment Unit
Tampa El Paso Knoxville Providence Detroit gypsum Raw kg 2.06E+03 2.11E+03 2.16E+03 2.48E+03 2.48E+03iron (in ore) Raw kg 1.63E+03 1.69E+03 1.75E+03 2.13E+03 2.13E+03iron (ore) Raw ton 2.87 2.88 2.89 2.93 2.93K Raw kg 39.7 39.7 39.7 39.7 39.7lead (in ore) Raw kg 143 143 143 143 143lignite Raw ton 1.27 1.27 1.27 1.27 1.27lignite ETH Raw ton 1.34 1.34 1.34 1.34 1.34limestone Raw ton 73.3 72.6 69.9 75.8 75.9manganese (in ore) Raw kg 10.6 11 11.4 14 14manganese (ore) Raw g x x x x xmarl Raw ton 13.6 13.9 14.1 15.5 15.5methane (kg) Raw kg 31.3 31.4 31.4 31.4 31.4methane (kg) ETH Raw kg 21.8 22.1 22.3 23.8 23.8molybdene (in ore) Raw mg 1.04 1.05 1.05 1.05 1.05NaCl Raw kg 541 541 541 541 541NaOH Raw kg 39.1 65.2 65.2 75.2 75.2natural gas Raw ton 3.7 3.73 3.73 3.75 3.75natural gas (feedstock) FAL Raw kg 0 7.59 15.2 60.7 60.7natural gas ETH Raw m3 1.63E+03 1.63E+03 1.63E+03 1.64E+03 1.64E+03natural gas FAL Raw ton 222 309 368 520 573nickel (in ore) Raw g 308 308 308 308 308nitrogen Raw kg 13.1 13.1 13.1 13.1 13.1oxygen Raw kg 219 219 219 219 219palladium (in ore) Raw mg 1.62 1.62 1.62 1.62 1.62petroleum gas ETH Raw m3 62.1 62.1 62.1 62.2 62.2phosphate (ore) Raw mg x x x x x
*An x means there are no data.
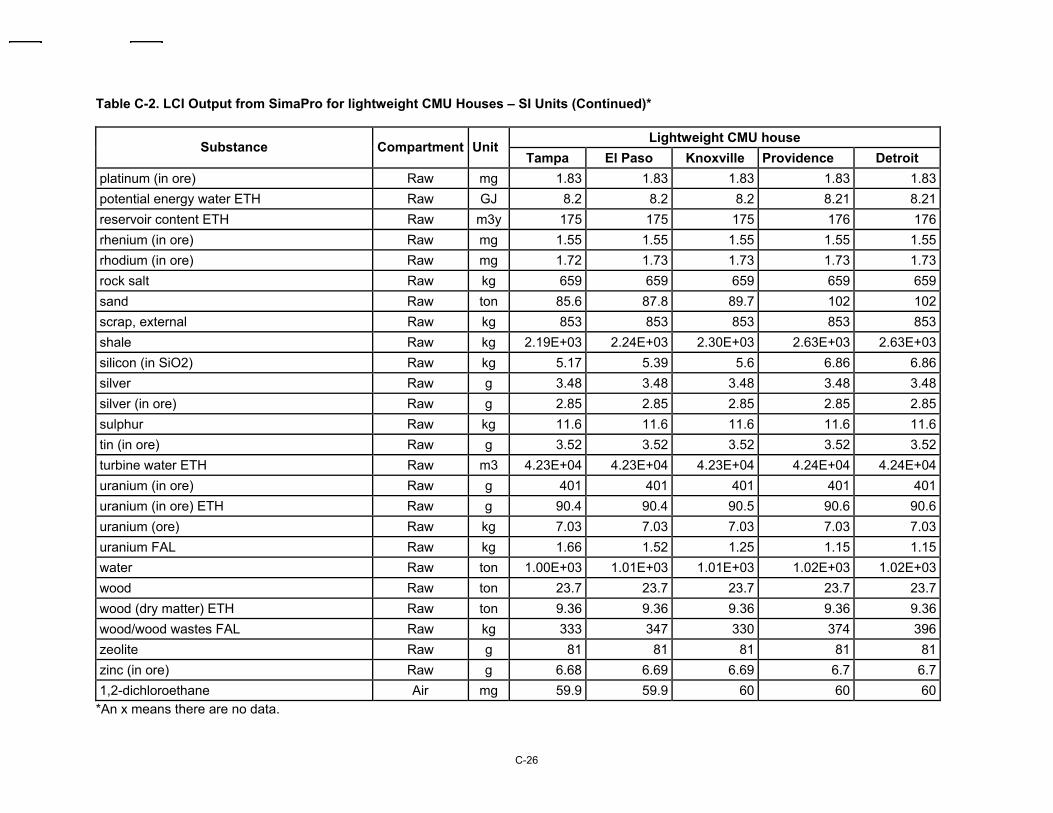
C-26
Table C-2. LCI Output from SimaPro for lightweight CMU Houses – SI Units (Continued)*
Lightweight CMU house Substance Compartment Unit
Tampa El Paso Knoxville Providence Detroit platinum (in ore) Raw mg 1.83 1.83 1.83 1.83 1.83potential energy water ETH Raw GJ 8.2 8.2 8.2 8.21 8.21reservoir content ETH Raw m3y 175 175 175 176 176rhenium (in ore) Raw mg 1.55 1.55 1.55 1.55 1.55rhodium (in ore) Raw mg 1.72 1.73 1.73 1.73 1.73rock salt Raw kg 659 659 659 659 659sand Raw ton 85.6 87.8 89.7 102 102scrap, external Raw kg 853 853 853 853 853shale Raw kg 2.19E+03 2.24E+03 2.30E+03 2.63E+03 2.63E+03silicon (in SiO2) Raw kg 5.17 5.39 5.6 6.86 6.86silver Raw g 3.48 3.48 3.48 3.48 3.48silver (in ore) Raw g 2.85 2.85 2.85 2.85 2.85sulphur Raw kg 11.6 11.6 11.6 11.6 11.6tin (in ore) Raw g 3.52 3.52 3.52 3.52 3.52turbine water ETH Raw m3 4.23E+04 4.23E+04 4.23E+04 4.24E+04 4.24E+04uranium (in ore) Raw g 401 401 401 401 401uranium (in ore) ETH Raw g 90.4 90.4 90.5 90.6 90.6uranium (ore) Raw kg 7.03 7.03 7.03 7.03 7.03uranium FAL Raw kg 1.66 1.52 1.25 1.15 1.15water Raw ton 1.00E+03 1.01E+03 1.01E+03 1.02E+03 1.02E+03wood Raw ton 23.7 23.7 23.7 23.7 23.7wood (dry matter) ETH Raw ton 9.36 9.36 9.36 9.36 9.36wood/wood wastes FAL Raw kg 333 347 330 374 396zeolite Raw g 81 81 81 81 81zinc (in ore) Raw g 6.68 6.69 6.69 6.7 6.71,2-dichloroethane Air mg 59.9 59.9 60 60 60
*An x means there are no data.
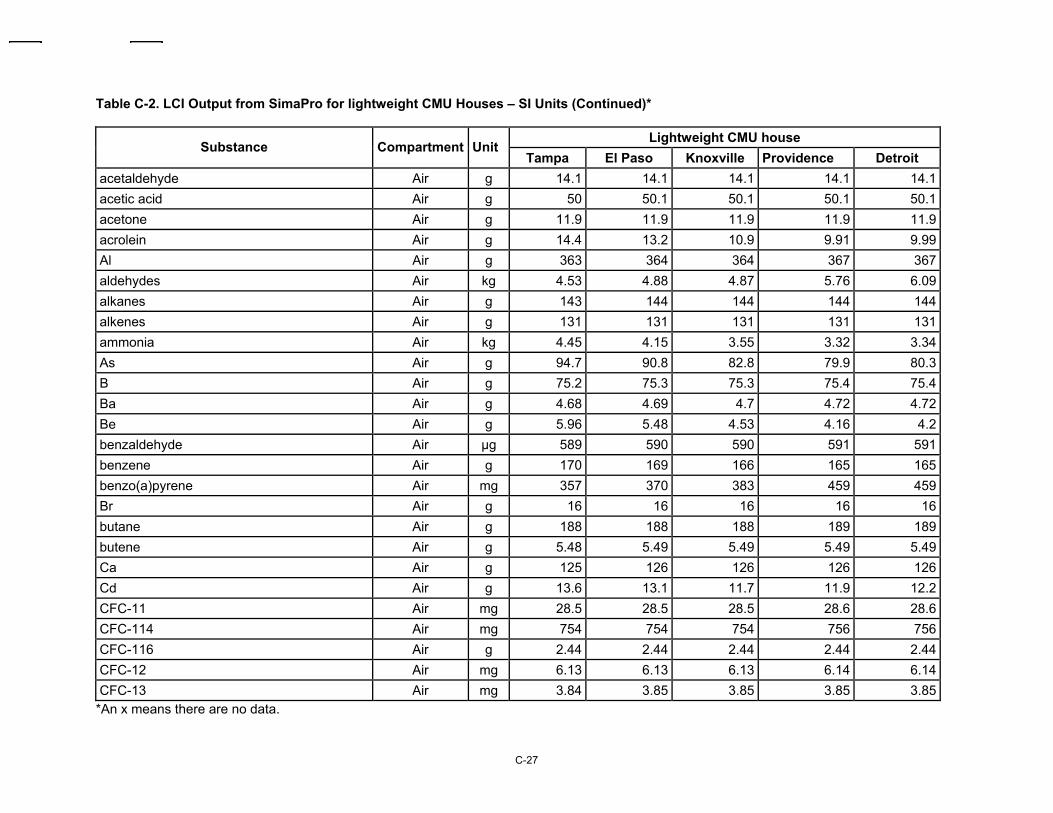
C-27
Table C-2. LCI Output from SimaPro for lightweight CMU Houses – SI Units (Continued)*
Lightweight CMU house Substance Compartment Unit
Tampa El Paso Knoxville Providence Detroit acetaldehyde Air g 14.1 14.1 14.1 14.1 14.1acetic acid Air g 50 50.1 50.1 50.1 50.1acetone Air g 11.9 11.9 11.9 11.9 11.9acrolein Air g 14.4 13.2 10.9 9.91 9.99Al Air g 363 364 364 367 367aldehydes Air kg 4.53 4.88 4.87 5.76 6.09alkanes Air g 143 144 144 144 144alkenes Air g 131 131 131 131 131ammonia Air kg 4.45 4.15 3.55 3.32 3.34As Air g 94.7 90.8 82.8 79.9 80.3B Air g 75.2 75.3 75.3 75.4 75.4Ba Air g 4.68 4.69 4.7 4.72 4.72Be Air g 5.96 5.48 4.53 4.16 4.2benzaldehyde Air µg 589 590 590 591 591benzene Air g 170 169 166 165 165benzo(a)pyrene Air mg 357 370 383 459 459Br Air g 16 16 16 16 16butane Air g 188 188 188 189 189butene Air g 5.48 5.49 5.49 5.49 5.49Ca Air g 125 126 126 126 126Cd Air g 13.6 13.1 11.7 11.9 12.2CFC-11 Air mg 28.5 28.5 28.5 28.6 28.6CFC-114 Air mg 754 754 754 756 756CFC-116 Air g 2.44 2.44 2.44 2.44 2.44CFC-12 Air mg 6.13 6.13 6.13 6.14 6.14CFC-13 Air mg 3.84 3.85 3.85 3.85 3.85
*An x means there are no data.
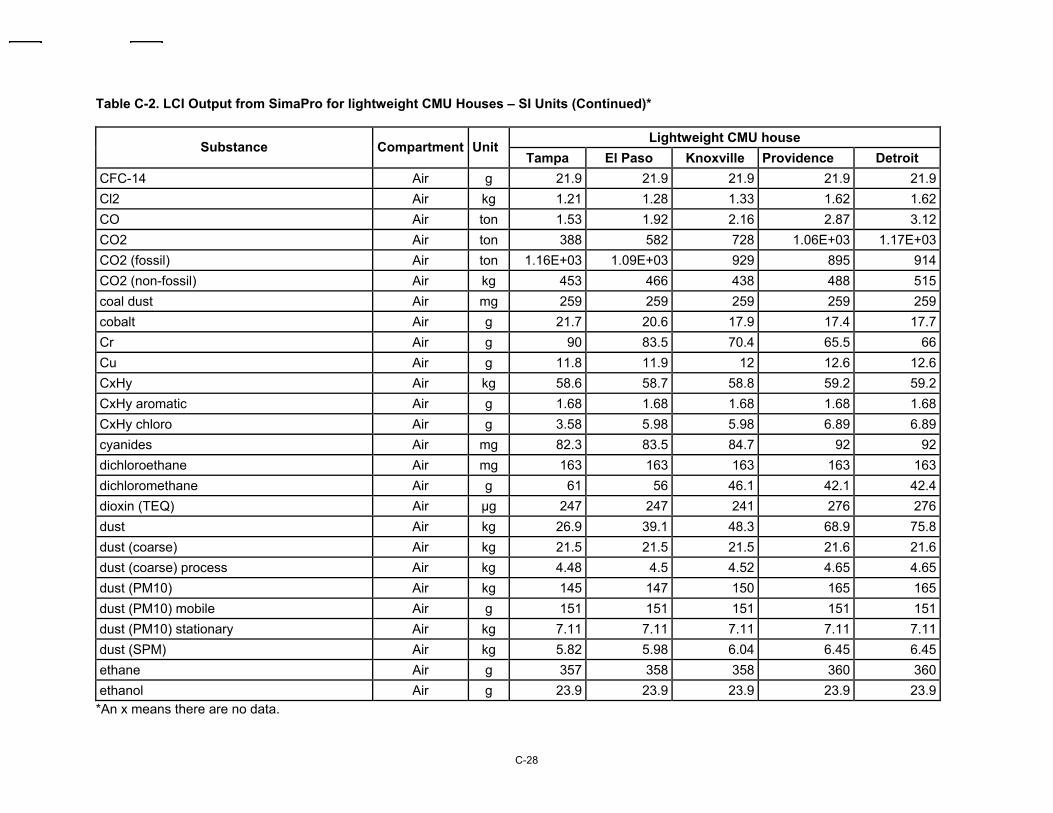
C-28
Table C-2. LCI Output from SimaPro for lightweight CMU Houses – SI Units (Continued)*
Lightweight CMU house Substance Compartment Unit
Tampa El Paso Knoxville Providence Detroit CFC-14 Air g 21.9 21.9 21.9 21.9 21.9Cl2 Air kg 1.21 1.28 1.33 1.62 1.62CO Air ton 1.53 1.92 2.16 2.87 3.12CO2 Air ton 388 582 728 1.06E+03 1.17E+03CO2 (fossil) Air ton 1.16E+03 1.09E+03 929 895 914CO2 (non-fossil) Air kg 453 466 438 488 515coal dust Air mg 259 259 259 259 259cobalt Air g 21.7 20.6 17.9 17.4 17.7Cr Air g 90 83.5 70.4 65.5 66Cu Air g 11.8 11.9 12 12.6 12.6CxHy Air kg 58.6 58.7 58.8 59.2 59.2CxHy aromatic Air g 1.68 1.68 1.68 1.68 1.68CxHy chloro Air g 3.58 5.98 5.98 6.89 6.89cyanides Air mg 82.3 83.5 84.7 92 92dichloroethane Air mg 163 163 163 163 163dichloromethane Air g 61 56 46.1 42.1 42.4dioxin (TEQ) Air µg 247 247 241 276 276dust Air kg 26.9 39.1 48.3 68.9 75.8dust (coarse) Air kg 21.5 21.5 21.5 21.6 21.6dust (coarse) process Air kg 4.48 4.5 4.52 4.65 4.65dust (PM10) Air kg 145 147 150 165 165dust (PM10) mobile Air g 151 151 151 151 151dust (PM10) stationary Air kg 7.11 7.11 7.11 7.11 7.11dust (SPM) Air kg 5.82 5.98 6.04 6.45 6.45ethane Air g 357 358 358 360 360ethanol Air g 23.9 23.9 23.9 23.9 23.9
*An x means there are no data.
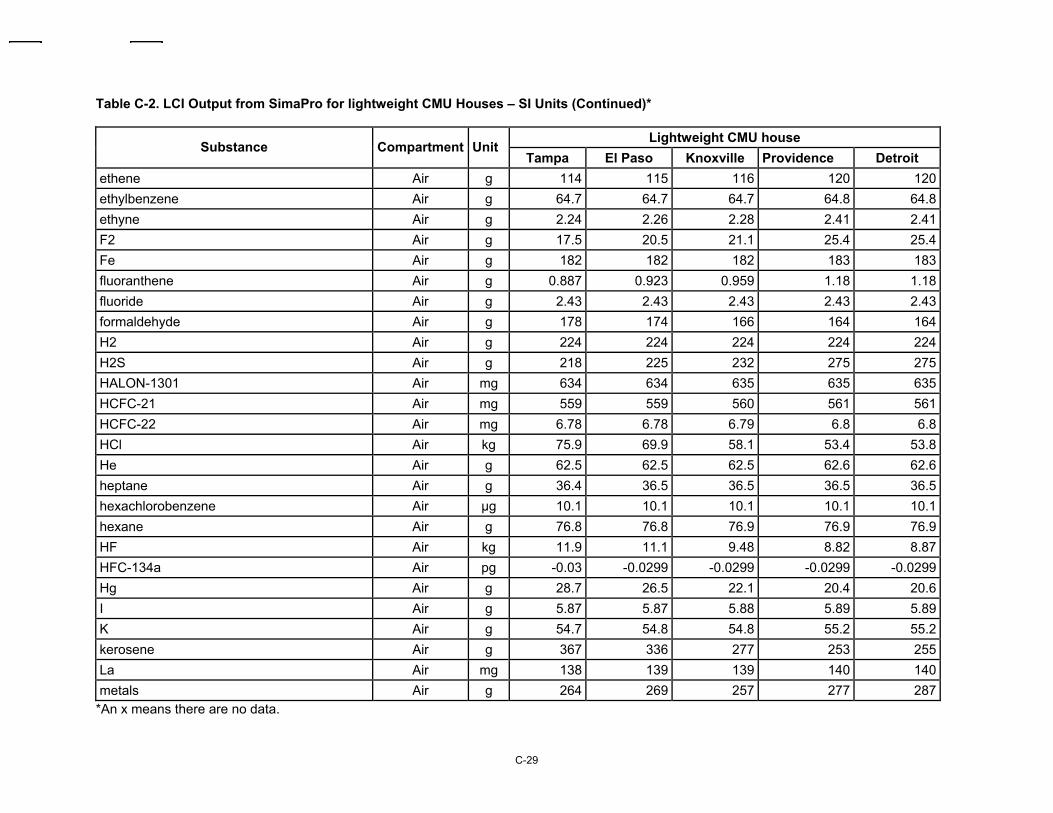
C-29
Table C-2. LCI Output from SimaPro for lightweight CMU Houses – SI Units (Continued)*
Lightweight CMU house Substance Compartment Unit
Tampa El Paso Knoxville Providence Detroit ethene Air g 114 115 116 120 120ethylbenzene Air g 64.7 64.7 64.7 64.8 64.8ethyne Air g 2.24 2.26 2.28 2.41 2.41F2 Air g 17.5 20.5 21.1 25.4 25.4Fe Air g 182 182 182 183 183fluoranthene Air g 0.887 0.923 0.959 1.18 1.18fluoride Air g 2.43 2.43 2.43 2.43 2.43formaldehyde Air g 178 174 166 164 164H2 Air g 224 224 224 224 224H2S Air g 218 225 232 275 275HALON-1301 Air mg 634 634 635 635 635HCFC-21 Air mg 559 559 560 561 561HCFC-22 Air mg 6.78 6.78 6.79 6.8 6.8HCl Air kg 75.9 69.9 58.1 53.4 53.8He Air g 62.5 62.5 62.5 62.6 62.6heptane Air g 36.4 36.5 36.5 36.5 36.5hexachlorobenzene Air µg 10.1 10.1 10.1 10.1 10.1hexane Air g 76.8 76.8 76.9 76.9 76.9HF Air kg 11.9 11.1 9.48 8.82 8.87HFC-134a Air pg -0.03 -0.0299 -0.0299 -0.0299 -0.0299Hg Air g 28.7 26.5 22.1 20.4 20.6I Air g 5.87 5.87 5.88 5.89 5.89K Air g 54.7 54.8 54.8 55.2 55.2kerosene Air g 367 336 277 253 255La Air mg 138 139 139 140 140metals Air g 264 269 257 277 287
*An x means there are no data.
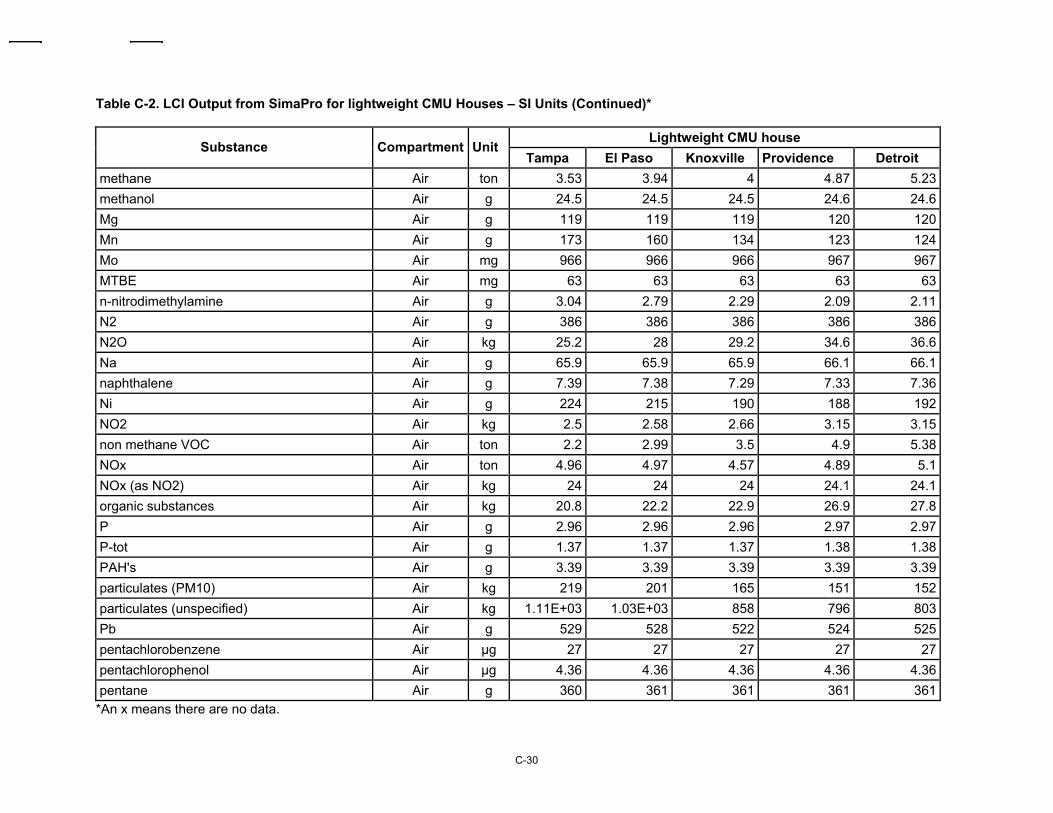
C-30
Table C-2. LCI Output from SimaPro for lightweight CMU Houses – SI Units (Continued)*
Lightweight CMU house Substance Compartment Unit
Tampa El Paso Knoxville Providence Detroit methane Air ton 3.53 3.94 4 4.87 5.23methanol Air g 24.5 24.5 24.5 24.6 24.6Mg Air g 119 119 119 120 120Mn Air g 173 160 134 123 124Mo Air mg 966 966 966 967 967MTBE Air mg 63 63 63 63 63n-nitrodimethylamine Air g 3.04 2.79 2.29 2.09 2.11N2 Air g 386 386 386 386 386N2O Air kg 25.2 28 29.2 34.6 36.6Na Air g 65.9 65.9 65.9 66.1 66.1naphthalene Air g 7.39 7.38 7.29 7.33 7.36Ni Air g 224 215 190 188 192NO2 Air kg 2.5 2.58 2.66 3.15 3.15non methane VOC Air ton 2.2 2.99 3.5 4.9 5.38NOx Air ton 4.96 4.97 4.57 4.89 5.1NOx (as NO2) Air kg 24 24 24 24.1 24.1organic substances Air kg 20.8 22.2 22.9 26.9 27.8P Air g 2.96 2.96 2.96 2.97 2.97P-tot Air g 1.37 1.37 1.37 1.38 1.38PAH's Air g 3.39 3.39 3.39 3.39 3.39particulates (PM10) Air kg 219 201 165 151 152particulates (unspecified) Air kg 1.11E+03 1.03E+03 858 796 803Pb Air g 529 528 522 524 525pentachlorobenzene Air µg 27 27 27 27 27pentachlorophenol Air µg 4.36 4.36 4.36 4.36 4.36pentane Air g 360 361 361 361 361
*An x means there are no data.
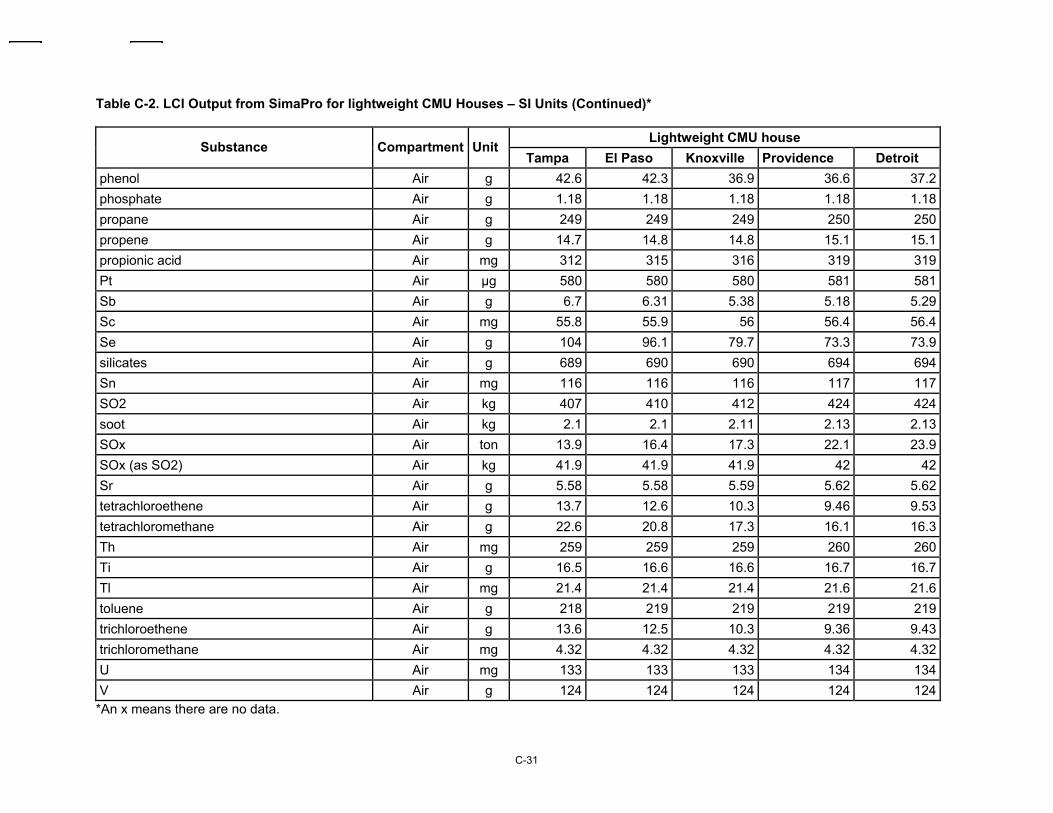
C-31
Table C-2. LCI Output from SimaPro for lightweight CMU Houses – SI Units (Continued)*
Lightweight CMU house Substance Compartment Unit
Tampa El Paso Knoxville Providence Detroit phenol Air g 42.6 42.3 36.9 36.6 37.2phosphate Air g 1.18 1.18 1.18 1.18 1.18propane Air g 249 249 249 250 250propene Air g 14.7 14.8 14.8 15.1 15.1propionic acid Air mg 312 315 316 319 319Pt Air µg 580 580 580 581 581Sb Air g 6.7 6.31 5.38 5.18 5.29Sc Air mg 55.8 55.9 56 56.4 56.4Se Air g 104 96.1 79.7 73.3 73.9silicates Air g 689 690 690 694 694Sn Air mg 116 116 116 117 117SO2 Air kg 407 410 412 424 424soot Air kg 2.1 2.1 2.11 2.13 2.13SOx Air ton 13.9 16.4 17.3 22.1 23.9SOx (as SO2) Air kg 41.9 41.9 41.9 42 42Sr Air g 5.58 5.58 5.59 5.62 5.62tetrachloroethene Air g 13.7 12.6 10.3 9.46 9.53tetrachloromethane Air g 22.6 20.8 17.3 16.1 16.3Th Air mg 259 259 259 260 260Ti Air g 16.5 16.6 16.6 16.7 16.7Tl Air mg 21.4 21.4 21.4 21.6 21.6toluene Air g 218 219 219 219 219trichloroethene Air g 13.6 12.5 10.3 9.36 9.43trichloromethane Air mg 4.32 4.32 4.32 4.32 4.32U Air mg 133 133 133 134 134V Air g 124 124 124 124 124
*An x means there are no data.
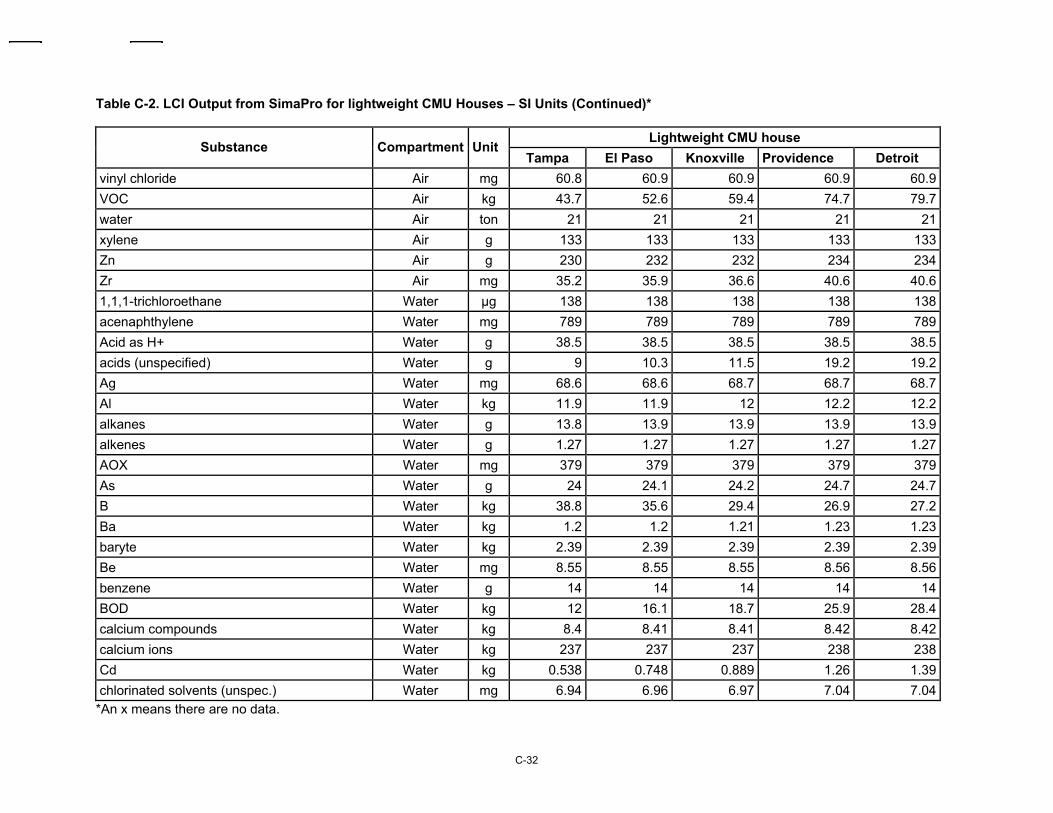
C-32
Table C-2. LCI Output from SimaPro for lightweight CMU Houses – SI Units (Continued)*
Lightweight CMU house Substance Compartment Unit
Tampa El Paso Knoxville Providence Detroit vinyl chloride Air mg 60.8 60.9 60.9 60.9 60.9VOC Air kg 43.7 52.6 59.4 74.7 79.7water Air ton 21 21 21 21 21xylene Air g 133 133 133 133 133Zn Air g 230 232 232 234 234Zr Air mg 35.2 35.9 36.6 40.6 40.61,1,1-trichloroethane Water µg 138 138 138 138 138acenaphthylene Water mg 789 789 789 789 789Acid as H+ Water g 38.5 38.5 38.5 38.5 38.5acids (unspecified) Water g 9 10.3 11.5 19.2 19.2Ag Water mg 68.6 68.6 68.7 68.7 68.7Al Water kg 11.9 11.9 12 12.2 12.2alkanes Water g 13.8 13.9 13.9 13.9 13.9alkenes Water g 1.27 1.27 1.27 1.27 1.27AOX Water mg 379 379 379 379 379As Water g 24 24.1 24.2 24.7 24.7B Water kg 38.8 35.6 29.4 26.9 27.2Ba Water kg 1.2 1.2 1.21 1.23 1.23baryte Water kg 2.39 2.39 2.39 2.39 2.39Be Water mg 8.55 8.55 8.55 8.56 8.56benzene Water g 14 14 14 14 14BOD Water kg 12 16.1 18.7 25.9 28.4calcium compounds Water kg 8.4 8.41 8.41 8.42 8.42calcium ions Water kg 237 237 237 238 238Cd Water kg 0.538 0.748 0.889 1.26 1.39chlorinated solvents (unspec.) Water mg 6.94 6.96 6.97 7.04 7.04
*An x means there are no data.
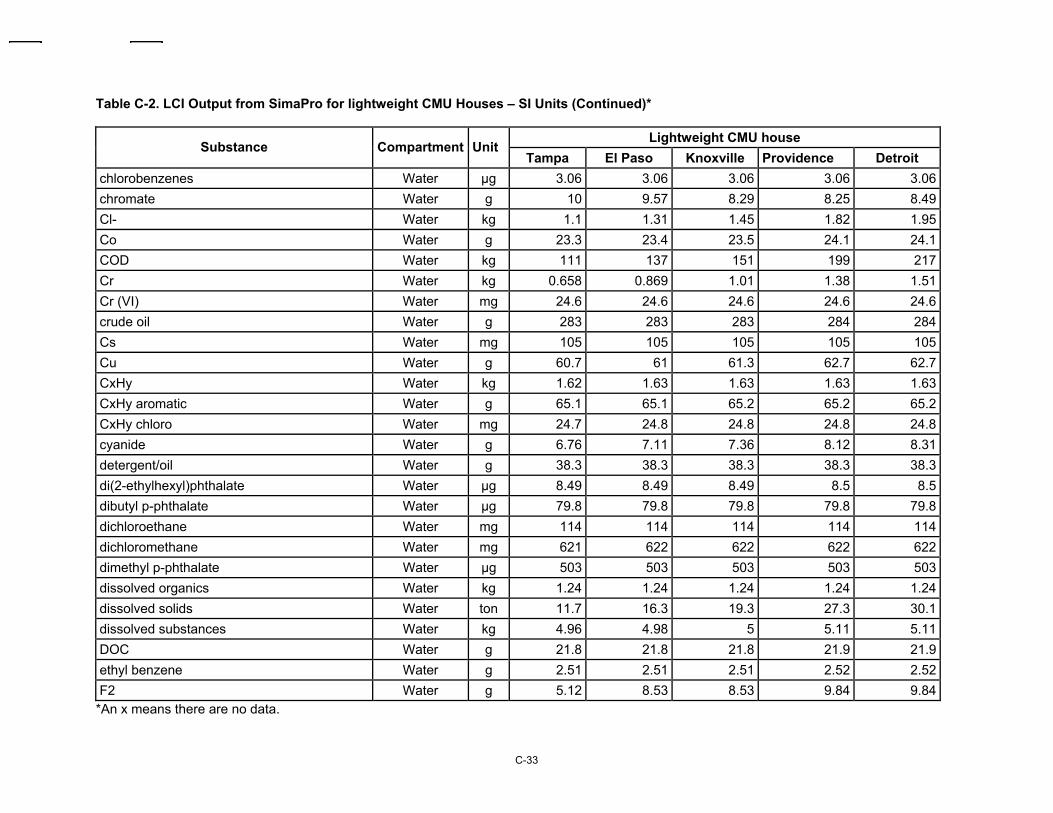
C-33
Table C-2. LCI Output from SimaPro for lightweight CMU Houses – SI Units (Continued)*
Lightweight CMU house Substance Compartment Unit
Tampa El Paso Knoxville Providence Detroit chlorobenzenes Water µg 3.06 3.06 3.06 3.06 3.06chromate Water g 10 9.57 8.29 8.25 8.49Cl- Water kg 1.1 1.31 1.45 1.82 1.95Co Water g 23.3 23.4 23.5 24.1 24.1COD Water kg 111 137 151 199 217Cr Water kg 0.658 0.869 1.01 1.38 1.51Cr (VI) Water mg 24.6 24.6 24.6 24.6 24.6crude oil Water g 283 283 283 284 284Cs Water mg 105 105 105 105 105Cu Water g 60.7 61 61.3 62.7 62.7CxHy Water kg 1.62 1.63 1.63 1.63 1.63CxHy aromatic Water g 65.1 65.1 65.2 65.2 65.2CxHy chloro Water mg 24.7 24.8 24.8 24.8 24.8cyanide Water g 6.76 7.11 7.36 8.12 8.31detergent/oil Water g 38.3 38.3 38.3 38.3 38.3di(2-ethylhexyl)phthalate Water µg 8.49 8.49 8.49 8.5 8.5dibutyl p-phthalate Water µg 79.8 79.8 79.8 79.8 79.8dichloroethane Water mg 114 114 114 114 114dichloromethane Water mg 621 622 622 622 622dimethyl p-phthalate Water µg 503 503 503 503 503dissolved organics Water kg 1.24 1.24 1.24 1.24 1.24dissolved solids Water ton 11.7 16.3 19.3 27.3 30.1dissolved substances Water kg 4.96 4.98 5 5.11 5.11DOC Water g 21.8 21.8 21.8 21.9 21.9ethyl benzene Water g 2.51 2.51 2.51 2.52 2.52F2 Water g 5.12 8.53 8.53 9.84 9.84
*An x means there are no data.
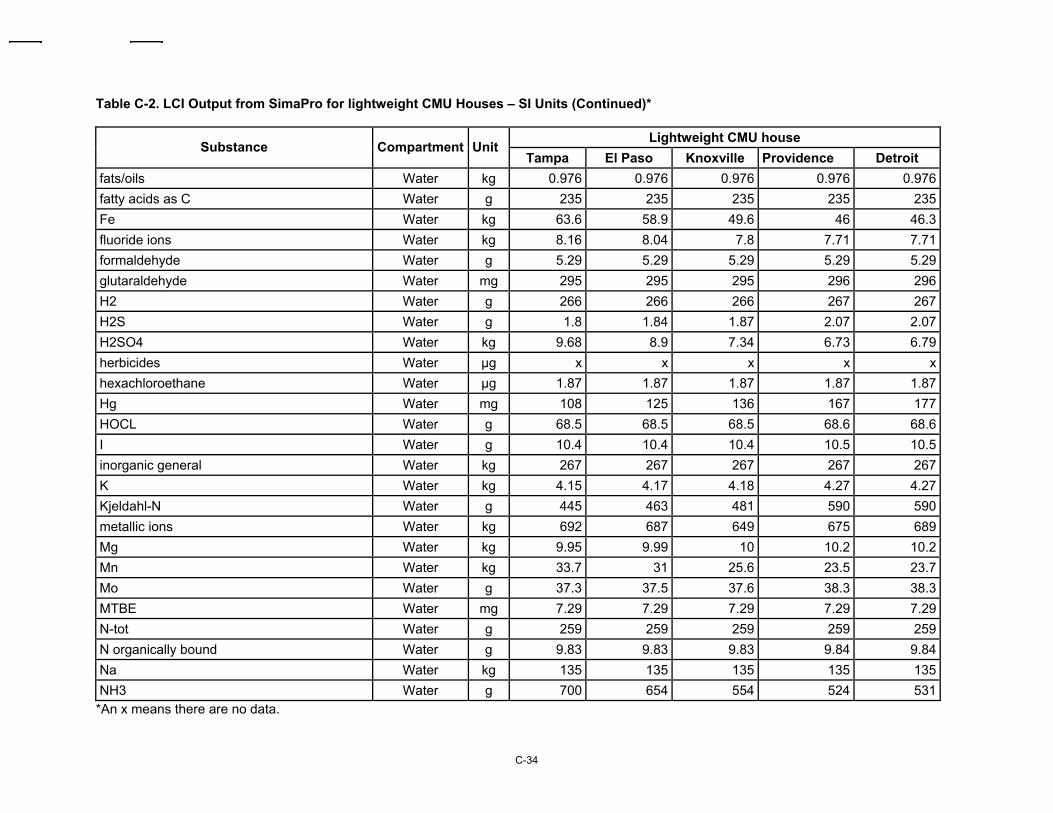
C-34
Table C-2. LCI Output from SimaPro for lightweight CMU Houses – SI Units (Continued)*
Lightweight CMU house Substance Compartment Unit
Tampa El Paso Knoxville Providence Detroit fats/oils Water kg 0.976 0.976 0.976 0.976 0.976fatty acids as C Water g 235 235 235 235 235Fe Water kg 63.6 58.9 49.6 46 46.3fluoride ions Water kg 8.16 8.04 7.8 7.71 7.71formaldehyde Water g 5.29 5.29 5.29 5.29 5.29glutaraldehyde Water mg 295 295 295 296 296H2 Water g 266 266 266 267 267H2S Water g 1.8 1.84 1.87 2.07 2.07H2SO4 Water kg 9.68 8.9 7.34 6.73 6.79herbicides Water µg x x x x xhexachloroethane Water µg 1.87 1.87 1.87 1.87 1.87Hg Water mg 108 125 136 167 177HOCL Water g 68.5 68.5 68.5 68.6 68.6I Water g 10.4 10.4 10.4 10.5 10.5inorganic general Water kg 267 267 267 267 267K Water kg 4.15 4.17 4.18 4.27 4.27Kjeldahl-N Water g 445 463 481 590 590metallic ions Water kg 692 687 649 675 689Mg Water kg 9.95 9.99 10 10.2 10.2Mn Water kg 33.7 31 25.6 23.5 23.7Mo Water g 37.3 37.5 37.6 38.3 38.3MTBE Water mg 7.29 7.29 7.29 7.29 7.29N-tot Water g 259 259 259 259 259N organically bound Water g 9.83 9.83 9.83 9.84 9.84Na Water kg 135 135 135 135 135NH3 Water g 700 654 554 524 531
*An x means there are no data.
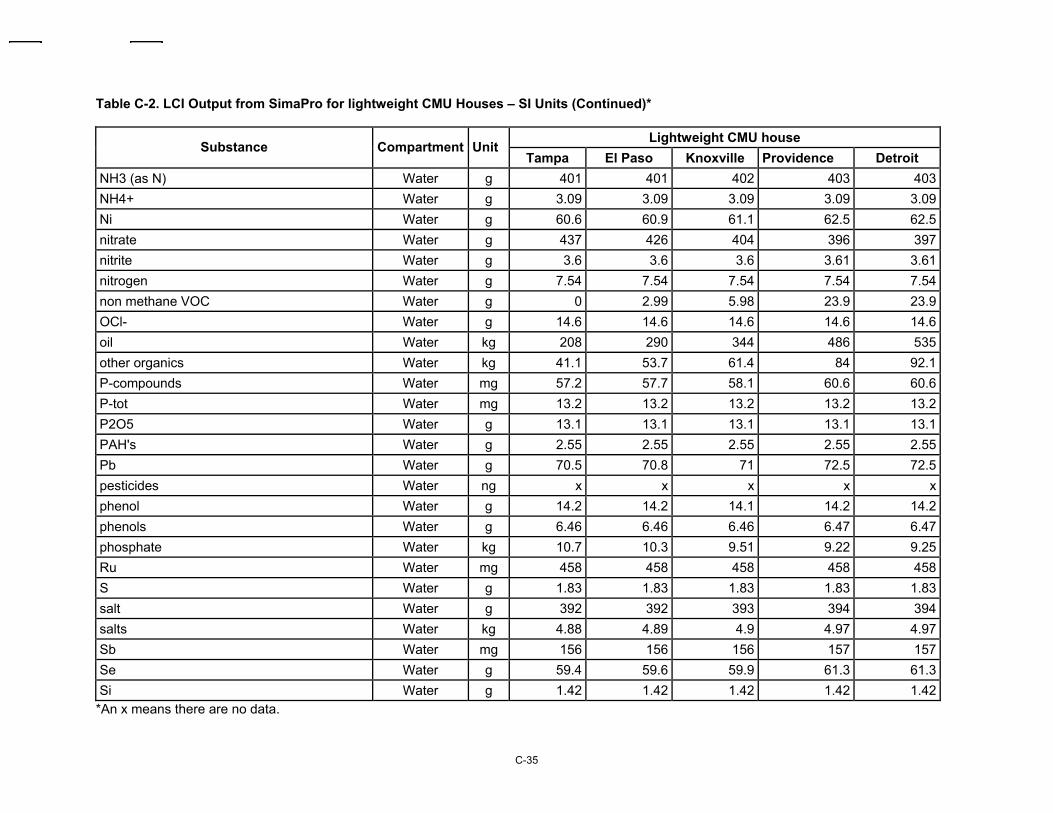
C-35
Table C-2. LCI Output from SimaPro for lightweight CMU Houses – SI Units (Continued)*
Lightweight CMU house Substance Compartment Unit
Tampa El Paso Knoxville Providence Detroit NH3 (as N) Water g 401 401 402 403 403NH4+ Water g 3.09 3.09 3.09 3.09 3.09Ni Water g 60.6 60.9 61.1 62.5 62.5nitrate Water g 437 426 404 396 397nitrite Water g 3.6 3.6 3.6 3.61 3.61nitrogen Water g 7.54 7.54 7.54 7.54 7.54non methane VOC Water g 0 2.99 5.98 23.9 23.9OCl- Water g 14.6 14.6 14.6 14.6 14.6oil Water kg 208 290 344 486 535other organics Water kg 41.1 53.7 61.4 84 92.1P-compounds Water mg 57.2 57.7 58.1 60.6 60.6P-tot Water mg 13.2 13.2 13.2 13.2 13.2P2O5 Water g 13.1 13.1 13.1 13.1 13.1PAH's Water g 2.55 2.55 2.55 2.55 2.55Pb Water g 70.5 70.8 71 72.5 72.5pesticides Water ng x x x x xphenol Water g 14.2 14.2 14.1 14.2 14.2phenols Water g 6.46 6.46 6.46 6.47 6.47phosphate Water kg 10.7 10.3 9.51 9.22 9.25Ru Water mg 458 458 458 458 458S Water g 1.83 1.83 1.83 1.83 1.83salt Water g 392 392 393 394 394salts Water kg 4.88 4.89 4.9 4.97 4.97Sb Water mg 156 156 156 157 157Se Water g 59.4 59.6 59.9 61.3 61.3Si Water g 1.42 1.42 1.42 1.42 1.42
*An x means there are no data.
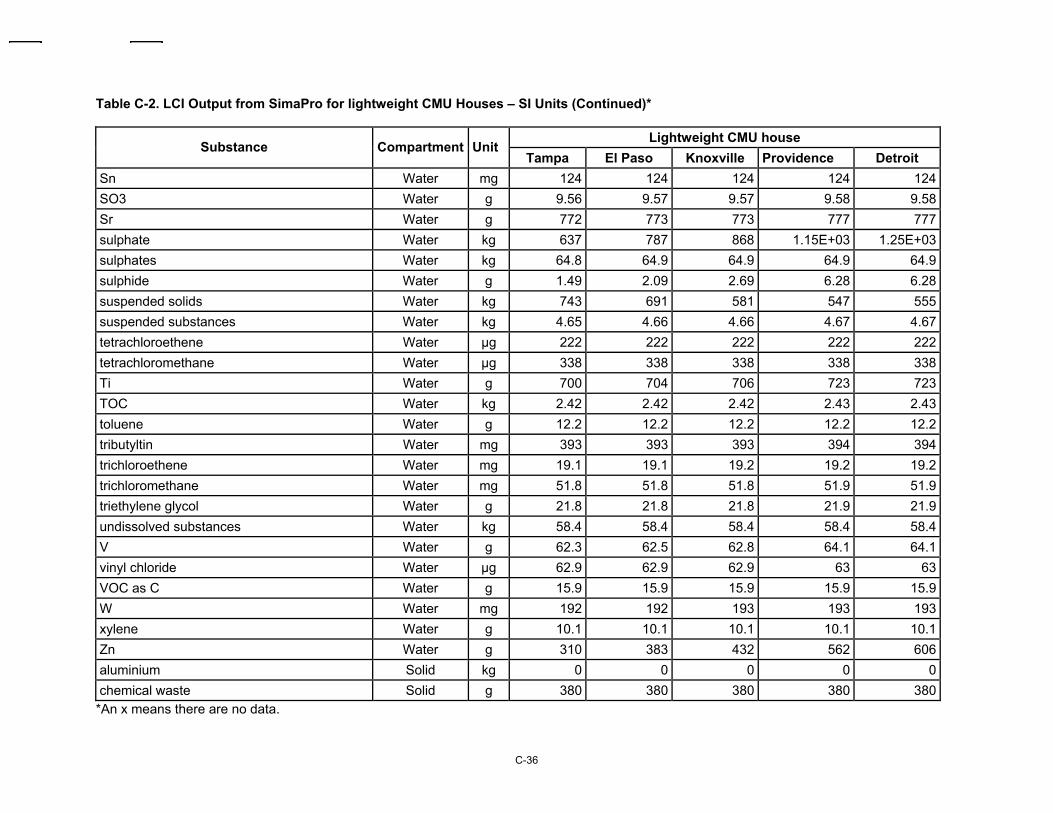
C-36
Table C-2. LCI Output from SimaPro for lightweight CMU Houses – SI Units (Continued)*
Lightweight CMU house Substance Compartment Unit
Tampa El Paso Knoxville Providence Detroit Sn Water mg 124 124 124 124 124SO3 Water g 9.56 9.57 9.57 9.58 9.58Sr Water g 772 773 773 777 777sulphate Water kg 637 787 868 1.15E+03 1.25E+03sulphates Water kg 64.8 64.9 64.9 64.9 64.9sulphide Water g 1.49 2.09 2.69 6.28 6.28suspended solids Water kg 743 691 581 547 555suspended substances Water kg 4.65 4.66 4.66 4.67 4.67tetrachloroethene Water µg 222 222 222 222 222tetrachloromethane Water µg 338 338 338 338 338Ti Water g 700 704 706 723 723TOC Water kg 2.42 2.42 2.42 2.43 2.43toluene Water g 12.2 12.2 12.2 12.2 12.2tributyltin Water mg 393 393 393 394 394trichloroethene Water mg 19.1 19.1 19.2 19.2 19.2trichloromethane Water mg 51.8 51.8 51.8 51.9 51.9triethylene glycol Water g 21.8 21.8 21.8 21.9 21.9undissolved substances Water kg 58.4 58.4 58.4 58.4 58.4V Water g 62.3 62.5 62.8 64.1 64.1vinyl chloride Water µg 62.9 62.9 62.9 63 63VOC as C Water g 15.9 15.9 15.9 15.9 15.9W Water mg 192 192 193 193 193xylene Water g 10.1 10.1 10.1 10.1 10.1Zn Water g 310 383 432 562 606aluminium Solid kg 0 0 0 0 0chemical waste Solid g 380 380 380 380 380
*An x means there are no data.
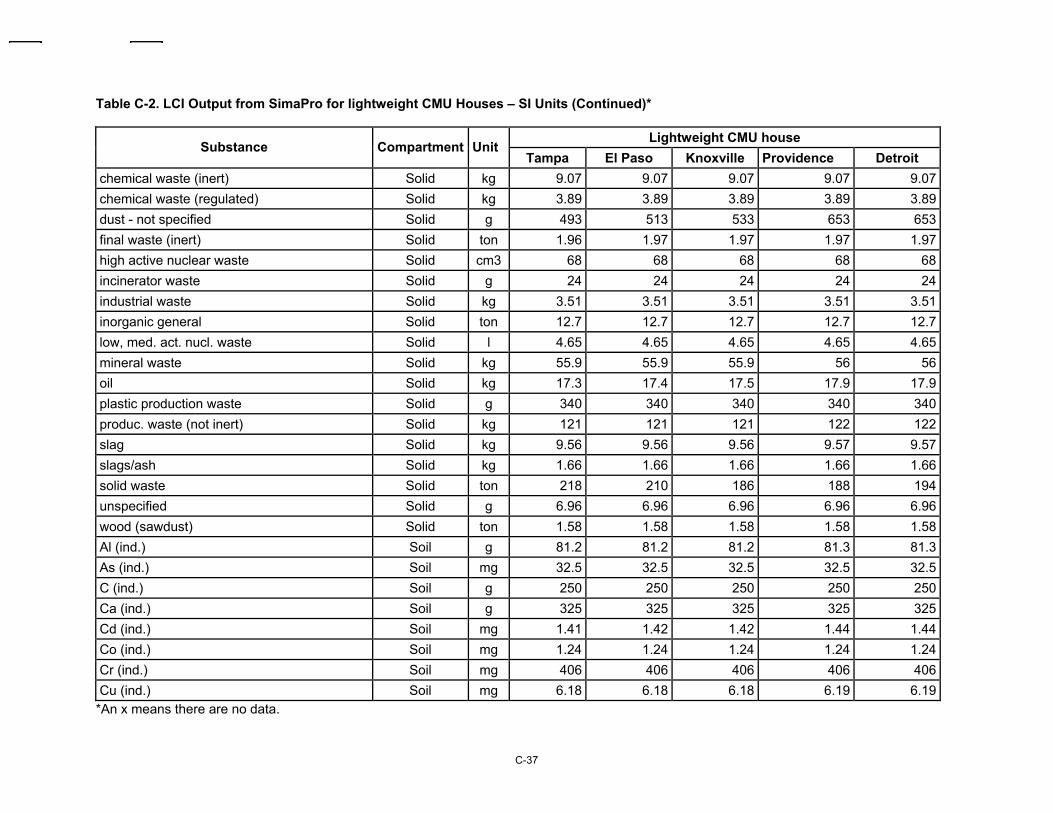
C-37
Table C-2. LCI Output from SimaPro for lightweight CMU Houses – SI Units (Continued)*
Lightweight CMU house Substance Compartment Unit
Tampa El Paso Knoxville Providence Detroit chemical waste (inert) Solid kg 9.07 9.07 9.07 9.07 9.07chemical waste (regulated) Solid kg 3.89 3.89 3.89 3.89 3.89dust - not specified Solid g 493 513 533 653 653final waste (inert) Solid ton 1.96 1.97 1.97 1.97 1.97high active nuclear waste Solid cm3 68 68 68 68 68incinerator waste Solid g 24 24 24 24 24industrial waste Solid kg 3.51 3.51 3.51 3.51 3.51inorganic general Solid ton 12.7 12.7 12.7 12.7 12.7low, med. act. nucl. waste Solid l 4.65 4.65 4.65 4.65 4.65mineral waste Solid kg 55.9 55.9 55.9 56 56oil Solid kg 17.3 17.4 17.5 17.9 17.9plastic production waste Solid g 340 340 340 340 340produc. waste (not inert) Solid kg 121 121 121 122 122slag Solid kg 9.56 9.56 9.56 9.57 9.57slags/ash Solid kg 1.66 1.66 1.66 1.66 1.66solid waste Solid ton 218 210 186 188 194unspecified Solid g 6.96 6.96 6.96 6.96 6.96wood (sawdust) Solid ton 1.58 1.58 1.58 1.58 1.58Al (ind.) Soil g 81.2 81.2 81.2 81.3 81.3As (ind.) Soil mg 32.5 32.5 32.5 32.5 32.5C (ind.) Soil g 250 250 250 250 250Ca (ind.) Soil g 325 325 325 325 325Cd (ind.) Soil mg 1.41 1.42 1.42 1.44 1.44Co (ind.) Soil mg 1.24 1.24 1.24 1.24 1.24Cr (ind.) Soil mg 406 406 406 406 406Cu (ind.) Soil mg 6.18 6.18 6.18 6.19 6.19
*An x means there are no data.
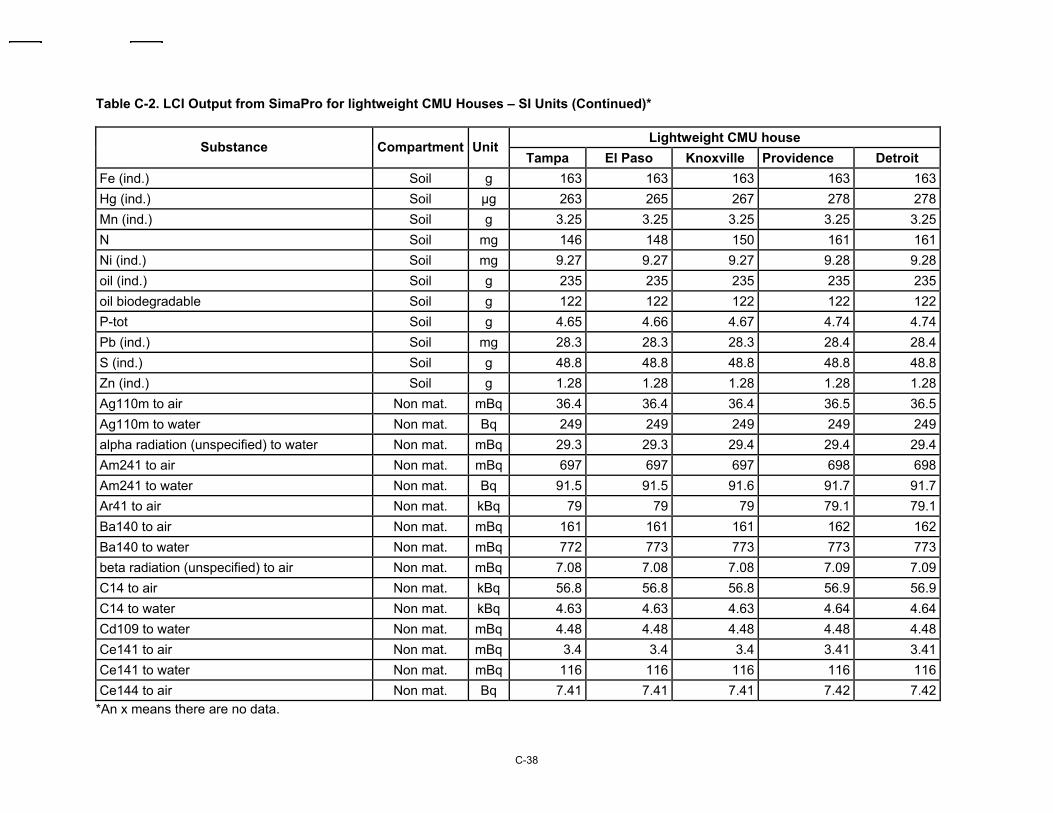
C-38
Table C-2. LCI Output from SimaPro for lightweight CMU Houses – SI Units (Continued)*
Lightweight CMU house Substance Compartment Unit
Tampa El Paso Knoxville Providence Detroit Fe (ind.) Soil g 163 163 163 163 163Hg (ind.) Soil µg 263 265 267 278 278Mn (ind.) Soil g 3.25 3.25 3.25 3.25 3.25N Soil mg 146 148 150 161 161Ni (ind.) Soil mg 9.27 9.27 9.27 9.28 9.28oil (ind.) Soil g 235 235 235 235 235oil biodegradable Soil g 122 122 122 122 122P-tot Soil g 4.65 4.66 4.67 4.74 4.74Pb (ind.) Soil mg 28.3 28.3 28.3 28.4 28.4S (ind.) Soil g 48.8 48.8 48.8 48.8 48.8Zn (ind.) Soil g 1.28 1.28 1.28 1.28 1.28Ag110m to air Non mat. mBq 36.4 36.4 36.4 36.5 36.5Ag110m to water Non mat. Bq 249 249 249 249 249alpha radiation (unspecified) to water Non mat. mBq 29.3 29.3 29.4 29.4 29.4Am241 to air Non mat. mBq 697 697 697 698 698Am241 to water Non mat. Bq 91.5 91.5 91.6 91.7 91.7Ar41 to air Non mat. kBq 79 79 79 79.1 79.1Ba140 to air Non mat. mBq 161 161 161 162 162Ba140 to water Non mat. mBq 772 773 773 773 773beta radiation (unspecified) to air Non mat. mBq 7.08 7.08 7.08 7.09 7.09C14 to air Non mat. kBq 56.8 56.8 56.8 56.9 56.9C14 to water Non mat. kBq 4.63 4.63 4.63 4.64 4.64Cd109 to water Non mat. mBq 4.48 4.48 4.48 4.48 4.48Ce141 to air Non mat. mBq 3.4 3.4 3.4 3.41 3.41Ce141 to water Non mat. mBq 116 116 116 116 116Ce144 to air Non mat. Bq 7.41 7.41 7.41 7.42 7.42
*An x means there are no data.
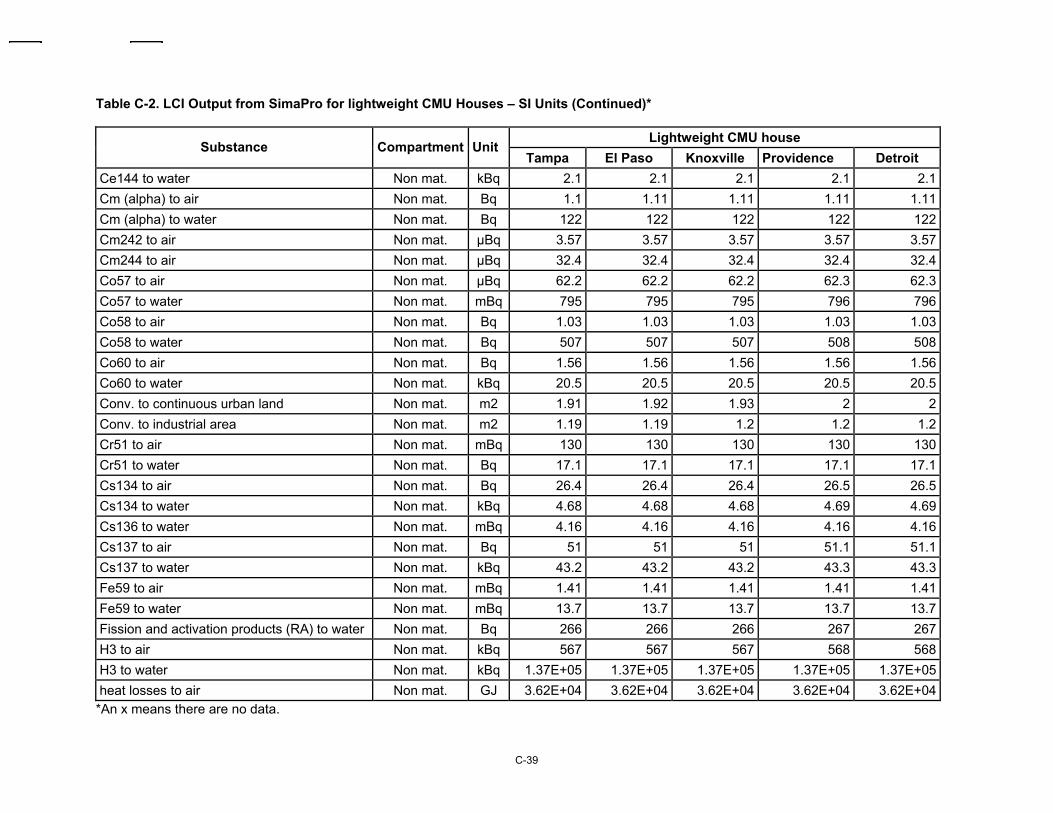
C-39
Table C-2. LCI Output from SimaPro for lightweight CMU Houses – SI Units (Continued)*
Lightweight CMU house Substance Compartment Unit
Tampa El Paso Knoxville Providence Detroit Ce144 to water Non mat. kBq 2.1 2.1 2.1 2.1 2.1Cm (alpha) to air Non mat. Bq 1.1 1.11 1.11 1.11 1.11Cm (alpha) to water Non mat. Bq 122 122 122 122 122Cm242 to air Non mat. µBq 3.57 3.57 3.57 3.57 3.57Cm244 to air Non mat. µBq 32.4 32.4 32.4 32.4 32.4Co57 to air Non mat. µBq 62.2 62.2 62.2 62.3 62.3Co57 to water Non mat. mBq 795 795 795 796 796Co58 to air Non mat. Bq 1.03 1.03 1.03 1.03 1.03Co58 to water Non mat. Bq 507 507 507 508 508Co60 to air Non mat. Bq 1.56 1.56 1.56 1.56 1.56Co60 to water Non mat. kBq 20.5 20.5 20.5 20.5 20.5Conv. to continuous urban land Non mat. m2 1.91 1.92 1.93 2 2Conv. to industrial area Non mat. m2 1.19 1.19 1.2 1.2 1.2Cr51 to air Non mat. mBq 130 130 130 130 130Cr51 to water Non mat. Bq 17.1 17.1 17.1 17.1 17.1Cs134 to air Non mat. Bq 26.4 26.4 26.4 26.5 26.5Cs134 to water Non mat. kBq 4.68 4.68 4.68 4.69 4.69Cs136 to water Non mat. mBq 4.16 4.16 4.16 4.16 4.16Cs137 to air Non mat. Bq 51 51 51 51.1 51.1Cs137 to water Non mat. kBq 43.2 43.2 43.2 43.3 43.3Fe59 to air Non mat. mBq 1.41 1.41 1.41 1.41 1.41Fe59 to water Non mat. mBq 13.7 13.7 13.7 13.7 13.7Fission and activation products (RA) to water Non mat. Bq 266 266 266 267 267H3 to air Non mat. kBq 567 567 567 568 568H3 to water Non mat. kBq 1.37E+05 1.37E+05 1.37E+05 1.37E+05 1.37E+05heat losses to air Non mat. GJ 3.62E+04 3.62E+04 3.62E+04 3.62E+04 3.62E+04
*An x means there are no data.
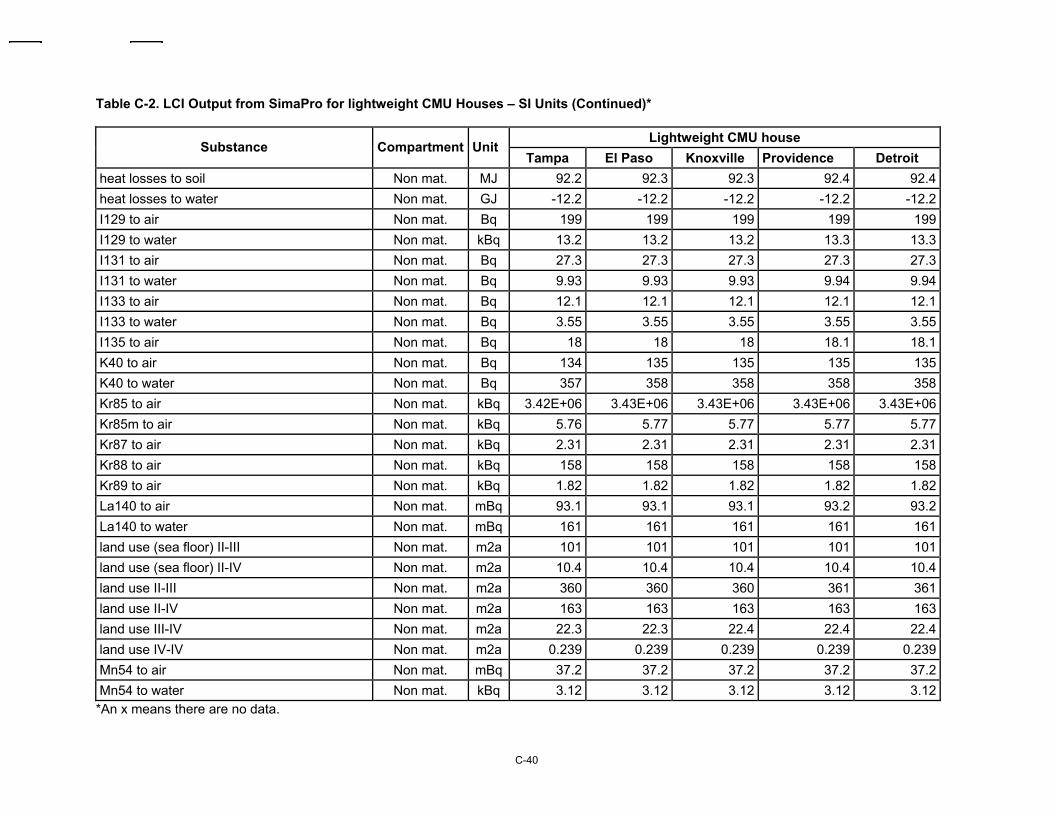
C-40
Table C-2. LCI Output from SimaPro for lightweight CMU Houses – SI Units (Continued)*
Lightweight CMU house Substance Compartment Unit
Tampa El Paso Knoxville Providence Detroit heat losses to soil Non mat. MJ 92.2 92.3 92.3 92.4 92.4heat losses to water Non mat. GJ -12.2 -12.2 -12.2 -12.2 -12.2I129 to air Non mat. Bq 199 199 199 199 199I129 to water Non mat. kBq 13.2 13.2 13.2 13.3 13.3I131 to air Non mat. Bq 27.3 27.3 27.3 27.3 27.3I131 to water Non mat. Bq 9.93 9.93 9.93 9.94 9.94I133 to air Non mat. Bq 12.1 12.1 12.1 12.1 12.1I133 to water Non mat. Bq 3.55 3.55 3.55 3.55 3.55I135 to air Non mat. Bq 18 18 18 18.1 18.1K40 to air Non mat. Bq 134 135 135 135 135K40 to water Non mat. Bq 357 358 358 358 358Kr85 to air Non mat. kBq 3.42E+06 3.43E+06 3.43E+06 3.43E+06 3.43E+06Kr85m to air Non mat. kBq 5.76 5.77 5.77 5.77 5.77Kr87 to air Non mat. kBq 2.31 2.31 2.31 2.31 2.31Kr88 to air Non mat. kBq 158 158 158 158 158Kr89 to air Non mat. kBq 1.82 1.82 1.82 1.82 1.82La140 to air Non mat. mBq 93.1 93.1 93.1 93.2 93.2La140 to water Non mat. mBq 161 161 161 161 161land use (sea floor) II-III Non mat. m2a 101 101 101 101 101land use (sea floor) II-IV Non mat. m2a 10.4 10.4 10.4 10.4 10.4land use II-III Non mat. m2a 360 360 360 361 361land use II-IV Non mat. m2a 163 163 163 163 163land use III-IV Non mat. m2a 22.3 22.3 22.4 22.4 22.4land use IV-IV Non mat. m2a 0.239 0.239 0.239 0.239 0.239Mn54 to air Non mat. mBq 37.2 37.2 37.2 37.2 37.2Mn54 to water Non mat. kBq 3.12 3.12 3.12 3.12 3.12
*An x means there are no data.
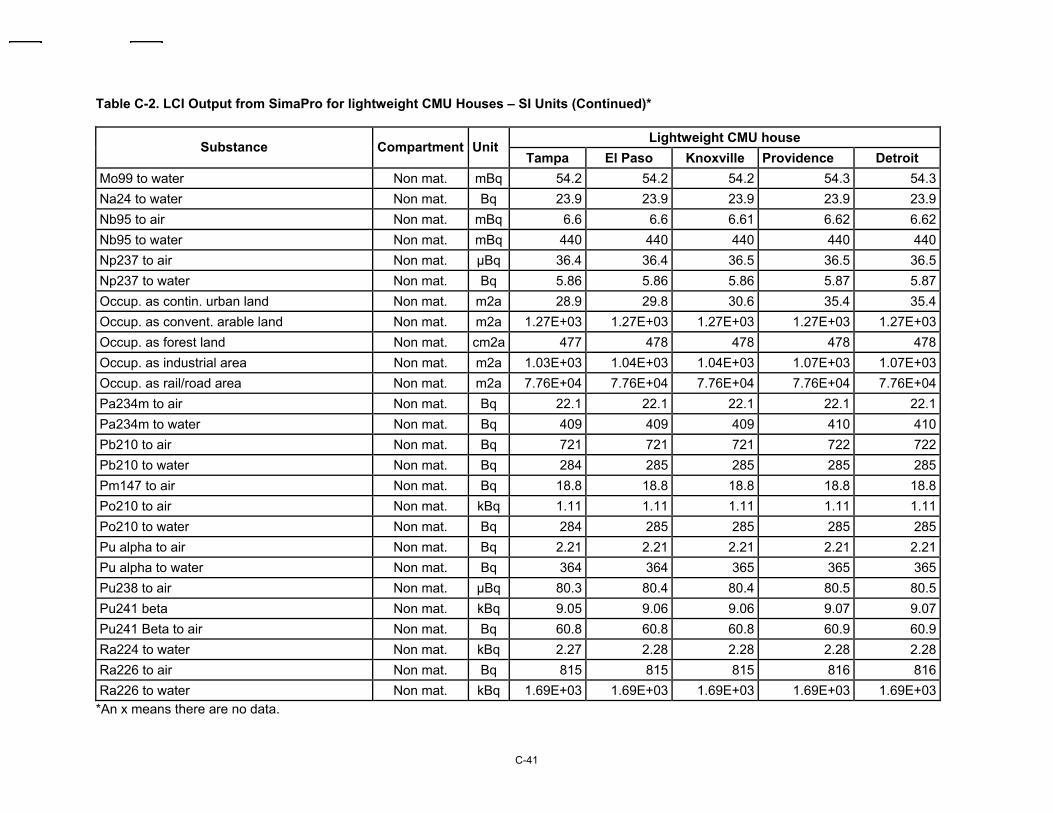
C-41
Table C-2. LCI Output from SimaPro for lightweight CMU Houses – SI Units (Continued)*
Lightweight CMU house Substance Compartment Unit
Tampa El Paso Knoxville Providence Detroit Mo99 to water Non mat. mBq 54.2 54.2 54.2 54.3 54.3Na24 to water Non mat. Bq 23.9 23.9 23.9 23.9 23.9Nb95 to air Non mat. mBq 6.6 6.6 6.61 6.62 6.62Nb95 to water Non mat. mBq 440 440 440 440 440Np237 to air Non mat. µBq 36.4 36.4 36.5 36.5 36.5Np237 to water Non mat. Bq 5.86 5.86 5.86 5.87 5.87Occup. as contin. urban land Non mat. m2a 28.9 29.8 30.6 35.4 35.4Occup. as convent. arable land Non mat. m2a 1.27E+03 1.27E+03 1.27E+03 1.27E+03 1.27E+03Occup. as forest land Non mat. cm2a 477 478 478 478 478Occup. as industrial area Non mat. m2a 1.03E+03 1.04E+03 1.04E+03 1.07E+03 1.07E+03Occup. as rail/road area Non mat. m2a 7.76E+04 7.76E+04 7.76E+04 7.76E+04 7.76E+04Pa234m to air Non mat. Bq 22.1 22.1 22.1 22.1 22.1Pa234m to water Non mat. Bq 409 409 409 410 410Pb210 to air Non mat. Bq 721 721 721 722 722Pb210 to water Non mat. Bq 284 285 285 285 285Pm147 to air Non mat. Bq 18.8 18.8 18.8 18.8 18.8Po210 to air Non mat. kBq 1.11 1.11 1.11 1.11 1.11Po210 to water Non mat. Bq 284 285 285 285 285Pu alpha to air Non mat. Bq 2.21 2.21 2.21 2.21 2.21Pu alpha to water Non mat. Bq 364 364 365 365 365Pu238 to air Non mat. µBq 80.3 80.4 80.4 80.5 80.5Pu241 beta Non mat. kBq 9.05 9.06 9.06 9.07 9.07Pu241 Beta to air Non mat. Bq 60.8 60.8 60.8 60.9 60.9Ra224 to water Non mat. kBq 2.27 2.28 2.28 2.28 2.28Ra226 to air Non mat. Bq 815 815 815 816 816Ra226 to water Non mat. kBq 1.69E+03 1.69E+03 1.69E+03 1.69E+03 1.69E+03
*An x means there are no data.
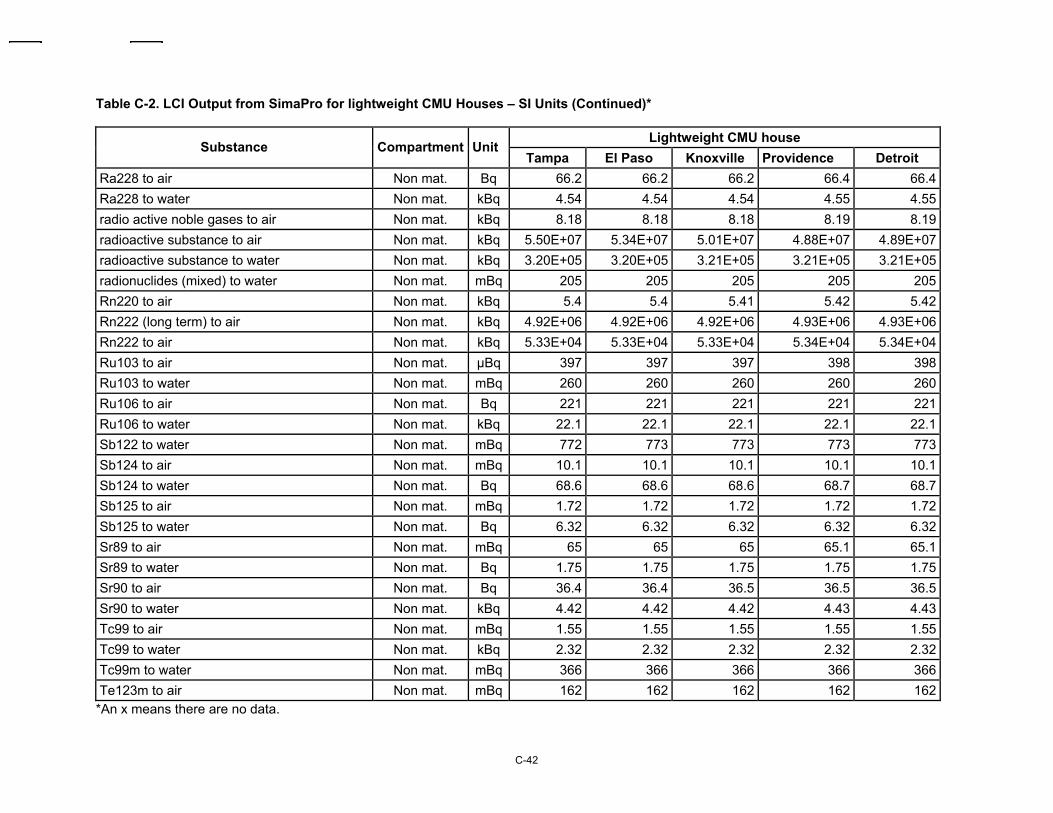
C-42
Table C-2. LCI Output from SimaPro for lightweight CMU Houses – SI Units (Continued)*
Lightweight CMU house Substance Compartment Unit
Tampa El Paso Knoxville Providence Detroit Ra228 to air Non mat. Bq 66.2 66.2 66.2 66.4 66.4Ra228 to water Non mat. kBq 4.54 4.54 4.54 4.55 4.55radio active noble gases to air Non mat. kBq 8.18 8.18 8.18 8.19 8.19radioactive substance to air Non mat. kBq 5.50E+07 5.34E+07 5.01E+07 4.88E+07 4.89E+07radioactive substance to water Non mat. kBq 3.20E+05 3.20E+05 3.21E+05 3.21E+05 3.21E+05radionuclides (mixed) to water Non mat. mBq 205 205 205 205 205Rn220 to air Non mat. kBq 5.4 5.4 5.41 5.42 5.42Rn222 (long term) to air Non mat. kBq 4.92E+06 4.92E+06 4.92E+06 4.93E+06 4.93E+06Rn222 to air Non mat. kBq 5.33E+04 5.33E+04 5.33E+04 5.34E+04 5.34E+04Ru103 to air Non mat. µBq 397 397 397 398 398Ru103 to water Non mat. mBq 260 260 260 260 260Ru106 to air Non mat. Bq 221 221 221 221 221Ru106 to water Non mat. kBq 22.1 22.1 22.1 22.1 22.1Sb122 to water Non mat. mBq 772 773 773 773 773Sb124 to air Non mat. mBq 10.1 10.1 10.1 10.1 10.1Sb124 to water Non mat. Bq 68.6 68.6 68.6 68.7 68.7Sb125 to air Non mat. mBq 1.72 1.72 1.72 1.72 1.72Sb125 to water Non mat. Bq 6.32 6.32 6.32 6.32 6.32Sr89 to air Non mat. mBq 65 65 65 65.1 65.1Sr89 to water Non mat. Bq 1.75 1.75 1.75 1.75 1.75Sr90 to air Non mat. Bq 36.4 36.4 36.5 36.5 36.5Sr90 to water Non mat. kBq 4.42 4.42 4.42 4.43 4.43Tc99 to air Non mat. mBq 1.55 1.55 1.55 1.55 1.55Tc99 to water Non mat. kBq 2.32 2.32 2.32 2.32 2.32Tc99m to water Non mat. mBq 366 366 366 366 366Te123m to air Non mat. mBq 162 162 162 162 162
*An x means there are no data.
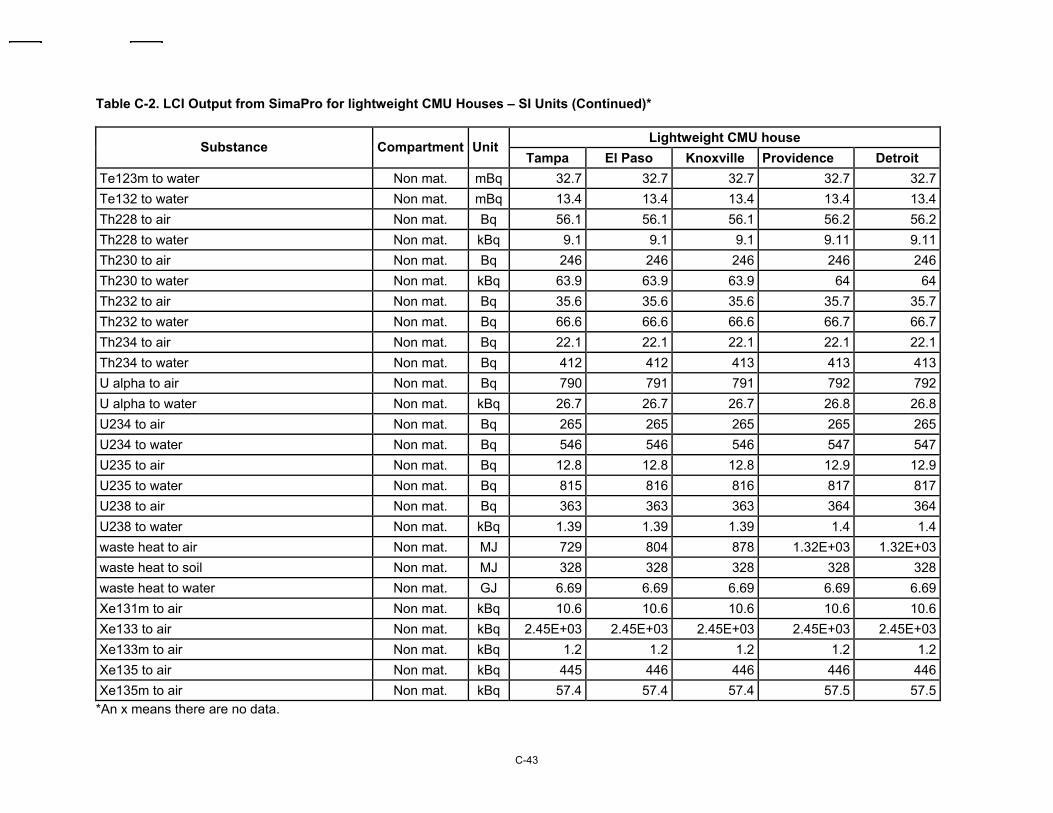
C-43
Table C-2. LCI Output from SimaPro for lightweight CMU Houses – SI Units (Continued)*
Lightweight CMU house Substance Compartment Unit
Tampa El Paso Knoxville Providence Detroit Te123m to water Non mat. mBq 32.7 32.7 32.7 32.7 32.7Te132 to water Non mat. mBq 13.4 13.4 13.4 13.4 13.4Th228 to air Non mat. Bq 56.1 56.1 56.1 56.2 56.2Th228 to water Non mat. kBq 9.1 9.1 9.1 9.11 9.11Th230 to air Non mat. Bq 246 246 246 246 246Th230 to water Non mat. kBq 63.9 63.9 63.9 64 64Th232 to air Non mat. Bq 35.6 35.6 35.6 35.7 35.7Th232 to water Non mat. Bq 66.6 66.6 66.6 66.7 66.7Th234 to air Non mat. Bq 22.1 22.1 22.1 22.1 22.1Th234 to water Non mat. Bq 412 412 413 413 413U alpha to air Non mat. Bq 790 791 791 792 792U alpha to water Non mat. kBq 26.7 26.7 26.7 26.8 26.8U234 to air Non mat. Bq 265 265 265 265 265U234 to water Non mat. Bq 546 546 546 547 547U235 to air Non mat. Bq 12.8 12.8 12.8 12.9 12.9U235 to water Non mat. Bq 815 816 816 817 817U238 to air Non mat. Bq 363 363 363 364 364U238 to water Non mat. kBq 1.39 1.39 1.39 1.4 1.4waste heat to air Non mat. MJ 729 804 878 1.32E+03 1.32E+03waste heat to soil Non mat. MJ 328 328 328 328 328waste heat to water Non mat. GJ 6.69 6.69 6.69 6.69 6.69Xe131m to air Non mat. kBq 10.6 10.6 10.6 10.6 10.6Xe133 to air Non mat. kBq 2.45E+03 2.45E+03 2.45E+03 2.45E+03 2.45E+03Xe133m to air Non mat. kBq 1.2 1.2 1.2 1.2 1.2Xe135 to air Non mat. kBq 445 446 446 446 446Xe135m to air Non mat. kBq 57.4 57.4 57.4 57.5 57.5
*An x means there are no data.
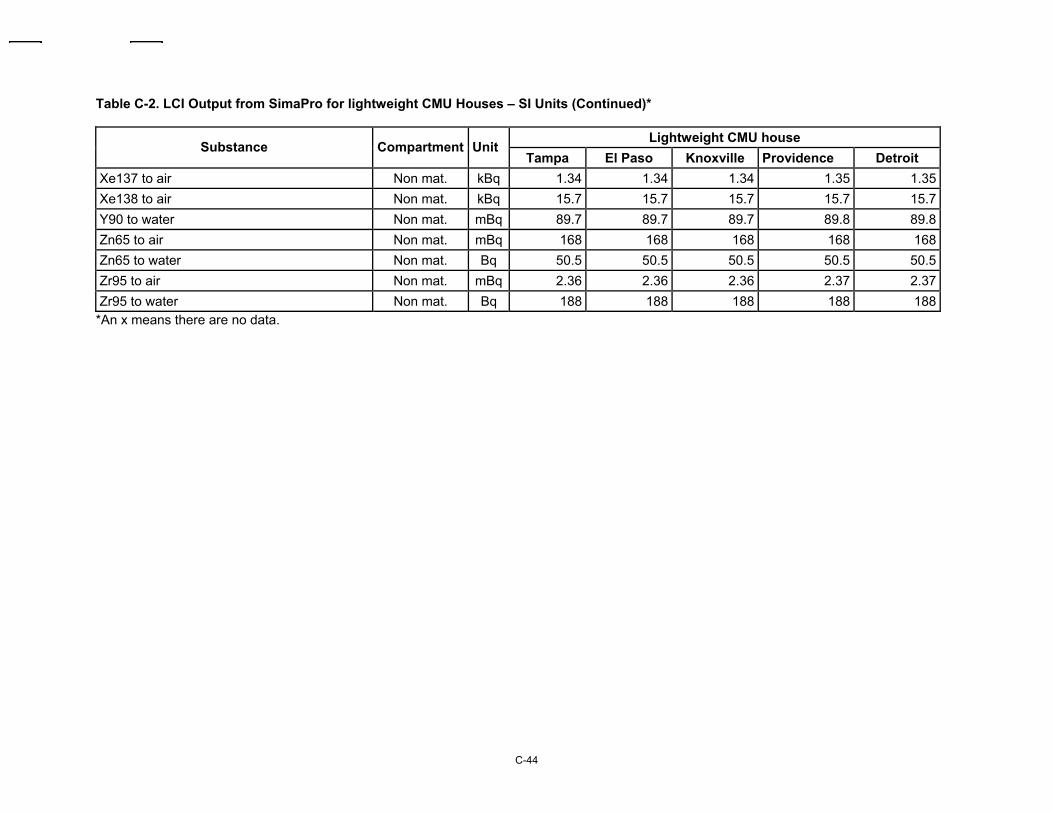
C-44
Table C-2. LCI Output from SimaPro for lightweight CMU Houses – SI Units (Continued)*
Lightweight CMU house Substance Compartment Unit
Tampa El Paso Knoxville Providence Detroit Xe137 to air Non mat. kBq 1.34 1.34 1.34 1.35 1.35Xe138 to air Non mat. kBq 15.7 15.7 15.7 15.7 15.7Y90 to water Non mat. mBq 89.7 89.7 89.7 89.8 89.8Zn65 to air Non mat. mBq 168 168 168 168 168Zn65 to water Non mat. Bq 50.5 50.5 50.5 50.5 50.5Zr95 to air Non mat. mBq 2.36 2.36 2.36 2.37 2.37Zr95 to water Non mat. Bq 188 188 188 188 188
*An x means there are no data.
D-1
APPENDIX D – LCI DATA FOR WOOD HOUSES AND LIGHTWEIGHT CMU HOUSES – U.S. CUSTOMARY UNITS
D-2
SIMAPRO: A LIFE CYCLE ASSESSMENT TOOL The Dutch company PRé Consultants is a leader in developing tools for life cycle assessment. They created and continue to develop SimaPro, the most widely used life cycle assessment tool (www.pre.nl/simapro). SimaPro can be used to perform detailed and robust life cycle assessments of materials, components, buildings, and processes. It contains a large database of products and processes and seven comprehensive, widely-accepted impact assessment methods. The user can either build up a product or process from scratch using the databases supplied with SimaPro, or the LCI of an existing product or process can be augmented with upstream and downstream profiles for other processes to determine a life cycle assessment. The impact assessment methods can be utilized to determine the impacts of materials, energy use, and pollutants. For example, upstream profiles can be the energy sources or extraction of raw materials. Downstream profiles can be other manufacturing steps used to make a final product.
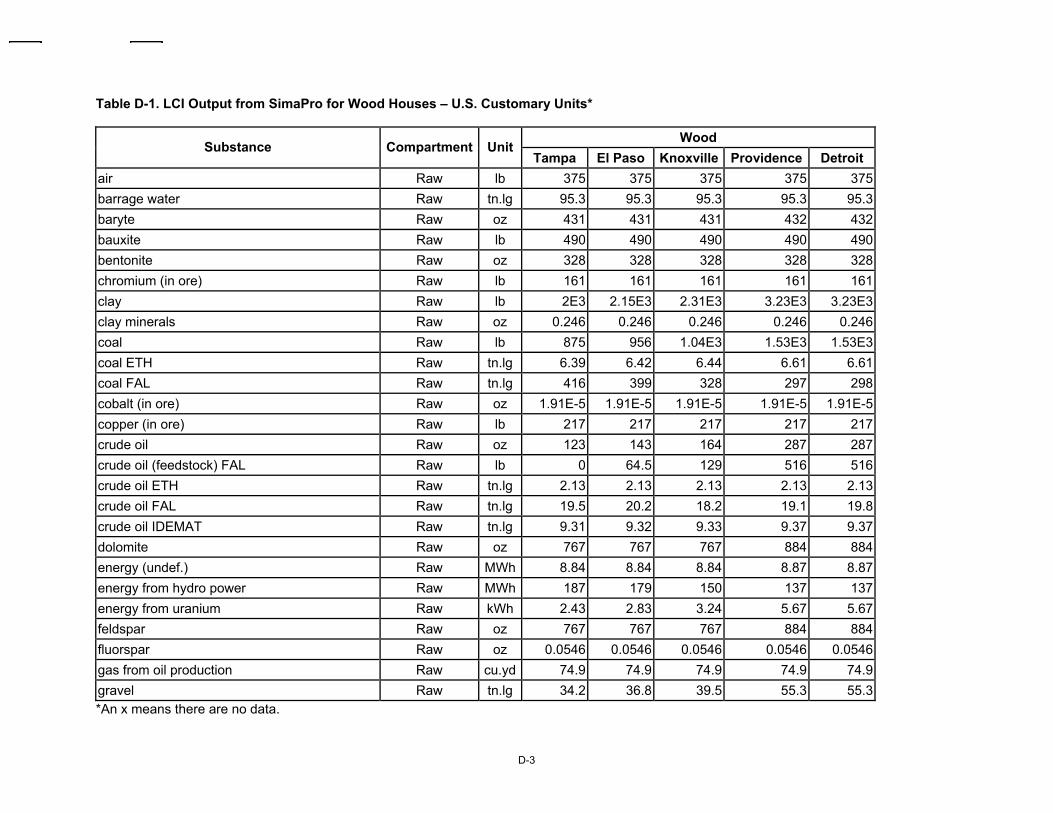
D-3
Table D-1. LCI Output from SimaPro for Wood Houses – U.S. Customary Units*
Wood Substance Compartment Unit
Tampa El Paso Knoxville Providence Detroit air Raw lb 375 375 375 375 375barrage water Raw tn.lg 95.3 95.3 95.3 95.3 95.3baryte Raw oz 431 431 431 432 432bauxite Raw lb 490 490 490 490 490bentonite Raw oz 328 328 328 328 328chromium (in ore) Raw lb 161 161 161 161 161clay Raw lb 2E3 2.15E3 2.31E3 3.23E3 3.23E3clay minerals Raw oz 0.246 0.246 0.246 0.246 0.246coal Raw lb 875 956 1.04E3 1.53E3 1.53E3coal ETH Raw tn.lg 6.39 6.42 6.44 6.61 6.61coal FAL Raw tn.lg 416 399 328 297 298cobalt (in ore) Raw oz 1.91E-5 1.91E-5 1.91E-5 1.91E-5 1.91E-5copper (in ore) Raw lb 217 217 217 217 217crude oil Raw oz 123 143 164 287 287crude oil (feedstock) FAL Raw lb 0 64.5 129 516 516crude oil ETH Raw tn.lg 2.13 2.13 2.13 2.13 2.13crude oil FAL Raw tn.lg 19.5 20.2 18.2 19.1 19.8crude oil IDEMAT Raw tn.lg 9.31 9.32 9.33 9.37 9.37dolomite Raw oz 767 767 767 884 884energy (undef.) Raw MWh 8.84 8.84 8.84 8.87 8.87energy from hydro power Raw MWh 187 179 150 137 137energy from uranium Raw kWh 2.43 2.83 3.24 5.67 5.67feldspar Raw oz 767 767 767 884 884fluorspar Raw oz 0.0546 0.0546 0.0546 0.0546 0.0546gas from oil production Raw cu.yd 74.9 74.9 74.9 74.9 74.9gravel Raw tn.lg 34.2 36.8 39.5 55.3 55.3*An x means there are no data.
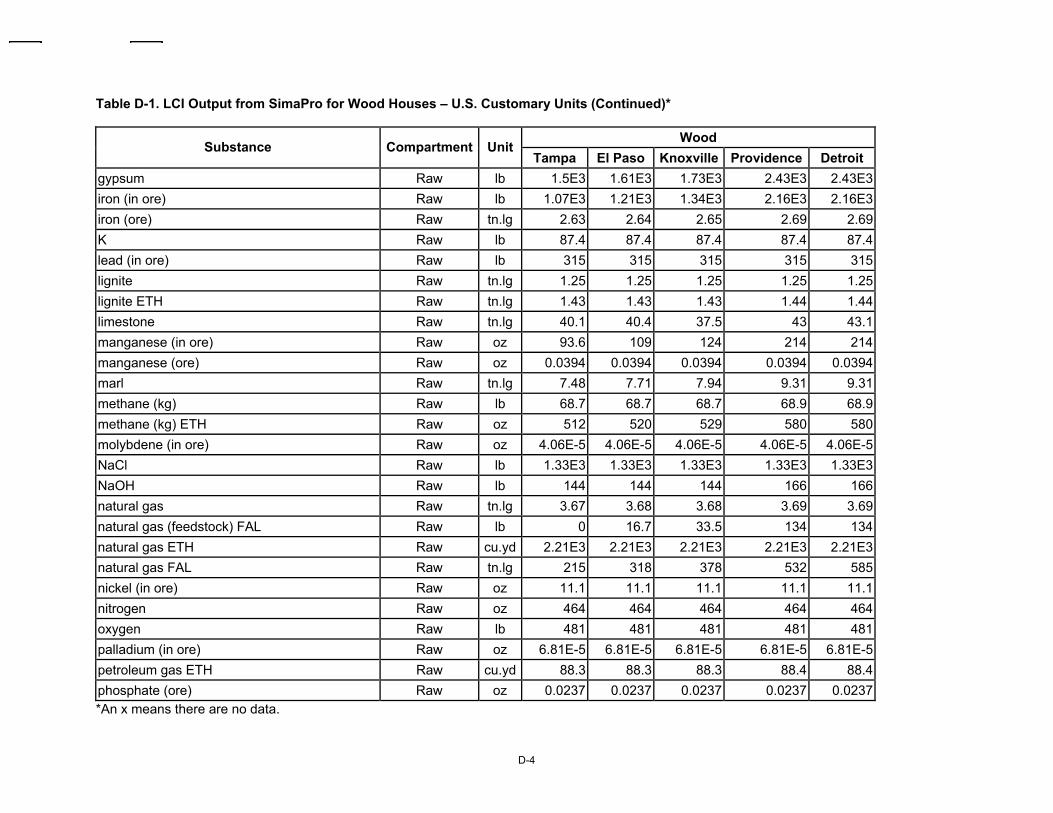
D-4
Table D-1. LCI Output from SimaPro for Wood Houses – U.S. Customary Units (Continued)*
Wood Substance Compartment Unit
Tampa El Paso Knoxville Providence Detroit gypsum Raw lb 1.5E3 1.61E3 1.73E3 2.43E3 2.43E3iron (in ore) Raw lb 1.07E3 1.21E3 1.34E3 2.16E3 2.16E3iron (ore) Raw tn.lg 2.63 2.64 2.65 2.69 2.69K Raw lb 87.4 87.4 87.4 87.4 87.4lead (in ore) Raw lb 315 315 315 315 315lignite Raw tn.lg 1.25 1.25 1.25 1.25 1.25lignite ETH Raw tn.lg 1.43 1.43 1.43 1.44 1.44limestone Raw tn.lg 40.1 40.4 37.5 43 43.1manganese (in ore) Raw oz 93.6 109 124 214 214manganese (ore) Raw oz 0.0394 0.0394 0.0394 0.0394 0.0394marl Raw tn.lg 7.48 7.71 7.94 9.31 9.31methane (kg) Raw lb 68.7 68.7 68.7 68.9 68.9methane (kg) ETH Raw oz 512 520 529 580 580molybdene (in ore) Raw oz 4.06E-5 4.06E-5 4.06E-5 4.06E-5 4.06E-5NaCl Raw lb 1.33E3 1.33E3 1.33E3 1.33E3 1.33E3NaOH Raw lb 144 144 144 166 166natural gas Raw tn.lg 3.67 3.68 3.68 3.69 3.69natural gas (feedstock) FAL Raw lb 0 16.7 33.5 134 134natural gas ETH Raw cu.yd 2.21E3 2.21E3 2.21E3 2.21E3 2.21E3natural gas FAL Raw tn.lg 215 318 378 532 585nickel (in ore) Raw oz 11.1 11.1 11.1 11.1 11.1nitrogen Raw oz 464 464 464 464 464oxygen Raw lb 481 481 481 481 481palladium (in ore) Raw oz 6.81E-5 6.81E-5 6.81E-5 6.81E-5 6.81E-5petroleum gas ETH Raw cu.yd 88.3 88.3 88.3 88.4 88.4phosphate (ore) Raw oz 0.0237 0.0237 0.0237 0.0237 0.0237*An x means there are no data.
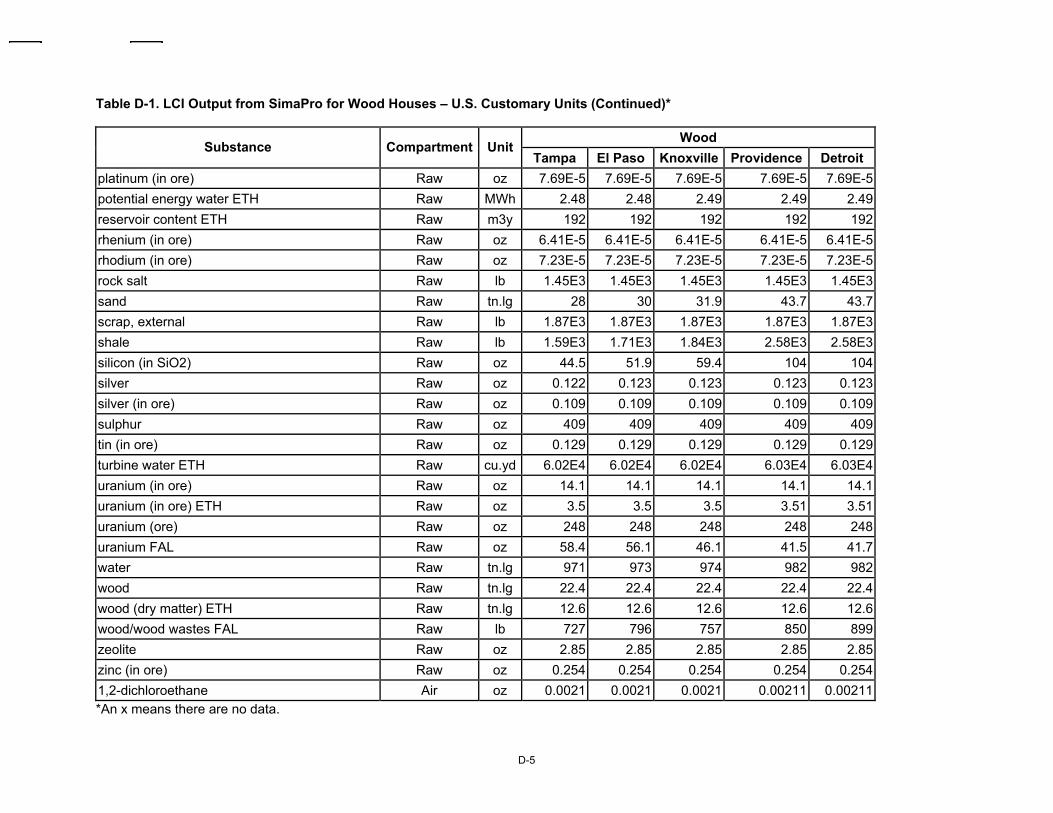
D-5
Table D-1. LCI Output from SimaPro for Wood Houses – U.S. Customary Units (Continued)*
Wood Substance Compartment Unit
Tampa El Paso Knoxville Providence Detroit platinum (in ore) Raw oz 7.69E-5 7.69E-5 7.69E-5 7.69E-5 7.69E-5potential energy water ETH Raw MWh 2.48 2.48 2.49 2.49 2.49reservoir content ETH Raw m3y 192 192 192 192 192rhenium (in ore) Raw oz 6.41E-5 6.41E-5 6.41E-5 6.41E-5 6.41E-5rhodium (in ore) Raw oz 7.23E-5 7.23E-5 7.23E-5 7.23E-5 7.23E-5rock salt Raw lb 1.45E3 1.45E3 1.45E3 1.45E3 1.45E3sand Raw tn.lg 28 30 31.9 43.7 43.7scrap, external Raw lb 1.87E3 1.87E3 1.87E3 1.87E3 1.87E3shale Raw lb 1.59E3 1.71E3 1.84E3 2.58E3 2.58E3silicon (in SiO2) Raw oz 44.5 51.9 59.4 104 104silver Raw oz 0.122 0.123 0.123 0.123 0.123silver (in ore) Raw oz 0.109 0.109 0.109 0.109 0.109sulphur Raw oz 409 409 409 409 409tin (in ore) Raw oz 0.129 0.129 0.129 0.129 0.129turbine water ETH Raw cu.yd 6.02E4 6.02E4 6.02E4 6.03E4 6.03E4uranium (in ore) Raw oz 14.1 14.1 14.1 14.1 14.1uranium (in ore) ETH Raw oz 3.5 3.5 3.5 3.51 3.51uranium (ore) Raw oz 248 248 248 248 248uranium FAL Raw oz 58.4 56.1 46.1 41.5 41.7water Raw tn.lg 971 973 974 982 982wood Raw tn.lg 22.4 22.4 22.4 22.4 22.4wood (dry matter) ETH Raw tn.lg 12.6 12.6 12.6 12.6 12.6wood/wood wastes FAL Raw lb 727 796 757 850 899zeolite Raw oz 2.85 2.85 2.85 2.85 2.85zinc (in ore) Raw oz 0.254 0.254 0.254 0.254 0.2541,2-dichloroethane Air oz 0.0021 0.0021 0.0021 0.00211 0.00211*An x means there are no data.
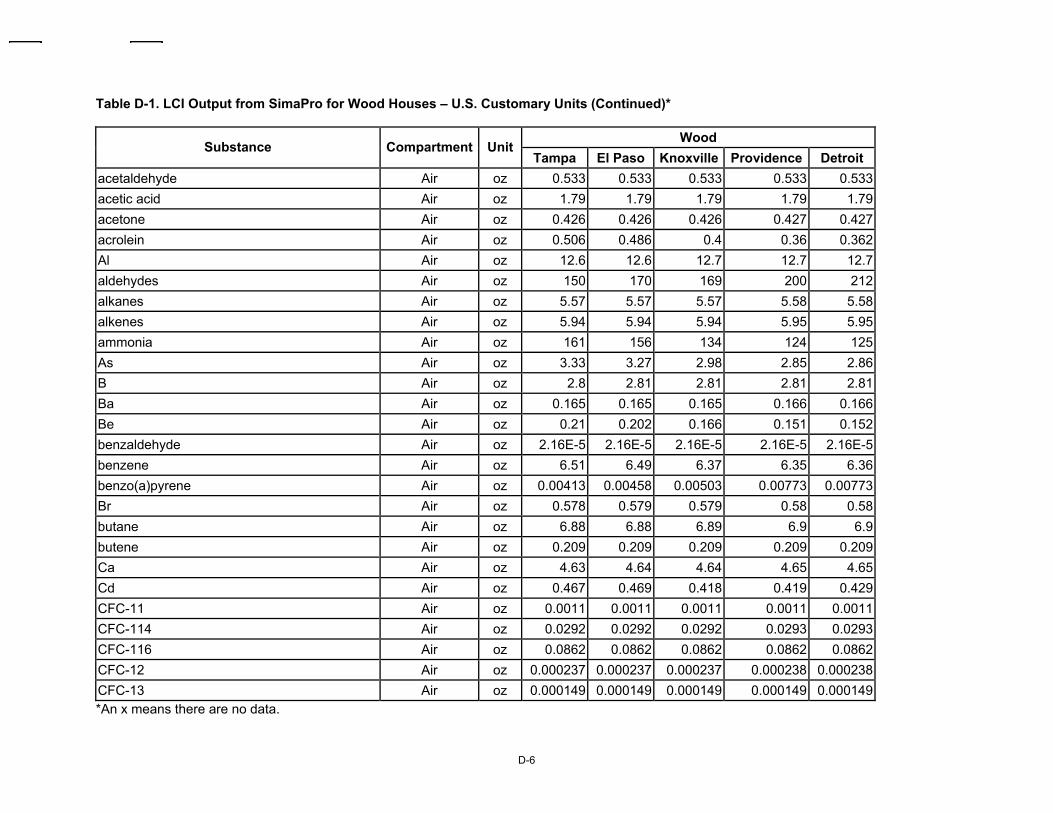
D-6
Table D-1. LCI Output from SimaPro for Wood Houses – U.S. Customary Units (Continued)*
Wood Substance Compartment Unit
Tampa El Paso Knoxville Providence Detroit acetaldehyde Air oz 0.533 0.533 0.533 0.533 0.533acetic acid Air oz 1.79 1.79 1.79 1.79 1.79acetone Air oz 0.426 0.426 0.426 0.427 0.427acrolein Air oz 0.506 0.486 0.4 0.36 0.362Al Air oz 12.6 12.6 12.7 12.7 12.7aldehydes Air oz 150 170 169 200 212alkanes Air oz 5.57 5.57 5.57 5.58 5.58alkenes Air oz 5.94 5.94 5.94 5.95 5.95ammonia Air oz 161 156 134 124 125As Air oz 3.33 3.27 2.98 2.85 2.86B Air oz 2.8 2.81 2.81 2.81 2.81Ba Air oz 0.165 0.165 0.165 0.166 0.166Be Air oz 0.21 0.202 0.166 0.151 0.152benzaldehyde Air oz 2.16E-5 2.16E-5 2.16E-5 2.16E-5 2.16E-5benzene Air oz 6.51 6.49 6.37 6.35 6.36benzo(a)pyrene Air oz 0.00413 0.00458 0.00503 0.00773 0.00773Br Air oz 0.578 0.579 0.579 0.58 0.58butane Air oz 6.88 6.88 6.89 6.9 6.9butene Air oz 0.209 0.209 0.209 0.209 0.209Ca Air oz 4.63 4.64 4.64 4.65 4.65Cd Air oz 0.467 0.469 0.418 0.419 0.429CFC-11 Air oz 0.0011 0.0011 0.0011 0.0011 0.0011CFC-114 Air oz 0.0292 0.0292 0.0292 0.0293 0.0293CFC-116 Air oz 0.0862 0.0862 0.0862 0.0862 0.0862CFC-12 Air oz 0.000237 0.000237 0.000237 0.000238 0.000238CFC-13 Air oz 0.000149 0.000149 0.000149 0.000149 0.000149*An x means there are no data.
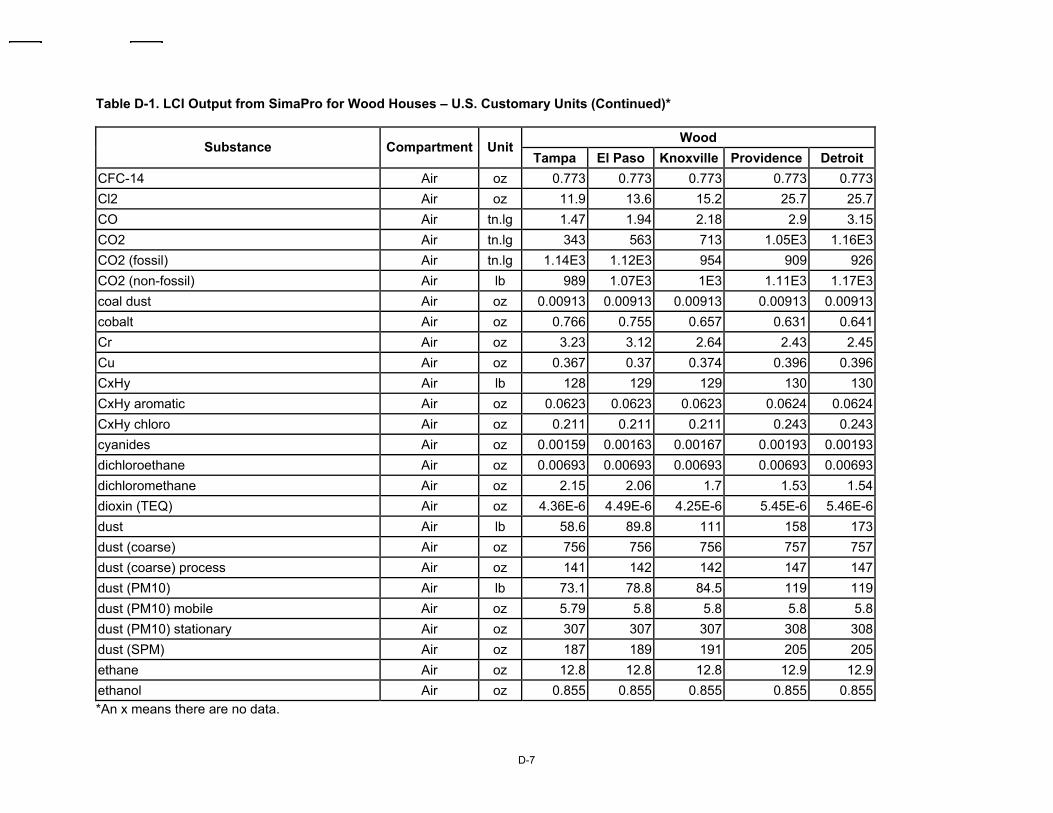
D-7
Table D-1. LCI Output from SimaPro for Wood Houses – U.S. Customary Units (Continued)*
Wood Substance Compartment Unit
Tampa El Paso Knoxville Providence Detroit CFC-14 Air oz 0.773 0.773 0.773 0.773 0.773Cl2 Air oz 11.9 13.6 15.2 25.7 25.7CO Air tn.lg 1.47 1.94 2.18 2.9 3.15CO2 Air tn.lg 343 563 713 1.05E3 1.16E3CO2 (fossil) Air tn.lg 1.14E3 1.12E3 954 909 926CO2 (non-fossil) Air lb 989 1.07E3 1E3 1.11E3 1.17E3coal dust Air oz 0.00913 0.00913 0.00913 0.00913 0.00913cobalt Air oz 0.766 0.755 0.657 0.631 0.641Cr Air oz 3.23 3.12 2.64 2.43 2.45Cu Air oz 0.367 0.37 0.374 0.396 0.396CxHy Air lb 128 129 129 130 130CxHy aromatic Air oz 0.0623 0.0623 0.0623 0.0624 0.0624CxHy chloro Air oz 0.211 0.211 0.211 0.243 0.243cyanides Air oz 0.00159 0.00163 0.00167 0.00193 0.00193dichloroethane Air oz 0.00693 0.00693 0.00693 0.00693 0.00693dichloromethane Air oz 2.15 2.06 1.7 1.53 1.54dioxin (TEQ) Air oz 4.36E-6 4.49E-6 4.25E-6 5.45E-6 5.46E-6dust Air lb 58.6 89.8 111 158 173dust (coarse) Air oz 756 756 756 757 757dust (coarse) process Air oz 141 142 142 147 147dust (PM10) Air lb 73.1 78.8 84.5 119 119dust (PM10) mobile Air oz 5.79 5.8 5.8 5.8 5.8dust (PM10) stationary Air oz 307 307 307 308 308dust (SPM) Air oz 187 189 191 205 205ethane Air oz 12.8 12.8 12.8 12.9 12.9ethanol Air oz 0.855 0.855 0.855 0.855 0.855*An x means there are no data.
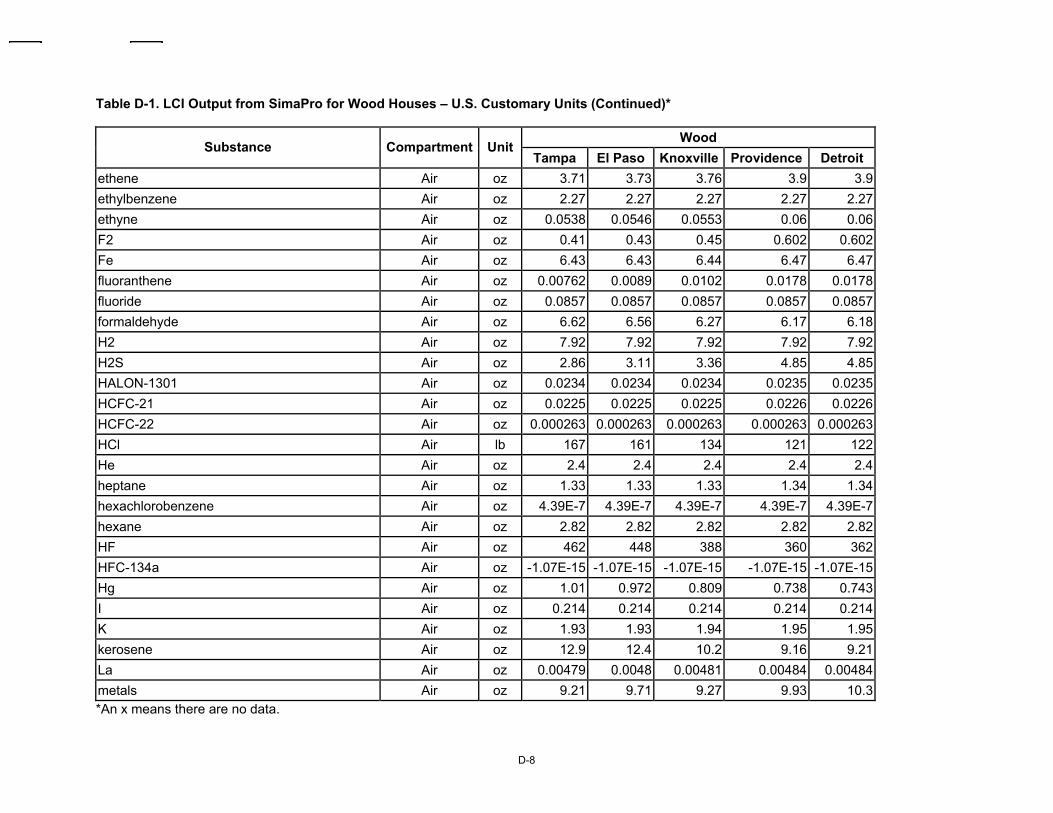
D-8
Table D-1. LCI Output from SimaPro for Wood Houses – U.S. Customary Units (Continued)*
Wood Substance Compartment Unit
Tampa El Paso Knoxville Providence Detroit ethene Air oz 3.71 3.73 3.76 3.9 3.9ethylbenzene Air oz 2.27 2.27 2.27 2.27 2.27ethyne Air oz 0.0538 0.0546 0.0553 0.06 0.06F2 Air oz 0.41 0.43 0.45 0.602 0.602Fe Air oz 6.43 6.43 6.44 6.47 6.47fluoranthene Air oz 0.00762 0.0089 0.0102 0.0178 0.0178fluoride Air oz 0.0857 0.0857 0.0857 0.0857 0.0857formaldehyde Air oz 6.62 6.56 6.27 6.17 6.18H2 Air oz 7.92 7.92 7.92 7.92 7.92H2S Air oz 2.86 3.11 3.36 4.85 4.85HALON-1301 Air oz 0.0234 0.0234 0.0234 0.0235 0.0235HCFC-21 Air oz 0.0225 0.0225 0.0225 0.0226 0.0226HCFC-22 Air oz 0.000263 0.000263 0.000263 0.000263 0.000263HCl Air lb 167 161 134 121 122He Air oz 2.4 2.4 2.4 2.4 2.4heptane Air oz 1.33 1.33 1.33 1.34 1.34hexachlorobenzene Air oz 4.39E-7 4.39E-7 4.39E-7 4.39E-7 4.39E-7hexane Air oz 2.82 2.82 2.82 2.82 2.82HF Air oz 462 448 388 360 362HFC-134a Air oz -1.07E-15 -1.07E-15 -1.07E-15 -1.07E-15 -1.07E-15Hg Air oz 1.01 0.972 0.809 0.738 0.743I Air oz 0.214 0.214 0.214 0.214 0.214K Air oz 1.93 1.93 1.94 1.95 1.95kerosene Air oz 12.9 12.4 10.2 9.16 9.21La Air oz 0.00479 0.0048 0.00481 0.00484 0.00484metals Air oz 9.21 9.71 9.27 9.93 10.3*An x means there are no data.
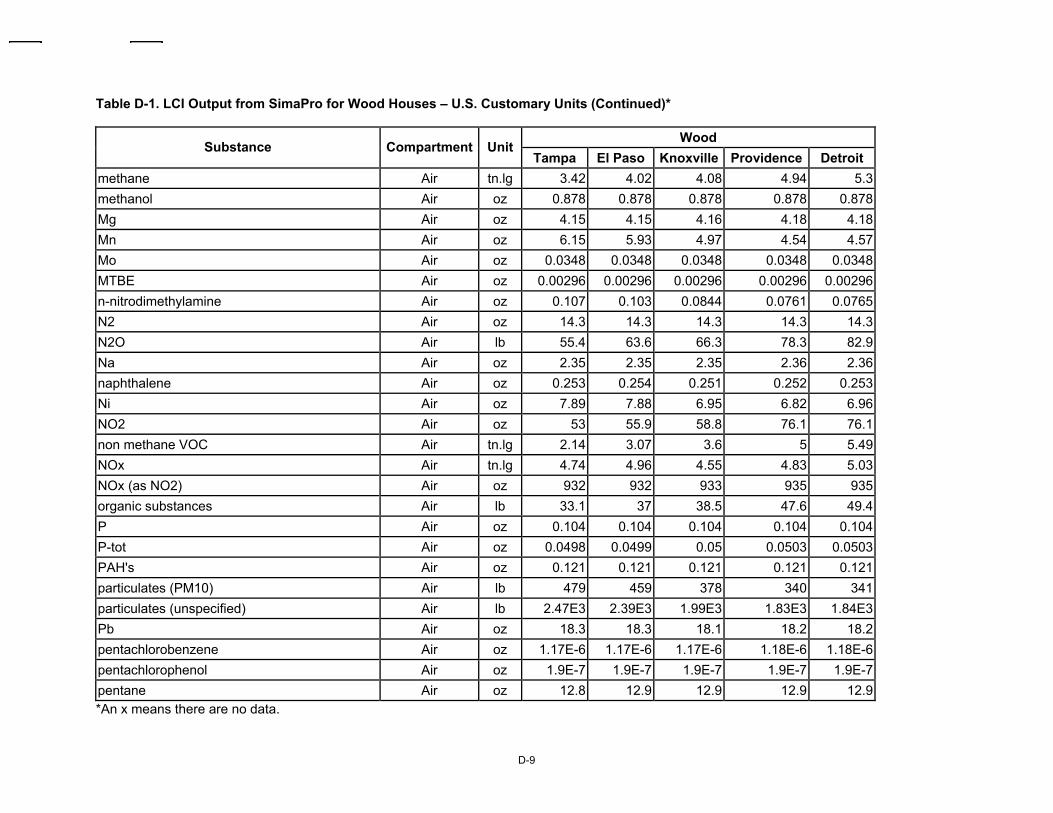
D-9
Table D-1. LCI Output from SimaPro for Wood Houses – U.S. Customary Units (Continued)*
Wood Substance Compartment Unit
Tampa El Paso Knoxville Providence Detroit methane Air tn.lg 3.42 4.02 4.08 4.94 5.3methanol Air oz 0.878 0.878 0.878 0.878 0.878Mg Air oz 4.15 4.15 4.16 4.18 4.18Mn Air oz 6.15 5.93 4.97 4.54 4.57Mo Air oz 0.0348 0.0348 0.0348 0.0348 0.0348MTBE Air oz 0.00296 0.00296 0.00296 0.00296 0.00296n-nitrodimethylamine Air oz 0.107 0.103 0.0844 0.0761 0.0765N2 Air oz 14.3 14.3 14.3 14.3 14.3N2O Air lb 55.4 63.6 66.3 78.3 82.9Na Air oz 2.35 2.35 2.35 2.36 2.36naphthalene Air oz 0.253 0.254 0.251 0.252 0.253Ni Air oz 7.89 7.88 6.95 6.82 6.96NO2 Air oz 53 55.9 58.8 76.1 76.1non methane VOC Air tn.lg 2.14 3.07 3.6 5 5.49NOx Air tn.lg 4.74 4.96 4.55 4.83 5.03NOx (as NO2) Air oz 932 932 933 935 935organic substances Air lb 33.1 37 38.5 47.6 49.4P Air oz 0.104 0.104 0.104 0.104 0.104P-tot Air oz 0.0498 0.0499 0.05 0.0503 0.0503PAH's Air oz 0.121 0.121 0.121 0.121 0.121particulates (PM10) Air lb 479 459 378 340 341particulates (unspecified) Air lb 2.47E3 2.39E3 1.99E3 1.83E3 1.84E3Pb Air oz 18.3 18.3 18.1 18.2 18.2pentachlorobenzene Air oz 1.17E-6 1.17E-6 1.17E-6 1.18E-6 1.18E-6pentachlorophenol Air oz 1.9E-7 1.9E-7 1.9E-7 1.9E-7 1.9E-7pentane Air oz 12.8 12.9 12.9 12.9 12.9*An x means there are no data.
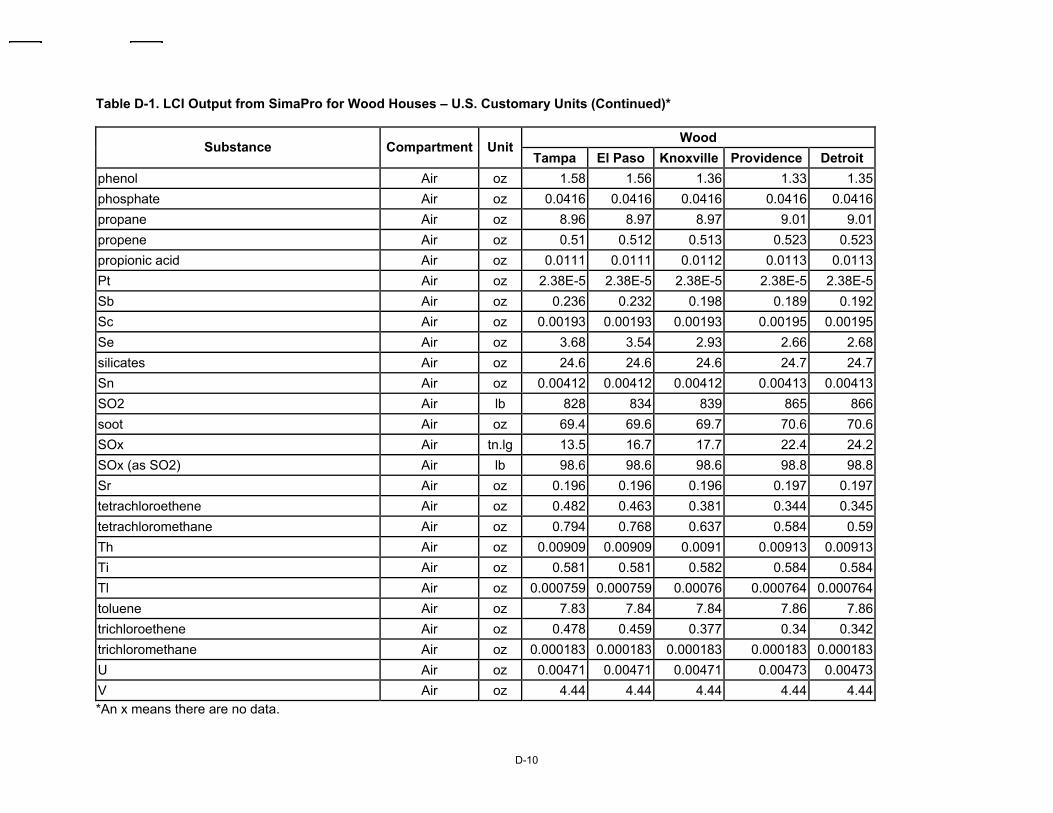
D-10
Table D-1. LCI Output from SimaPro for Wood Houses – U.S. Customary Units (Continued)*
Wood Substance Compartment Unit
Tampa El Paso Knoxville Providence Detroit phenol Air oz 1.58 1.56 1.36 1.33 1.35phosphate Air oz 0.0416 0.0416 0.0416 0.0416 0.0416propane Air oz 8.96 8.97 8.97 9.01 9.01propene Air oz 0.51 0.512 0.513 0.523 0.523propionic acid Air oz 0.0111 0.0111 0.0112 0.0113 0.0113Pt Air oz 2.38E-5 2.38E-5 2.38E-5 2.38E-5 2.38E-5Sb Air oz 0.236 0.232 0.198 0.189 0.192Sc Air oz 0.00193 0.00193 0.00193 0.00195 0.00195Se Air oz 3.68 3.54 2.93 2.66 2.68silicates Air oz 24.6 24.6 24.6 24.7 24.7Sn Air oz 0.00412 0.00412 0.00412 0.00413 0.00413SO2 Air lb 828 834 839 865 866soot Air oz 69.4 69.6 69.7 70.6 70.6SOx Air tn.lg 13.5 16.7 17.7 22.4 24.2SOx (as SO2) Air lb 98.6 98.6 98.6 98.8 98.8Sr Air oz 0.196 0.196 0.196 0.197 0.197tetrachloroethene Air oz 0.482 0.463 0.381 0.344 0.345tetrachloromethane Air oz 0.794 0.768 0.637 0.584 0.59Th Air oz 0.00909 0.00909 0.0091 0.00913 0.00913Ti Air oz 0.581 0.581 0.582 0.584 0.584Tl Air oz 0.000759 0.000759 0.00076 0.000764 0.000764toluene Air oz 7.83 7.84 7.84 7.86 7.86trichloroethene Air oz 0.478 0.459 0.377 0.34 0.342trichloromethane Air oz 0.000183 0.000183 0.000183 0.000183 0.000183U Air oz 0.00471 0.00471 0.00471 0.00473 0.00473V Air oz 4.44 4.44 4.44 4.44 4.44*An x means there are no data.
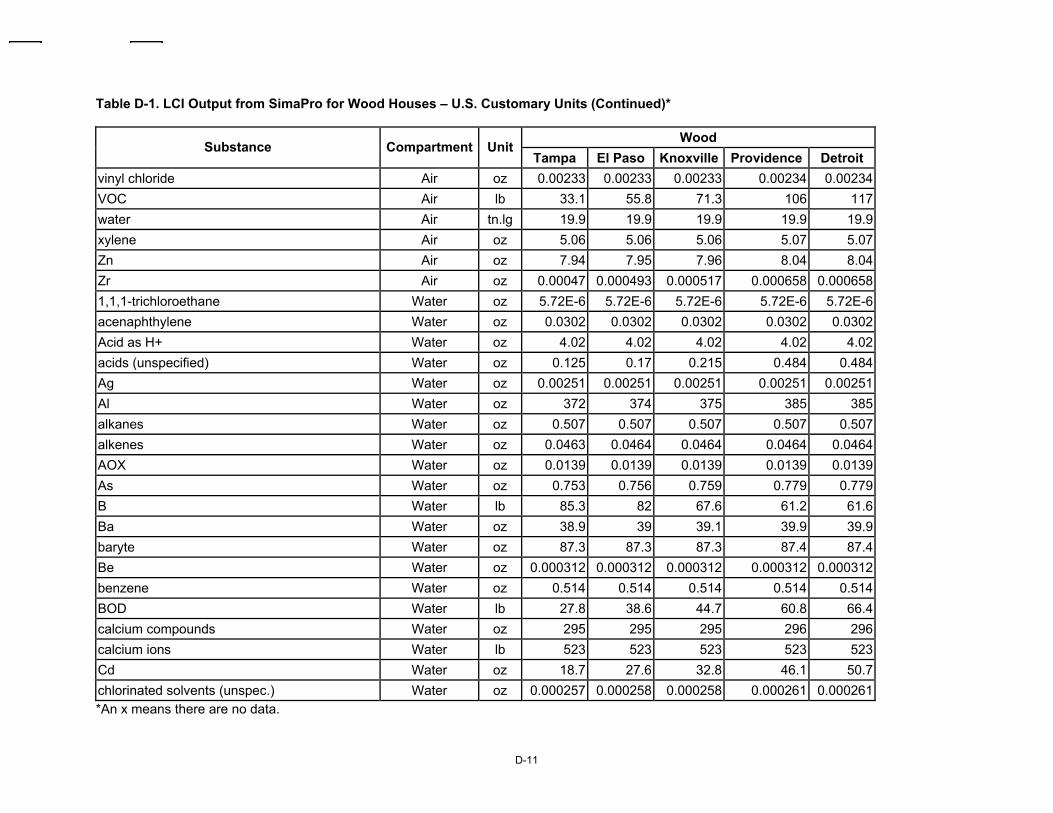
D-11
Table D-1. LCI Output from SimaPro for Wood Houses – U.S. Customary Units (Continued)*
Wood Substance Compartment Unit
Tampa El Paso Knoxville Providence Detroit vinyl chloride Air oz 0.00233 0.00233 0.00233 0.00234 0.00234VOC Air lb 33.1 55.8 71.3 106 117water Air tn.lg 19.9 19.9 19.9 19.9 19.9xylene Air oz 5.06 5.06 5.06 5.07 5.07Zn Air oz 7.94 7.95 7.96 8.04 8.04Zr Air oz 0.00047 0.000493 0.000517 0.000658 0.0006581,1,1-trichloroethane Water oz 5.72E-6 5.72E-6 5.72E-6 5.72E-6 5.72E-6acenaphthylene Water oz 0.0302 0.0302 0.0302 0.0302 0.0302Acid as H+ Water oz 4.02 4.02 4.02 4.02 4.02acids (unspecified) Water oz 0.125 0.17 0.215 0.484 0.484Ag Water oz 0.00251 0.00251 0.00251 0.00251 0.00251Al Water oz 372 374 375 385 385alkanes Water oz 0.507 0.507 0.507 0.507 0.507alkenes Water oz 0.0463 0.0464 0.0464 0.0464 0.0464AOX Water oz 0.0139 0.0139 0.0139 0.0139 0.0139As Water oz 0.753 0.756 0.759 0.779 0.779B Water lb 85.3 82 67.6 61.2 61.6Ba Water oz 38.9 39 39.1 39.9 39.9baryte Water oz 87.3 87.3 87.3 87.4 87.4Be Water oz 0.000312 0.000312 0.000312 0.000312 0.000312benzene Water oz 0.514 0.514 0.514 0.514 0.514BOD Water lb 27.8 38.6 44.7 60.8 66.4calcium compounds Water oz 295 295 295 296 296calcium ions Water lb 523 523 523 523 523Cd Water oz 18.7 27.6 32.8 46.1 50.7chlorinated solvents (unspec.) Water oz 0.000257 0.000258 0.000258 0.000261 0.000261*An x means there are no data.
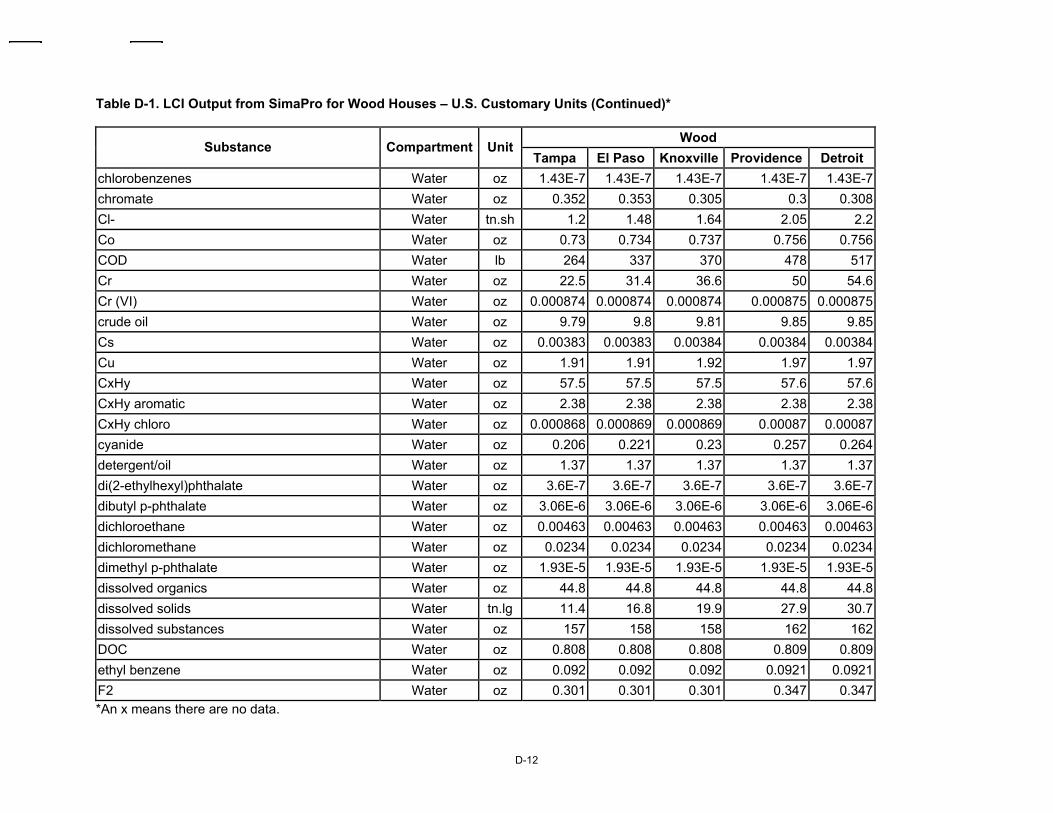
D-12
Table D-1. LCI Output from SimaPro for Wood Houses – U.S. Customary Units (Continued)*
Wood Substance Compartment Unit
Tampa El Paso Knoxville Providence Detroit chlorobenzenes Water oz 1.43E-7 1.43E-7 1.43E-7 1.43E-7 1.43E-7chromate Water oz 0.352 0.353 0.305 0.3 0.308Cl- Water tn.sh 1.2 1.48 1.64 2.05 2.2Co Water oz 0.73 0.734 0.737 0.756 0.756COD Water lb 264 337 370 478 517Cr Water oz 22.5 31.4 36.6 50 54.6Cr (VI) Water oz 0.000874 0.000874 0.000874 0.000875 0.000875crude oil Water oz 9.79 9.8 9.81 9.85 9.85Cs Water oz 0.00383 0.00383 0.00384 0.00384 0.00384Cu Water oz 1.91 1.91 1.92 1.97 1.97CxHy Water oz 57.5 57.5 57.5 57.6 57.6CxHy aromatic Water oz 2.38 2.38 2.38 2.38 2.38CxHy chloro Water oz 0.000868 0.000869 0.000869 0.00087 0.00087cyanide Water oz 0.206 0.221 0.23 0.257 0.264detergent/oil Water oz 1.37 1.37 1.37 1.37 1.37di(2-ethylhexyl)phthalate Water oz 3.6E-7 3.6E-7 3.6E-7 3.6E-7 3.6E-7dibutyl p-phthalate Water oz 3.06E-6 3.06E-6 3.06E-6 3.06E-6 3.06E-6dichloroethane Water oz 0.00463 0.00463 0.00463 0.00463 0.00463dichloromethane Water oz 0.0234 0.0234 0.0234 0.0234 0.0234dimethyl p-phthalate Water oz 1.93E-5 1.93E-5 1.93E-5 1.93E-5 1.93E-5dissolved organics Water oz 44.8 44.8 44.8 44.8 44.8dissolved solids Water tn.lg 11.4 16.8 19.9 27.9 30.7dissolved substances Water oz 157 158 158 162 162DOC Water oz 0.808 0.808 0.808 0.809 0.809ethyl benzene Water oz 0.092 0.092 0.092 0.0921 0.0921F2 Water oz 0.301 0.301 0.301 0.347 0.347*An x means there are no data.
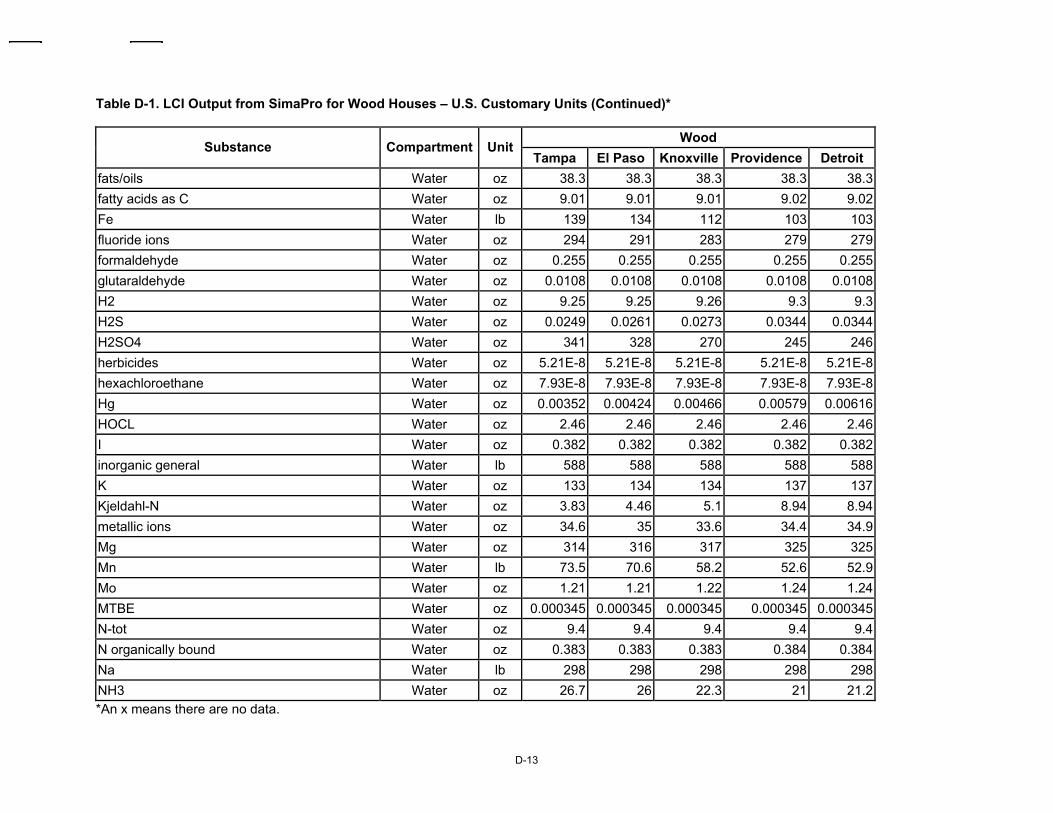
D-13
Table D-1. LCI Output from SimaPro for Wood Houses – U.S. Customary Units (Continued)*
Wood Substance Compartment Unit
Tampa El Paso Knoxville Providence Detroit fats/oils Water oz 38.3 38.3 38.3 38.3 38.3fatty acids as C Water oz 9.01 9.01 9.01 9.02 9.02Fe Water lb 139 134 112 103 103fluoride ions Water oz 294 291 283 279 279formaldehyde Water oz 0.255 0.255 0.255 0.255 0.255glutaraldehyde Water oz 0.0108 0.0108 0.0108 0.0108 0.0108H2 Water oz 9.25 9.25 9.26 9.3 9.3H2S Water oz 0.0249 0.0261 0.0273 0.0344 0.0344H2SO4 Water oz 341 328 270 245 246herbicides Water oz 5.21E-8 5.21E-8 5.21E-8 5.21E-8 5.21E-8hexachloroethane Water oz 7.93E-8 7.93E-8 7.93E-8 7.93E-8 7.93E-8Hg Water oz 0.00352 0.00424 0.00466 0.00579 0.00616HOCL Water oz 2.46 2.46 2.46 2.46 2.46I Water oz 0.382 0.382 0.382 0.382 0.382inorganic general Water lb 588 588 588 588 588K Water oz 133 134 134 137 137Kjeldahl-N Water oz 3.83 4.46 5.1 8.94 8.94metallic ions Water oz 34.6 35 33.6 34.4 34.9Mg Water oz 314 316 317 325 325Mn Water lb 73.5 70.6 58.2 52.6 52.9Mo Water oz 1.21 1.21 1.22 1.24 1.24MTBE Water oz 0.000345 0.000345 0.000345 0.000345 0.000345N-tot Water oz 9.4 9.4 9.4 9.4 9.4N organically bound Water oz 0.383 0.383 0.383 0.384 0.384Na Water lb 298 298 298 298 298NH3 Water oz 26.7 26 22.3 21 21.2*An x means there are no data.
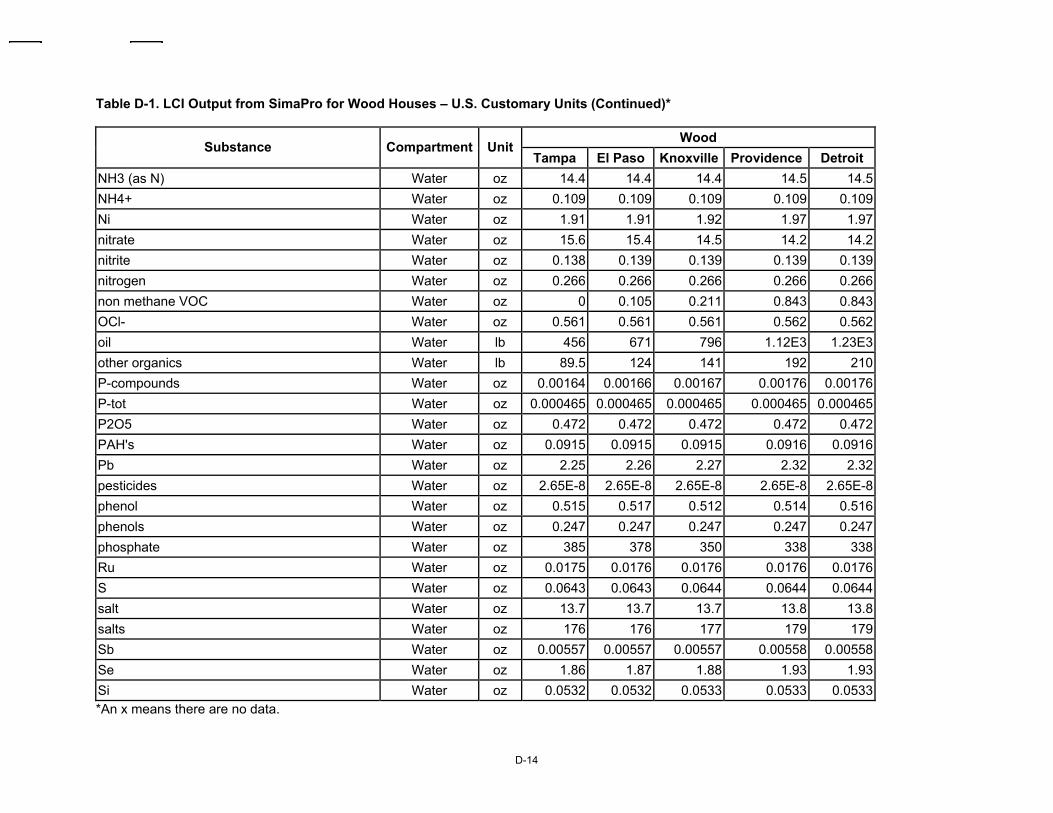
D-14
Table D-1. LCI Output from SimaPro for Wood Houses – U.S. Customary Units (Continued)*
Wood Substance Compartment Unit
Tampa El Paso Knoxville Providence Detroit NH3 (as N) Water oz 14.4 14.4 14.4 14.5 14.5NH4+ Water oz 0.109 0.109 0.109 0.109 0.109Ni Water oz 1.91 1.91 1.92 1.97 1.97nitrate Water oz 15.6 15.4 14.5 14.2 14.2nitrite Water oz 0.138 0.139 0.139 0.139 0.139nitrogen Water oz 0.266 0.266 0.266 0.266 0.266non methane VOC Water oz 0 0.105 0.211 0.843 0.843OCl- Water oz 0.561 0.561 0.561 0.562 0.562oil Water lb 456 671 796 1.12E3 1.23E3other organics Water lb 89.5 124 141 192 210P-compounds Water oz 0.00164 0.00166 0.00167 0.00176 0.00176P-tot Water oz 0.000465 0.000465 0.000465 0.000465 0.000465P2O5 Water oz 0.472 0.472 0.472 0.472 0.472PAH's Water oz 0.0915 0.0915 0.0915 0.0916 0.0916Pb Water oz 2.25 2.26 2.27 2.32 2.32pesticides Water oz 2.65E-8 2.65E-8 2.65E-8 2.65E-8 2.65E-8phenol Water oz 0.515 0.517 0.512 0.514 0.516phenols Water oz 0.247 0.247 0.247 0.247 0.247phosphate Water oz 385 378 350 338 338Ru Water oz 0.0175 0.0176 0.0176 0.0176 0.0176S Water oz 0.0643 0.0643 0.0644 0.0644 0.0644salt Water oz 13.7 13.7 13.7 13.8 13.8salts Water oz 176 176 177 179 179Sb Water oz 0.00557 0.00557 0.00557 0.00558 0.00558Se Water oz 1.86 1.87 1.88 1.93 1.93Si Water oz 0.0532 0.0532 0.0533 0.0533 0.0533*An x means there are no data.
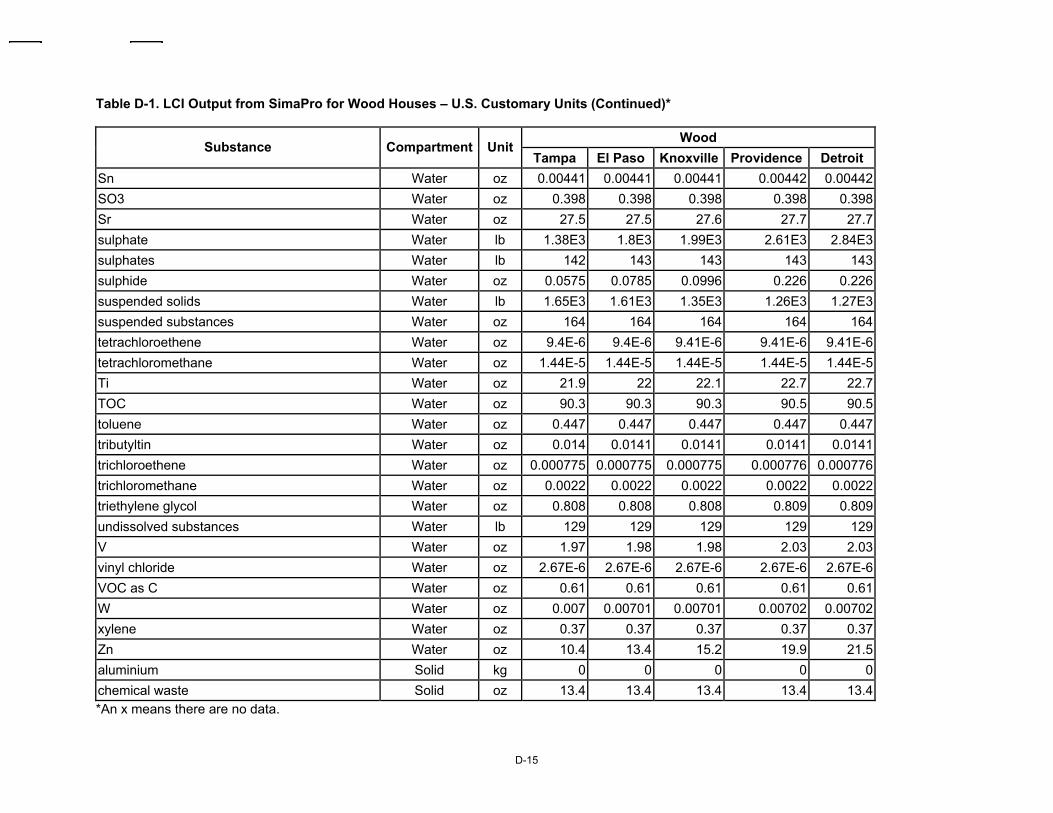
D-15
Table D-1. LCI Output from SimaPro for Wood Houses – U.S. Customary Units (Continued)*
Wood Substance Compartment Unit
Tampa El Paso Knoxville Providence Detroit Sn Water oz 0.00441 0.00441 0.00441 0.00442 0.00442SO3 Water oz 0.398 0.398 0.398 0.398 0.398Sr Water oz 27.5 27.5 27.6 27.7 27.7sulphate Water lb 1.38E3 1.8E3 1.99E3 2.61E3 2.84E3sulphates Water lb 142 143 143 143 143sulphide Water oz 0.0575 0.0785 0.0996 0.226 0.226suspended solids Water lb 1.65E3 1.61E3 1.35E3 1.26E3 1.27E3suspended substances Water oz 164 164 164 164 164tetrachloroethene Water oz 9.4E-6 9.4E-6 9.41E-6 9.41E-6 9.41E-6tetrachloromethane Water oz 1.44E-5 1.44E-5 1.44E-5 1.44E-5 1.44E-5Ti Water oz 21.9 22 22.1 22.7 22.7TOC Water oz 90.3 90.3 90.3 90.5 90.5toluene Water oz 0.447 0.447 0.447 0.447 0.447tributyltin Water oz 0.014 0.0141 0.0141 0.0141 0.0141trichloroethene Water oz 0.000775 0.000775 0.000775 0.000776 0.000776trichloromethane Water oz 0.0022 0.0022 0.0022 0.0022 0.0022triethylene glycol Water oz 0.808 0.808 0.808 0.809 0.809undissolved substances Water lb 129 129 129 129 129V Water oz 1.97 1.98 1.98 2.03 2.03vinyl chloride Water oz 2.67E-6 2.67E-6 2.67E-6 2.67E-6 2.67E-6VOC as C Water oz 0.61 0.61 0.61 0.61 0.61W Water oz 0.007 0.00701 0.00701 0.00702 0.00702xylene Water oz 0.37 0.37 0.37 0.37 0.37Zn Water oz 10.4 13.4 15.2 19.9 21.5aluminium Solid kg 0 0 0 0 0chemical waste Solid oz 13.4 13.4 13.4 13.4 13.4*An x means there are no data.
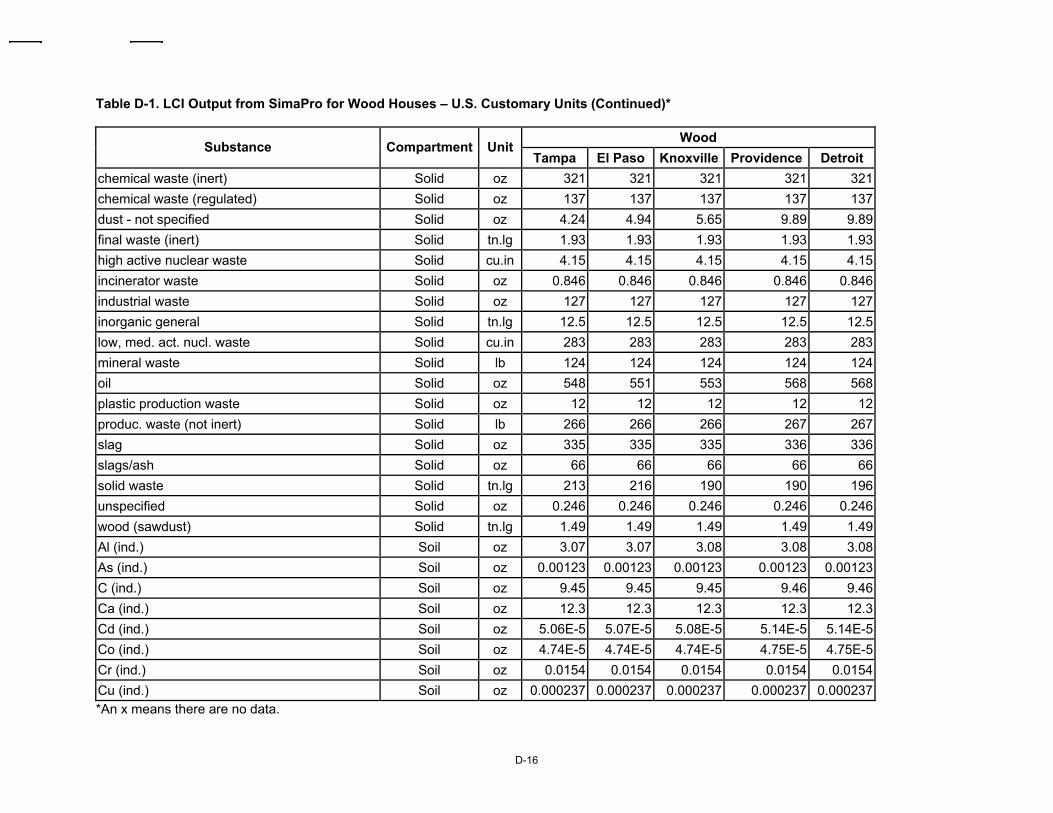
D-16
Table D-1. LCI Output from SimaPro for Wood Houses – U.S. Customary Units (Continued)*
Wood Substance Compartment Unit
Tampa El Paso Knoxville Providence Detroit chemical waste (inert) Solid oz 321 321 321 321 321chemical waste (regulated) Solid oz 137 137 137 137 137dust - not specified Solid oz 4.24 4.94 5.65 9.89 9.89final waste (inert) Solid tn.lg 1.93 1.93 1.93 1.93 1.93high active nuclear waste Solid cu.in 4.15 4.15 4.15 4.15 4.15incinerator waste Solid oz 0.846 0.846 0.846 0.846 0.846industrial waste Solid oz 127 127 127 127 127inorganic general Solid tn.lg 12.5 12.5 12.5 12.5 12.5low, med. act. nucl. waste Solid cu.in 283 283 283 283 283mineral waste Solid lb 124 124 124 124 124oil Solid oz 548 551 553 568 568plastic production waste Solid oz 12 12 12 12 12produc. waste (not inert) Solid lb 266 266 266 267 267slag Solid oz 335 335 335 336 336slags/ash Solid oz 66 66 66 66 66solid waste Solid tn.lg 213 216 190 190 196unspecified Solid oz 0.246 0.246 0.246 0.246 0.246wood (sawdust) Solid tn.lg 1.49 1.49 1.49 1.49 1.49Al (ind.) Soil oz 3.07 3.07 3.08 3.08 3.08As (ind.) Soil oz 0.00123 0.00123 0.00123 0.00123 0.00123C (ind.) Soil oz 9.45 9.45 9.45 9.46 9.46Ca (ind.) Soil oz 12.3 12.3 12.3 12.3 12.3Cd (ind.) Soil oz 5.06E-5 5.07E-5 5.08E-5 5.14E-5 5.14E-5Co (ind.) Soil oz 4.74E-5 4.74E-5 4.74E-5 4.75E-5 4.75E-5Cr (ind.) Soil oz 0.0154 0.0154 0.0154 0.0154 0.0154Cu (ind.) Soil oz 0.000237 0.000237 0.000237 0.000237 0.000237*An x means there are no data.
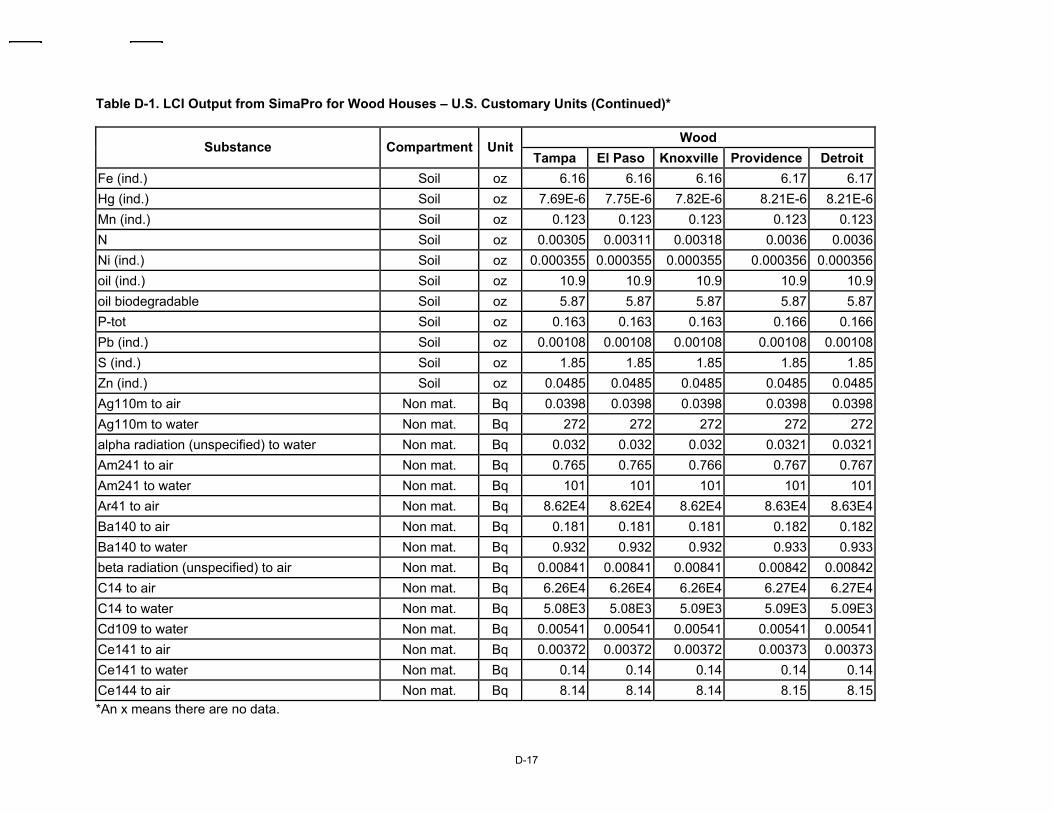
D-17
Table D-1. LCI Output from SimaPro for Wood Houses – U.S. Customary Units (Continued)*
Wood Substance Compartment Unit
Tampa El Paso Knoxville Providence Detroit Fe (ind.) Soil oz 6.16 6.16 6.16 6.17 6.17Hg (ind.) Soil oz 7.69E-6 7.75E-6 7.82E-6 8.21E-6 8.21E-6Mn (ind.) Soil oz 0.123 0.123 0.123 0.123 0.123N Soil oz 0.00305 0.00311 0.00318 0.0036 0.0036Ni (ind.) Soil oz 0.000355 0.000355 0.000355 0.000356 0.000356oil (ind.) Soil oz 10.9 10.9 10.9 10.9 10.9oil biodegradable Soil oz 5.87 5.87 5.87 5.87 5.87P-tot Soil oz 0.163 0.163 0.163 0.166 0.166Pb (ind.) Soil oz 0.00108 0.00108 0.00108 0.00108 0.00108S (ind.) Soil oz 1.85 1.85 1.85 1.85 1.85Zn (ind.) Soil oz 0.0485 0.0485 0.0485 0.0485 0.0485Ag110m to air Non mat. Bq 0.0398 0.0398 0.0398 0.0398 0.0398Ag110m to water Non mat. Bq 272 272 272 272 272alpha radiation (unspecified) to water Non mat. Bq 0.032 0.032 0.032 0.0321 0.0321Am241 to air Non mat. Bq 0.765 0.765 0.766 0.767 0.767Am241 to water Non mat. Bq 101 101 101 101 101Ar41 to air Non mat. Bq 8.62E4 8.62E4 8.62E4 8.63E4 8.63E4Ba140 to air Non mat. Bq 0.181 0.181 0.181 0.182 0.182Ba140 to water Non mat. Bq 0.932 0.932 0.932 0.933 0.933beta radiation (unspecified) to air Non mat. Bq 0.00841 0.00841 0.00841 0.00842 0.00842C14 to air Non mat. Bq 6.26E4 6.26E4 6.26E4 6.27E4 6.27E4C14 to water Non mat. Bq 5.08E3 5.08E3 5.09E3 5.09E3 5.09E3Cd109 to water Non mat. Bq 0.00541 0.00541 0.00541 0.00541 0.00541Ce141 to air Non mat. Bq 0.00372 0.00372 0.00372 0.00373 0.00373Ce141 to water Non mat. Bq 0.14 0.14 0.14 0.14 0.14Ce144 to air Non mat. Bq 8.14 8.14 8.14 8.15 8.15*An x means there are no data.
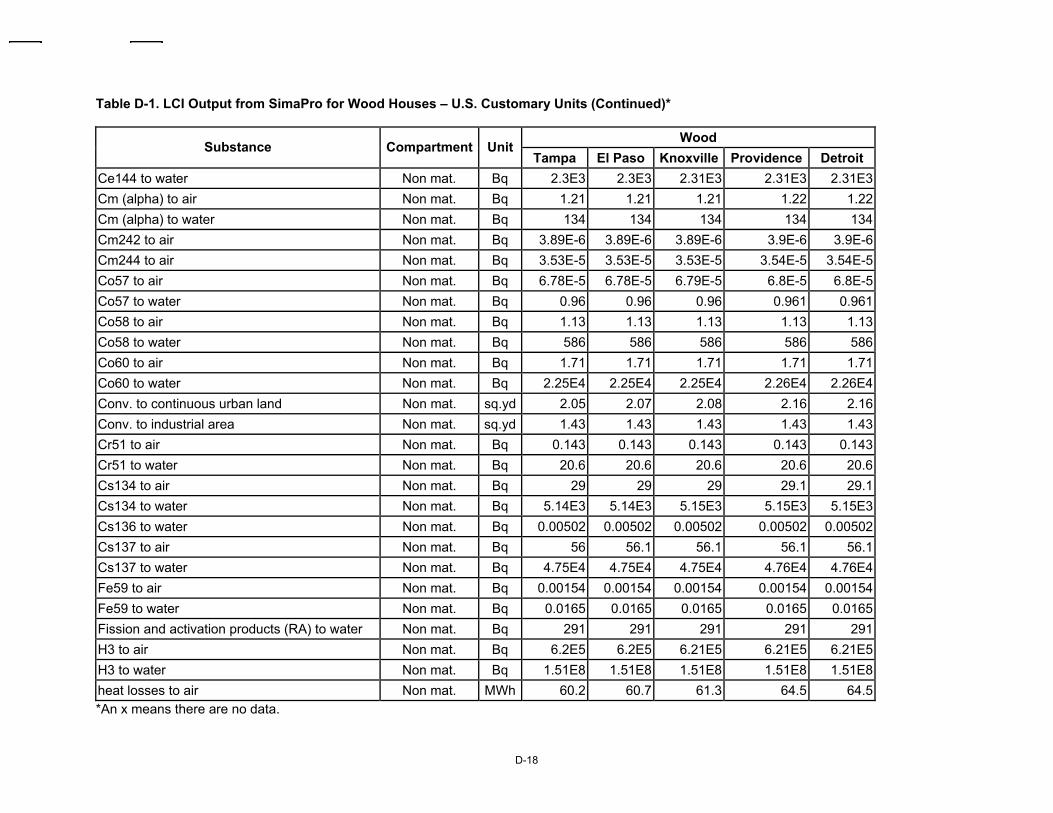
D-18
Table D-1. LCI Output from SimaPro for Wood Houses – U.S. Customary Units (Continued)*
Wood Substance Compartment Unit
Tampa El Paso Knoxville Providence Detroit Ce144 to water Non mat. Bq 2.3E3 2.3E3 2.31E3 2.31E3 2.31E3Cm (alpha) to air Non mat. Bq 1.21 1.21 1.21 1.22 1.22Cm (alpha) to water Non mat. Bq 134 134 134 134 134Cm242 to air Non mat. Bq 3.89E-6 3.89E-6 3.89E-6 3.9E-6 3.9E-6Cm244 to air Non mat. Bq 3.53E-5 3.53E-5 3.53E-5 3.54E-5 3.54E-5Co57 to air Non mat. Bq 6.78E-5 6.78E-5 6.79E-5 6.8E-5 6.8E-5Co57 to water Non mat. Bq 0.96 0.96 0.96 0.961 0.961Co58 to air Non mat. Bq 1.13 1.13 1.13 1.13 1.13Co58 to water Non mat. Bq 586 586 586 586 586Co60 to air Non mat. Bq 1.71 1.71 1.71 1.71 1.71Co60 to water Non mat. Bq 2.25E4 2.25E4 2.25E4 2.26E4 2.26E4Conv. to continuous urban land Non mat. sq.yd 2.05 2.07 2.08 2.16 2.16Conv. to industrial area Non mat. sq.yd 1.43 1.43 1.43 1.43 1.43Cr51 to air Non mat. Bq 0.143 0.143 0.143 0.143 0.143Cr51 to water Non mat. Bq 20.6 20.6 20.6 20.6 20.6Cs134 to air Non mat. Bq 29 29 29 29.1 29.1Cs134 to water Non mat. Bq 5.14E3 5.14E3 5.15E3 5.15E3 5.15E3Cs136 to water Non mat. Bq 0.00502 0.00502 0.00502 0.00502 0.00502Cs137 to air Non mat. Bq 56 56.1 56.1 56.1 56.1Cs137 to water Non mat. Bq 4.75E4 4.75E4 4.75E4 4.76E4 4.76E4Fe59 to air Non mat. Bq 0.00154 0.00154 0.00154 0.00154 0.00154Fe59 to water Non mat. Bq 0.0165 0.0165 0.0165 0.0165 0.0165Fission and activation products (RA) to water Non mat. Bq 291 291 291 291 291H3 to air Non mat. Bq 6.2E5 6.2E5 6.21E5 6.21E5 6.21E5H3 to water Non mat. Bq 1.51E8 1.51E8 1.51E8 1.51E8 1.51E8heat losses to air Non mat. MWh 60.2 60.7 61.3 64.5 64.5*An x means there are no data.
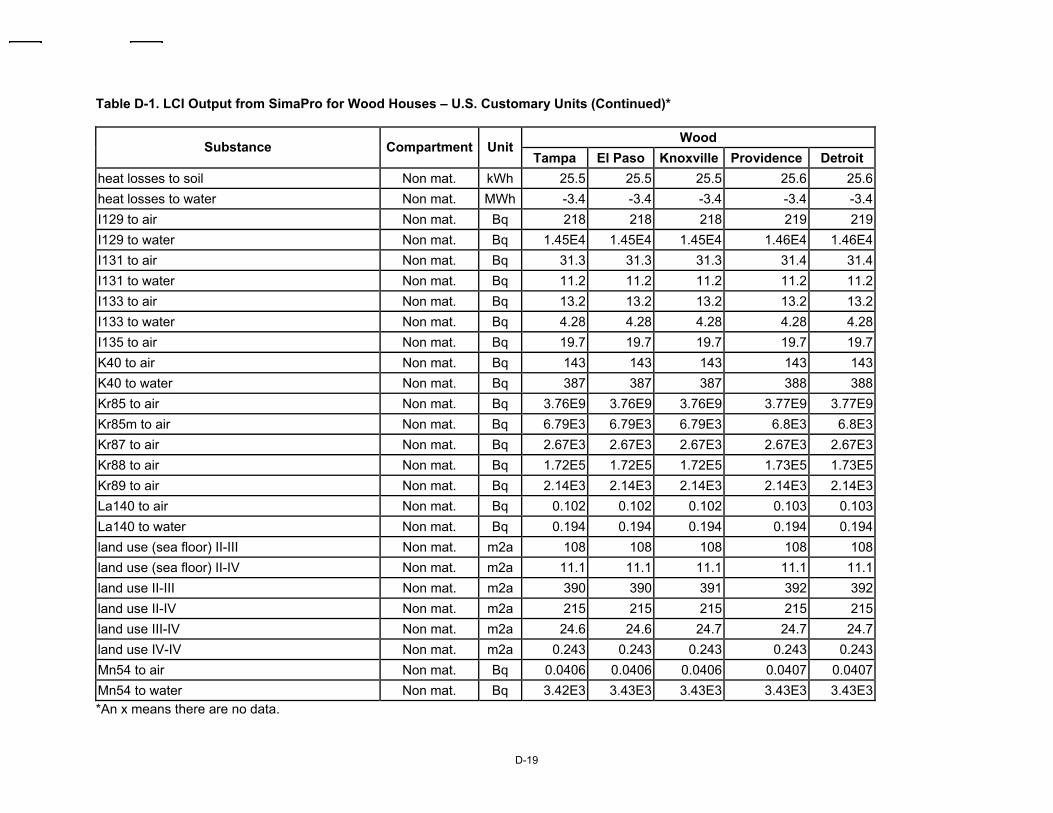
D-19
Table D-1. LCI Output from SimaPro for Wood Houses – U.S. Customary Units (Continued)*
Wood Substance Compartment Unit
Tampa El Paso Knoxville Providence Detroit heat losses to soil Non mat. kWh 25.5 25.5 25.5 25.6 25.6heat losses to water Non mat. MWh -3.4 -3.4 -3.4 -3.4 -3.4I129 to air Non mat. Bq 218 218 218 219 219I129 to water Non mat. Bq 1.45E4 1.45E4 1.45E4 1.46E4 1.46E4I131 to air Non mat. Bq 31.3 31.3 31.3 31.4 31.4I131 to water Non mat. Bq 11.2 11.2 11.2 11.2 11.2I133 to air Non mat. Bq 13.2 13.2 13.2 13.2 13.2I133 to water Non mat. Bq 4.28 4.28 4.28 4.28 4.28I135 to air Non mat. Bq 19.7 19.7 19.7 19.7 19.7K40 to air Non mat. Bq 143 143 143 143 143K40 to water Non mat. Bq 387 387 387 388 388Kr85 to air Non mat. Bq 3.76E9 3.76E9 3.76E9 3.77E9 3.77E9Kr85m to air Non mat. Bq 6.79E3 6.79E3 6.79E3 6.8E3 6.8E3Kr87 to air Non mat. Bq 2.67E3 2.67E3 2.67E3 2.67E3 2.67E3Kr88 to air Non mat. Bq 1.72E5 1.72E5 1.72E5 1.73E5 1.73E5Kr89 to air Non mat. Bq 2.14E3 2.14E3 2.14E3 2.14E3 2.14E3La140 to air Non mat. Bq 0.102 0.102 0.102 0.103 0.103La140 to water Non mat. Bq 0.194 0.194 0.194 0.194 0.194land use (sea floor) II-III Non mat. m2a 108 108 108 108 108land use (sea floor) II-IV Non mat. m2a 11.1 11.1 11.1 11.1 11.1land use II-III Non mat. m2a 390 390 391 392 392land use II-IV Non mat. m2a 215 215 215 215 215land use III-IV Non mat. m2a 24.6 24.6 24.7 24.7 24.7land use IV-IV Non mat. m2a 0.243 0.243 0.243 0.243 0.243Mn54 to air Non mat. Bq 0.0406 0.0406 0.0406 0.0407 0.0407Mn54 to water Non mat. Bq 3.42E3 3.43E3 3.43E3 3.43E3 3.43E3*An x means there are no data.
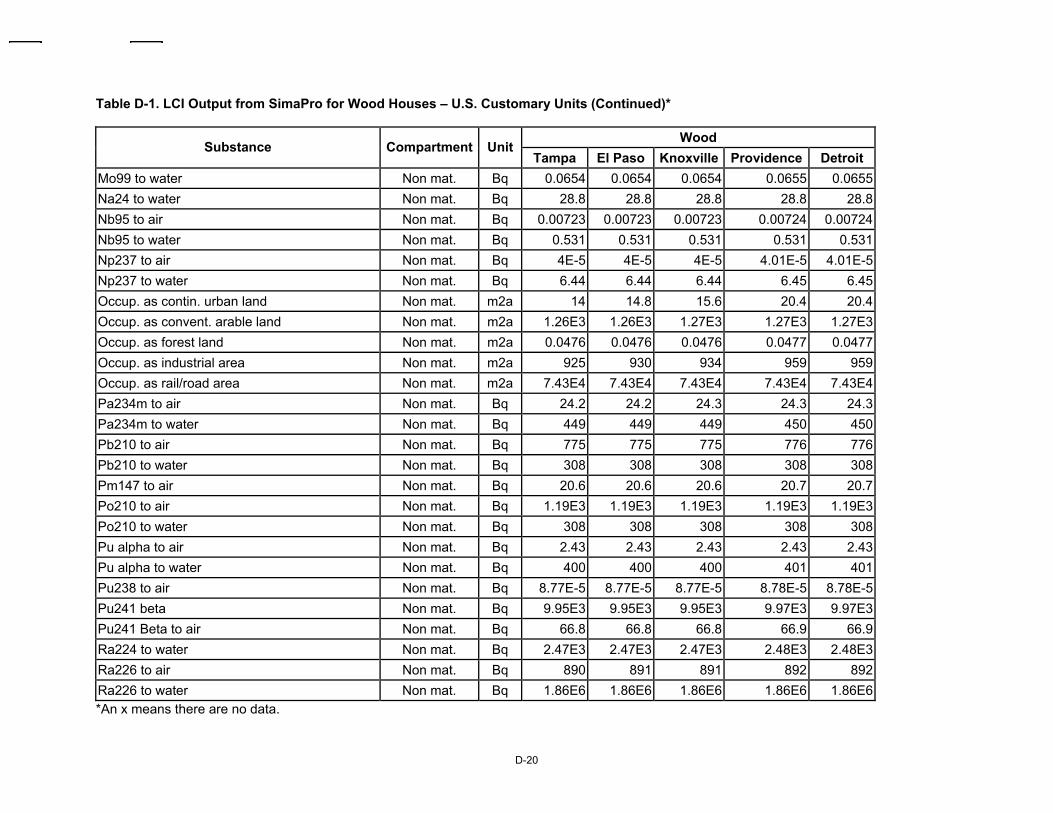
D-20
Table D-1. LCI Output from SimaPro for Wood Houses – U.S. Customary Units (Continued)*
Wood Substance Compartment Unit
Tampa El Paso Knoxville Providence Detroit Mo99 to water Non mat. Bq 0.0654 0.0654 0.0654 0.0655 0.0655Na24 to water Non mat. Bq 28.8 28.8 28.8 28.8 28.8Nb95 to air Non mat. Bq 0.00723 0.00723 0.00723 0.00724 0.00724Nb95 to water Non mat. Bq 0.531 0.531 0.531 0.531 0.531Np237 to air Non mat. Bq 4E-5 4E-5 4E-5 4.01E-5 4.01E-5Np237 to water Non mat. Bq 6.44 6.44 6.44 6.45 6.45Occup. as contin. urban land Non mat. m2a 14 14.8 15.6 20.4 20.4Occup. as convent. arable land Non mat. m2a 1.26E3 1.26E3 1.27E3 1.27E3 1.27E3Occup. as forest land Non mat. m2a 0.0476 0.0476 0.0476 0.0477 0.0477Occup. as industrial area Non mat. m2a 925 930 934 959 959Occup. as rail/road area Non mat. m2a 7.43E4 7.43E4 7.43E4 7.43E4 7.43E4Pa234m to air Non mat. Bq 24.2 24.2 24.3 24.3 24.3Pa234m to water Non mat. Bq 449 449 449 450 450Pb210 to air Non mat. Bq 775 775 775 776 776Pb210 to water Non mat. Bq 308 308 308 308 308Pm147 to air Non mat. Bq 20.6 20.6 20.6 20.7 20.7Po210 to air Non mat. Bq 1.19E3 1.19E3 1.19E3 1.19E3 1.19E3Po210 to water Non mat. Bq 308 308 308 308 308Pu alpha to air Non mat. Bq 2.43 2.43 2.43 2.43 2.43Pu alpha to water Non mat. Bq 400 400 400 401 401Pu238 to air Non mat. Bq 8.77E-5 8.77E-5 8.77E-5 8.78E-5 8.78E-5Pu241 beta Non mat. Bq 9.95E3 9.95E3 9.95E3 9.97E3 9.97E3Pu241 Beta to air Non mat. Bq 66.8 66.8 66.8 66.9 66.9Ra224 to water Non mat. Bq 2.47E3 2.47E3 2.47E3 2.48E3 2.48E3Ra226 to air Non mat. Bq 890 891 891 892 892Ra226 to water Non mat. Bq 1.86E6 1.86E6 1.86E6 1.86E6 1.86E6*An x means there are no data.
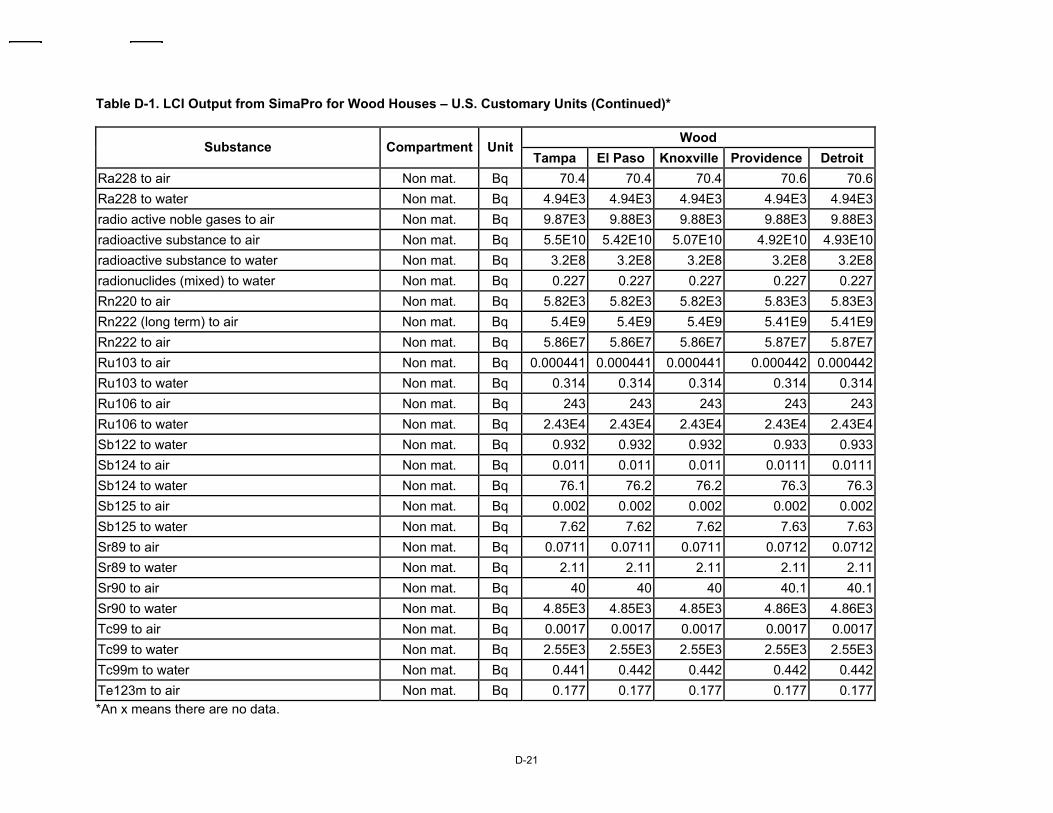
D-21
Table D-1. LCI Output from SimaPro for Wood Houses – U.S. Customary Units (Continued)*
Wood Substance Compartment Unit
Tampa El Paso Knoxville Providence Detroit Ra228 to air Non mat. Bq 70.4 70.4 70.4 70.6 70.6Ra228 to water Non mat. Bq 4.94E3 4.94E3 4.94E3 4.94E3 4.94E3radio active noble gases to air Non mat. Bq 9.87E3 9.88E3 9.88E3 9.88E3 9.88E3radioactive substance to air Non mat. Bq 5.5E10 5.42E10 5.07E10 4.92E10 4.93E10radioactive substance to water Non mat. Bq 3.2E8 3.2E8 3.2E8 3.2E8 3.2E8radionuclides (mixed) to water Non mat. Bq 0.227 0.227 0.227 0.227 0.227Rn220 to air Non mat. Bq 5.82E3 5.82E3 5.82E3 5.83E3 5.83E3Rn222 (long term) to air Non mat. Bq 5.4E9 5.4E9 5.4E9 5.41E9 5.41E9Rn222 to air Non mat. Bq 5.86E7 5.86E7 5.86E7 5.87E7 5.87E7Ru103 to air Non mat. Bq 0.000441 0.000441 0.000441 0.000442 0.000442Ru103 to water Non mat. Bq 0.314 0.314 0.314 0.314 0.314Ru106 to air Non mat. Bq 243 243 243 243 243Ru106 to water Non mat. Bq 2.43E4 2.43E4 2.43E4 2.43E4 2.43E4Sb122 to water Non mat. Bq 0.932 0.932 0.932 0.933 0.933Sb124 to air Non mat. Bq 0.011 0.011 0.011 0.0111 0.0111Sb124 to water Non mat. Bq 76.1 76.2 76.2 76.3 76.3Sb125 to air Non mat. Bq 0.002 0.002 0.002 0.002 0.002Sb125 to water Non mat. Bq 7.62 7.62 7.62 7.63 7.63Sr89 to air Non mat. Bq 0.0711 0.0711 0.0711 0.0712 0.0712Sr89 to water Non mat. Bq 2.11 2.11 2.11 2.11 2.11Sr90 to air Non mat. Bq 40 40 40 40.1 40.1Sr90 to water Non mat. Bq 4.85E3 4.85E3 4.85E3 4.86E3 4.86E3Tc99 to air Non mat. Bq 0.0017 0.0017 0.0017 0.0017 0.0017Tc99 to water Non mat. Bq 2.55E3 2.55E3 2.55E3 2.55E3 2.55E3Tc99m to water Non mat. Bq 0.441 0.442 0.442 0.442 0.442Te123m to air Non mat. Bq 0.177 0.177 0.177 0.177 0.177*An x means there are no data.
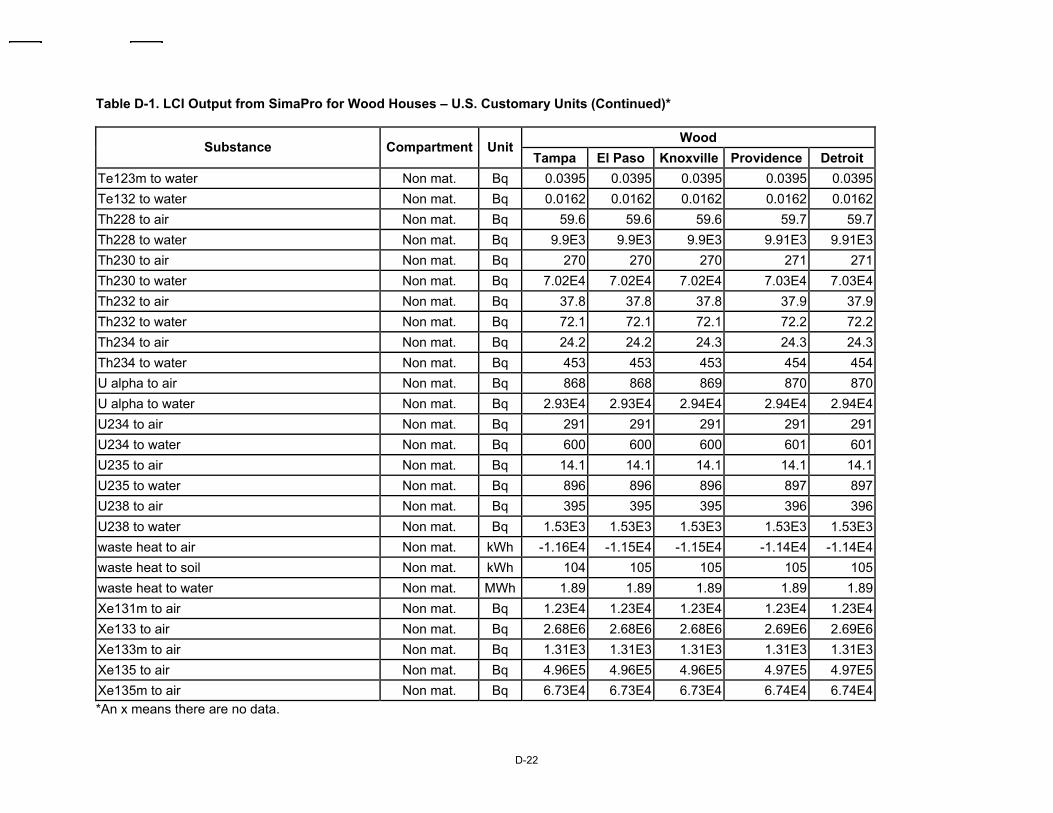
D-22
Table D-1. LCI Output from SimaPro for Wood Houses – U.S. Customary Units (Continued)*
Wood Substance Compartment Unit
Tampa El Paso Knoxville Providence Detroit Te123m to water Non mat. Bq 0.0395 0.0395 0.0395 0.0395 0.0395Te132 to water Non mat. Bq 0.0162 0.0162 0.0162 0.0162 0.0162Th228 to air Non mat. Bq 59.6 59.6 59.6 59.7 59.7Th228 to water Non mat. Bq 9.9E3 9.9E3 9.9E3 9.91E3 9.91E3Th230 to air Non mat. Bq 270 270 270 271 271Th230 to water Non mat. Bq 7.02E4 7.02E4 7.02E4 7.03E4 7.03E4Th232 to air Non mat. Bq 37.8 37.8 37.8 37.9 37.9Th232 to water Non mat. Bq 72.1 72.1 72.1 72.2 72.2Th234 to air Non mat. Bq 24.2 24.2 24.3 24.3 24.3Th234 to water Non mat. Bq 453 453 453 454 454U alpha to air Non mat. Bq 868 868 869 870 870U alpha to water Non mat. Bq 2.93E4 2.93E4 2.94E4 2.94E4 2.94E4U234 to air Non mat. Bq 291 291 291 291 291U234 to water Non mat. Bq 600 600 600 601 601U235 to air Non mat. Bq 14.1 14.1 14.1 14.1 14.1U235 to water Non mat. Bq 896 896 896 897 897U238 to air Non mat. Bq 395 395 395 396 396U238 to water Non mat. Bq 1.53E3 1.53E3 1.53E3 1.53E3 1.53E3waste heat to air Non mat. kWh -1.16E4 -1.15E4 -1.15E4 -1.14E4 -1.14E4waste heat to soil Non mat. kWh 104 105 105 105 105waste heat to water Non mat. MWh 1.89 1.89 1.89 1.89 1.89Xe131m to air Non mat. Bq 1.23E4 1.23E4 1.23E4 1.23E4 1.23E4Xe133 to air Non mat. Bq 2.68E6 2.68E6 2.68E6 2.69E6 2.69E6Xe133m to air Non mat. Bq 1.31E3 1.31E3 1.31E3 1.31E3 1.31E3Xe135 to air Non mat. Bq 4.96E5 4.96E5 4.96E5 4.97E5 4.97E5Xe135m to air Non mat. Bq 6.73E4 6.73E4 6.73E4 6.74E4 6.74E4*An x means there are no data.
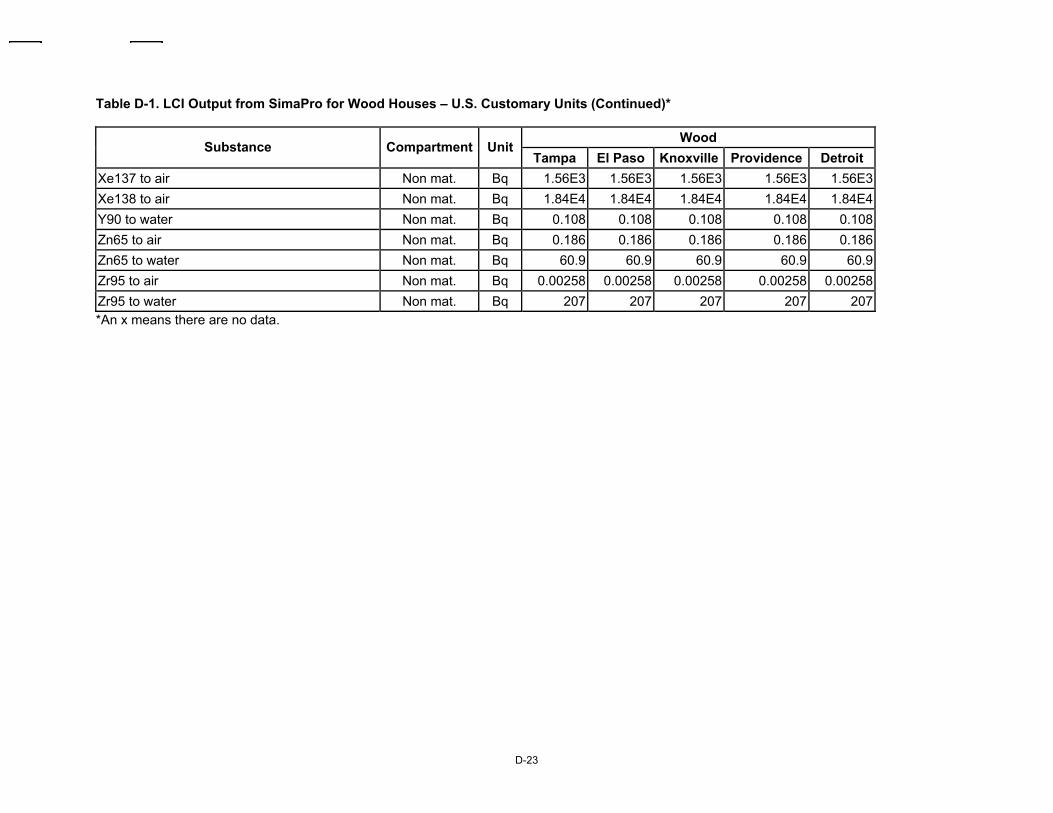
D-23
Table D-1. LCI Output from SimaPro for Wood Houses – U.S. Customary Units (Continued)*
Wood Substance Compartment Unit
Tampa El Paso Knoxville Providence Detroit Xe137 to air Non mat. Bq 1.56E3 1.56E3 1.56E3 1.56E3 1.56E3Xe138 to air Non mat. Bq 1.84E4 1.84E4 1.84E4 1.84E4 1.84E4Y90 to water Non mat. Bq 0.108 0.108 0.108 0.108 0.108Zn65 to air Non mat. Bq 0.186 0.186 0.186 0.186 0.186Zn65 to water Non mat. Bq 60.9 60.9 60.9 60.9 60.9Zr95 to air Non mat. Bq 0.00258 0.00258 0.00258 0.00258 0.00258Zr95 to water Non mat. Bq 207 207 207 207 207*An x means there are no data.
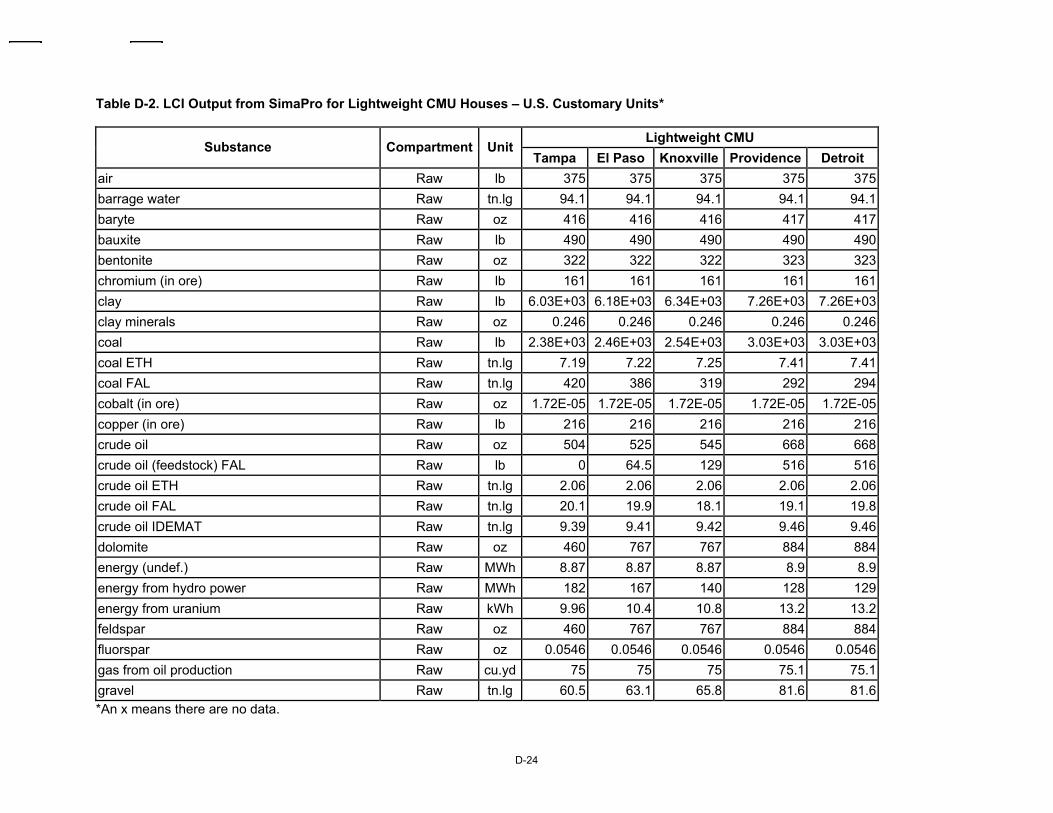
D-24
Table D-2. LCI Output from SimaPro for Lightweight CMU Houses – U.S. Customary Units*
Lightweight CMU Substance Compartment Unit
Tampa El Paso Knoxville Providence Detroit air Raw lb 375 375 375 375 375barrage water Raw tn.lg 94.1 94.1 94.1 94.1 94.1baryte Raw oz 416 416 416 417 417bauxite Raw lb 490 490 490 490 490bentonite Raw oz 322 322 322 323 323chromium (in ore) Raw lb 161 161 161 161 161clay Raw lb 6.03E+03 6.18E+03 6.34E+03 7.26E+03 7.26E+03clay minerals Raw oz 0.246 0.246 0.246 0.246 0.246coal Raw lb 2.38E+03 2.46E+03 2.54E+03 3.03E+03 3.03E+03coal ETH Raw tn.lg 7.19 7.22 7.25 7.41 7.41coal FAL Raw tn.lg 420 386 319 292 294cobalt (in ore) Raw oz 1.72E-05 1.72E-05 1.72E-05 1.72E-05 1.72E-05copper (in ore) Raw lb 216 216 216 216 216crude oil Raw oz 504 525 545 668 668crude oil (feedstock) FAL Raw lb 0 64.5 129 516 516crude oil ETH Raw tn.lg 2.06 2.06 2.06 2.06 2.06crude oil FAL Raw tn.lg 20.1 19.9 18.1 19.1 19.8crude oil IDEMAT Raw tn.lg 9.39 9.41 9.42 9.46 9.46dolomite Raw oz 460 767 767 884 884energy (undef.) Raw MWh 8.87 8.87 8.87 8.9 8.9energy from hydro power Raw MWh 182 167 140 128 129energy from uranium Raw kWh 9.96 10.4 10.8 13.2 13.2feldspar Raw oz 460 767 767 884 884fluorspar Raw oz 0.0546 0.0546 0.0546 0.0546 0.0546gas from oil production Raw cu.yd 75 75 75 75.1 75.1gravel Raw tn.lg 60.5 63.1 65.8 81.6 81.6*An x means there are no data.
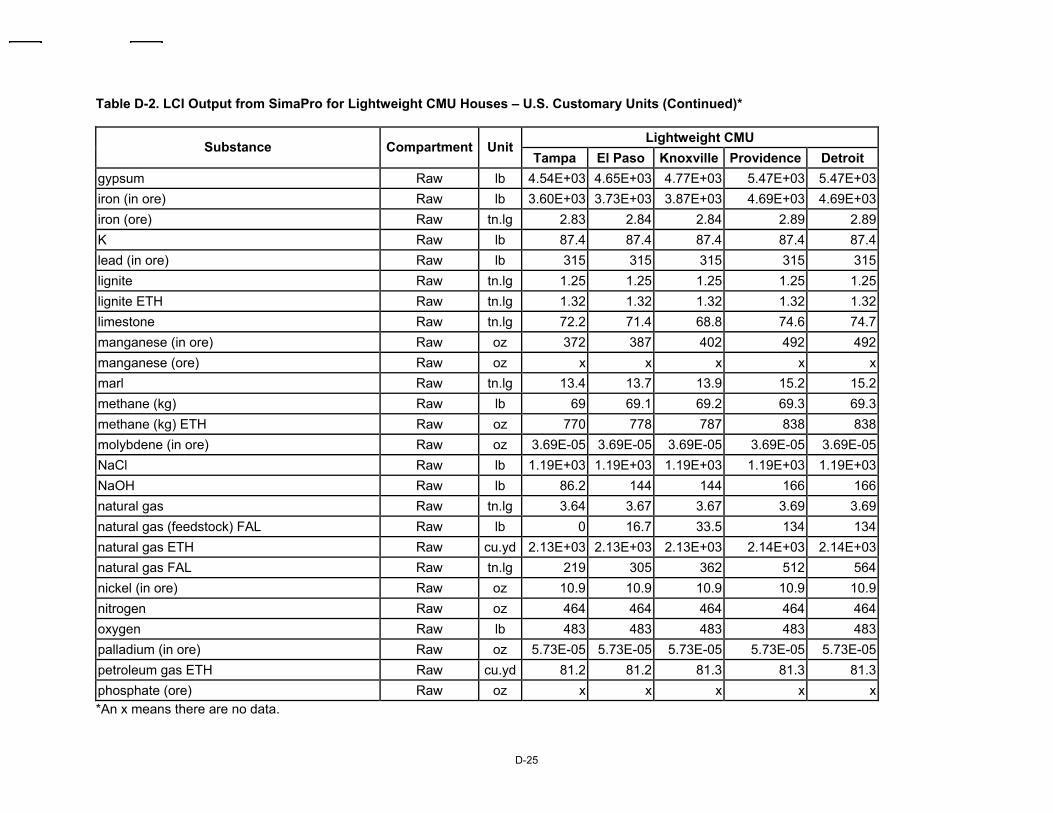
D-25
Table D-2. LCI Output from SimaPro for Lightweight CMU Houses – U.S. Customary Units (Continued)*
Lightweight CMU Substance Compartment Unit
Tampa El Paso Knoxville Providence Detroit gypsum Raw lb 4.54E+03 4.65E+03 4.77E+03 5.47E+03 5.47E+03iron (in ore) Raw lb 3.60E+03 3.73E+03 3.87E+03 4.69E+03 4.69E+03iron (ore) Raw tn.lg 2.83 2.84 2.84 2.89 2.89K Raw lb 87.4 87.4 87.4 87.4 87.4lead (in ore) Raw lb 315 315 315 315 315lignite Raw tn.lg 1.25 1.25 1.25 1.25 1.25lignite ETH Raw tn.lg 1.32 1.32 1.32 1.32 1.32limestone Raw tn.lg 72.2 71.4 68.8 74.6 74.7manganese (in ore) Raw oz 372 387 402 492 492manganese (ore) Raw oz x x x x xmarl Raw tn.lg 13.4 13.7 13.9 15.2 15.2methane (kg) Raw lb 69 69.1 69.2 69.3 69.3methane (kg) ETH Raw oz 770 778 787 838 838molybdene (in ore) Raw oz 3.69E-05 3.69E-05 3.69E-05 3.69E-05 3.69E-05NaCl Raw lb 1.19E+03 1.19E+03 1.19E+03 1.19E+03 1.19E+03NaOH Raw lb 86.2 144 144 166 166natural gas Raw tn.lg 3.64 3.67 3.67 3.69 3.69natural gas (feedstock) FAL Raw lb 0 16.7 33.5 134 134natural gas ETH Raw cu.yd 2.13E+03 2.13E+03 2.13E+03 2.14E+03 2.14E+03natural gas FAL Raw tn.lg 219 305 362 512 564nickel (in ore) Raw oz 10.9 10.9 10.9 10.9 10.9nitrogen Raw oz 464 464 464 464 464oxygen Raw lb 483 483 483 483 483palladium (in ore) Raw oz 5.73E-05 5.73E-05 5.73E-05 5.73E-05 5.73E-05petroleum gas ETH Raw cu.yd 81.2 81.2 81.3 81.3 81.3phosphate (ore) Raw oz x x x x x*An x means there are no data.

D-26
Table D-2. LCI Output from SimaPro for Lightweight CMU Houses – U.S. Customary Units (Continued)*
Lightweight CMU Substance Compartment Unit
Tampa El Paso Knoxville Providence Detroit platinum (in ore) Raw oz 6.47E-05 6.47E-05 6.47E-05 6.47E-05 6.47E-05potential energy water ETH Raw MWh 2.28 2.28 2.28 2.28 2.28reservoir content ETH Raw m3y 175 175 175 176 176rhenium (in ore) Raw oz 5.48E-05 5.48E-05 5.48E-05 5.48E-05 5.48E-05rhodium (in ore) Raw oz 6.08E-05 6.08E-05 6.08E-05 6.09E-05 6.09E-05rock salt Raw lb 1.45E+03 1.45E+03 1.45E+03 1.45E+03 1.45E+03sand Raw tn.lg 84.3 86.4 88.3 100 100scrap, external Raw lb 1.88E+03 1.88E+03 1.88E+03 1.88E+03 1.88E+03shale Raw lb 4.82E+03 4.94E+03 5.07E+03 5.81E+03 5.81E+03silicon (in SiO2) Raw oz 183 190 197 242 242silver Raw oz 0.123 0.123 0.123 0.123 0.123silver (in ore) Raw oz 0.101 0.101 0.101 0.101 0.101sulphur Raw oz 409 409 409 409 409tin (in ore) Raw oz 0.124 0.124 0.124 0.124 0.124turbine water ETH Raw cu.yd 5.53E+04 5.53E+04 5.53E+04 5.54E+04 5.54E+04uranium (in ore) Raw oz 14.1 14.1 14.1 14.1 14.1uranium (in ore) ETH Raw oz 3.19 3.19 3.19 3.2 3.2uranium (ore) Raw oz 248 248 248 248 248uranium FAL Raw oz 58.6 53.8 44.2 40.4 40.7water Raw tn.lg 989 990 992 1.00E+03 1.00E+03wood Raw tn.lg 23.4 23.4 23.4 23.4 23.4wood (dry matter) ETH Raw tn.lg 9.21 9.21 9.21 9.22 9.22wood/wood wastes FAL Raw lb 734 765 728 824 873zeolite Raw oz 2.86 2.86 2.86 2.86 2.86zinc (in ore) Raw oz 0.236 0.236 0.236 0.236 0.2361,2-dichloroethane Air oz 0.00211 0.00211 0.00211 0.00212 0.00212*An x means there are no data.
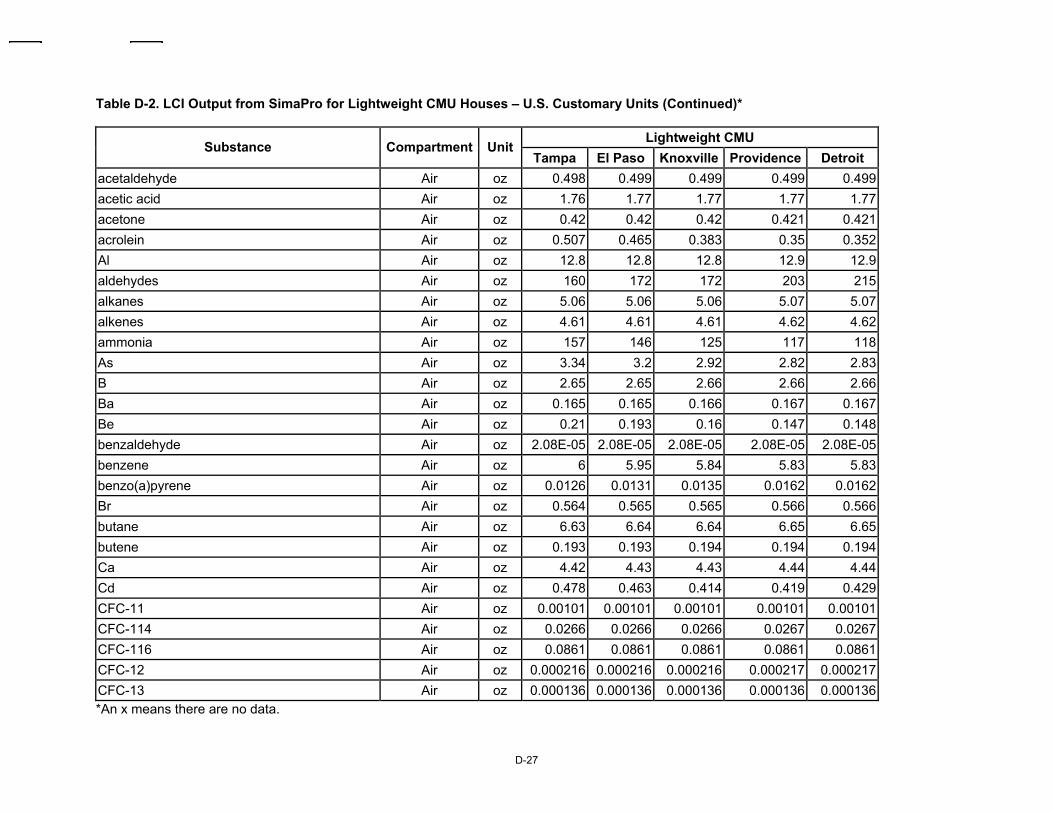
D-27
Table D-2. LCI Output from SimaPro for Lightweight CMU Houses – U.S. Customary Units (Continued)*
Lightweight CMU Substance Compartment Unit
Tampa El Paso Knoxville Providence Detroit acetaldehyde Air oz 0.498 0.499 0.499 0.499 0.499acetic acid Air oz 1.76 1.77 1.77 1.77 1.77acetone Air oz 0.42 0.42 0.42 0.421 0.421acrolein Air oz 0.507 0.465 0.383 0.35 0.352Al Air oz 12.8 12.8 12.8 12.9 12.9aldehydes Air oz 160 172 172 203 215alkanes Air oz 5.06 5.06 5.06 5.07 5.07alkenes Air oz 4.61 4.61 4.61 4.62 4.62ammonia Air oz 157 146 125 117 118As Air oz 3.34 3.2 2.92 2.82 2.83B Air oz 2.65 2.65 2.66 2.66 2.66Ba Air oz 0.165 0.165 0.166 0.167 0.167Be Air oz 0.21 0.193 0.16 0.147 0.148benzaldehyde Air oz 2.08E-05 2.08E-05 2.08E-05 2.08E-05 2.08E-05benzene Air oz 6 5.95 5.84 5.83 5.83benzo(a)pyrene Air oz 0.0126 0.0131 0.0135 0.0162 0.0162Br Air oz 0.564 0.565 0.565 0.566 0.566butane Air oz 6.63 6.64 6.64 6.65 6.65butene Air oz 0.193 0.193 0.194 0.194 0.194Ca Air oz 4.42 4.43 4.43 4.44 4.44Cd Air oz 0.478 0.463 0.414 0.419 0.429CFC-11 Air oz 0.00101 0.00101 0.00101 0.00101 0.00101CFC-114 Air oz 0.0266 0.0266 0.0266 0.0267 0.0267CFC-116 Air oz 0.0861 0.0861 0.0861 0.0861 0.0861CFC-12 Air oz 0.000216 0.000216 0.000216 0.000217 0.000217CFC-13 Air oz 0.000136 0.000136 0.000136 0.000136 0.000136*An x means there are no data.
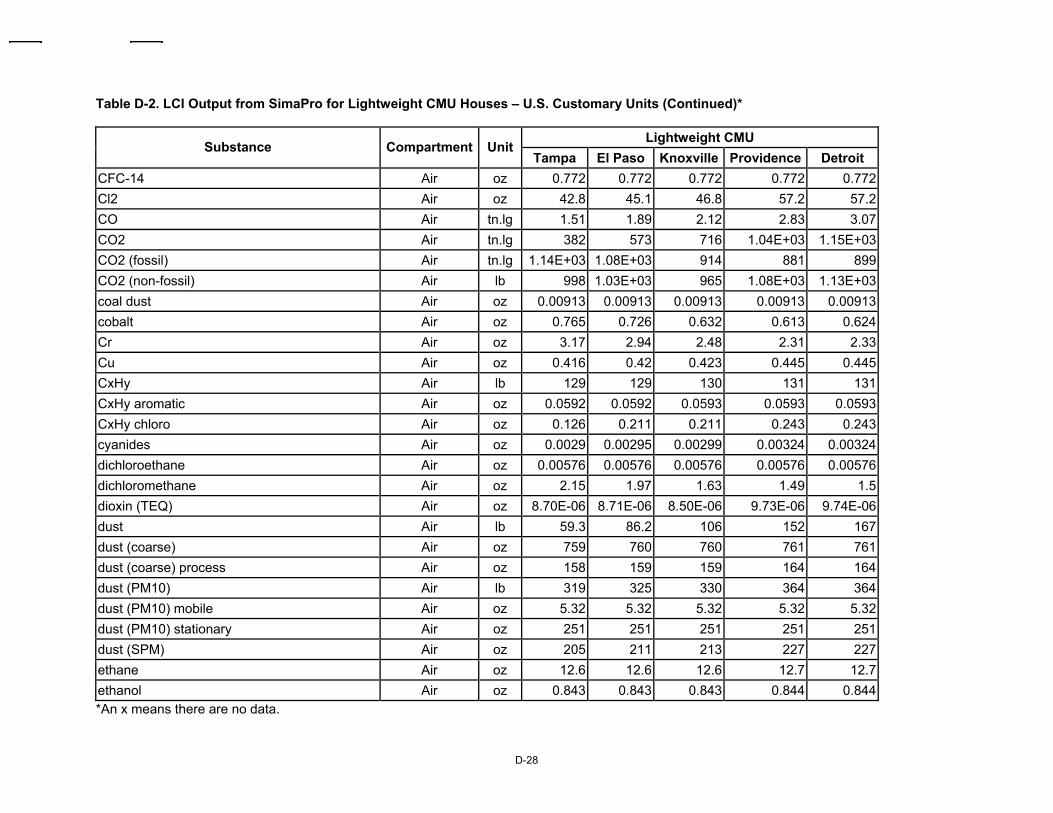
D-28
Table D-2. LCI Output from SimaPro for Lightweight CMU Houses – U.S. Customary Units (Continued)*
Lightweight CMU Substance Compartment Unit
Tampa El Paso Knoxville Providence Detroit CFC-14 Air oz 0.772 0.772 0.772 0.772 0.772Cl2 Air oz 42.8 45.1 46.8 57.2 57.2CO Air tn.lg 1.51 1.89 2.12 2.83 3.07CO2 Air tn.lg 382 573 716 1.04E+03 1.15E+03CO2 (fossil) Air tn.lg 1.14E+03 1.08E+03 914 881 899CO2 (non-fossil) Air lb 998 1.03E+03 965 1.08E+03 1.13E+03coal dust Air oz 0.00913 0.00913 0.00913 0.00913 0.00913cobalt Air oz 0.765 0.726 0.632 0.613 0.624Cr Air oz 3.17 2.94 2.48 2.31 2.33Cu Air oz 0.416 0.42 0.423 0.445 0.445CxHy Air lb 129 129 130 131 131CxHy aromatic Air oz 0.0592 0.0592 0.0593 0.0593 0.0593CxHy chloro Air oz 0.126 0.211 0.211 0.243 0.243cyanides Air oz 0.0029 0.00295 0.00299 0.00324 0.00324dichloroethane Air oz 0.00576 0.00576 0.00576 0.00576 0.00576dichloromethane Air oz 2.15 1.97 1.63 1.49 1.5dioxin (TEQ) Air oz 8.70E-06 8.71E-06 8.50E-06 9.73E-06 9.74E-06dust Air lb 59.3 86.2 106 152 167dust (coarse) Air oz 759 760 760 761 761dust (coarse) process Air oz 158 159 159 164 164dust (PM10) Air lb 319 325 330 364 364dust (PM10) mobile Air oz 5.32 5.32 5.32 5.32 5.32dust (PM10) stationary Air oz 251 251 251 251 251dust (SPM) Air oz 205 211 213 227 227ethane Air oz 12.6 12.6 12.6 12.7 12.7ethanol Air oz 0.843 0.843 0.843 0.844 0.844*An x means there are no data.
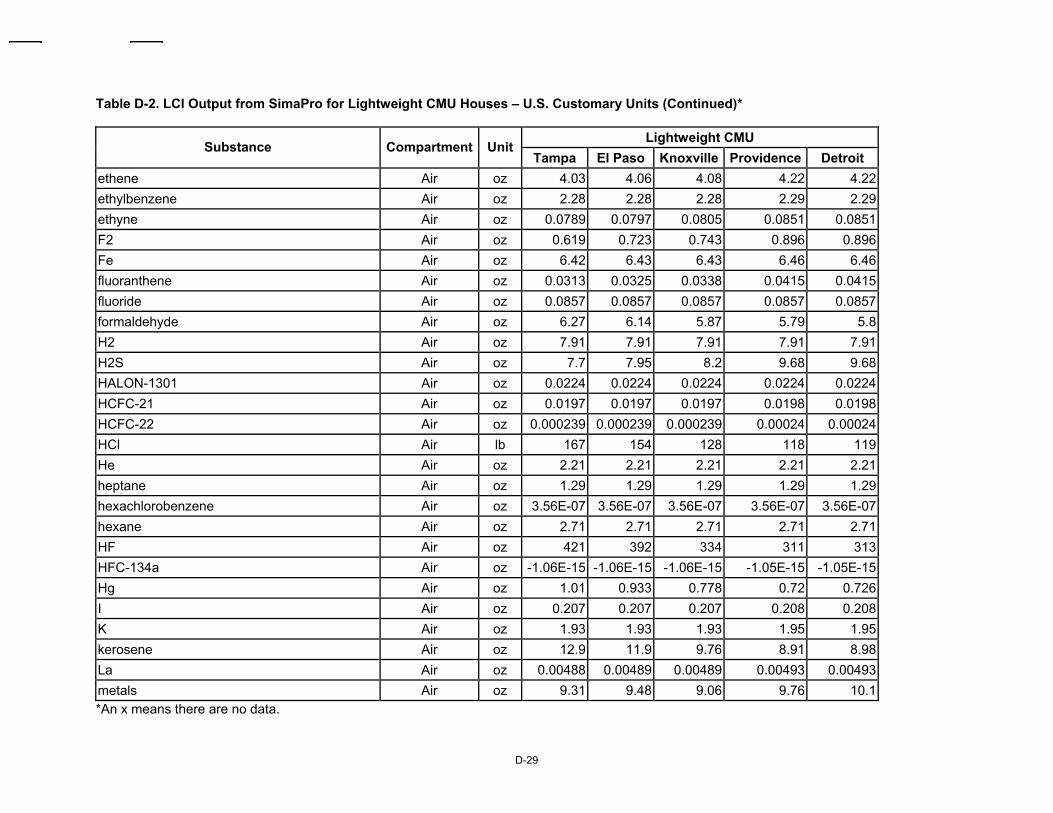
D-29
Table D-2. LCI Output from SimaPro for Lightweight CMU Houses – U.S. Customary Units (Continued)*
Lightweight CMU Substance Compartment Unit
Tampa El Paso Knoxville Providence Detroit ethene Air oz 4.03 4.06 4.08 4.22 4.22ethylbenzene Air oz 2.28 2.28 2.28 2.29 2.29ethyne Air oz 0.0789 0.0797 0.0805 0.0851 0.0851F2 Air oz 0.619 0.723 0.743 0.896 0.896Fe Air oz 6.42 6.43 6.43 6.46 6.46fluoranthene Air oz 0.0313 0.0325 0.0338 0.0415 0.0415fluoride Air oz 0.0857 0.0857 0.0857 0.0857 0.0857formaldehyde Air oz 6.27 6.14 5.87 5.79 5.8H2 Air oz 7.91 7.91 7.91 7.91 7.91H2S Air oz 7.7 7.95 8.2 9.68 9.68HALON-1301 Air oz 0.0224 0.0224 0.0224 0.0224 0.0224HCFC-21 Air oz 0.0197 0.0197 0.0197 0.0198 0.0198HCFC-22 Air oz 0.000239 0.000239 0.000239 0.00024 0.00024HCl Air lb 167 154 128 118 119He Air oz 2.21 2.21 2.21 2.21 2.21heptane Air oz 1.29 1.29 1.29 1.29 1.29hexachlorobenzene Air oz 3.56E-07 3.56E-07 3.56E-07 3.56E-07 3.56E-07hexane Air oz 2.71 2.71 2.71 2.71 2.71HF Air oz 421 392 334 311 313HFC-134a Air oz -1.06E-15 -1.06E-15 -1.06E-15 -1.05E-15 -1.05E-15Hg Air oz 1.01 0.933 0.778 0.72 0.726I Air oz 0.207 0.207 0.207 0.208 0.208K Air oz 1.93 1.93 1.93 1.95 1.95kerosene Air oz 12.9 11.9 9.76 8.91 8.98La Air oz 0.00488 0.00489 0.00489 0.00493 0.00493metals Air oz 9.31 9.48 9.06 9.76 10.1*An x means there are no data.
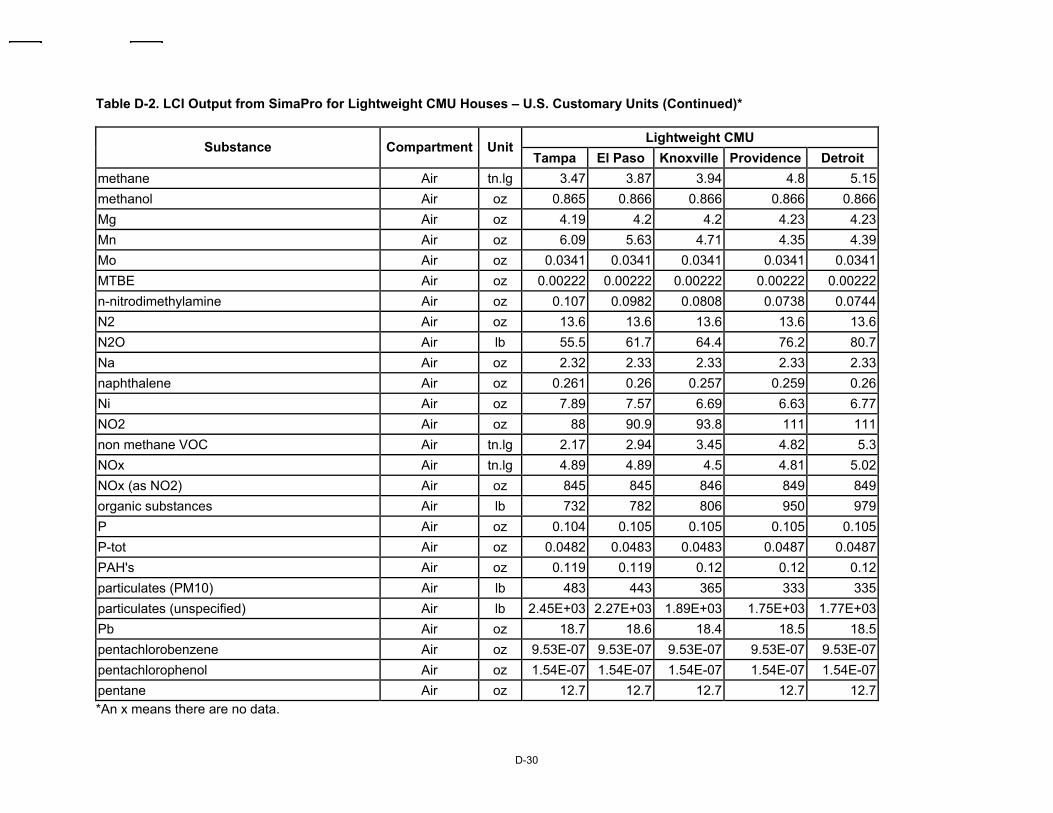
D-30
Table D-2. LCI Output from SimaPro for Lightweight CMU Houses – U.S. Customary Units (Continued)*
Lightweight CMU Substance Compartment Unit
Tampa El Paso Knoxville Providence Detroit methane Air tn.lg 3.47 3.87 3.94 4.8 5.15methanol Air oz 0.865 0.866 0.866 0.866 0.866Mg Air oz 4.19 4.2 4.2 4.23 4.23Mn Air oz 6.09 5.63 4.71 4.35 4.39Mo Air oz 0.0341 0.0341 0.0341 0.0341 0.0341MTBE Air oz 0.00222 0.00222 0.00222 0.00222 0.00222n-nitrodimethylamine Air oz 0.107 0.0982 0.0808 0.0738 0.0744N2 Air oz 13.6 13.6 13.6 13.6 13.6N2O Air lb 55.5 61.7 64.4 76.2 80.7Na Air oz 2.32 2.33 2.33 2.33 2.33naphthalene Air oz 0.261 0.26 0.257 0.259 0.26Ni Air oz 7.89 7.57 6.69 6.63 6.77NO2 Air oz 88 90.9 93.8 111 111non methane VOC Air tn.lg 2.17 2.94 3.45 4.82 5.3NOx Air tn.lg 4.89 4.89 4.5 4.81 5.02NOx (as NO2) Air oz 845 845 846 849 849organic substances Air lb 732 782 806 950 979P Air oz 0.104 0.105 0.105 0.105 0.105P-tot Air oz 0.0482 0.0483 0.0483 0.0487 0.0487PAH's Air oz 0.119 0.119 0.12 0.12 0.12particulates (PM10) Air lb 483 443 365 333 335particulates (unspecified) Air lb 2.45E+03 2.27E+03 1.89E+03 1.75E+03 1.77E+03Pb Air oz 18.7 18.6 18.4 18.5 18.5pentachlorobenzene Air oz 9.53E-07 9.53E-07 9.53E-07 9.53E-07 9.53E-07pentachlorophenol Air oz 1.54E-07 1.54E-07 1.54E-07 1.54E-07 1.54E-07pentane Air oz 12.7 12.7 12.7 12.7 12.7*An x means there are no data.

D-31
Table D-2. LCI Output from SimaPro for Lightweight CMU Houses – U.S. Customary Units (Continued)*
Lightweight CMU Substance Compartment Unit
Tampa El Paso Knoxville Providence Detroit phenol Air oz 1.5 1.49 1.3 1.29 1.31phosphate Air oz 0.0416 0.0416 0.0416 0.0416 0.0416propane Air oz 8.77 8.78 8.79 8.82 8.82propene Air oz 0.519 0.521 0.522 0.532 0.532propionic acid Air oz 0.011 0.0111 0.0111 0.0113 0.0113Pt Air oz 2.05E-05 2.05E-05 2.05E-05 2.05E-05 2.05E-05Sb Air oz 0.236 0.223 0.19 0.183 0.187Sc Air oz 0.00197 0.00197 0.00197 0.00199 0.00199Se Air oz 3.68 3.39 2.81 2.59 2.61silicates Air oz 24.3 24.3 24.4 24.5 24.5Sn Air oz 0.00409 0.0041 0.0041 0.00411 0.00411SO2 Air lb 897 903 909 934 935soot Air oz 74.1 74.2 74.3 75.2 75.2SOx Air tn.lg 13.7 16.1 17 21.7 23.5SOx (as SO2) Air lb 92.3 92.4 92.4 92.6 92.6Sr Air oz 0.197 0.197 0.197 0.198 0.198tetrachloroethene Air oz 0.483 0.443 0.365 0.334 0.336tetrachloromethane Air oz 0.795 0.735 0.611 0.567 0.574Th Air oz 0.00913 0.00914 0.00915 0.00917 0.00917Ti Air oz 0.584 0.584 0.585 0.588 0.588Tl Air oz 0.000754 0.000755 0.000756 0.00076 0.00076toluene Air oz 7.7 7.71 7.71 7.73 7.73trichloroethene Air oz 0.479 0.439 0.362 0.33 0.333trichloromethane Air oz 0.000152 0.000152 0.000152 0.000152 0.000152U Air oz 0.00469 0.00469 0.0047 0.00471 0.00471V Air oz 4.36 4.36 4.36 4.37 4.37*An x means there are no data.
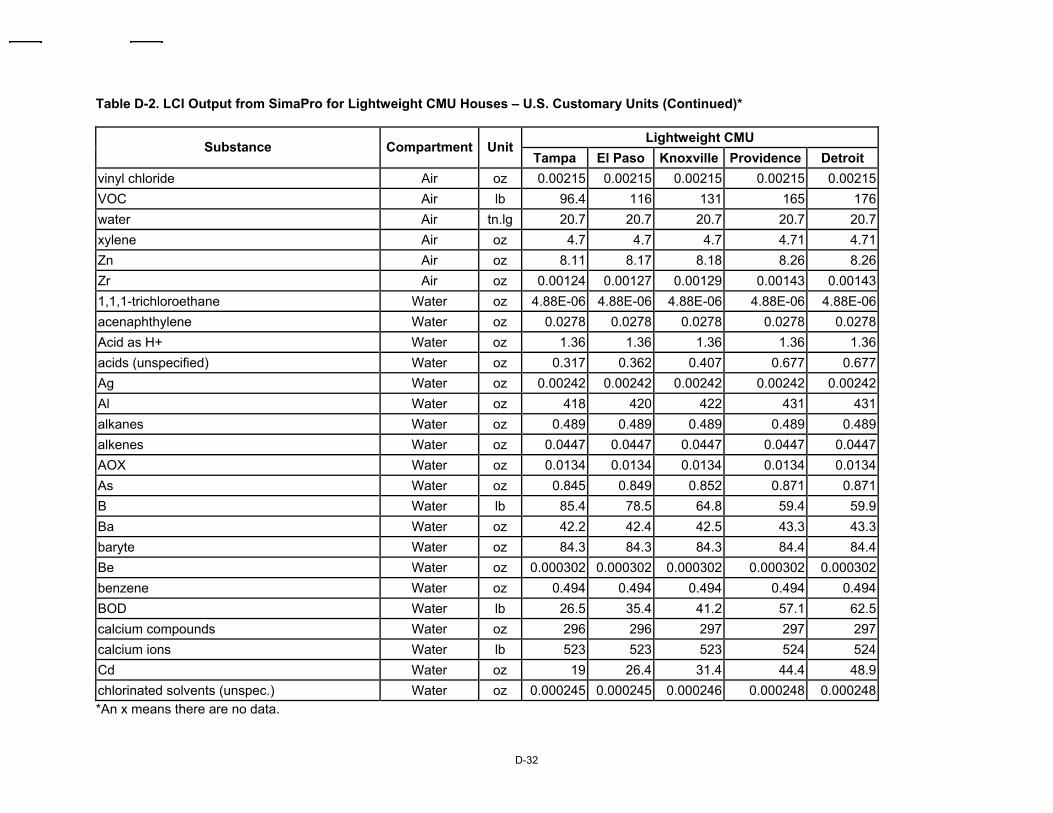
D-32
Table D-2. LCI Output from SimaPro for Lightweight CMU Houses – U.S. Customary Units (Continued)*
Lightweight CMU Substance Compartment Unit
Tampa El Paso Knoxville Providence Detroit vinyl chloride Air oz 0.00215 0.00215 0.00215 0.00215 0.00215VOC Air lb 96.4 116 131 165 176water Air tn.lg 20.7 20.7 20.7 20.7 20.7xylene Air oz 4.7 4.7 4.7 4.71 4.71Zn Air oz 8.11 8.17 8.18 8.26 8.26Zr Air oz 0.00124 0.00127 0.00129 0.00143 0.001431,1,1-trichloroethane Water oz 4.88E-06 4.88E-06 4.88E-06 4.88E-06 4.88E-06acenaphthylene Water oz 0.0278 0.0278 0.0278 0.0278 0.0278Acid as H+ Water oz 1.36 1.36 1.36 1.36 1.36acids (unspecified) Water oz 0.317 0.362 0.407 0.677 0.677Ag Water oz 0.00242 0.00242 0.00242 0.00242 0.00242Al Water oz 418 420 422 431 431alkanes Water oz 0.489 0.489 0.489 0.489 0.489alkenes Water oz 0.0447 0.0447 0.0447 0.0447 0.0447AOX Water oz 0.0134 0.0134 0.0134 0.0134 0.0134As Water oz 0.845 0.849 0.852 0.871 0.871B Water lb 85.4 78.5 64.8 59.4 59.9Ba Water oz 42.2 42.4 42.5 43.3 43.3baryte Water oz 84.3 84.3 84.3 84.4 84.4Be Water oz 0.000302 0.000302 0.000302 0.000302 0.000302benzene Water oz 0.494 0.494 0.494 0.494 0.494BOD Water lb 26.5 35.4 41.2 57.1 62.5calcium compounds Water oz 296 296 297 297 297calcium ions Water lb 523 523 523 524 524Cd Water oz 19 26.4 31.4 44.4 48.9chlorinated solvents (unspec.) Water oz 0.000245 0.000245 0.000246 0.000248 0.000248*An x means there are no data.
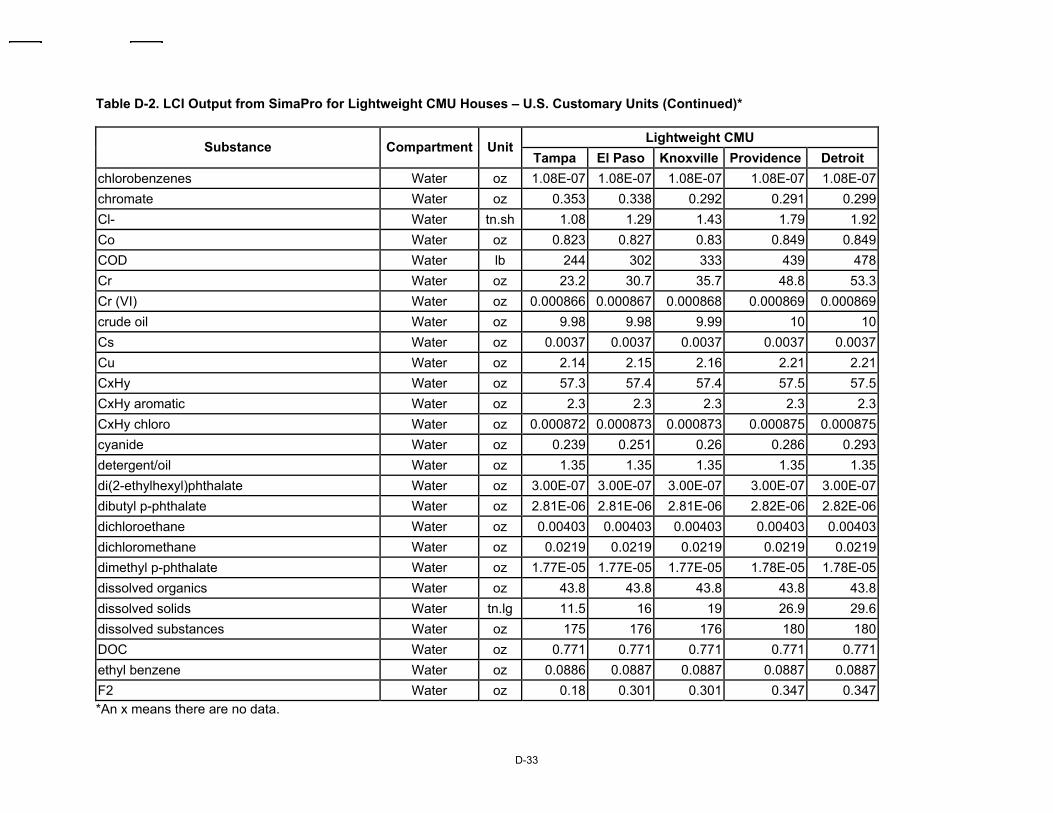
D-33
Table D-2. LCI Output from SimaPro for Lightweight CMU Houses – U.S. Customary Units (Continued)*
Lightweight CMU Substance Compartment Unit
Tampa El Paso Knoxville Providence Detroit chlorobenzenes Water oz 1.08E-07 1.08E-07 1.08E-07 1.08E-07 1.08E-07chromate Water oz 0.353 0.338 0.292 0.291 0.299Cl- Water tn.sh 1.08 1.29 1.43 1.79 1.92Co Water oz 0.823 0.827 0.83 0.849 0.849COD Water lb 244 302 333 439 478Cr Water oz 23.2 30.7 35.7 48.8 53.3Cr (VI) Water oz 0.000866 0.000867 0.000868 0.000869 0.000869crude oil Water oz 9.98 9.98 9.99 10 10Cs Water oz 0.0037 0.0037 0.0037 0.0037 0.0037Cu Water oz 2.14 2.15 2.16 2.21 2.21CxHy Water oz 57.3 57.4 57.4 57.5 57.5CxHy aromatic Water oz 2.3 2.3 2.3 2.3 2.3CxHy chloro Water oz 0.000872 0.000873 0.000873 0.000875 0.000875cyanide Water oz 0.239 0.251 0.26 0.286 0.293detergent/oil Water oz 1.35 1.35 1.35 1.35 1.35di(2-ethylhexyl)phthalate Water oz 3.00E-07 3.00E-07 3.00E-07 3.00E-07 3.00E-07dibutyl p-phthalate Water oz 2.81E-06 2.81E-06 2.81E-06 2.82E-06 2.82E-06dichloroethane Water oz 0.00403 0.00403 0.00403 0.00403 0.00403dichloromethane Water oz 0.0219 0.0219 0.0219 0.0219 0.0219dimethyl p-phthalate Water oz 1.77E-05 1.77E-05 1.77E-05 1.78E-05 1.78E-05dissolved organics Water oz 43.8 43.8 43.8 43.8 43.8dissolved solids Water tn.lg 11.5 16 19 26.9 29.6dissolved substances Water oz 175 176 176 180 180DOC Water oz 0.771 0.771 0.771 0.771 0.771ethyl benzene Water oz 0.0886 0.0887 0.0887 0.0887 0.0887F2 Water oz 0.18 0.301 0.301 0.347 0.347*An x means there are no data.
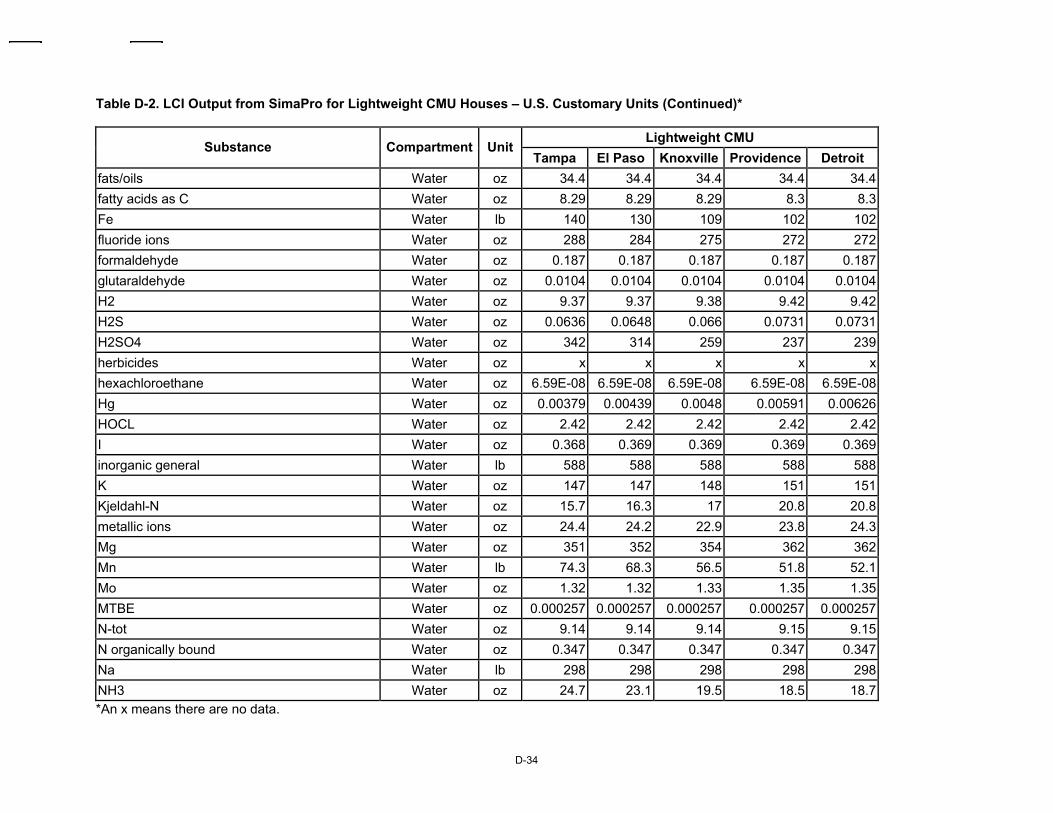
D-34
Table D-2. LCI Output from SimaPro for Lightweight CMU Houses – U.S. Customary Units (Continued)*
Lightweight CMU Substance Compartment Unit
Tampa El Paso Knoxville Providence Detroit fats/oils Water oz 34.4 34.4 34.4 34.4 34.4fatty acids as C Water oz 8.29 8.29 8.29 8.3 8.3Fe Water lb 140 130 109 102 102fluoride ions Water oz 288 284 275 272 272formaldehyde Water oz 0.187 0.187 0.187 0.187 0.187glutaraldehyde Water oz 0.0104 0.0104 0.0104 0.0104 0.0104H2 Water oz 9.37 9.37 9.38 9.42 9.42H2S Water oz 0.0636 0.0648 0.066 0.0731 0.0731H2SO4 Water oz 342 314 259 237 239herbicides Water oz x x x x xhexachloroethane Water oz 6.59E-08 6.59E-08 6.59E-08 6.59E-08 6.59E-08Hg Water oz 0.00379 0.00439 0.0048 0.00591 0.00626HOCL Water oz 2.42 2.42 2.42 2.42 2.42I Water oz 0.368 0.369 0.369 0.369 0.369inorganic general Water lb 588 588 588 588 588K Water oz 147 147 148 151 151Kjeldahl-N Water oz 15.7 16.3 17 20.8 20.8metallic ions Water oz 24.4 24.2 22.9 23.8 24.3Mg Water oz 351 352 354 362 362Mn Water lb 74.3 68.3 56.5 51.8 52.1Mo Water oz 1.32 1.32 1.33 1.35 1.35MTBE Water oz 0.000257 0.000257 0.000257 0.000257 0.000257N-tot Water oz 9.14 9.14 9.14 9.15 9.15N organically bound Water oz 0.347 0.347 0.347 0.347 0.347Na Water lb 298 298 298 298 298NH3 Water oz 24.7 23.1 19.5 18.5 18.7*An x means there are no data.
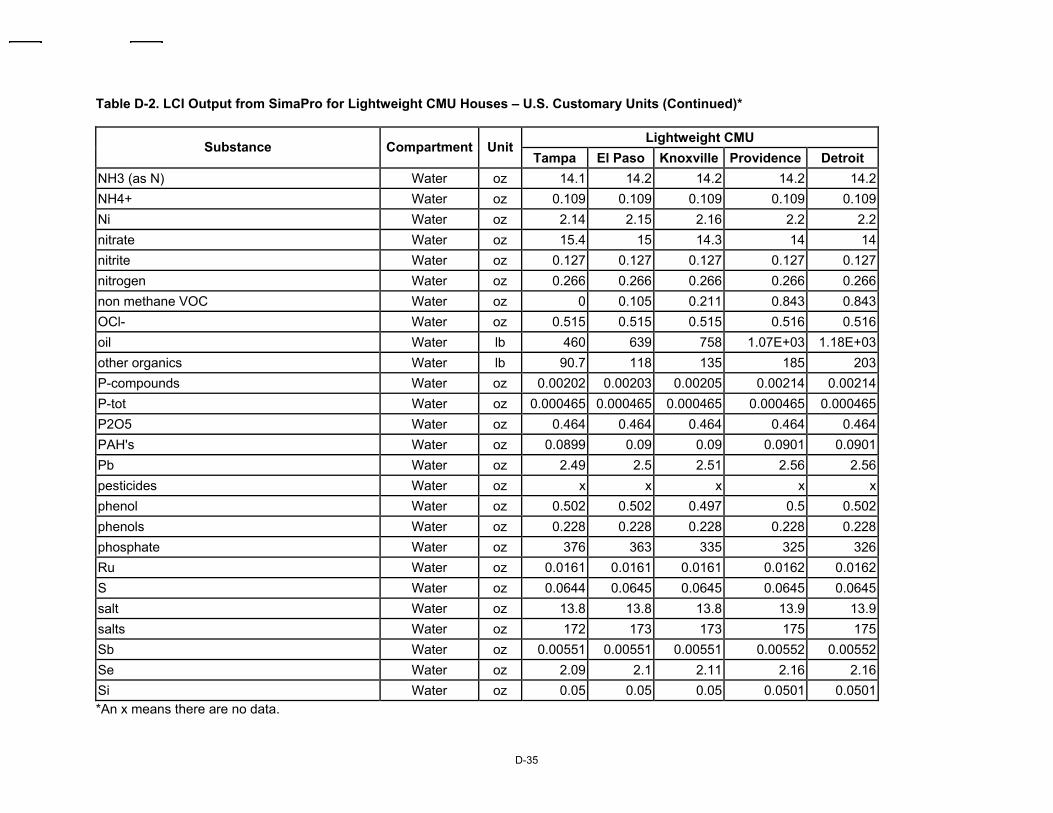
D-35
Table D-2. LCI Output from SimaPro for Lightweight CMU Houses – U.S. Customary Units (Continued)*
Lightweight CMU Substance Compartment Unit
Tampa El Paso Knoxville Providence Detroit NH3 (as N) Water oz 14.1 14.2 14.2 14.2 14.2NH4+ Water oz 0.109 0.109 0.109 0.109 0.109Ni Water oz 2.14 2.15 2.16 2.2 2.2nitrate Water oz 15.4 15 14.3 14 14nitrite Water oz 0.127 0.127 0.127 0.127 0.127nitrogen Water oz 0.266 0.266 0.266 0.266 0.266non methane VOC Water oz 0 0.105 0.211 0.843 0.843OCl- Water oz 0.515 0.515 0.515 0.516 0.516oil Water lb 460 639 758 1.07E+03 1.18E+03other organics Water lb 90.7 118 135 185 203P-compounds Water oz 0.00202 0.00203 0.00205 0.00214 0.00214P-tot Water oz 0.000465 0.000465 0.000465 0.000465 0.000465P2O5 Water oz 0.464 0.464 0.464 0.464 0.464PAH's Water oz 0.0899 0.09 0.09 0.0901 0.0901Pb Water oz 2.49 2.5 2.51 2.56 2.56pesticides Water oz x x x x xphenol Water oz 0.502 0.502 0.497 0.5 0.502phenols Water oz 0.228 0.228 0.228 0.228 0.228phosphate Water oz 376 363 335 325 326Ru Water oz 0.0161 0.0161 0.0161 0.0162 0.0162S Water oz 0.0644 0.0645 0.0645 0.0645 0.0645salt Water oz 13.8 13.8 13.8 13.9 13.9salts Water oz 172 173 173 175 175Sb Water oz 0.00551 0.00551 0.00551 0.00552 0.00552Se Water oz 2.09 2.1 2.11 2.16 2.16Si Water oz 0.05 0.05 0.05 0.0501 0.0501*An x means there are no data.
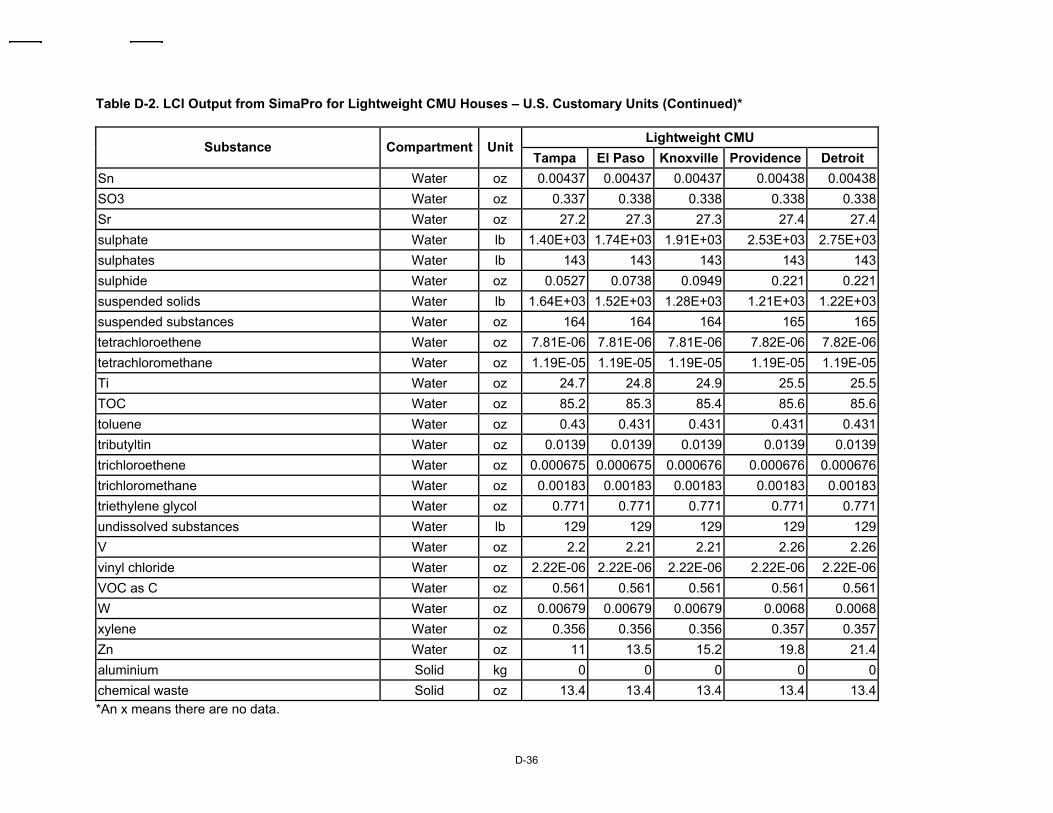
D-36
Table D-2. LCI Output from SimaPro for Lightweight CMU Houses – U.S. Customary Units (Continued)*
Lightweight CMU Substance Compartment Unit
Tampa El Paso Knoxville Providence Detroit Sn Water oz 0.00437 0.00437 0.00437 0.00438 0.00438SO3 Water oz 0.337 0.338 0.338 0.338 0.338Sr Water oz 27.2 27.3 27.3 27.4 27.4sulphate Water lb 1.40E+03 1.74E+03 1.91E+03 2.53E+03 2.75E+03sulphates Water lb 143 143 143 143 143sulphide Water oz 0.0527 0.0738 0.0949 0.221 0.221suspended solids Water lb 1.64E+03 1.52E+03 1.28E+03 1.21E+03 1.22E+03suspended substances Water oz 164 164 164 165 165tetrachloroethene Water oz 7.81E-06 7.81E-06 7.81E-06 7.82E-06 7.82E-06tetrachloromethane Water oz 1.19E-05 1.19E-05 1.19E-05 1.19E-05 1.19E-05Ti Water oz 24.7 24.8 24.9 25.5 25.5TOC Water oz 85.2 85.3 85.4 85.6 85.6toluene Water oz 0.43 0.431 0.431 0.431 0.431tributyltin Water oz 0.0139 0.0139 0.0139 0.0139 0.0139trichloroethene Water oz 0.000675 0.000675 0.000676 0.000676 0.000676trichloromethane Water oz 0.00183 0.00183 0.00183 0.00183 0.00183triethylene glycol Water oz 0.771 0.771 0.771 0.771 0.771undissolved substances Water lb 129 129 129 129 129V Water oz 2.2 2.21 2.21 2.26 2.26vinyl chloride Water oz 2.22E-06 2.22E-06 2.22E-06 2.22E-06 2.22E-06VOC as C Water oz 0.561 0.561 0.561 0.561 0.561W Water oz 0.00679 0.00679 0.00679 0.0068 0.0068xylene Water oz 0.356 0.356 0.356 0.357 0.357Zn Water oz 11 13.5 15.2 19.8 21.4aluminium Solid kg 0 0 0 0 0chemical waste Solid oz 13.4 13.4 13.4 13.4 13.4*An x means there are no data.
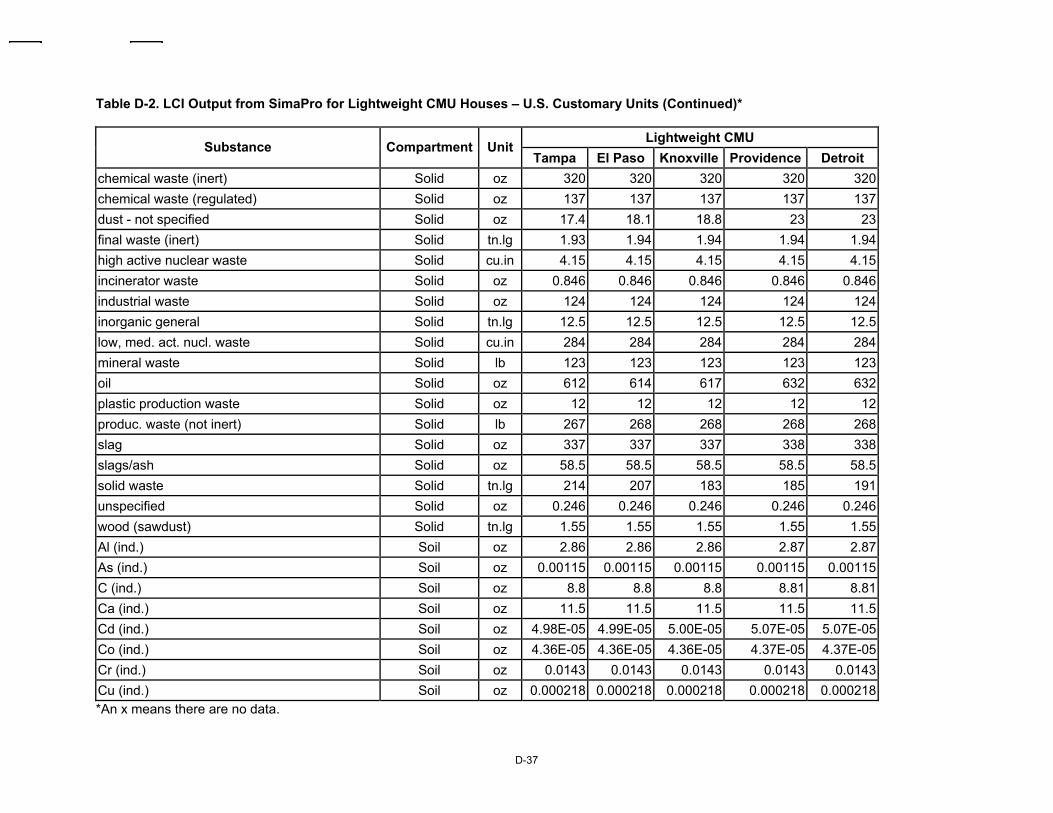
D-37
Table D-2. LCI Output from SimaPro for Lightweight CMU Houses – U.S. Customary Units (Continued)*
Lightweight CMU Substance Compartment Unit
Tampa El Paso Knoxville Providence Detroit chemical waste (inert) Solid oz 320 320 320 320 320chemical waste (regulated) Solid oz 137 137 137 137 137dust - not specified Solid oz 17.4 18.1 18.8 23 23final waste (inert) Solid tn.lg 1.93 1.94 1.94 1.94 1.94high active nuclear waste Solid cu.in 4.15 4.15 4.15 4.15 4.15incinerator waste Solid oz 0.846 0.846 0.846 0.846 0.846industrial waste Solid oz 124 124 124 124 124inorganic general Solid tn.lg 12.5 12.5 12.5 12.5 12.5low, med. act. nucl. waste Solid cu.in 284 284 284 284 284mineral waste Solid lb 123 123 123 123 123oil Solid oz 612 614 617 632 632plastic production waste Solid oz 12 12 12 12 12produc. waste (not inert) Solid lb 267 268 268 268 268slag Solid oz 337 337 337 338 338slags/ash Solid oz 58.5 58.5 58.5 58.5 58.5solid waste Solid tn.lg 214 207 183 185 191unspecified Solid oz 0.246 0.246 0.246 0.246 0.246wood (sawdust) Solid tn.lg 1.55 1.55 1.55 1.55 1.55Al (ind.) Soil oz 2.86 2.86 2.86 2.87 2.87As (ind.) Soil oz 0.00115 0.00115 0.00115 0.00115 0.00115C (ind.) Soil oz 8.8 8.8 8.8 8.81 8.81Ca (ind.) Soil oz 11.5 11.5 11.5 11.5 11.5Cd (ind.) Soil oz 4.98E-05 4.99E-05 5.00E-05 5.07E-05 5.07E-05Co (ind.) Soil oz 4.36E-05 4.36E-05 4.36E-05 4.37E-05 4.37E-05Cr (ind.) Soil oz 0.0143 0.0143 0.0143 0.0143 0.0143Cu (ind.) Soil oz 0.000218 0.000218 0.000218 0.000218 0.000218*An x means there are no data.

D-38
Table D-2. LCI Output from SimaPro for Lightweight CMU Houses – U.S. Customary Units (Continued)*
Lightweight CMU Substance Compartment Unit
Tampa El Paso Knoxville Providence Detroit Fe (ind.) Soil oz 5.74 5.74 5.74 5.74 5.74Hg (ind.) Soil oz 9.29E-06 9.36E-06 9.42E-06 9.81E-06 9.81E-06Mn (ind.) Soil oz 0.115 0.115 0.115 0.115 0.115N Soil oz 0.00515 0.00522 0.00528 0.0057 0.0057Ni (ind.) Soil oz 0.000327 0.000327 0.000327 0.000327 0.000327oil (ind.) Soil oz 8.29 8.29 8.29 8.29 8.29oil biodegradable Soil oz 4.31 4.31 4.31 4.31 4.31P-tot Soil oz 0.164 0.164 0.165 0.167 0.167Pb (ind.) Soil oz 0.000999 0.001 0.001 0.001 0.001S (ind.) Soil oz 1.72 1.72 1.72 1.72 1.72Zn (ind.) Soil oz 0.0451 0.0451 0.0451 0.0452 0.0452Ag110m to air Non mat. Bq 0.0364 0.0364 0.0364 0.0365 0.0365Ag110m to water Non mat. Bq 249 249 249 249 249alpha radiation (unspecified) to water Non mat. Bq 0.0293 0.0293 0.0294 0.0294 0.0294Am241 to air Non mat. Bq 0.697 0.697 0.697 0.698 0.698Am241 to water Non mat. Bq 91.5 91.5 91.6 91.7 91.7Ar41 to air Non mat. Bq 7.90E+04 7.90E+04 7.90E+04 7.91E+04 7.91E+04Ba140 to air Non mat. Bq 0.161 0.161 0.161 0.162 0.162Ba140 to water Non mat. Bq 0.772 0.773 0.773 0.773 0.773beta radiation (unspecified) to air Non mat. Bq 0.00708 0.00708 0.00708 0.00709 0.00709C14 to air Non mat. Bq 5.68E+04 5.68E+04 5.68E+04 5.69E+04 5.69E+04C14 to water Non mat. Bq 4.63E+03 4.63E+03 4.63E+03 4.64E+03 4.64E+03Cd109 to water Non mat. Bq 0.00448 0.00448 0.00448 0.00448 0.00448Ce141 to air Non mat. Bq 0.0034 0.0034 0.0034 0.00341 0.00341Ce141 to water Non mat. Bq 0.116 0.116 0.116 0.116 0.116Ce144 to air Non mat. Bq 7.41 7.41 7.41 7.42 7.42*An x means there are no data.
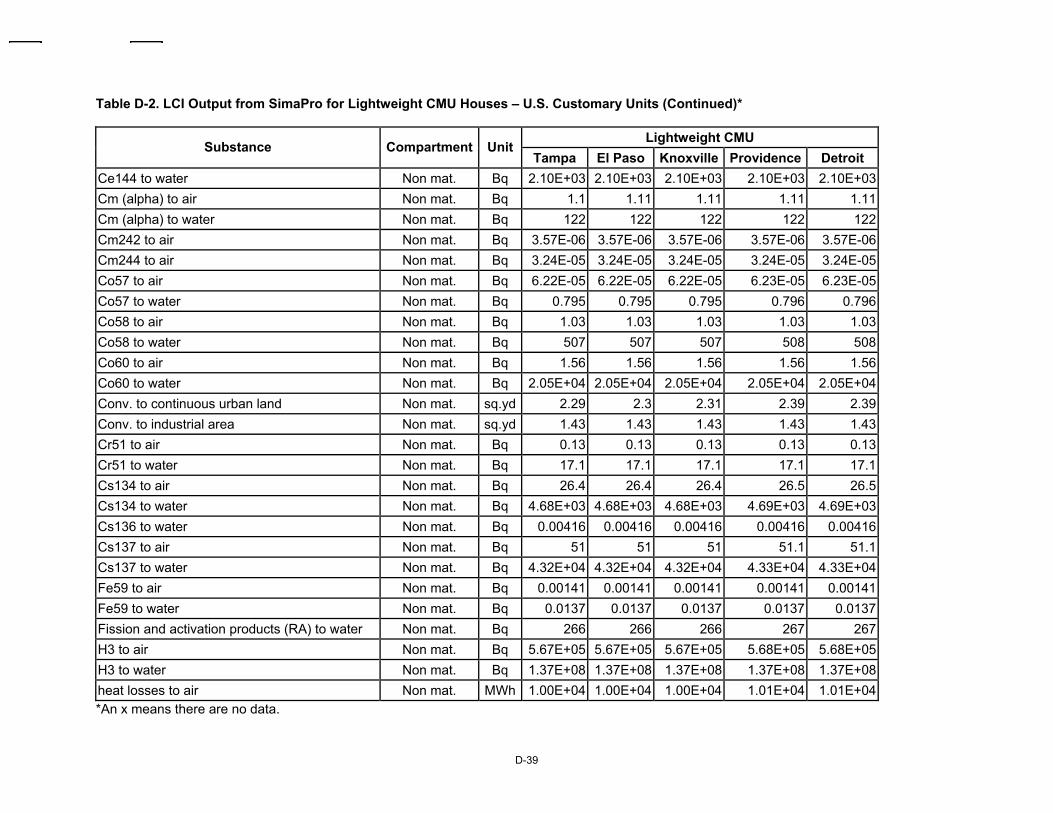
D-39
Table D-2. LCI Output from SimaPro for Lightweight CMU Houses – U.S. Customary Units (Continued)*
Lightweight CMU Substance Compartment Unit
Tampa El Paso Knoxville Providence Detroit Ce144 to water Non mat. Bq 2.10E+03 2.10E+03 2.10E+03 2.10E+03 2.10E+03Cm (alpha) to air Non mat. Bq 1.1 1.11 1.11 1.11 1.11Cm (alpha) to water Non mat. Bq 122 122 122 122 122Cm242 to air Non mat. Bq 3.57E-06 3.57E-06 3.57E-06 3.57E-06 3.57E-06Cm244 to air Non mat. Bq 3.24E-05 3.24E-05 3.24E-05 3.24E-05 3.24E-05Co57 to air Non mat. Bq 6.22E-05 6.22E-05 6.22E-05 6.23E-05 6.23E-05Co57 to water Non mat. Bq 0.795 0.795 0.795 0.796 0.796Co58 to air Non mat. Bq 1.03 1.03 1.03 1.03 1.03Co58 to water Non mat. Bq 507 507 507 508 508Co60 to air Non mat. Bq 1.56 1.56 1.56 1.56 1.56Co60 to water Non mat. Bq 2.05E+04 2.05E+04 2.05E+04 2.05E+04 2.05E+04Conv. to continuous urban land Non mat. sq.yd 2.29 2.3 2.31 2.39 2.39Conv. to industrial area Non mat. sq.yd 1.43 1.43 1.43 1.43 1.43Cr51 to air Non mat. Bq 0.13 0.13 0.13 0.13 0.13Cr51 to water Non mat. Bq 17.1 17.1 17.1 17.1 17.1Cs134 to air Non mat. Bq 26.4 26.4 26.4 26.5 26.5Cs134 to water Non mat. Bq 4.68E+03 4.68E+03 4.68E+03 4.69E+03 4.69E+03Cs136 to water Non mat. Bq 0.00416 0.00416 0.00416 0.00416 0.00416Cs137 to air Non mat. Bq 51 51 51 51.1 51.1Cs137 to water Non mat. Bq 4.32E+04 4.32E+04 4.32E+04 4.33E+04 4.33E+04Fe59 to air Non mat. Bq 0.00141 0.00141 0.00141 0.00141 0.00141Fe59 to water Non mat. Bq 0.0137 0.0137 0.0137 0.0137 0.0137Fission and activation products (RA) to water Non mat. Bq 266 266 266 267 267H3 to air Non mat. Bq 5.67E+05 5.67E+05 5.67E+05 5.68E+05 5.68E+05H3 to water Non mat. Bq 1.37E+08 1.37E+08 1.37E+08 1.37E+08 1.37E+08heat losses to air Non mat. MWh 1.00E+04 1.00E+04 1.00E+04 1.01E+04 1.01E+04*An x means there are no data.
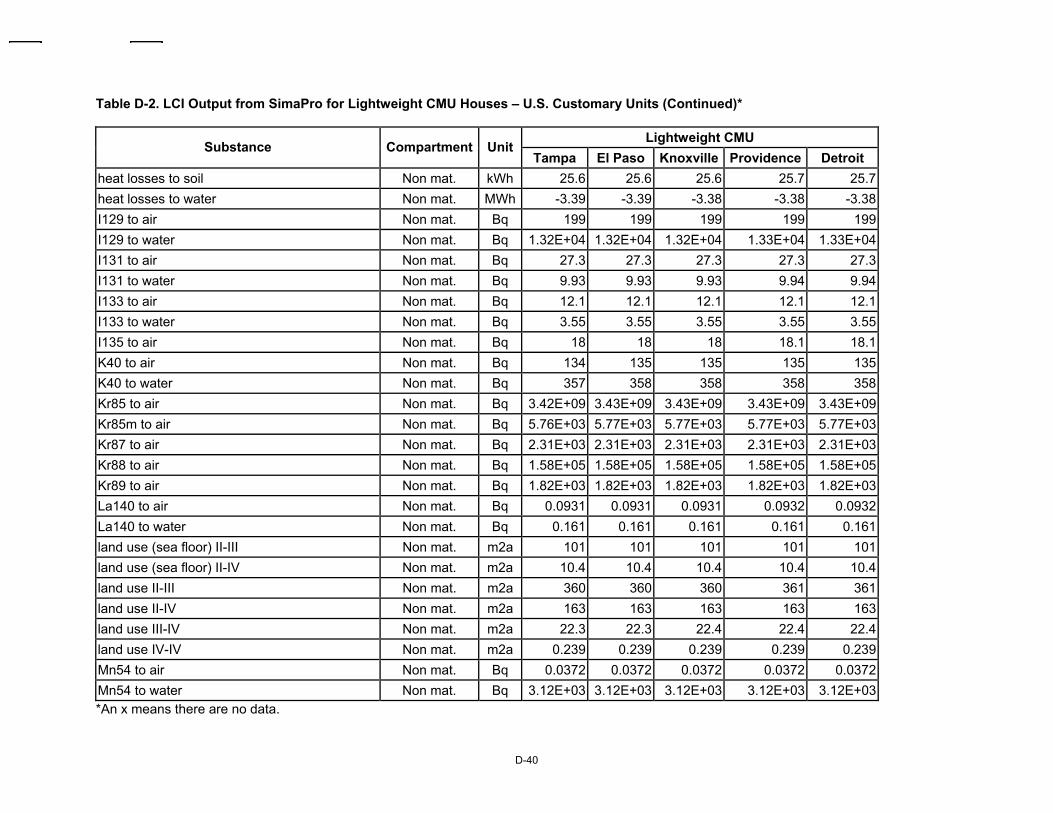
D-40
Table D-2. LCI Output from SimaPro for Lightweight CMU Houses – U.S. Customary Units (Continued)*
Lightweight CMU Substance Compartment Unit
Tampa El Paso Knoxville Providence Detroit heat losses to soil Non mat. kWh 25.6 25.6 25.6 25.7 25.7heat losses to water Non mat. MWh -3.39 -3.39 -3.38 -3.38 -3.38I129 to air Non mat. Bq 199 199 199 199 199I129 to water Non mat. Bq 1.32E+04 1.32E+04 1.32E+04 1.33E+04 1.33E+04I131 to air Non mat. Bq 27.3 27.3 27.3 27.3 27.3I131 to water Non mat. Bq 9.93 9.93 9.93 9.94 9.94I133 to air Non mat. Bq 12.1 12.1 12.1 12.1 12.1I133 to water Non mat. Bq 3.55 3.55 3.55 3.55 3.55I135 to air Non mat. Bq 18 18 18 18.1 18.1K40 to air Non mat. Bq 134 135 135 135 135K40 to water Non mat. Bq 357 358 358 358 358Kr85 to air Non mat. Bq 3.42E+09 3.43E+09 3.43E+09 3.43E+09 3.43E+09Kr85m to air Non mat. Bq 5.76E+03 5.77E+03 5.77E+03 5.77E+03 5.77E+03Kr87 to air Non mat. Bq 2.31E+03 2.31E+03 2.31E+03 2.31E+03 2.31E+03Kr88 to air Non mat. Bq 1.58E+05 1.58E+05 1.58E+05 1.58E+05 1.58E+05Kr89 to air Non mat. Bq 1.82E+03 1.82E+03 1.82E+03 1.82E+03 1.82E+03La140 to air Non mat. Bq 0.0931 0.0931 0.0931 0.0932 0.0932La140 to water Non mat. Bq 0.161 0.161 0.161 0.161 0.161land use (sea floor) II-III Non mat. m2a 101 101 101 101 101land use (sea floor) II-IV Non mat. m2a 10.4 10.4 10.4 10.4 10.4land use II-III Non mat. m2a 360 360 360 361 361land use II-IV Non mat. m2a 163 163 163 163 163land use III-IV Non mat. m2a 22.3 22.3 22.4 22.4 22.4land use IV-IV Non mat. m2a 0.239 0.239 0.239 0.239 0.239Mn54 to air Non mat. Bq 0.0372 0.0372 0.0372 0.0372 0.0372Mn54 to water Non mat. Bq 3.12E+03 3.12E+03 3.12E+03 3.12E+03 3.12E+03*An x means there are no data.
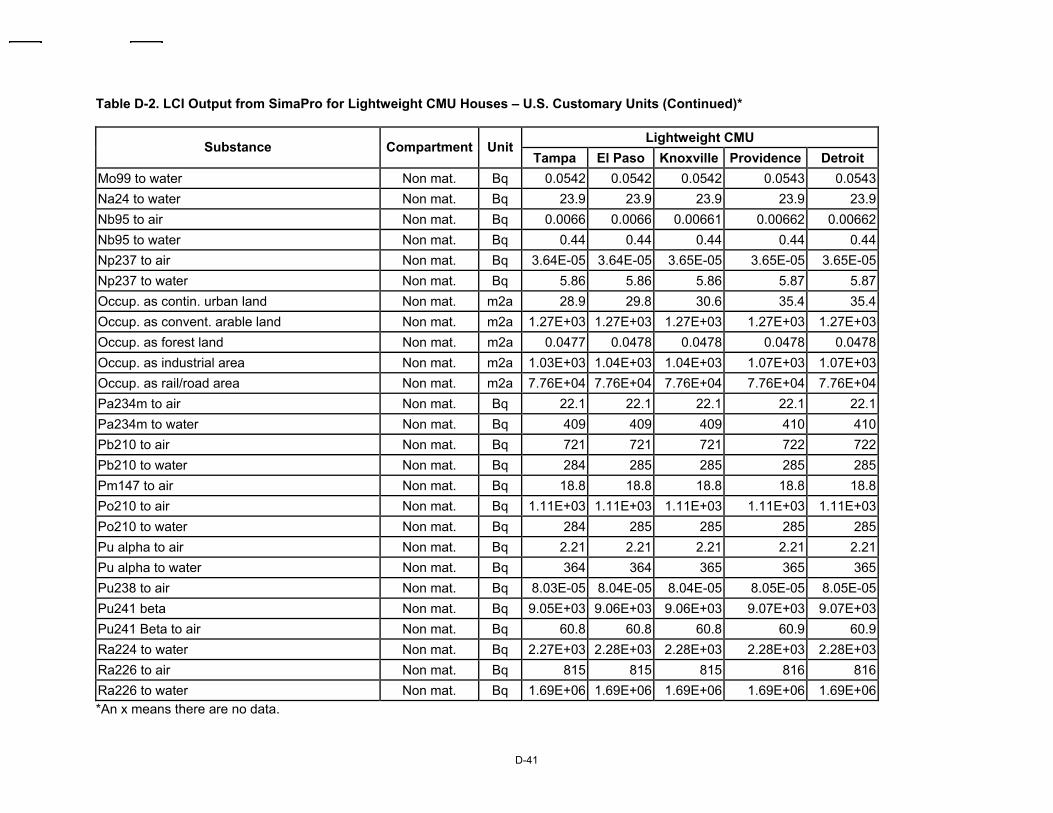
D-41
Table D-2. LCI Output from SimaPro for Lightweight CMU Houses – U.S. Customary Units (Continued)*
Lightweight CMU Substance Compartment Unit
Tampa El Paso Knoxville Providence Detroit Mo99 to water Non mat. Bq 0.0542 0.0542 0.0542 0.0543 0.0543Na24 to water Non mat. Bq 23.9 23.9 23.9 23.9 23.9Nb95 to air Non mat. Bq 0.0066 0.0066 0.00661 0.00662 0.00662Nb95 to water Non mat. Bq 0.44 0.44 0.44 0.44 0.44Np237 to air Non mat. Bq 3.64E-05 3.64E-05 3.65E-05 3.65E-05 3.65E-05Np237 to water Non mat. Bq 5.86 5.86 5.86 5.87 5.87Occup. as contin. urban land Non mat. m2a 28.9 29.8 30.6 35.4 35.4Occup. as convent. arable land Non mat. m2a 1.27E+03 1.27E+03 1.27E+03 1.27E+03 1.27E+03Occup. as forest land Non mat. m2a 0.0477 0.0478 0.0478 0.0478 0.0478Occup. as industrial area Non mat. m2a 1.03E+03 1.04E+03 1.04E+03 1.07E+03 1.07E+03Occup. as rail/road area Non mat. m2a 7.76E+04 7.76E+04 7.76E+04 7.76E+04 7.76E+04Pa234m to air Non mat. Bq 22.1 22.1 22.1 22.1 22.1Pa234m to water Non mat. Bq 409 409 409 410 410Pb210 to air Non mat. Bq 721 721 721 722 722Pb210 to water Non mat. Bq 284 285 285 285 285Pm147 to air Non mat. Bq 18.8 18.8 18.8 18.8 18.8Po210 to air Non mat. Bq 1.11E+03 1.11E+03 1.11E+03 1.11E+03 1.11E+03Po210 to water Non mat. Bq 284 285 285 285 285Pu alpha to air Non mat. Bq 2.21 2.21 2.21 2.21 2.21Pu alpha to water Non mat. Bq 364 364 365 365 365Pu238 to air Non mat. Bq 8.03E-05 8.04E-05 8.04E-05 8.05E-05 8.05E-05Pu241 beta Non mat. Bq 9.05E+03 9.06E+03 9.06E+03 9.07E+03 9.07E+03Pu241 Beta to air Non mat. Bq 60.8 60.8 60.8 60.9 60.9Ra224 to water Non mat. Bq 2.27E+03 2.28E+03 2.28E+03 2.28E+03 2.28E+03Ra226 to air Non mat. Bq 815 815 815 816 816Ra226 to water Non mat. Bq 1.69E+06 1.69E+06 1.69E+06 1.69E+06 1.69E+06*An x means there are no data.
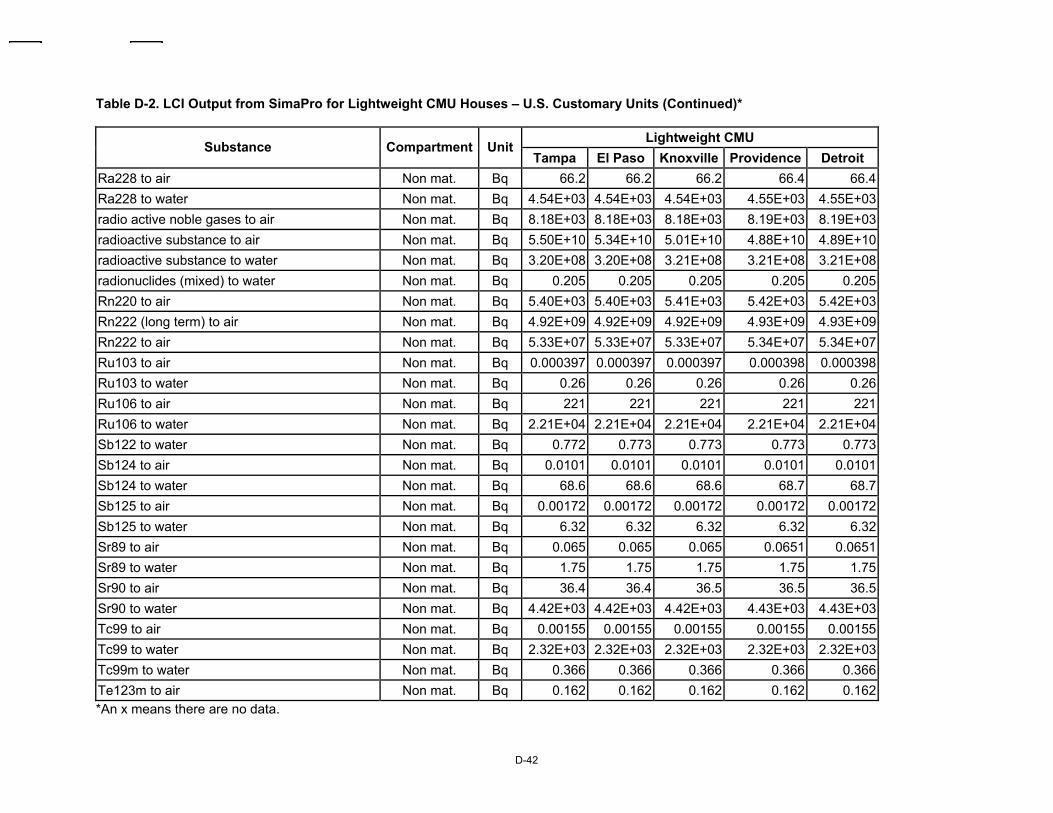
D-42
Table D-2. LCI Output from SimaPro for Lightweight CMU Houses – U.S. Customary Units (Continued)*
Lightweight CMU Substance Compartment Unit
Tampa El Paso Knoxville Providence Detroit Ra228 to air Non mat. Bq 66.2 66.2 66.2 66.4 66.4Ra228 to water Non mat. Bq 4.54E+03 4.54E+03 4.54E+03 4.55E+03 4.55E+03radio active noble gases to air Non mat. Bq 8.18E+03 8.18E+03 8.18E+03 8.19E+03 8.19E+03radioactive substance to air Non mat. Bq 5.50E+10 5.34E+10 5.01E+10 4.88E+10 4.89E+10radioactive substance to water Non mat. Bq 3.20E+08 3.20E+08 3.21E+08 3.21E+08 3.21E+08radionuclides (mixed) to water Non mat. Bq 0.205 0.205 0.205 0.205 0.205Rn220 to air Non mat. Bq 5.40E+03 5.40E+03 5.41E+03 5.42E+03 5.42E+03Rn222 (long term) to air Non mat. Bq 4.92E+09 4.92E+09 4.92E+09 4.93E+09 4.93E+09Rn222 to air Non mat. Bq 5.33E+07 5.33E+07 5.33E+07 5.34E+07 5.34E+07Ru103 to air Non mat. Bq 0.000397 0.000397 0.000397 0.000398 0.000398Ru103 to water Non mat. Bq 0.26 0.26 0.26 0.26 0.26Ru106 to air Non mat. Bq 221 221 221 221 221Ru106 to water Non mat. Bq 2.21E+04 2.21E+04 2.21E+04 2.21E+04 2.21E+04Sb122 to water Non mat. Bq 0.772 0.773 0.773 0.773 0.773Sb124 to air Non mat. Bq 0.0101 0.0101 0.0101 0.0101 0.0101Sb124 to water Non mat. Bq 68.6 68.6 68.6 68.7 68.7Sb125 to air Non mat. Bq 0.00172 0.00172 0.00172 0.00172 0.00172Sb125 to water Non mat. Bq 6.32 6.32 6.32 6.32 6.32Sr89 to air Non mat. Bq 0.065 0.065 0.065 0.0651 0.0651Sr89 to water Non mat. Bq 1.75 1.75 1.75 1.75 1.75Sr90 to air Non mat. Bq 36.4 36.4 36.5 36.5 36.5Sr90 to water Non mat. Bq 4.42E+03 4.42E+03 4.42E+03 4.43E+03 4.43E+03Tc99 to air Non mat. Bq 0.00155 0.00155 0.00155 0.00155 0.00155Tc99 to water Non mat. Bq 2.32E+03 2.32E+03 2.32E+03 2.32E+03 2.32E+03Tc99m to water Non mat. Bq 0.366 0.366 0.366 0.366 0.366Te123m to air Non mat. Bq 0.162 0.162 0.162 0.162 0.162*An x means there are no data.
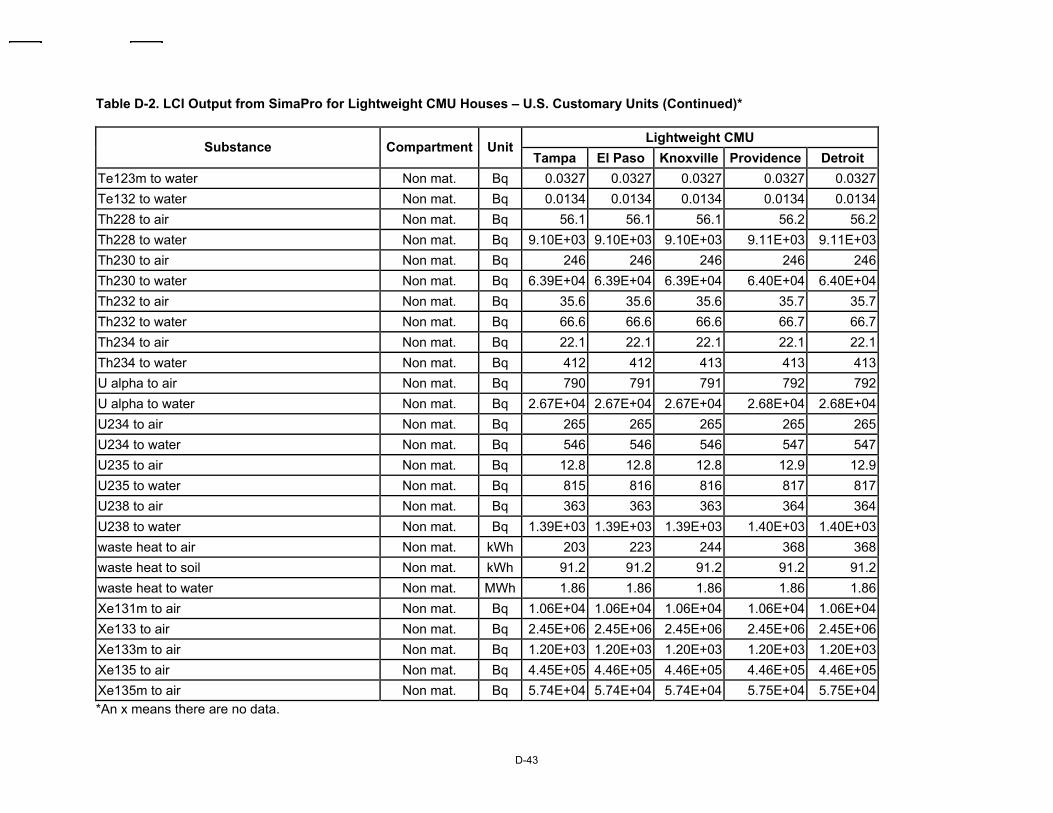
D-43
Table D-2. LCI Output from SimaPro for Lightweight CMU Houses – U.S. Customary Units (Continued)*
Lightweight CMU Substance Compartment Unit
Tampa El Paso Knoxville Providence Detroit Te123m to water Non mat. Bq 0.0327 0.0327 0.0327 0.0327 0.0327Te132 to water Non mat. Bq 0.0134 0.0134 0.0134 0.0134 0.0134Th228 to air Non mat. Bq 56.1 56.1 56.1 56.2 56.2Th228 to water Non mat. Bq 9.10E+03 9.10E+03 9.10E+03 9.11E+03 9.11E+03Th230 to air Non mat. Bq 246 246 246 246 246Th230 to water Non mat. Bq 6.39E+04 6.39E+04 6.39E+04 6.40E+04 6.40E+04Th232 to air Non mat. Bq 35.6 35.6 35.6 35.7 35.7Th232 to water Non mat. Bq 66.6 66.6 66.6 66.7 66.7Th234 to air Non mat. Bq 22.1 22.1 22.1 22.1 22.1Th234 to water Non mat. Bq 412 412 413 413 413U alpha to air Non mat. Bq 790 791 791 792 792U alpha to water Non mat. Bq 2.67E+04 2.67E+04 2.67E+04 2.68E+04 2.68E+04U234 to air Non mat. Bq 265 265 265 265 265U234 to water Non mat. Bq 546 546 546 547 547U235 to air Non mat. Bq 12.8 12.8 12.8 12.9 12.9U235 to water Non mat. Bq 815 816 816 817 817U238 to air Non mat. Bq 363 363 363 364 364U238 to water Non mat. Bq 1.39E+03 1.39E+03 1.39E+03 1.40E+03 1.40E+03waste heat to air Non mat. kWh 203 223 244 368 368waste heat to soil Non mat. kWh 91.2 91.2 91.2 91.2 91.2waste heat to water Non mat. MWh 1.86 1.86 1.86 1.86 1.86Xe131m to air Non mat. Bq 1.06E+04 1.06E+04 1.06E+04 1.06E+04 1.06E+04Xe133 to air Non mat. Bq 2.45E+06 2.45E+06 2.45E+06 2.45E+06 2.45E+06Xe133m to air Non mat. Bq 1.20E+03 1.20E+03 1.20E+03 1.20E+03 1.20E+03Xe135 to air Non mat. Bq 4.45E+05 4.46E+05 4.46E+05 4.46E+05 4.46E+05Xe135m to air Non mat. Bq 5.74E+04 5.74E+04 5.74E+04 5.75E+04 5.75E+04*An x means there are no data.
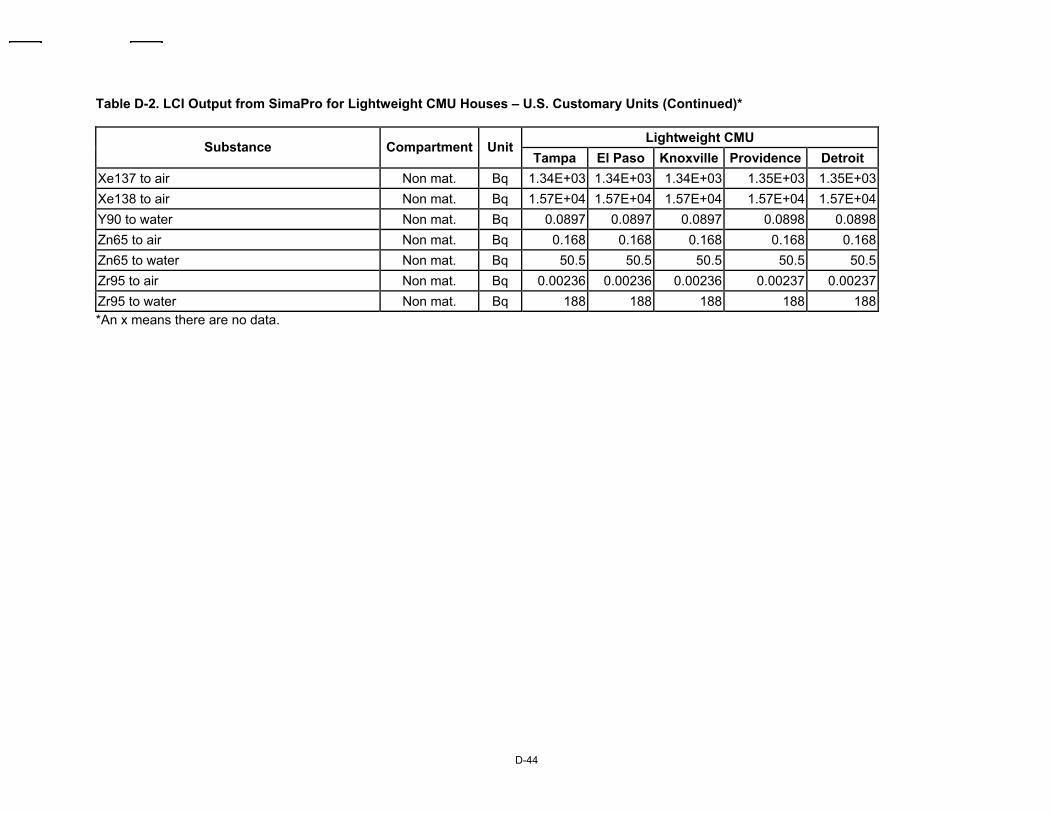
D-44
Table D-2. LCI Output from SimaPro for Lightweight CMU Houses – U.S. Customary Units (Continued)*
Lightweight CMU Substance Compartment Unit
Tampa El Paso Knoxville Providence Detroit Xe137 to air Non mat. Bq 1.34E+03 1.34E+03 1.34E+03 1.35E+03 1.35E+03Xe138 to air Non mat. Bq 1.57E+04 1.57E+04 1.57E+04 1.57E+04 1.57E+04Y90 to water Non mat. Bq 0.0897 0.0897 0.0897 0.0898 0.0898Zn65 to air Non mat. Bq 0.168 0.168 0.168 0.168 0.168Zn65 to water Non mat. Bq 50.5 50.5 50.5 50.5 50.5Zr95 to air Non mat. Bq 0.00236 0.00236 0.00236 0.00237 0.00237Zr95 to water Non mat. Bq 188 188 188 188 188*An x means there are no data.
E-1
APPENDIX E – THE ECO-INDICATOR IMPACT ASSESSMENT METHOD (used with permission)
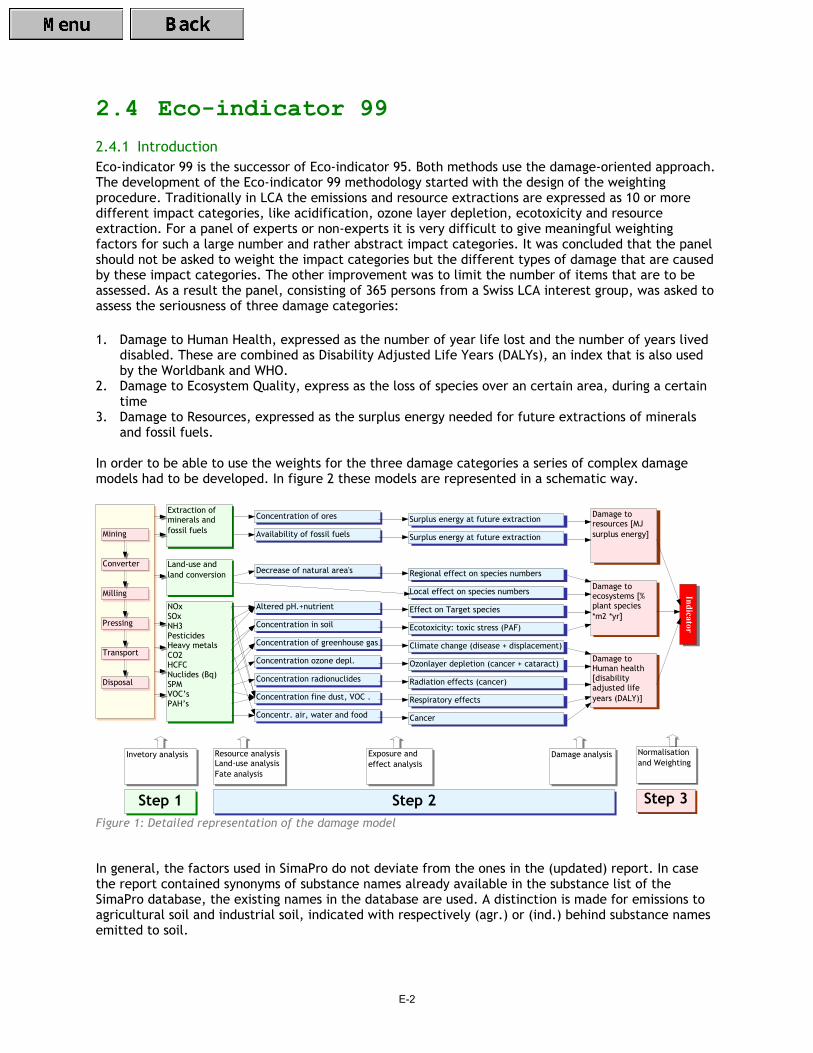
E-2
2.4 Eco-indicator 99 2.4.1 Introduction Eco-indicator 99 is the successor of Eco-indicator 95. Both methods use the damage-oriented approach. The development of the Eco-indicator 99 methodology started with the design of the weighting procedure. Traditionally in LCA the emissions and resource extractions are expressed as 10 or more different impact categories, like acidification, ozone layer depletion, ecotoxicity and resource extraction. For a panel of experts or non-experts it is very difficult to give meaningful weighting factors for such a large number and rather abstract impact categories. It was concluded that the panel should not be asked to weight the impact categories but the different types of damage that are caused by these impact categories. The other improvement was to limit the number of items that are to be assessed. As a result the panel, consisting of 365 persons from a Swiss LCA interest group, was asked to assess the seriousness of three damage categories: 1. Damage to Human Health, expressed as the number of year life lost and the number of years lived
disabled. These are combined as Disability Adjusted Life Years (DALYs), an index that is also used by the Worldbank and WHO.
2. Damage to Ecosystem Quality, express as the loss of species over an certain area, during a certain time
3. Damage to Resources, expressed as the surplus energy needed for future extractions of minerals and fossil fuels.
In order to be able to use the weights for the three damage categories a series of complex damage models had to be developed. In figure 2 these models are represented in a schematic way.
Indicator
Damage toresources [MJsurplus energy]
Damage toecosystems [%plant species*m2 *yr]
Damage toHuman health[disabilityadjusted lifeyears (DALY)]
Regional effect on species numbers
Local effect on species numbers
Effect on Target species
Ecotoxicity: toxic stress (PAF)
Climate change (disease + displacement)
Ozonlayer depletion (cancer + cataract)
Radiation effects (cancer)
Respiratory effects
Cancer
Surplus energy at future extraction
Surplus energy at future extraction
Concentration of ores
Availability of fossil fuels
Decrease of natural area's
Altered pH.+nutrient
Concentration in soil
Concentration of greenhouse gas
Concentration ozone depl.
Concentration radionuclides
Concentration fine dust, VOC .
Concentr. air, water and food
NOxSOxNH3PesticidesHeavy metalsCO2HCFCNuclides (Bq)SPMVOC’sPAH’s
Resource analysisLand-use analysisFate analysis
Exposure andeffect analysis
Damage analysis Normalisationand Weighting
Land-use andland conversion
Extraction ofminerals andfossil fuels
Step 1 Step 2 Step 3
Invetory analysis
Mining
Converter
Milling
Pressing
Transport
Disposal
Figure 1: Detailed representation of the damage model In general, the factors used in SimaPro do not deviate from the ones in the (updated) report. In case the report contained synonyms of substance names already available in the substance list of the SimaPro database, the existing names in the database are used. A distinction is made for emissions to agricultural soil and industrial soil, indicated with respectively (agr.) or (ind.) behind substance names emitted to soil.
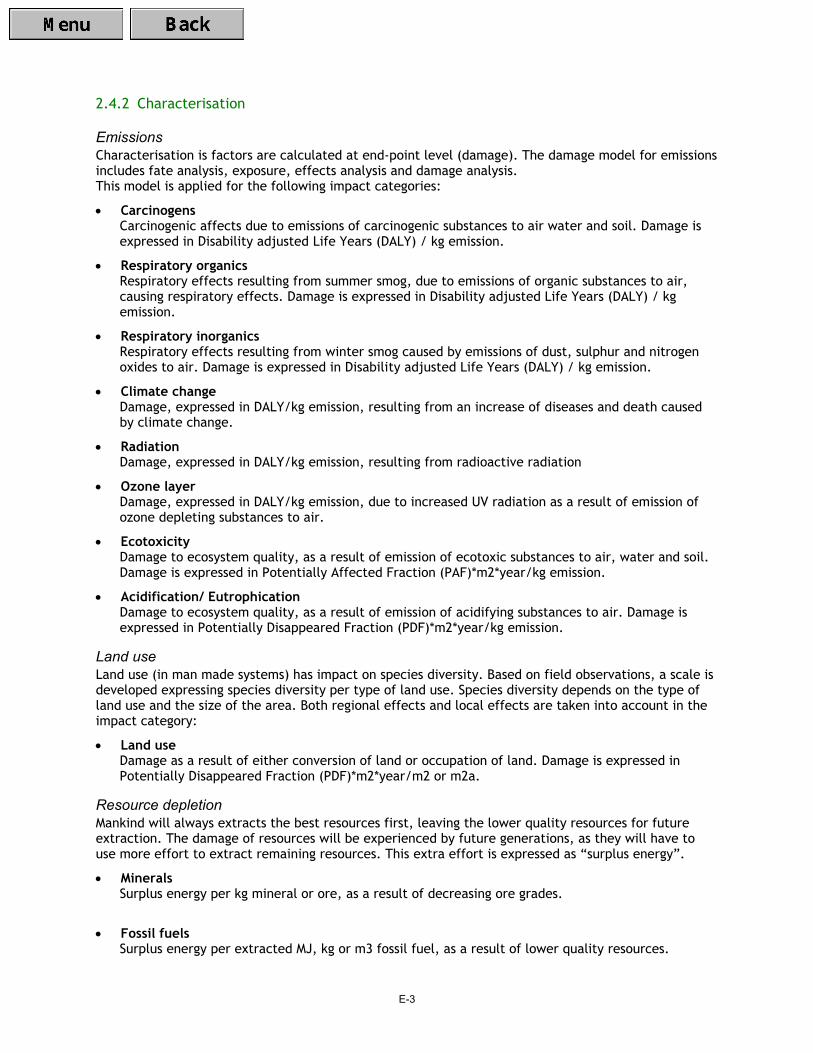
E-3
2.4.2 Characterisation
Emissions Characterisation is factors are calculated at end-point level (damage). The damage model for emissions includes fate analysis, exposure, effects analysis and damage analysis. This model is applied for the following impact categories:
• Carcinogens Carcinogenic affects due to emissions of carcinogenic substances to air water and soil. Damage is expressed in Disability adjusted Life Years (DALY) / kg emission.
• Respiratory organics Respiratory effects resulting from summer smog, due to emissions of organic substances to air, causing respiratory effects. Damage is expressed in Disability adjusted Life Years (DALY) / kg emission.
• Respiratory inorganics Respiratory effects resulting from winter smog caused by emissions of dust, sulphur and nitrogen oxides to air. Damage is expressed in Disability adjusted Life Years (DALY) / kg emission.
• Climate change Damage, expressed in DALY/kg emission, resulting from an increase of diseases and death caused by climate change.
• Radiation Damage, expressed in DALY/kg emission, resulting from radioactive radiation
• Ozone layer Damage, expressed in DALY/kg emission, due to increased UV radiation as a result of emission of ozone depleting substances to air.
• Ecotoxicity Damage to ecosystem quality, as a result of emission of ecotoxic substances to air, water and soil. Damage is expressed in Potentially Affected Fraction (PAF)*m2*year/kg emission.
• Acidification/ Eutrophication Damage to ecosystem quality, as a result of emission of acidifying substances to air. Damage is expressed in Potentially Disappeared Fraction (PDF)*m2*year/kg emission.
Land use Land use (in man made systems) has impact on species diversity. Based on field observations, a scale is developed expressing species diversity per type of land use. Species diversity depends on the type of land use and the size of the area. Both regional effects and local effects are taken into account in the impact category:
• Land use Damage as a result of either conversion of land or occupation of land. Damage is expressed in Potentially Disappeared Fraction (PDF)*m2*year/m2 or m2a.
Resource depletion Mankind will always extracts the best resources first, leaving the lower quality resources for future extraction. The damage of resources will be experienced by future generations, as they will have to use more effort to extract remaining resources. This extra effort is expressed as “surplus energy”.
• Minerals Surplus energy per kg mineral or ore, as a result of decreasing ore grades.
• Fossil fuels Surplus energy per extracted MJ, kg or m3 fossil fuel, as a result of lower quality resources.
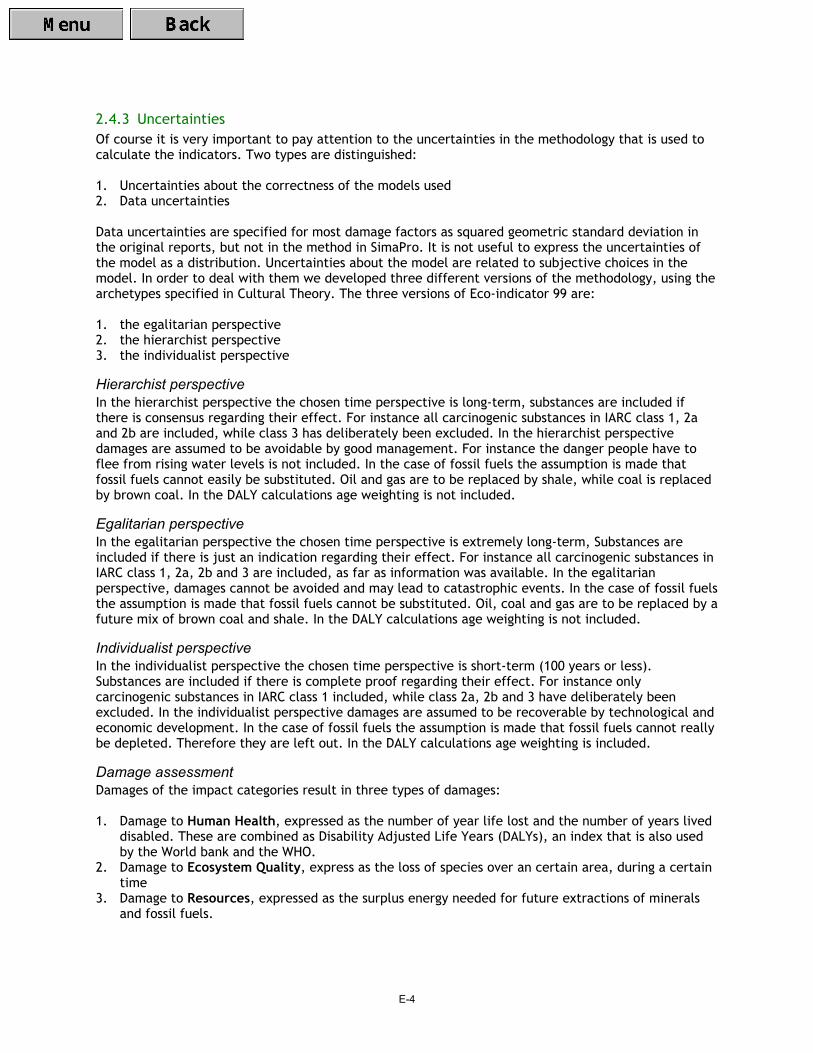
E-4
2.4.3 Uncertainties Of course it is very important to pay attention to the uncertainties in the methodology that is used to calculate the indicators. Two types are distinguished: 1. Uncertainties about the correctness of the models used 2. Data uncertainties Data uncertainties are specified for most damage factors as squared geometric standard deviation in the original reports, but not in the method in SimaPro. It is not useful to express the uncertainties of the model as a distribution. Uncertainties about the model are related to subjective choices in the model. In order to deal with them we developed three different versions of the methodology, using the archetypes specified in Cultural Theory. The three versions of Eco-indicator 99 are: 1. the egalitarian perspective 2. the hierarchist perspective 3. the individualist perspective
Hierarchist perspective In the hierarchist perspective the chosen time perspective is long-term, substances are included if there is consensus regarding their effect. For instance all carcinogenic substances in IARC class 1, 2a and 2b are included, while class 3 has deliberately been excluded. In the hierarchist perspective damages are assumed to be avoidable by good management. For instance the danger people have to flee from rising water levels is not included. In the case of fossil fuels the assumption is made that fossil fuels cannot easily be substituted. Oil and gas are to be replaced by shale, while coal is replaced by brown coal. In the DALY calculations age weighting is not included.
Egalitarian perspective In the egalitarian perspective the chosen time perspective is extremely long-term, Substances are included if there is just an indication regarding their effect. For instance all carcinogenic substances in IARC class 1, 2a, 2b and 3 are included, as far as information was available. In the egalitarian perspective, damages cannot be avoided and may lead to catastrophic events. In the case of fossil fuels the assumption is made that fossil fuels cannot be substituted. Oil, coal and gas are to be replaced by a future mix of brown coal and shale. In the DALY calculations age weighting is not included.
Individualist perspective In the individualist perspective the chosen time perspective is short-term (100 years or less). Substances are included if there is complete proof regarding their effect. For instance only carcinogenic substances in IARC class 1 included, while class 2a, 2b and 3 have deliberately been excluded. In the individualist perspective damages are assumed to be recoverable by technological and economic development. In the case of fossil fuels the assumption is made that fossil fuels cannot really be depleted. Therefore they are left out. In the DALY calculations age weighting is included.
Damage assessment Damages of the impact categories result in three types of damages: 1. Damage to Human Health, expressed as the number of year life lost and the number of years lived
disabled. These are combined as Disability Adjusted Life Years (DALYs), an index that is also used by the World bank and the WHO.
2. Damage to Ecosystem Quality, express as the loss of species over an certain area, during a certain time
3. Damage to Resources, expressed as the surplus energy needed for future extractions of minerals and fossil fuels.
E-5
2.4.4 Normalisation Normalisation is performed on damage category level. Normalisation data is calculated on European level, mostly based on 1993 as base years, with some updates for the most important emissions. 2.4.5 Weighting In this method weighting is performed at damage category level (endpoint level in ISO). A panel performed weighting of the three damage categories. For each perspective, a specific weighting set is available. The average result of the panel assessment is available as weighting set. 2.4.6 Default The hierarchist version of Eco-indicator 99 with average weighting is chosen default. In general value choices made in the hierarchist version are scientifically and politically accepted.

F-1
APPENDIX F – THE EDIP/UMIP 96 IMPACT ASSESSMENT METHOD (used with permission)
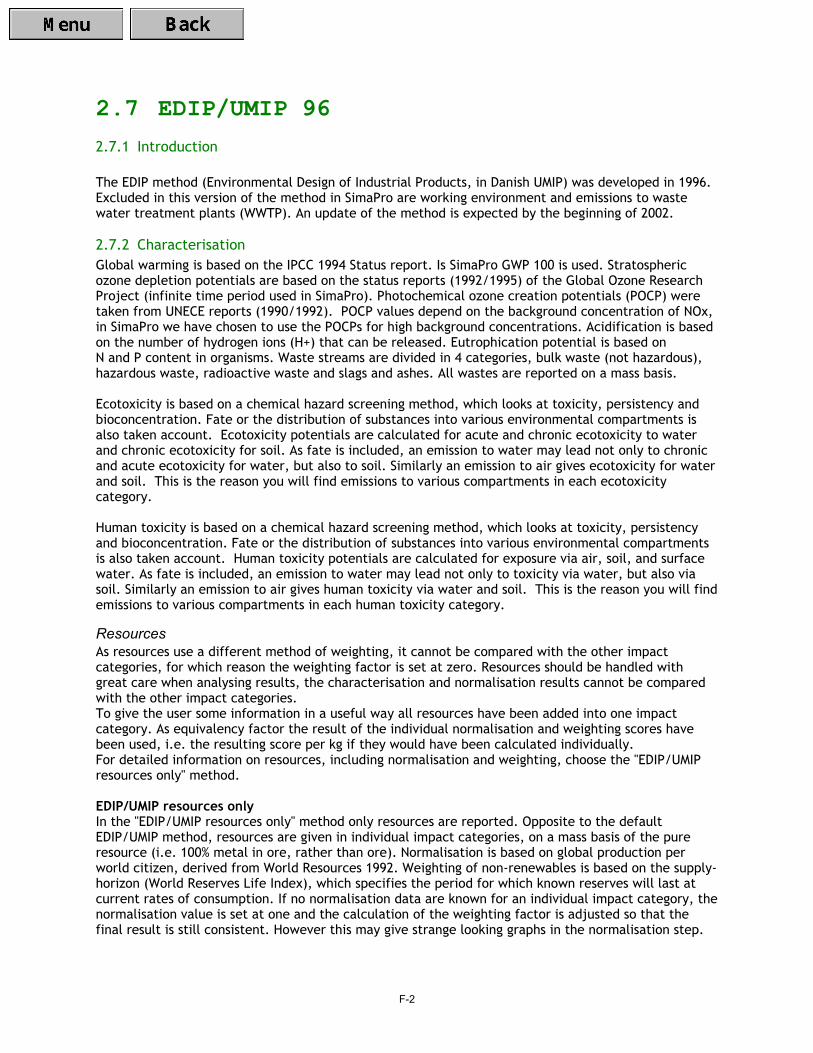
F-2
2.7 EDIP/UMIP 96 2.7.1 Introduction The EDIP method (Environmental Design of Industrial Products, in Danish UMIP) was developed in 1996. Excluded in this version of the method in SimaPro are working environment and emissions to waste water treatment plants (WWTP). An update of the method is expected by the beginning of 2002. 2.7.2 Characterisation Global warming is based on the IPCC 1994 Status report. Is SimaPro GWP 100 is used. Stratospheric ozone depletion potentials are based on the status reports (1992/1995) of the Global Ozone Research Project (infinite time period used in SimaPro). Photochemical ozone creation potentials (POCP) were taken from UNECE reports (1990/1992). POCP values depend on the background concentration of NOx, in SimaPro we have chosen to use the POCPs for high background concentrations. Acidification is based on the number of hydrogen ions (H+) that can be released. Eutrophication potential is based on N and P content in organisms. Waste streams are divided in 4 categories, bulk waste (not hazardous), hazardous waste, radioactive waste and slags and ashes. All wastes are reported on a mass basis. Ecotoxicity is based on a chemical hazard screening method, which looks at toxicity, persistency and bioconcentration. Fate or the distribution of substances into various environmental compartments is also taken account. Ecotoxicity potentials are calculated for acute and chronic ecotoxicity to water and chronic ecotoxicity for soil. As fate is included, an emission to water may lead not only to chronic and acute ecotoxicity for water, but also to soil. Similarly an emission to air gives ecotoxicity for water and soil. This is the reason you will find emissions to various compartments in each ecotoxicity category. Human toxicity is based on a chemical hazard screening method, which looks at toxicity, persistency and bioconcentration. Fate or the distribution of substances into various environmental compartments is also taken account. Human toxicity potentials are calculated for exposure via air, soil, and surface water. As fate is included, an emission to water may lead not only to toxicity via water, but also via soil. Similarly an emission to air gives human toxicity via water and soil. This is the reason you will find emissions to various compartments in each human toxicity category.
Resources As resources use a different method of weighting, it cannot be compared with the other impact categories, for which reason the weighting factor is set at zero. Resources should be handled with great care when analysing results, the characterisation and normalisation results cannot be compared with the other impact categories. To give the user some information in a useful way all resources have been added into one impact category. As equivalency factor the result of the individual normalisation and weighting scores have been used, i.e. the resulting score per kg if they would have been calculated individually. For detailed information on resources, including normalisation and weighting, choose the "EDIP/UMIP resources only" method. EDIP/UMIP resources only In the "EDIP/UMIP resources only" method only resources are reported. Opposite to the default EDIP/UMIP method, resources are given in individual impact categories, on a mass basis of the pure resource (i.e. 100% metal in ore, rather than ore). Normalisation is based on global production per world citizen, derived from World Resources 1992. Weighting of non-renewables is based on the supply-horizon (World Reserves Life Index), which specifies the period for which known reserves will last at current rates of consumption. If no normalisation data are known for an individual impact category, the normalisation value is set at one and the calculation of the weighting factor is adjusted so that the final result is still consistent. However this may give strange looking graphs in the normalisation step.
F-3
2.7.3 Normalisation The normalisation value is based on person equivalents for 1990. For resources, normalisation and weighing are already included in the characterisation factor and therefore set at zero. 2.7.4 Weighting The weighting factors are set to the politically set target emissions per person in the year 2000, the weighted result are expressed except for resources which is based on the proven reserves per person in 1990. For resources, normalisation and weighing are already included in the characterisation factor and therefore set at zero. A note on weighting: Presenting the EDIP method as a single score (addition) is allowed, however it is not recommended by the authors. Note that due to a different weighting method for resources (based on reserves rather than political targets), resources may never be included in a single score. This is the reason that the weighting factor for resources is set at zero. 2.7.5 References: For background information, and information on how to calculate additional factors, please read: Environmental Assessment of Products. Volume 1 (methodology, tools and case studies in product development) Henrik Wenzel, Michael Hauschild and Leo Alting Chapman and Hall, 1997, ISBN 0 412 80800 5 See http://www.wkap.nl/book.htm/0-7923-7859-8 Environmental Assessment of Products. Volume 2 (scientific background) Michael Hauschild and Henrik Wenzel Chapman and Hall, 1998, ISBN 0 412 80810 2 See http://www.wkap.nl/book.htm/0-412-80810-2

G-1
APPENDIX G – THE EPS 2000 IMPACT ASSESSMENT METHOD (used with permission)
G-2
2.6 EPS 2000 default 2.6.1 Introduction The EPS 2000 default methodology (Environmental Priority Strategies in product design) is a damage oriented method. In the EPS system willingness to pay to restore changes in the safe guard subjects is chosen as the monetary measure. The indicator unit is ELU (Environmental Load Unit). This method includes characterisation and weighting. Normalisation is not applied. The top-down development of the EPS system has led to an outspoken hierarchy among its principles and rules. The general principles of its development are: • The top-down principle (highest priority is given to the usefulness of the system); • The index principle (ready made indices represent weighted and aggregated impacts) • The default principle (an operative method as default is required) • The uncertainty principle (uncertainty of input data has to be estimated) • Choice of default data and models to determine them The EPS system is mainly aimed to be a tool for a company's internal product development process. The system is developed to assist designers and product developers in finding which one of two product concepts has the least impact on the environment. The models and data in EPS are intended to improve environmental performance of products. The choice and design of the models and data are made from an anticipated utility perspective of a product developer. They are, for instance not intended to be used as a basis for environmental protection strategies for single substances, or as a sole basis for environmental product declarations. In most of those cases additional site-specific information and modelling is necessary. The EPS 2000 default method is an update of the 1996 version. The impact categories are identified from five safe guard subjects: human health, ecosystem production capacity, abiotic stock resource, biodiversity and cultural and recreational values. 2.6.2 Classification Emissions and resources are assigned to impact categories when actual effects are likely to occur in the environment, based on likely exposure. 2.6.3 Characterisation Empirical, equivalency and mechanistic models are used to calculate default characterisation values.
Human Health In EPS weighting factors for damage to human health are included for the following indictors: • Life expectancy, expressed in Years of life lost (person year) • Severe morbidity and suffering, in person year, including starvation • Morbidity, in person year, like cold or flue • Severe nuisance, in person year, which would normally cause a reaction to avoid the nuisance • Nuisance, in person year, irritating, but not causing any direct action
Ecosystem production capacity The default impact categories of production capacity of ecosystems are: • Crop production capacity, in kg weight at harvest • Wood production capacity, in kg dry weight • Fish and meat production capacity, in kg full weight of animals • Base cat-ion capacity, in H+ mole equivalents (used only when models including the other
indicators are not available)
G-3
• Production capacity of (irrigation) water, in kg which is acceptable for irrigation, with respect to persistent toxic substances
• Production capacity of (drinking) water, in kg of water fulfilling WHO criteria on drinking water.
Abiotic stock resources Abiotic stock resource indicators are depletion of elemental or mineral reserves and depletion of fossil reserves. Some classification factors are defined 0 (zero). In SimaPro characterisation values for abiotic depletion result from both the impact of depletion and impacts due to extraction of the element/mineral or resource.
Biodiversity Default impact category for biodiversity is extinction of species, expressed in Normalised Extinction of species (NEX).
Cultural and recreational values Changes in cultural and recreational values are difficult to describe by general indicators as they are highly specific and qualitative in nature. Indicators should be defined when needed, and thus are not included in the default methodology in SimaPro. 2.6.4 Weighting In the EPS default method, weighting is made through valuation. Weighting factors represent the willingness to pay to avoid changes. The environmental reference is the present state of the environment. The indicator unit is ELU (Environmental Load Unit). 2.6.5 References: Bengt Steen (1999) A systematic approach to environmental strategies in product development (EPS). Version 2000 - General system characteristics. Centre for Environmental Assessment of Products and Material Systems. Chalmers University of Technology, Technical Environmental Planning. CPM report 1999:4. Download as PDF file (246 kb) from http://www.cpm.chalmers.se/cpm/publications/EPS2000.PDF Bengt Steen (1999) A systematic approach to environmental strategies in product development (EPS). Version 2000 - Models and data of the default methods. Centre for Environmental Assessment of Products and Material Systems. Chalmers University of Technology, Technical Environmental Planning. CPM report 1999:5. Download as zipped PDF file (1140 kb) from http://www.cpm.chalmers.se/cpm/publications/EPS1999_5.zip
H-1
APPENDIX H – LCA SUMMARY OF WOOD HOUSES AND LIGHTWEIGHT CMU HOUSES
(Output from SimaPro)
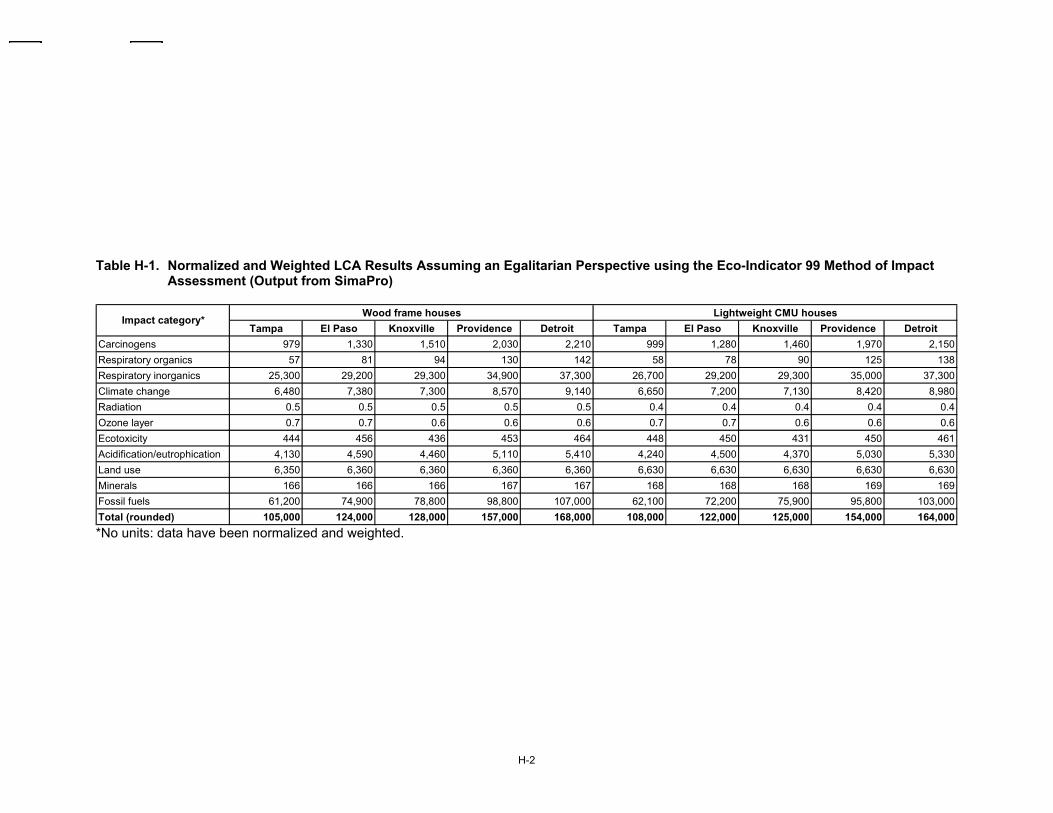
H-2
Table H-1. Normalized and Weighted LCA Results Assuming an Egalitarian Perspective using the Eco-Indicator 99 Method of Impact Assessment (Output from SimaPro)
Wood frame houses Lightweight CMU housesTampa El Paso Knoxville Providence Detroit Tampa El Paso Knoxville Providence Detroit
Carcinogens 979 1,330 1,510 2,030 2,210 999 1,280 1,460 1,970 2,150Respiratory organics 57 81 94 130 142 58 78 90 125 138Respiratory inorganics 25,300 29,200 29,300 34,900 37,300 26,700 29,200 29,300 35,000 37,300Climate change 6,480 7,380 7,300 8,570 9,140 6,650 7,200 7,130 8,420 8,980Radiation 0.5 0.5 0.5 0.5 0.5 0.4 0.4 0.4 0.4 0.4Ozone layer 0.7 0.7 0.6 0.6 0.6 0.7 0.7 0.6 0.6 0.6Ecotoxicity 444 456 436 453 464 448 450 431 450 461Acidification/eutrophication 4,130 4,590 4,460 5,110 5,410 4,240 4,500 4,370 5,030 5,330Land use 6,350 6,360 6,360 6,360 6,360 6,630 6,630 6,630 6,630 6,630Minerals 166 166 166 167 167 168 168 168 169 169Fossil fuels 61,200 74,900 78,800 98,800 107,000 62,100 72,200 75,900 95,800 103,000Total (rounded) 105,000 124,000 128,000 157,000 168,000 108,000 122,000 125,000 154,000 164,000
Impact category*
*No units: data have been normalized and weighted.

H-3
Table H-2. Normalized and Weighted LCA Results Assuming a Hierarchic Perspective using the Eco-Indicator 99 Method of Impact Assessment (Output from SimaPro)
Wood frame houses Lightweight CMU housesTampa El Paso Knoxville Providence Detroit Tampa El Paso Knoxville Providence Detroit
Carcinogens 1,310 1,780 2,030 2,720 2,970 1,340 1,720 1,960 2,640 2,880Respiratory organics 76 108 126 174 191 78 104 121 168 185Respiratory inorganics 33,800 39,000 39,200 46,700 49,900 35,700 39,000 39,200 46,800 49,900Climate change 8,700 9,900 9,800 11,500 12,300 8,930 9,660 9,570 11,300 12,000Radiation 0.7 0.7 0.7 0.7 0.7 0.6 0.6 0.6 0.6 0.6Ozone layer 1.0 1.0 0.8 0.8 0.8 1.0 0.9 0.8 0.8 0.8Ecotoxicity 355 365 349 363 371 359 360 345 360 369Acidification/eutrophication 3,310 3,680 3,570 4,090 4,330 3,400 3,600 3,500 4,030 4,270Land use 5,080 5,080 5,080 5,090 5,090 5,300 5,300 5,300 5,310 5,310Minerals 118 118 118 118 118 119 119 119 120 120Fossil fuels 44,000 61,500 71,100 97,100 106,000 44,700 59,100 68,200 93,700 103,000Total (rounded) 96,800 122,000 131,000 168,000 181,000 99,900 119,000 128,000 164,000 178,000
Impact category*
*No units: data have been normalized and weighted.
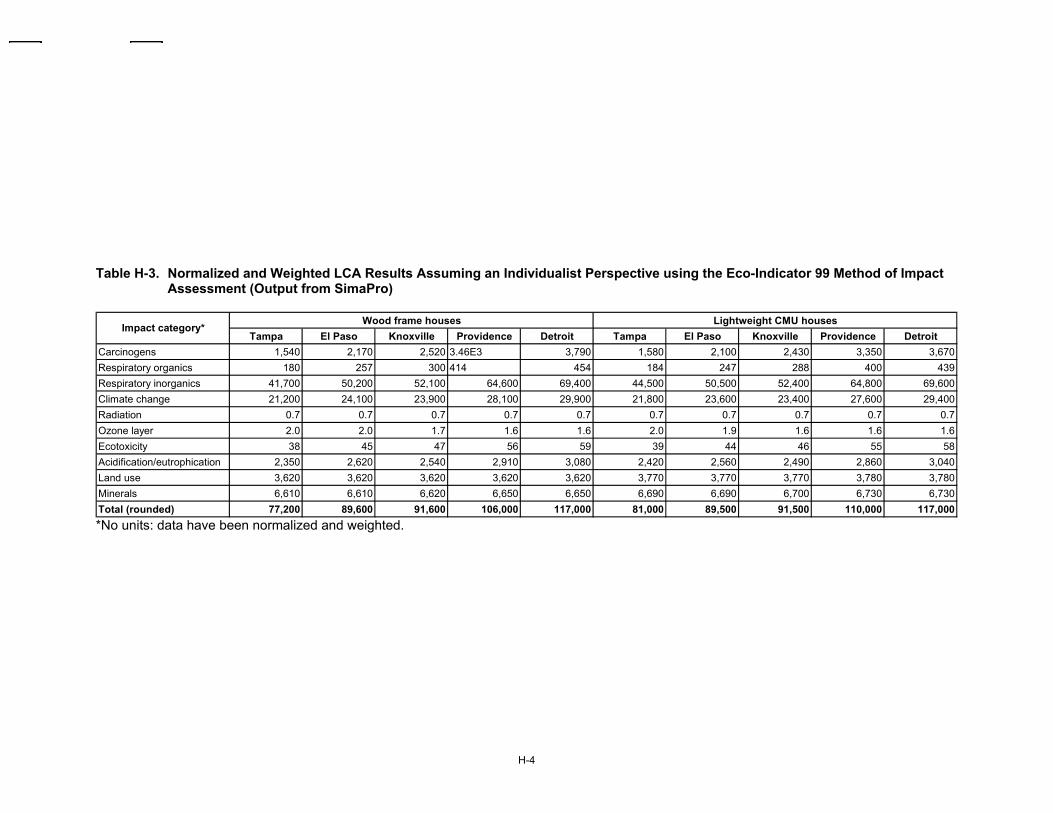
H-4
Table H-3. Normalized and Weighted LCA Results Assuming an Individualist Perspective using the Eco-Indicator 99 Method of Impact Assessment (Output from SimaPro)
Wood frame houses Lightweight CMU housesTampa El Paso Knoxville Providence Detroit Tampa El Paso Knoxville Providence Detroit
Carcinogens 1,540 2,170 2,520 3.46E3 3,790 1,580 2,100 2,430 3,350 3,670Respiratory organics 180 257 300 414 454 184 247 288 400 439Respiratory inorganics 41,700 50,200 52,100 64,600 69,400 44,500 50,500 52,400 64,800 69,600Climate change 21,200 24,100 23,900 28,100 29,900 21,800 23,600 23,400 27,600 29,400Radiation 0.7 0.7 0.7 0.7 0.7 0.7 0.7 0.7 0.7 0.7Ozone layer 2.0 2.0 1.7 1.6 1.6 2.0 1.9 1.6 1.6 1.6Ecotoxicity 38 45 47 56 59 39 44 46 55 58Acidification/eutrophication 2,350 2,620 2,540 2,910 3,080 2,420 2,560 2,490 2,860 3,040Land use 3,620 3,620 3,620 3,620 3,620 3,770 3,770 3,770 3,780 3,780Minerals 6,610 6,610 6,620 6,650 6,650 6,690 6,690 6,700 6,730 6,730Total (rounded) 77,200 89,600 91,600 106,000 117,000 81,000 89,500 91,500 110,000 117,000
Impact category*
*No units: data have been normalized and weighted.

H-5
Table H-4. Normalized and Weighted LCA Results using the EDIP/UMIP 96 Method of Impact Assessment (Output from SimaPro)
Wood frame houses Lightweight CMU housesTampa El Paso Knoxville Providence Detroit Tampa El Paso Knoxville Providence Detroit
Global warming (GWP 100) 241,000 275,000 272,000 320,000 342,000 248,000 268,000 266,000 315,000 336,000Ozone depletion 4,070 3,970 3,460 3,260 3,280 4,020 3,790 3,310 3,140 3,170Acidification 184,000 220,000 228,000 280,000 301,000 188,000 214,000 221,000 273,000 294,000Eutrophication 26,700 28,000 25,700 27,300 28,500 27,500 27,600 25,400 27,200 28,400Photochemical smog 4,320 5,460 5,930 7,630 8,250 4,410 5,300 5,750 7,440 8,040Ecotoxicity water, chronic 7,140 8,630 9,220 11,400 12,300 6,640 7,800 8,360 10,500 11,400Ecotoxicity water, acute 639 785 848 1,060 1,140 588 702 762 976 1,050Ecotoxicity soil, chronic 27 27 27 27 27 27 27 26 27 27Human toxicity, air 87 90 87 92 95 88 89 86 91 94Human toxicity, water 2,200 2,320 2,230 2,400 2,490 2,180 2,230 2,130 2,310 2,410Human toxicity, soil 1,240 1,300 1,240 1,310 1,360 1,250 1,260 1,200 1,280 1,330Bulk waste 188 191 169 170 175 189 184 163 165 170Hazardous waste 0.7 0.7 0.7 0.7 0.7 0.7 0.7 0.7 0.7 0.7Radioactive waste** x x x x x x x x x xSlags/ashes 0.04 0.04 0.04 0.04 0.04 0.04 0.04 0.04 0.04 0.04Resources (all) 0 0 0 0 0 0 0 0 0 0Total (rounded) 472,000 546,000 549,000 655,000 701,000 483,000 531,000 534,000 641,000 686,000
Impact category*
*No units: data have been normalized and weighted. **An x means there are no data.
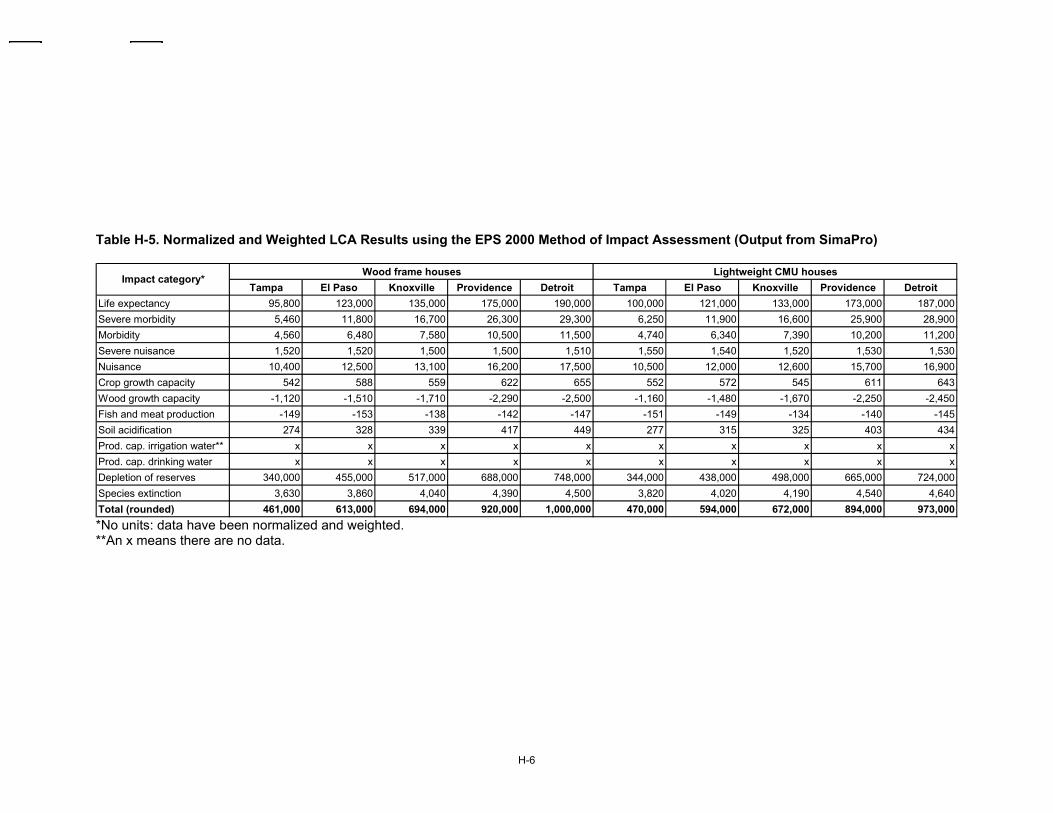
H-6
Table H-5. Normalized and Weighted LCA Results using the EPS 2000 Method of Impact Assessment (Output from SimaPro)
Wood frame houses Lightweight CMU housesTampa El Paso Knoxville Providence Detroit Tampa El Paso Knoxville Providence Detroit
Life expectancy 95,800 123,000 135,000 175,000 190,000 100,000 121,000 133,000 173,000 187,000Severe morbidity 5,460 11,800 16,700 26,300 29,300 6,250 11,900 16,600 25,900 28,900Morbidity 4,560 6,480 7,580 10,500 11,500 4,740 6,340 7,390 10,200 11,200Severe nuisance 1,520 1,520 1,500 1,500 1,510 1,550 1,540 1,520 1,530 1,530Nuisance 10,400 12,500 13,100 16,200 17,500 10,500 12,000 12,600 15,700 16,900Crop growth capacity 542 588 559 622 655 552 572 545 611 643Wood growth capacity -1,120 -1,510 -1,710 -2,290 -2,500 -1,160 -1,480 -1,670 -2,250 -2,450Fish and meat production -149 -153 -138 -142 -147 -151 -149 -134 -140 -145Soil acidification 274 328 339 417 449 277 315 325 403 434Prod. cap. irrigation water** x x x x x x x x x xProd. cap. drinking water x x x x x x x x x xDepletion of reserves 340,000 455,000 517,000 688,000 748,000 344,000 438,000 498,000 665,000 724,000Species extinction 3,630 3,860 4,040 4,390 4,500 3,820 4,020 4,190 4,540 4,640Total (rounded) 461,000 613,000 694,000 920,000 1,000,000 470,000 594,000 672,000 894,000 973,000
Impact category*
*No units: data have been normalized and weighted. **An x means there are no data.

I-1
APPENDIX I – GRAPHICAL PRESENTATION OF LCA SINGLE-SCORE SUMMARY
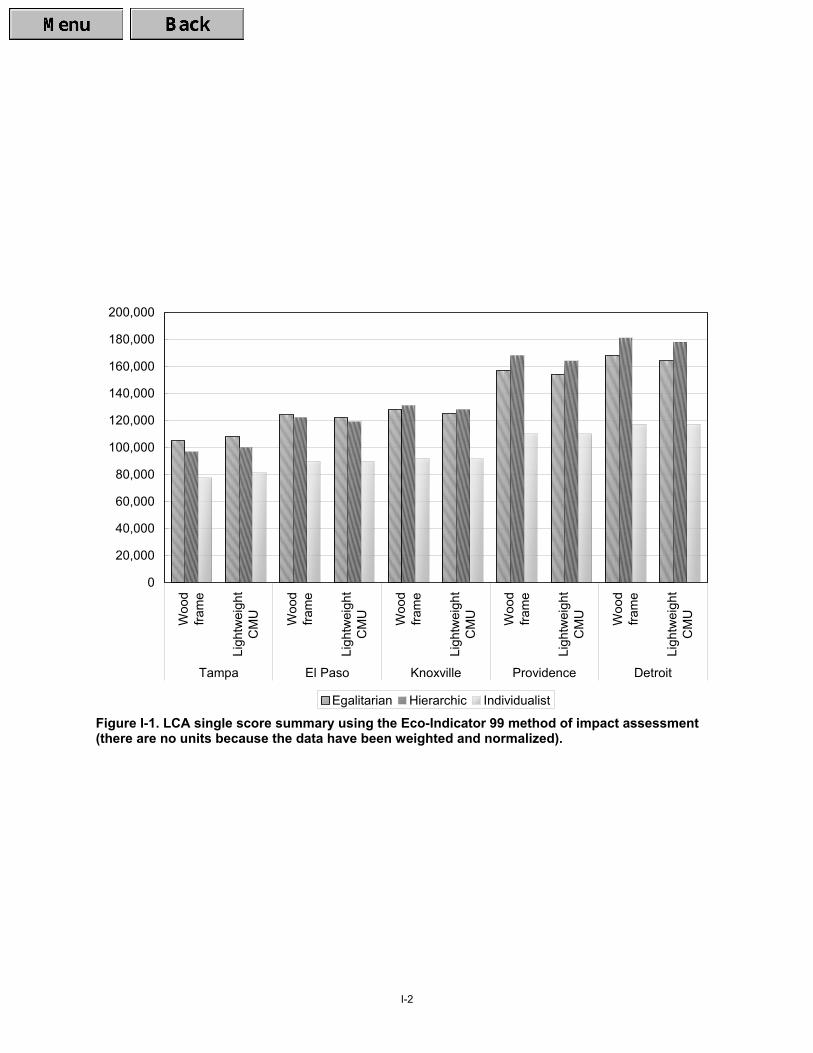
I-2
0
20,000
40,000
60,000
80,000
100,000
120,000
140,000
160,000
180,000
200,000
Woo
dfra
me
Ligh
twei
ght
CM
U Woo
dfra
me
Ligh
twei
ght
CM
U Woo
dfra
me
Ligh
twei
ght
CM
U Woo
dfra
me
Ligh
twei
ght
CM
U Woo
dfra
me
Ligh
twei
ght
CM
UTampa El Paso Knoxville Providence Detroit
Egalitarian Hierarchic Individualist
Figure I-1. LCA single score summary using the Eco-Indicator 99 method of impact assessment (there are no units because the data have been weighted and normalized).
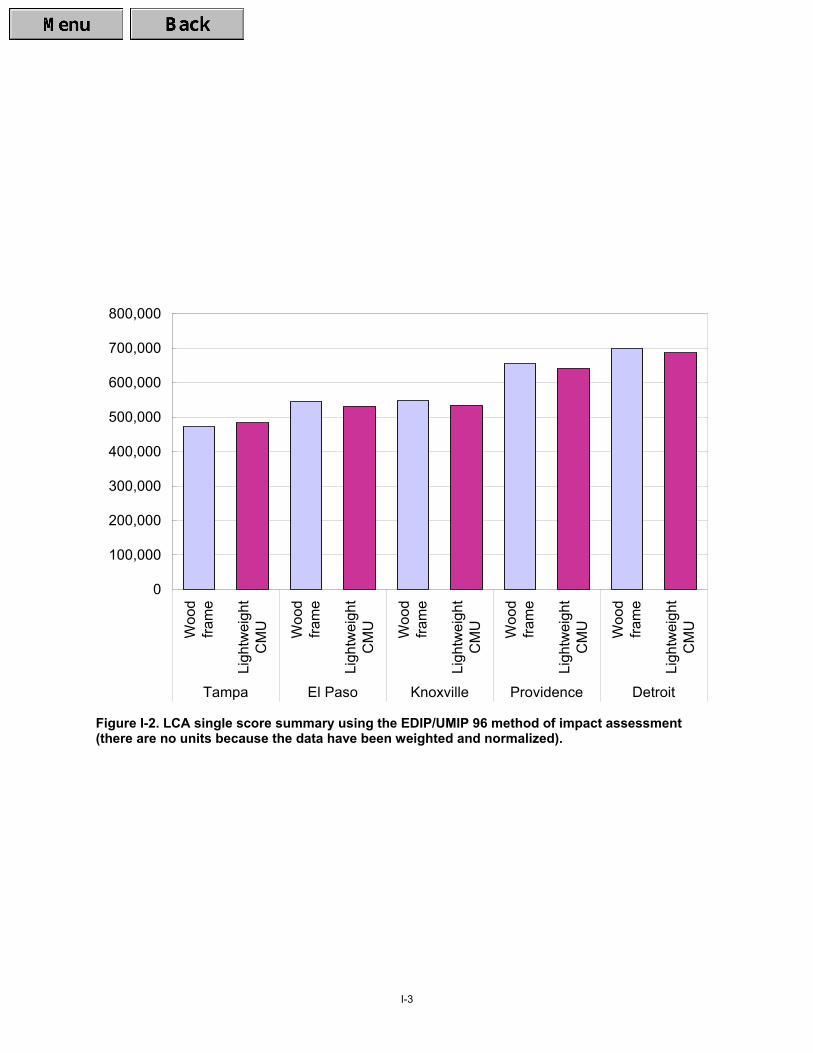
I-3
0
100,000
200,000
300,000
400,000
500,000
600,000
700,000
800,000
Woo
dfra
me
Ligh
twei
ght
CM
U Woo
dfra
me
Ligh
twei
ght
CM
U Woo
dfra
me
Ligh
twei
ght
CM
U Woo
dfra
me
Ligh
twei
ght
CM
U Woo
dfra
me
Ligh
twei
ght
CM
UTampa El Paso Knoxville Providence Detroit
Figure I-2. LCA single score summary using the EDIP/UMIP 96 method of impact assessment (there are no units because the data have been weighted and normalized).
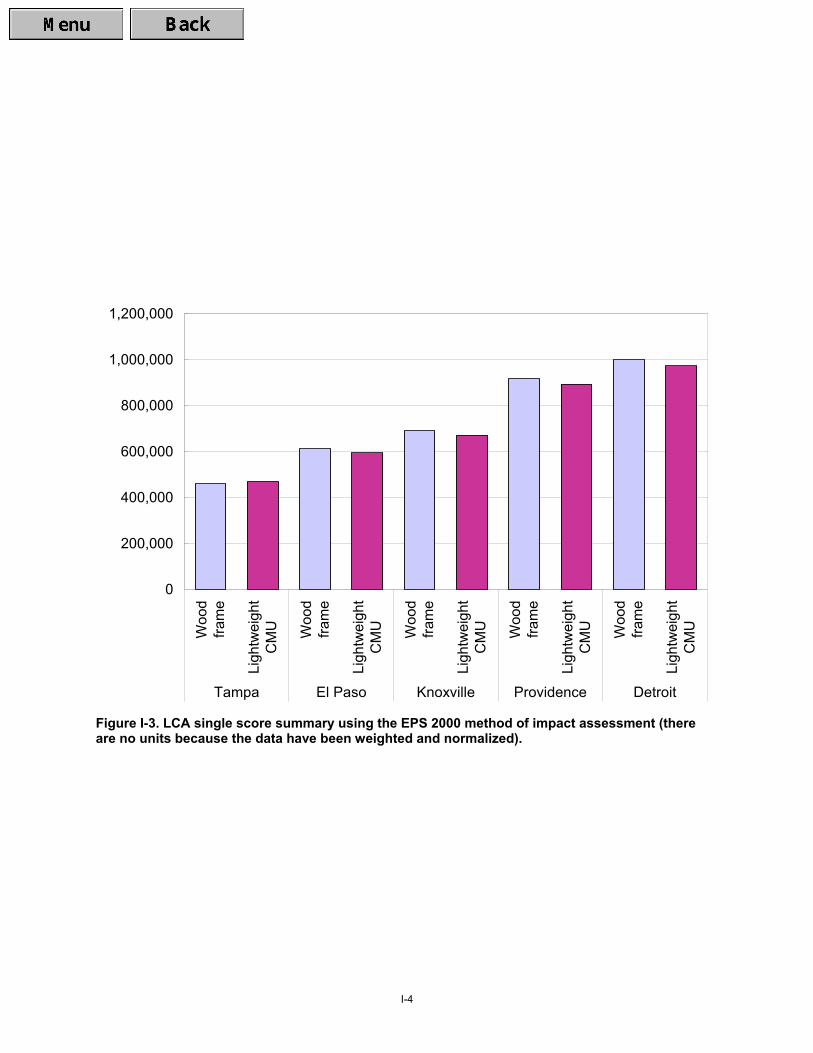
I-4
0
200,000
400,000
600,000
800,000
1,000,000
1,200,000
Woo
dfra
me
Ligh
twei
ght
CM
U Woo
dfra
me
Ligh
twei
ght
CM
U Woo
dfra
me
Ligh
twei
ght
CM
U Woo
dfra
me
Ligh
twei
ght
CM
U Woo
dfra
me
Ligh
twei
ght
CM
UTampa El Paso Knoxville Providence Detroit
Figure I-3. LCA single score summary using the EPS 2000 method of impact assessment (there are no units because the data have been weighted and normalized).
J-1
APPENDIX J – LCA SINGLE-SCORE SUMMARY (Output from SimaPro)

J-2
223
49,300
58,200
11,200
2,7100
10,000
20,000
30,000
40,000
50,000
60,000
70,000
80,000
90,000
100,000
Cement-basedmaterials
Other buildingmaterials
Householdelectricity use
Householdnatural gascombustion
Transportationto/from house
Poi
nts
Carcinogens Respiratory organics Respiratory inorganicsClimate change Radiation Ozone layerEcotoxicity Acidification/ Eutrophication Land useMinerals Fossil fuels
Ltwt CMU house
Figure J-1. Single-score life cycle inventory assessment of lightweight CMU house in El Paso showing contribution of each major process/product stage (output from SimaPro). The data have been normalized and weighted according to the Eco-Indicator 99 method using the Egalitarian perspective.

J-3
227
63,700
47,500
11,300
2,7500
10,000
20,000
30,000
40,000
50,000
60,000
70,000
80,000
90,000
100,000
Cement-basedmaterials
Other buildingmaterials
Householdelectricity use
Householdnatural gascombustion
Transportationto/from house
Poi
nts
Carcinogens Respiratory organics Respiratory inorganicsClimate change Radiation Ozone layerEcotoxicity Acidification/ Eutrophication Land useMinerals Fossil fuels
Ltwt CMU house
Figure J-2. Single-score life cycle inventory assessment of lightweight CMU house in Knoxville showing contribution of each major process/product stage (output from SimaPro). The data have been normalized and weighted according to the Eco-Indicator 99 method using the Egalitarian perspective.
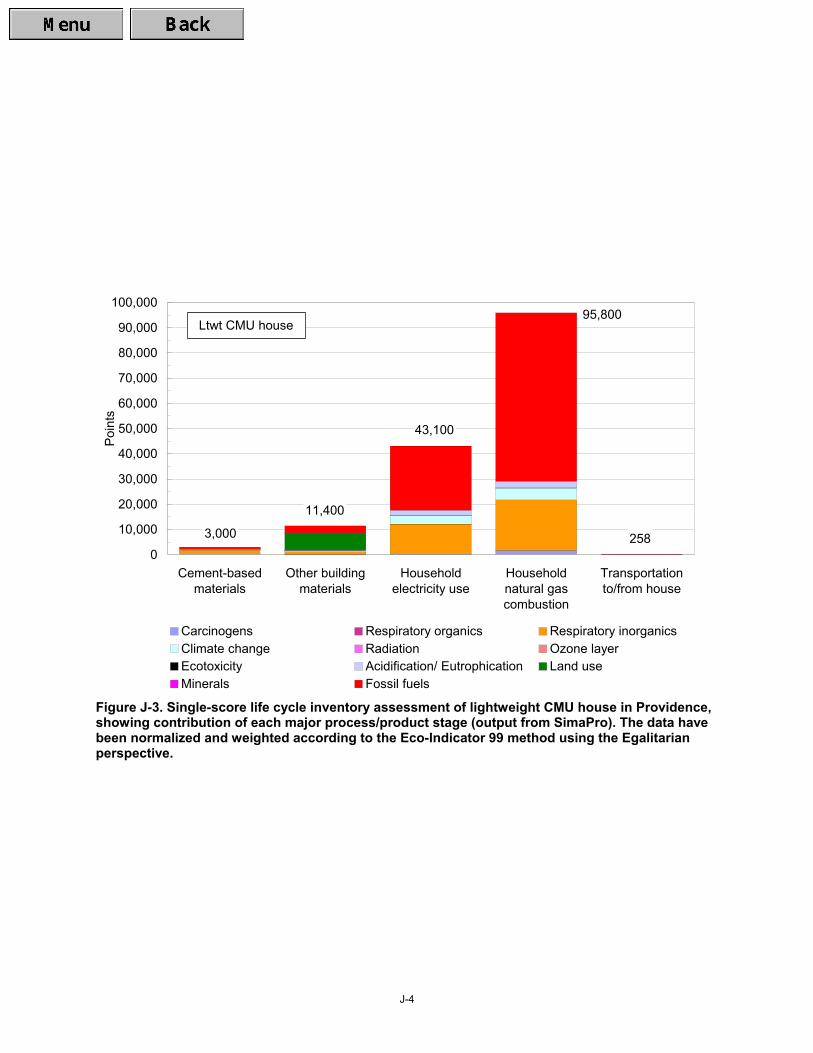
J-4
258
95,800
43,100
11,400
3,0000
10,000
20,000
30,000
40,000
50,000
60,000
70,000
80,000
90,000
100,000
Cement-basedmaterials
Other buildingmaterials
Householdelectricity use
Householdnatural gascombustion
Transportationto/from house
Poi
nts
Carcinogens Respiratory organics Respiratory inorganicsClimate change Radiation Ozone layerEcotoxicity Acidification/ Eutrophication Land useMinerals Fossil fuels
Ltwt CMU house
Figure J-3. Single-score life cycle inventory assessment of lightweight CMU house in Providence, showing contribution of each major process/product stage (output from SimaPro). The data have been normalized and weighted according to the Eco-Indicator 99 method using the Egalitarian perspective.
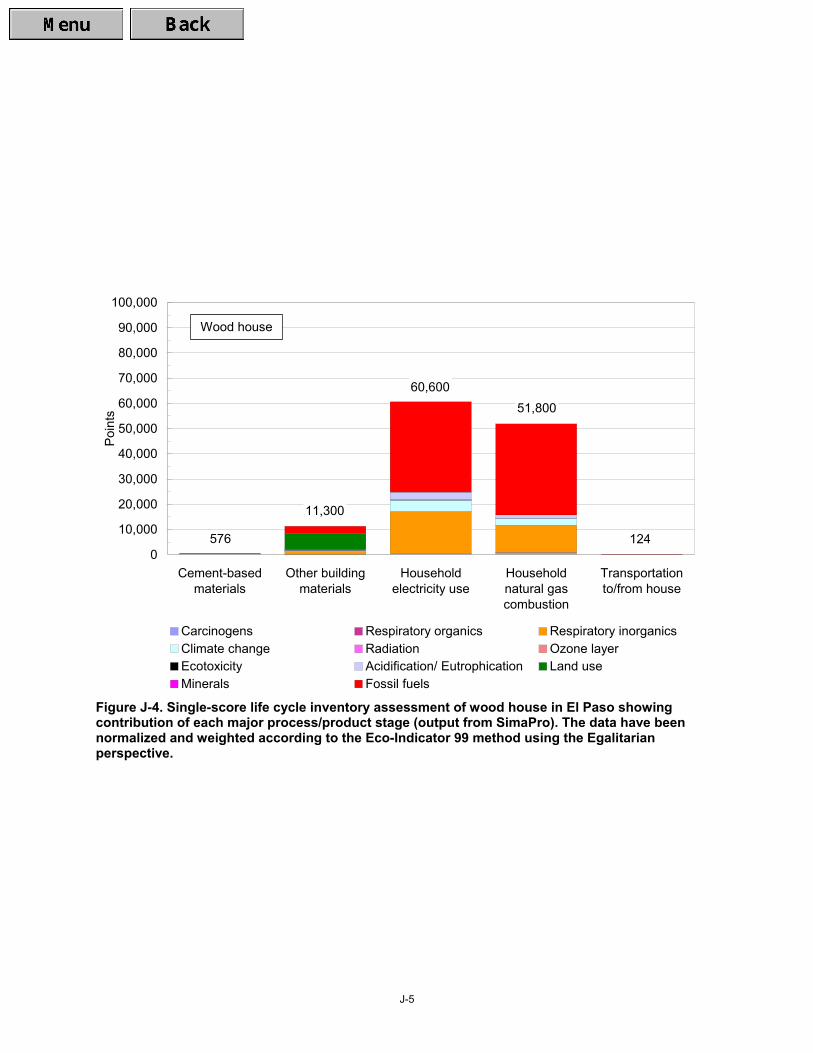
J-5
124
51,80060,600
11,300
5760
10,000
20,000
30,000
40,000
50,000
60,000
70,000
80,000
90,000
100,000
Cement-basedmaterials
Other buildingmaterials
Householdelectricity use
Householdnatural gascombustion
Transportationto/from house
Poi
nts
Carcinogens Respiratory organics Respiratory inorganicsClimate change Radiation Ozone layerEcotoxicity Acidification/ Eutrophication Land useMinerals Fossil fuels
Wood house
Figure J-4. Single-score life cycle inventory assessment of wood house in El Paso showing contribution of each major process/product stage (output from SimaPro). The data have been normalized and weighted according to the Eco-Indicator 99 method using the Egalitarian perspective.
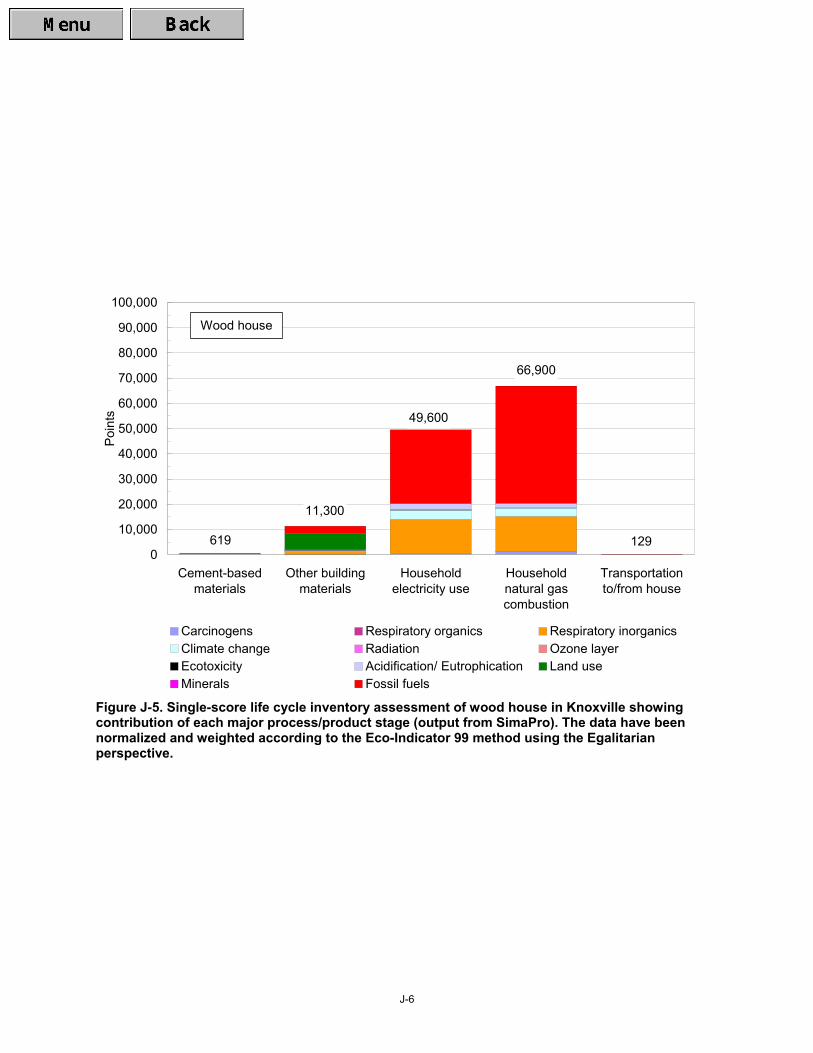
J-6
129
66,900
49,600
11,300
6190
10,000
20,000
30,000
40,000
50,000
60,000
70,000
80,000
90,000
100,000
Cement-basedmaterials
Other buildingmaterials
Householdelectricity use
Householdnatural gascombustion
Transportationto/from house
Poi
nts
Carcinogens Respiratory organics Respiratory inorganicsClimate change Radiation Ozone layerEcotoxicity Acidification/ Eutrophication Land useMinerals Fossil fuels
Wood house
Figure J-5. Single-score life cycle inventory assessment of wood house in Knoxville showing contribution of each major process/product stage (output from SimaPro). The data have been normalized and weighted according to the Eco-Indicator 99 method using the Egalitarian perspective.
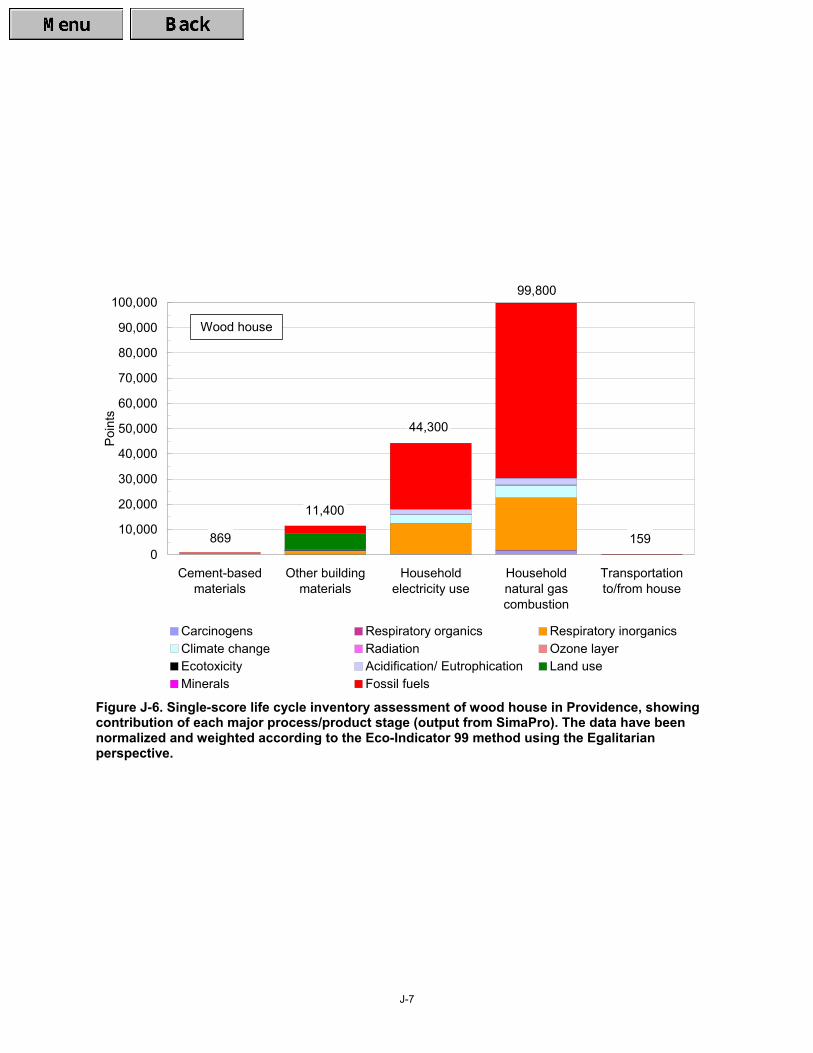
J-7
159
99,800
44,300
11,400
8690
10,000
20,000
30,000
40,000
50,000
60,000
70,000
80,000
90,000
100,000
Cement-basedmaterials
Other buildingmaterials
Householdelectricity use
Householdnatural gascombustion
Transportationto/from house
Poi
nts
Carcinogens Respiratory organics Respiratory inorganicsClimate change Radiation Ozone layerEcotoxicity Acidification/ Eutrophication Land useMinerals Fossil fuels
Wood house
Figure J-6. Single-score life cycle inventory assessment of wood house in Providence, showing contribution of each major process/product stage (output from SimaPro). The data have been normalized and weighted according to the Eco-Indicator 99 method using the Egalitarian perspective.
K-1
APPENDIX K – BREAKDOWN OF SINGLE-SCORE LCA OF BUILDING MATERIALS
(Output from SimaPro)
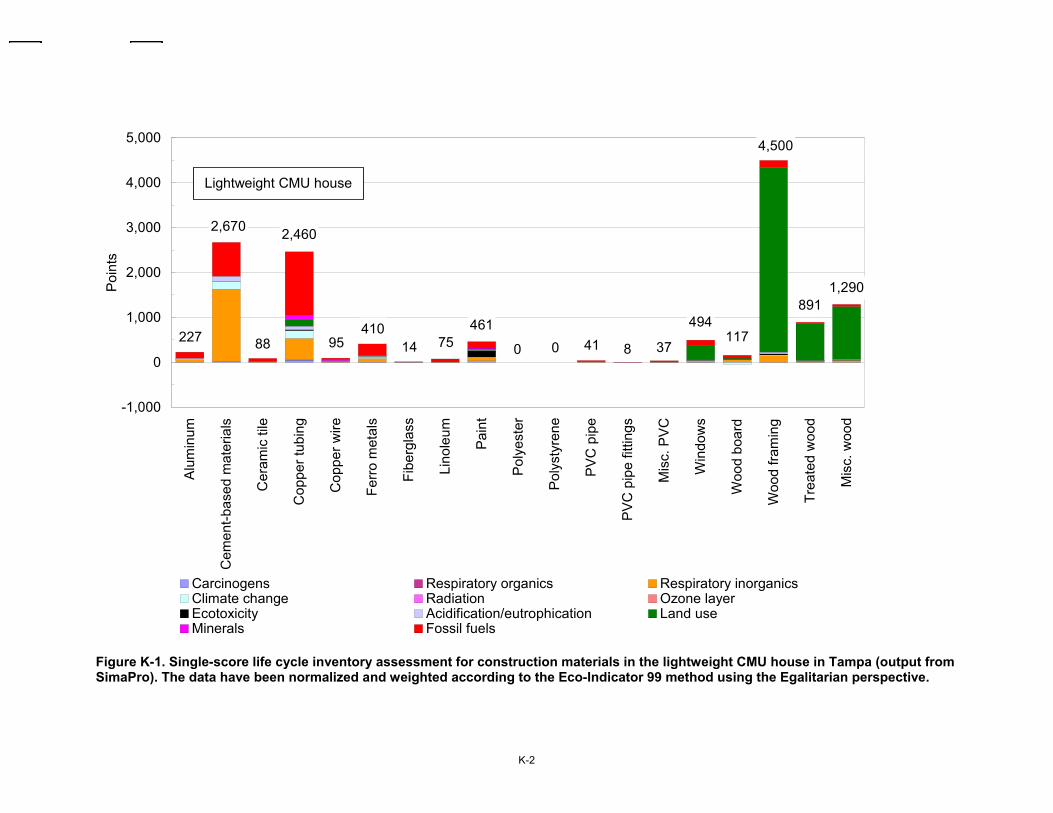
K-2
1,290891
4,500
117494
3784100
4617514
41095
2,460
88
2,670
227
-1,000
0
1,000
2,000
3,000
4,000
5,000
Alu
min
um
Cem
ent-b
ased
mat
eria
ls
Cer
amic
tile
Cop
per t
ubin
g
Cop
per w
ire
Ferr
o m
etal
s
Fibe
rgla
ss
Lino
leum
Pai
nt
Pol
yest
er
Pol
ysty
rene
PV
C p
ipe
PV
C p
ipe
fittin
gs
Mis
c. P
VC
Win
dow
s
Woo
d bo
ard
Woo
d fra
min
g
Trea
ted
woo
d
Mis
c. w
ood
Poi
nts
Carcinogens Respiratory organics Respiratory inorganicsClimate change Radiation Ozone layerEcotoxicity Acidification/eutrophication Land useMinerals Fossil fuels
Lightweight CMU house
Figure K-1. Single-score life cycle inventory assessment for construction materials in the lightweight CMU house in Tampa (output from SimaPro). The data have been normalized and weighted according to the Eco-Indicator 99 method using the Egalitarian perspective.
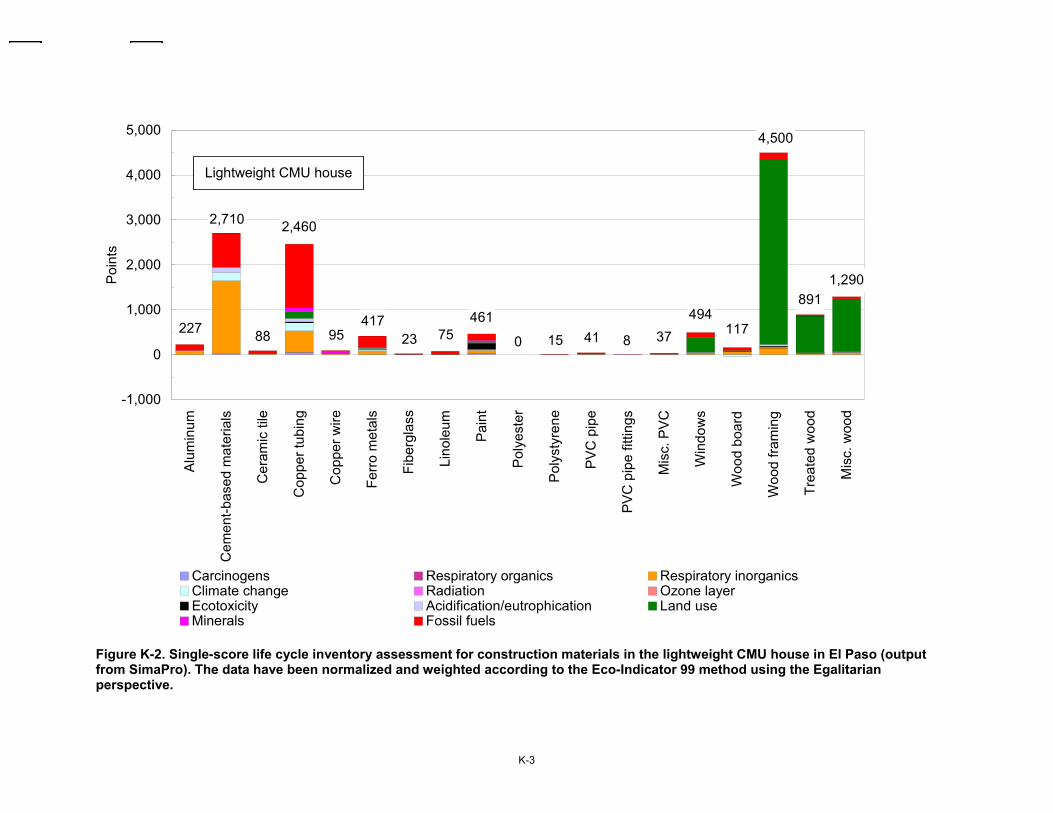
K-3
1,290891
4,500
117494
37841150
4617523
41795
2,460
88
2,710
227
-1,000
0
1,000
2,000
3,000
4,000
5,000
Alu
min
um
Cem
ent-b
ased
mat
eria
ls
Cer
amic
tile
Cop
per t
ubin
g
Cop
per w
ire
Ferr
o m
etal
s
Fibe
rgla
ss
Lino
leum
Pai
nt
Pol
yest
er
Pol
ysty
rene
PV
C p
ipe
PV
C p
ipe
fittin
gs
Mis
c. P
VC
Win
dow
s
Woo
d bo
ard
Woo
d fra
min
g
Trea
ted
woo
d
Mis
c. w
ood
Poi
nts
Carcinogens Respiratory organics Respiratory inorganicsClimate change Radiation Ozone layerEcotoxicity Acidification/eutrophication Land useMinerals Fossil fuels
Lightweight CMU house
Figure K-2. Single-score life cycle inventory assessment for construction materials in the lightweight CMU house in El Paso (output from SimaPro). The data have been normalized and weighted according to the Eco-Indicator 99 method using the Egalitarian perspective.
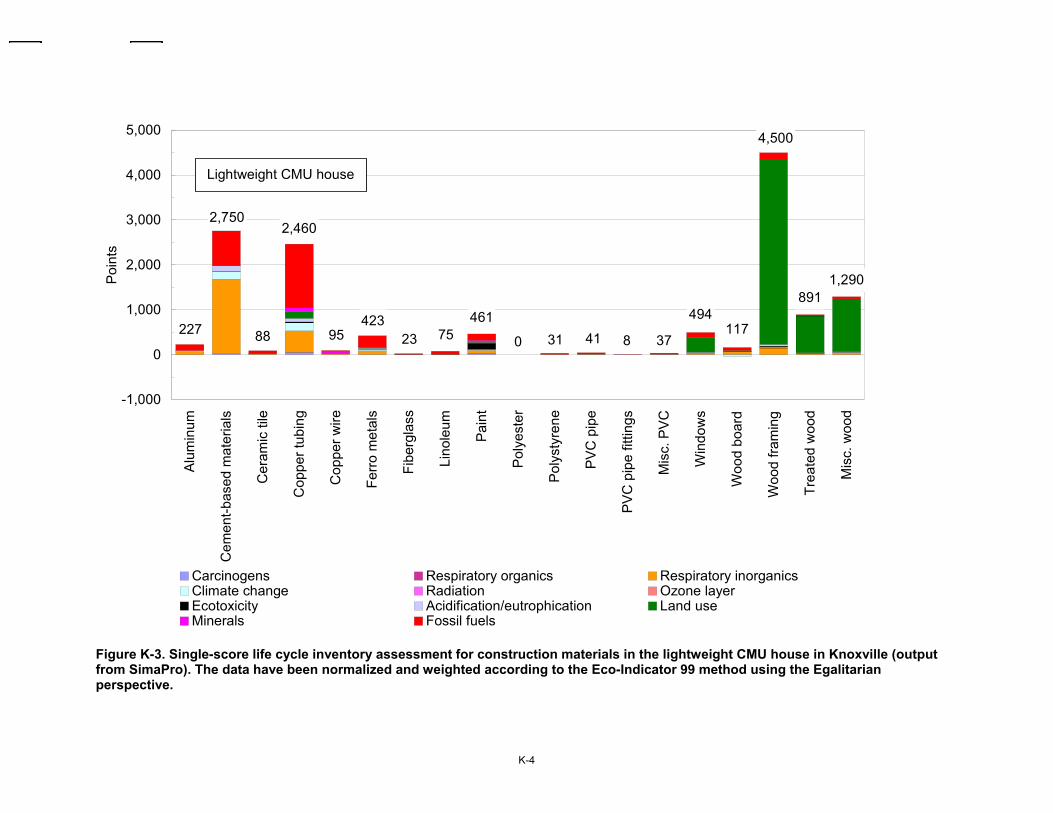
K-4
1,290891
4,500
117494
37841310
4617523
42395
2,460
88
2,750
227
-1,000
0
1,000
2,000
3,000
4,000
5,000
Alu
min
um
Cem
ent-b
ased
mat
eria
ls
Cer
amic
tile
Cop
per t
ubin
g
Cop
per w
ire
Ferr
o m
etal
s
Fibe
rgla
ss
Lino
leum
Pai
nt
Pol
yest
er
Pol
ysty
rene
PV
C p
ipe
PV
C p
ipe
fittin
gs
Mis
c. P
VC
Win
dow
s
Woo
d bo
ard
Woo
d fra
min
g
Trea
ted
woo
d
Mis
c. w
ood
Poi
nts
Carcinogens Respiratory organics Respiratory inorganicsClimate change Radiation Ozone layerEcotoxicity Acidification/eutrophication Land useMinerals Fossil fuels
Lightweight CMU house
Figure K-3. Single-score life cycle inventory assessment for construction materials in the lightweight CMU house in Knoxville (output from SimaPro). The data have been normalized and weighted according to the Eco-Indicator 99 method using the Egalitarian perspective.
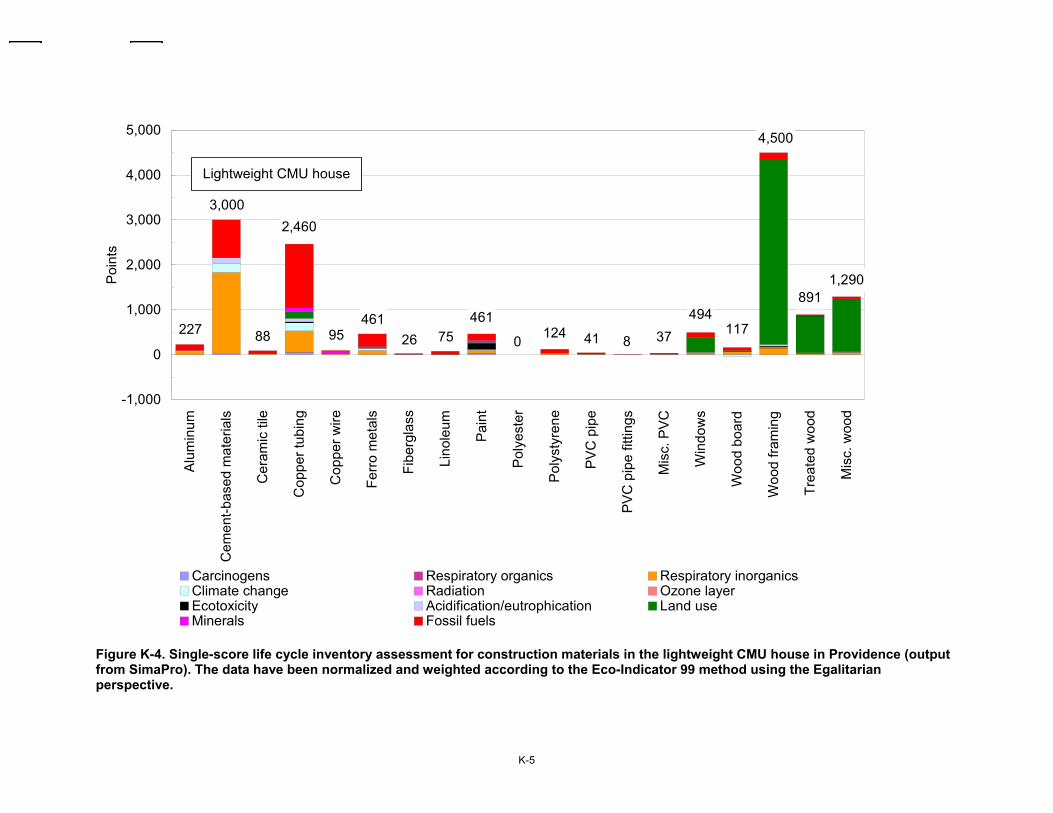
K-5
1,290891
4,500
117494
378411240
4617526
46195
2,460
88
3,000
227
-1,000
0
1,000
2,000
3,000
4,000
5,000
Alu
min
um
Cem
ent-b
ased
mat
eria
ls
Cer
amic
tile
Cop
per t
ubin
g
Cop
per w
ire
Ferr
o m
etal
s
Fibe
rgla
ss
Lino
leum
Pai
nt
Pol
yest
er
Pol
ysty
rene
PV
C p
ipe
PV
C p
ipe
fittin
gs
Mis
c. P
VC
Win
dow
s
Woo
d bo
ard
Woo
d fra
min
g
Trea
ted
woo
d
Mis
c. w
ood
Poi
nts
Carcinogens Respiratory organics Respiratory inorganicsClimate change Radiation Ozone layerEcotoxicity Acidification/eutrophication Land useMinerals Fossil fuels
Lightweight CMU house
Figure K-4. Single-score life cycle inventory assessment for construction materials in the lightweight CMU house in Providence (output from SimaPro). The data have been normalized and weighted according to the Eco-Indicator 99 method using the Egalitarian perspective.
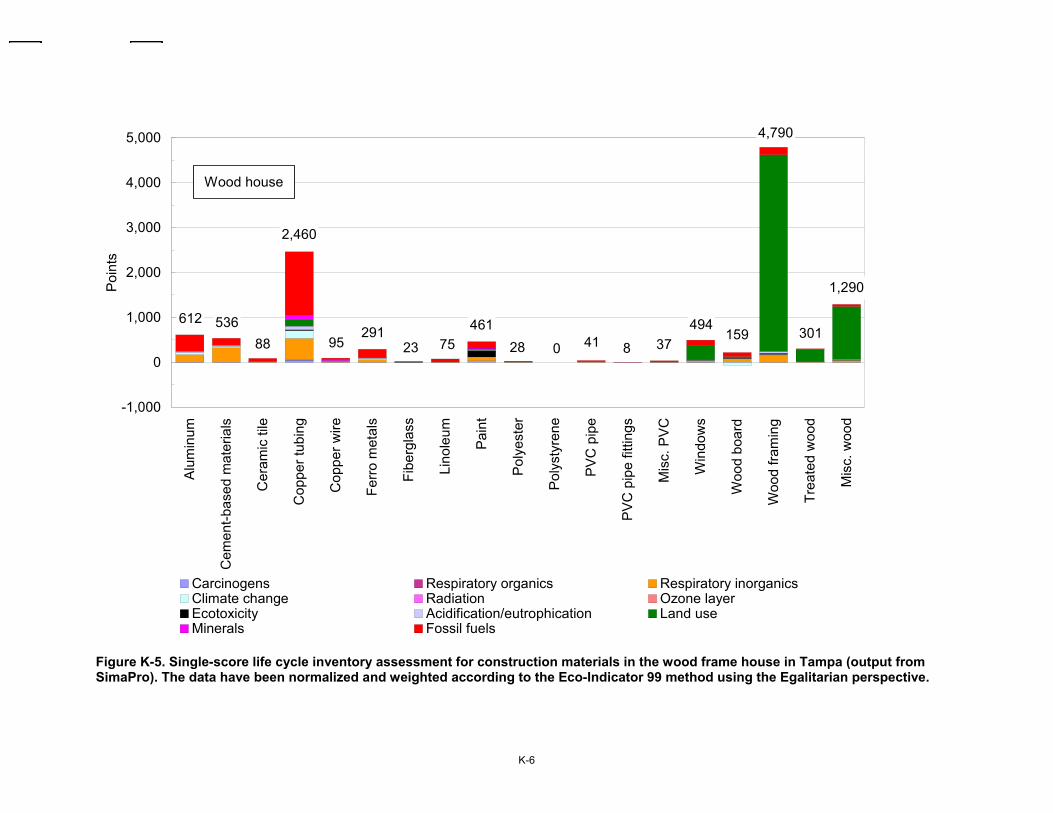
K-6
1,290
301
4,790
159494
37841028461
7523291
95
2,460
88536612
-1,000
0
1,000
2,000
3,000
4,000
5,000
Alu
min
um
Cem
ent-b
ased
mat
eria
ls
Cer
amic
tile
Cop
per t
ubin
g
Cop
per w
ire
Ferr
o m
etal
s
Fibe
rgla
ss
Lino
leum
Pai
nt
Pol
yest
er
Pol
ysty
rene
PV
C p
ipe
PV
C p
ipe
fittin
gs
Mis
c. P
VC
Win
dow
s
Woo
d bo
ard
Woo
d fra
min
g
Trea
ted
woo
d
Mis
c. w
ood
Poi
nts
Carcinogens Respiratory organics Respiratory inorganicsClimate change Radiation Ozone layerEcotoxicity Acidification/eutrophication Land useMinerals Fossil fuels
Wood house
Figure K-5. Single-score life cycle inventory assessment for construction materials in the wood frame house in Tampa (output from SimaPro). The data have been normalized and weighted according to the Eco-Indicator 99 method using the Egalitarian perspective.

K-7
1,290
301
4,790
159494
378411528461
7523298
95
2,460
88577612
-1,000
0
1,000
2,000
3,000
4,000
5,000
Alu
min
um
Cem
ent-b
ased
mat
eria
ls
Cer
amic
tile
Cop
per t
ubin
g
Cop
per w
ire
Ferr
o m
etal
s
Fibe
rgla
ss
Lino
leum
Pai
nt
Pol
yest
er
Pol
ysty
rene
PV
C p
ipe
PV
C p
ipe
fittin
gs
Mis
c. P
VC
Win
dow
s
Woo
d bo
ard
Woo
d fra
min
g
Trea
ted
woo
d
Mis
c. w
ood
Poi
nts
Carcinogens Respiratory organics Respiratory inorganicsClimate change Radiation Ozone layerEcotoxicity Acidification/eutrophication Land useMinerals Fossil fuels
Wood house
Figure K-6. Single-score life cycle inventory assessment for construction materials in the wood frame house in El Paso (output from SimaPro). The data have been normalized and weighted according to the Eco-Indicator 99 method using the Egalitarian perspective.
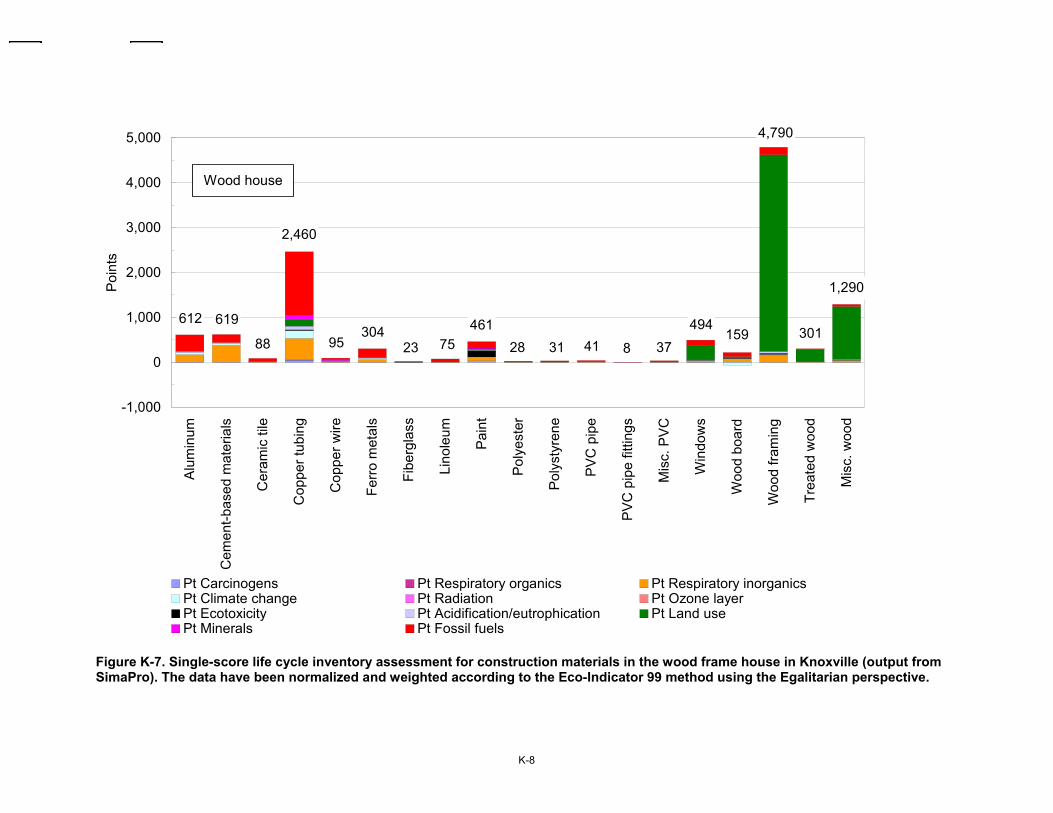
K-8
1,290
301
4,790
159494
378413128461
7523304
95
2,460
88
619612
-1,000
0
1,000
2,000
3,000
4,000
5,000
Alu
min
um
Cem
ent-b
ased
mat
eria
ls
Cer
amic
tile
Cop
per t
ubin
g
Cop
per w
ire
Ferr
o m
etal
s
Fibe
rgla
ss
Lino
leum
Pai
nt
Pol
yest
er
Pol
ysty
rene
PV
C p
ipe
PV
C p
ipe
fittin
gs
Mis
c. P
VC
Win
dow
s
Woo
d bo
ard
Woo
d fra
min
g
Trea
ted
woo
d
Mis
c. w
ood
Poi
nts
Pt Carcinogens Pt Respiratory organics Pt Respiratory inorganicsPt Climate change Pt Radiation Pt Ozone layerPt Ecotoxicity Pt Acidification/eutrophication Pt Land usePt Minerals Pt Fossil fuels
Wood house
Figure K-7. Single-score life cycle inventory assessment for construction materials in the wood frame house in Knoxville (output from SimaPro). The data have been normalized and weighted according to the Eco-Indicator 99 method using the Egalitarian perspective.

K-9
1,290
301
4,790
159494
3784112428461
7526342
95
2,460
88
869612
-1,000
0
1,000
2,000
3,000
4,000
5,000
Alu
min
um
Cem
ent-b
ased
mat
eria
ls
Cer
amic
tile
Cop
per t
ubin
g
Cop
per w
ire
Ferr
o m
etal
s
Fibe
rgla
ss
Lino
leum
Pai
nt
Pol
yest
er
Pol
ysty
rene
PV
C p
ipe
PV
C p
ipe
fittin
gs
Mis
c. P
VC
Win
dow
s
Woo
d bo
ard
Woo
d fra
min
g
Trea
ted
woo
d
Mis
c. w
ood
Poi
nts
Carcinogens Respiratory organics Respiratory inorganicsClimate change Radiation Ozone layerEcotoxicity Acidification/eutrophication Land useMinerals Fossil fuels
Wood house
Figure K-8. Single-score life cycle inventory assessment for construction materials in the wood frame house in Providence (output from SimaPro). The data have been normalized and weighted according to the Eco-Indicator 99 method using the Egalitarian perspective.