Life Cycle Assessment for Canned Crab Product (Portunus...
6
Life Cycle Assessment for Canned Crab Product (Portunus Pelagius) Product in Indonesia Putri Amelia Information System Study Program, Universitas Internasional Semen Indonesia (Email: [email protected]) Abstract: Canned crab is one of fishery business process which favored by the people because of meat flavor. Crab demand increased rapidly up to become export product in many countries. In the other hand, crab meat quickly decay if it is not stored in properly placed. Generally, industrial development and technology threats the environment and natural resources in the future. Life cycle assessment (LCA) is tool that can used to evaluate the industrial process manufacturing activities from candle to grave. LCA user will evaluate the environmental load in manufacturing food products without considering their usage and disposal phases. The most significant process of canned crab product that contribute to damage the environment will be identified using LCA user. Therefore, all production processes from materials to transportation will be analyzed. Using eco-indicator 99 was applied with the SimaPro software 7.3.3, it will indicate the phases or processes that could threaten environmental damage. Moreover, the loads of environment impact in each process are showed in the model. Therefore, total Eco-indicator 99 score that is used will showed in the table result. Finally, the total emission from all production processes with one ton of crabmeat as functional unit is 534 Pt. Keywords: Canned crab, environment impact, industrial stage, life cycle assessment. 1. Introduction Indonesia is an archipelago country which many islands. The wide of Indonesia sea is larger than the wide of Indonesia land. It has 5.8 million km area, and supported with the coastline which is about 97 thousand km (FAO, 2015). Moreover, the natural resources in marine area can be taken by many people. who spread all over in Indonesia. This event is already proven by the data from Marine and Fisheries Ministry (2015). It said that the increasing number of gross domestic product (GDP) in Indonesia is supported by 17 sectors including Agriculture, forestry, and fisheries sector. The increasing number of GDP is 5,09%. This number is contributing the second largest value after financial services and insurance sector. A crab is one of the fishery commodity which favored by the people because of meat flavor. Crab demand increased rapidly on the domestic or export market although the selling price is too high. Now days, crab commodity rely on catching in the sea. Marine and Fisheries Ministry (2011) is recorded the export value of crab commodity remain at the third level after shrimp and tuna (21.510 tons or 170 million dollar). This number is continuously increasing until this time in order to deliver the export products . Crab meat is one of the perishable products. The value of this product is highly depending on the environment such as temperature and humidity (Blackburn et al., 2009) Crab meat quickly decay if it is not stored in properly placed. Scavarda showed that the total number of bacteria is increasing because the crab meat contains about 18-30% of protein and 70-80% of water. This condition makes the crab business bear loss cost. Today, the concepts for serving the perishable foods are still a challenge industrial fishery sector (Huijbregts et al., 2010). They must to serve the freshness product when the customer demand is always increasing. Supply chain management on manufacturing has concerns to answer it. Now days, the industry sector makes the canned ISBN 978-93-86878-06-9 10th International Conference on Food, Ecology, Biological and Medical Sciences (FEBM-17) Dec. 14-15, 2017 at Kuala Lumpur (Malaysia) https://doi.org/10.15242/DiRPUB.DIR1217206 82
Transcript of Life Cycle Assessment for Canned Crab Product (Portunus...

Life Cycle Assessment for Canned Crab Product (Portunus
Pelagius) Product in Indonesia
Putri Amelia Information System Study Program, Universitas Internasional Semen Indonesia
(Email: [email protected])
Abstract: Canned crab is one of fishery business process which favored by the people because of meat flavor.
Crab demand increased rapidly up to become export product in many countries. In the other hand, crab meat
quickly decay if it is not stored in properly placed. Generally, industrial development and technology threats the
environment and natural resources in the future. Life cycle assessment (LCA) is tool that can used to evaluate the
industrial process manufacturing activities from candle to grave. LCA user will evaluate the environmental load
in manufacturing food products without considering their usage and disposal phases. The most significant
process of canned crab product that contribute to damage the environment will be identified using LCA user.
Therefore, all production processes from materials to transportation will be analyzed. Using eco-indicator 99
was applied with the SimaPro software 7.3.3, it will indicate the phases or processes that could threaten
environmental damage. Moreover, the loads of environment impact in each process are showed in the model.
Therefore, total Eco-indicator 99 score that is used will showed in the table result. Finally, the total emission
from all production processes with one ton of crabmeat as functional unit is 534 Pt.
Keywords: Canned crab, environment impact, industrial stage, life cycle assessment.
1. Introduction
Indonesia is an archipelago country which many islands. The wide of Indonesia sea is larger than the wide of
Indonesia land. It has 5.8 million km area, and supported with the coastline which is about 97 thousand km
(FAO, 2015). Moreover, the natural resources in marine area can be taken by many people. who spread all over
in Indonesia. This event is already proven by the data from Marine and Fisheries Ministry (2015). It said that the
increasing number of gross domestic product (GDP) in Indonesia is supported by 17 sectors including
Agriculture, forestry, and fisheries sector. The increasing number of GDP is 5,09%. This number is contributing
the second largest value after financial services and insurance sector.
A crab is one of the fishery commodity which favored by the people because of meat flavor. Crab demand
increased rapidly on the domestic or export market although the selling price is too high. Now days, crab
commodity rely on catching in the sea. Marine and Fisheries Ministry (2011) is recorded the export value of
crab commodity remain at the third level after shrimp and tuna (21.510 tons or 170 million dollar). This number
is continuously increasing until this time in order to deliver the export products .
Crab meat is one of the perishable products. The value of this product is highly depending on the
environment such as temperature and humidity (Blackburn et al., 2009) Crab meat quickly decay if it is not
stored in properly placed. Scavarda showed that the total number of bacteria is increasing because the crab meat
contains about 18-30% of protein and 70-80% of water. This condition makes the crab business bear loss cost.
Today, the concepts for serving the perishable foods are still a challenge industrial fishery sector (Huijbregts
et al., 2010). They must to serve the freshness product when the customer demand is always increasing. Supply
chain management on manufacturing has concerns to answer it. Now days, the industry sector makes the canned
ISBN 978-93-86878-06-9
10th International Conference on Food, Ecology, Biological and Medical Sciences (FEBM-17)
Dec. 14-15, 2017 at Kuala Lumpur (Malaysia)
https://doi.org/10.15242/DiRPUB.DIR1217206 82

crab. It aims to reduce the decay period and extend the meat durability. The development of industrial
technology evidently threats the environment and natural resources in the future.
The life-cycle assessment methodology was selected in this research which is SimaPro 7.3.3 as supporting
software. LCA is applied to know the impact of canned crab product in industrial activity without considering
their usage and disposal phases. PT. Graha Makmur Ciptapratama is chosen for the observation. Then, the result
of this research is expected to know the phases or processes that could threaten environmental damage.
Many researches discussed about LCA. In 2013, the research focused in measurement environment in
transportation (Hawkins et al., 2013). Moreover, research in 2014 told about a food sustainability problem
(Garnett T, 2014). The LCA could be oriented to clarify thinking and advance policy-relevant knowledge. In
2015, the study about non-leather shoes is examined (Gül S et al., 2015).. The goal is demonstrating the high
impact of the product’s lifetime on the final environmental performance classes. The last research is investigated
by almeida (2015). It explored the assessment in canned sardine in Portugal .
2. LCA Methodology
LCA is the assessment of the environmental impact of a product throughout its life cycle. LCA provides on
the environmental performance of products that has made it a central concept for both environmental
management in industry and environmental policy-making in public government (Baumann et al., 2004).
The LCA methodology is based on standard and use of Eco-indicator 99 (H) that considers the
resources consumption, effects of the emissions onto human health and ecosystem. There are 5 variables in
Eco-indicator 99 which are material, production process, transportation process, energy generation process, and
disposal (Ministry of housing spatial planning and the environment, 2000).
Figure 1 is explained the methodology which is started from goal and scope definition, inventory analysis,
impact assessment and then interpretation. In the first stage, it starts with goal definition, scope definition,
system boundaries, system description, and analysis.
Fig. 1: LCA Methodology
https://doi.org/10.15242/DiRPUB.DIR1217206 83
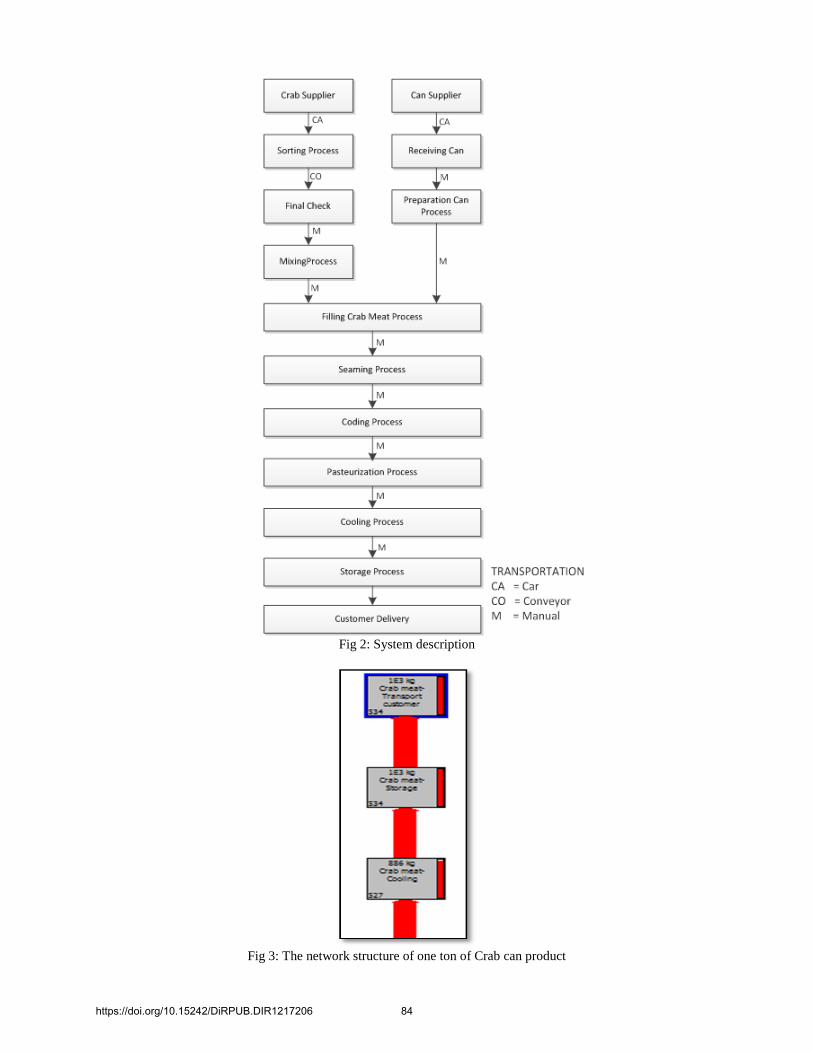
Fig 2: System description
Fig 3: The network structure of one ton of Crab can product
https://doi.org/10.15242/DiRPUB.DIR1217206 84
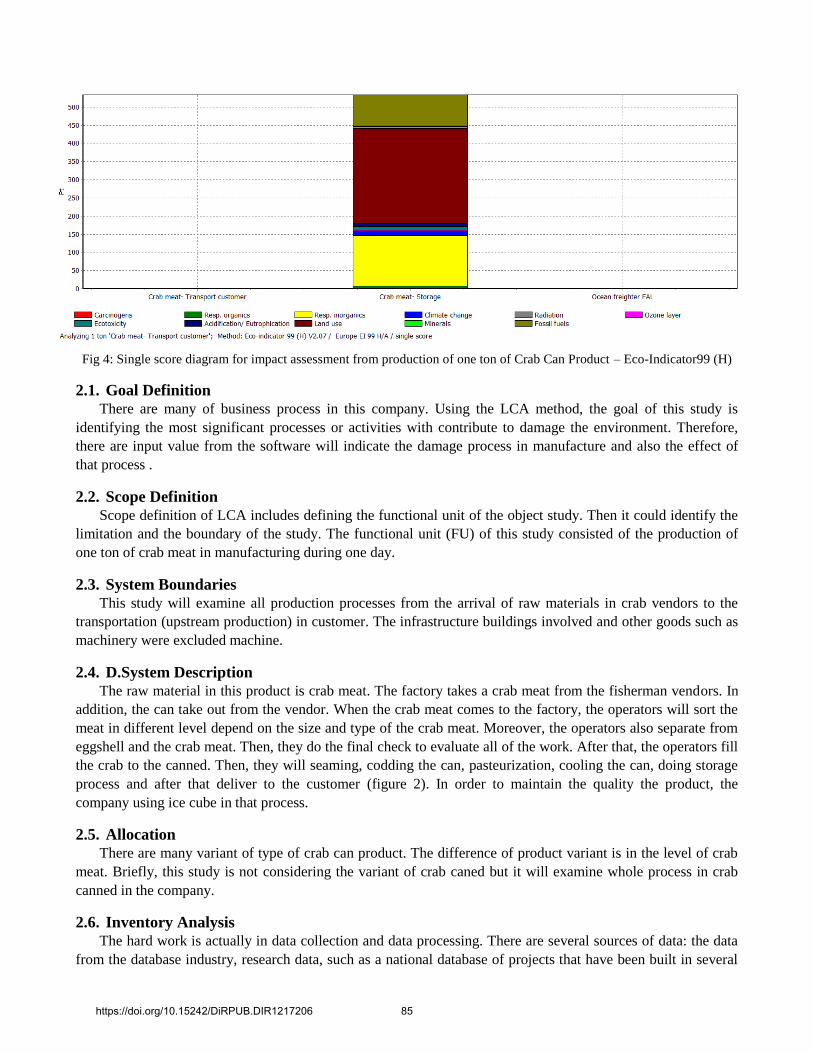
Fig 4: Single score diagram for impact assessment from production of one ton of Crab Can Product – Eco-Indicator99 (H)
2.1. Goal Definition
There are many of business process in this company. Using the LCA method, the goal of this study is
identifying the most significant processes or activities with contribute to damage the environment. Therefore,
there are input value from the software will indicate the damage process in manufacture and also the effect of
that process .
2.2. Scope Definition
Scope definition of LCA includes defining the functional unit of the object study. Then it could identify the
limitation and the boundary of the study. The functional unit (FU) of this study consisted of the production of
one ton of crab meat in manufacturing during one day.
2.3. System Boundaries
This study will examine all production processes from the arrival of raw materials in crab vendors to the
transportation (upstream production) in customer. The infrastructure buildings involved and other goods such as
machinery were excluded machine.
2.4. D.System Description
The raw material in this product is crab meat. The factory takes a crab meat from the fisherman vendors. In
addition, the can take out from the vendor. When the crab meat comes to the factory, the operators will sort the
meat in different level depend on the size and type of the crab meat. Moreover, the operators also separate from
eggshell and the crab meat. Then, they do the final check to evaluate all of the work. After that, the operators fill
the crab to the canned. Then, they will seaming, codding the can, pasteurization, cooling the can, doing storage
process and after that deliver to the customer (figure 2). In order to maintain the quality the product, the
company using ice cube in that process.
2.5. Allocation
There are many variant of type of crab can product. The difference of product variant is in the level of crab
meat. Briefly, this study is not considering the variant of crab caned but it will examine whole process in crab
canned in the company.
2.6. Inventory Analysis
The hard work is actually in data collection and data processing. There are several sources of data: the data
from the database industry, research data, such as a national database of projects that have been built in several
https://doi.org/10.15242/DiRPUB.DIR1217206 85

countries, the general literature data (especially data from description process) and data from SimaPro 7.3.3 such
as water, transportation and another data that hard to find.
2.7. Impact Assessment
The method of Eco-indicator 99 was applied with the SimaPro software. The eleven impact categories of
this indicator were evaluated using weighting based on the hierarchy’s cultural perspective. These impact
categories are grouped into three categories of damages: human health, ecosystem quality and resources.
3. Life Cycle Inventory Result
The network was obtained after inputting all data into SimaPro software. The big part of process in can crab
product can be seen from the network in Figure 3. The line thickness in the network display the contribution to
the total environmental load. This load depends on the impact assessment method that is selected. In this study,
the total Eco-indicator 99 score is used. The red line thickness means an environmental load. Then, it happens in
crab meat storage. The total emission from all 0 the largest environmental impact. Impact assessment method
that is chosen is Eco indicator 99 method.
The results of the impact assessment can be seen in Figure 4 and Table 1.
4. Conclusion
The cradle-to-gate life cycle of crab can product was analyzed in PT. Graha Makmur Ciptapratama.
Recorded data collection of the company and interviews were conducted to obtain relevant data. SimaPro 7.3.3
with EcoIndicator99 (H) method was used to generate the impact assessment of one ton of Crab can product.
Additionally, SimaPro database and data from literature was used as life cycle inventory of input and output.
The total emission from whole sugar processes with one ton of crab can product as functional unit is 534 Pt.
The highest emission is from Land use (261 Pt/one ton of Crab can product) followed by Resp organic.
5. References
[1] Almeida, C., Vaz, S., & Ziegler, F. (2015). Environmental life cycle assessment of a canned sardine product from
Portugal. Journal of Industrial Ecology, 19(4), 607-617.
[2] Baumann, H., & Tillman, A. M. (2004). The Hitch Hiker's Guide to LCA. An orientation in life cycle assessment
methodology and application. External organization.
[3] Blackburn, J., & Scudder, G. (2009). Supply chain strategies for perishable products: the case of fresh
produce. Production and Operations Management, 18(2), 129-137.
[4] Central bureau statistic in Indonesia. (2015). Indonesia statictic 2015. Surabaya: Central bureau statistic in Indonesia.
[5] FAO. (2015). FAO Pocket Book World Food and Agriculture. Rome
[6] Garnett, T. (2014). Three perspectives on sustainable food security: efficiency, demand restraint, food system
transformation. What role for life cycle assessment?. Journal of Cleaner Production, 73, 10-18.
[7] Gül, S., Spielmann, M., Lehmann, A., Eggers, D., Bach, V., & Finkbeiner, M. (2015). Benchmarking and
environmental performance classes in life cycle assessment—development of a procedure for non-leather shoes in the
context of the Product Environmental Footprint. The International Journal of Life Cycle Assessment, 20(12), 1640-
1648.
[8] Hawkins, T. R., Singh, B., Majeau‐Bettez, G., & Strømman, A. H. (2013). Comparative environmental life cycle
assessment of conventional and electric vehicles. Journal of Industrial Ecology, 17(1), 53-64.
[9] uijbregts . . ellweg . rischknecht . endriks . . ungerb hler . endriks . . .
Cumulative energy demand as predictor for the environmental burden of commodity production. Environmental
science & technology, 44(6), 2189-2196.
https://doi.org/10.15242/DiRPUB.DIR1217206 86

[10] Kementrian Kelautan dan Perikanan. (2011). Renstra 2011-2014, BKIPM dan Keamanan Hasil Perikanan. Jakarta.
Dalam Sari, F. N. I. 2012. Analisis Bioekonomi Untuk Pemanfaatan Sumberdaya Rajungan (Portunus pelagicus) di
Teluk Banten, Kabupaten Serang, Provinsi Banten [Skripsi]. Fakultas Perikanan dan Ilmu Kelautan, Institut Pertanian
Bogor, .Bogor, 82 hlm
[11] Ministry of housing spatial planning and the environment. 2000. Eco-indicator 99.
[12] cavarda . chiavo G. orzenowski . The perishable supply chain management: The clients’ expectation
factors at the chicken supply chain.
https://doi.org/10.15242/DiRPUB.DIR1217206 87


