Licking County Energy Summit Pat O’Loughlin Buckeye Power Powering the Future of the Region’s...
11
Licking County Energy Summit Pat O’Loughlin Buckeye Power Powering the Future of the Region’s Economy
-
Upload
tyler-neal -
Category
Documents
-
view
216 -
download
0
Transcript of Licking County Energy Summit Pat O’Loughlin Buckeye Power Powering the Future of the Region’s...

Licking County
Energy Summit
Pat O’Loughlin
Buckeye Power
Powering the Future of the Region’s Economy

Buckeye System Highlights• Serves approximately 390,000
member-consumers• Generating Capacity
– 1,621 MW Coal • Cardinal – 1,215 MW• OVEC – 406 MW
– 650 MW Natural Gas• Mone – 450 MW• Greenville – 200 MW
– 94 MW Renewables• Hydro, wind, biomass
• Peak Demand – 1,622 MW• $2.0 Billion Assets (12/31/11)• $348 M Equity (12/31/11)
2

Cardinal Station
3

PJM Footprint 1/1/2012
165,000 MW Load185,000 MW Generation22% U.S. Electricity

EPA Train Wreck• CSAPR Final Rule Issued
– Ohio coal EGUs reduce SO2 95%+ – Ohio EGUs reduce NOx 90%– Stayed by DC Appeals Court 12/30/2011– Hearing scheduled for April, 2012
• Final MATS Rule Issued– Effective 2015 - 90%+ reduction of mercury and other
air toxics
• Proposed coal ash, water effluent and water intake rules pending
• GHG Rule under development
5

EPA Train Wreck• FE announces 3,349 MW of OH, PA and
WV coal plants to close in 2012• AEP moving forward with retirement of
6,000 MW of midwest coal plants• MISO says 63,000 MW of coal plants
require outages for scrubbers• PJM says 30,000 MW of coal plants at risk• FERC says no comprehensive reliability
studies have been completed• EPA says no reliability concerns
6
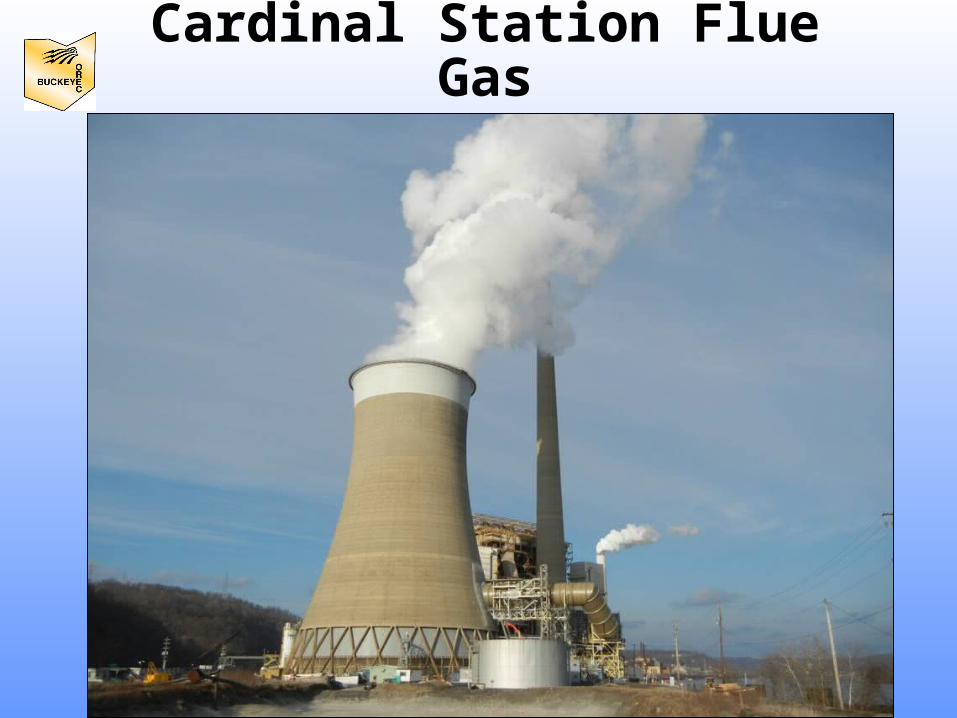
Cardinal Station Flue Gas

Buckeye Environmental Investment• All Buckeye owned coal-fired generating plants
will be equipped with state-of-the-art environmental controls by early 2013– Cardinal completed U2 (2007) & U3 (2012)– OVEC - Kyger Creek (2012) & Clifty Creek (2013)
• Total Buckeye investment on these environmental and related projects from 2002-2013 will be $1.26 billion
• Approximately 20% of cost to produce power for cooperative consumers
• Resume use of Ohio Valley coal

U. S. Coal Price Increases
9
1994
1995
1996
1997
1998
1999
2000
2001
2002
2003
2004
2005
2006
2007
2008
2009
2010
2011
$0.00
$0.50
$1.00
$1.50
$2.00
$2.50
$3.00
US Coal Price - $/MMBTU
1994 – 20041% Increase
2004 – 201179% Increase

Fuel Costs for Electric Generation($/MMBTU)
10
1994
1995
1996
1997
1998
1999
2000
2001
2002
2003
2004
2005
2006
2007
2008
2009
2010
2011
$0.00$1.00$2.00$3.00$4.00$5.00$6.00$7.00$8.00$9.00
$10.00
Nat. Gas Coal

Growing Renewable Resource Mix
11