LIBRARY BUDGET PREDICTIONS FOR 2012 - Publishers Communication
37
LIBRARY BUDGET PREDICTIONS FOR 2012
Transcript of LIBRARY BUDGET PREDICTIONS FOR 2012 - Publishers Communication

LIBRARY BUDGET PREDICTIONS FOR 2012

Contents
List of Tables ................................................................................................................................................................. 1
Executive Summary ...................................................................................................................................................... 2 What was done ........................................................................................................................................................... 2 Summary of Results ................................................................................................................................................... 2
Who was surveyed........................................................................................................................................................ 4 Sample Frame ............................................................................................................................................................ 6
Length of Impact of the Economic Crisis ................................................................................................................... 7
Overall Library Expenditure ......................................................................................................................................... 8 Overall Library Budget Broken Down ......................................................................................................................... 8 Overall Library Budget Change for 2012 .................................................................................................................... 8
Materials Expenditure ................................................................................................................................................ 11 Materials Budget Change for 2012 ........................................................................................................................... 11 Expenditure of Materials Budget on Electronic Information Sources ....................................................................... 13 Materials Budget Change to 2015 ............................................................................................................................ 14
Serials Expenditure .................................................................................................................................................... 15 Serials Budget Change for 2012 .............................................................................................................................. 17 Reasons for Decrease in Serials Budget ................................................................................................................. 19 Reasons for Increase in Serials Budget ................................................................................................................... 19 Plans for Serial Additions and Cancellations............................................................................................................ 19 Electronic Journals and Breakdown of Serial Subscription into Format Type ......................................................... 21 Expenditure on Electronic Serials ............................................................................................................................ 23 E-Journal Budgets .................................................................................................................................................... 24
Abstracting and Indexing Services ........................................................................................................................... 25
Books Expenditure ..................................................................................................................................................... 26 Books Budget Change for 2012 ............................................................................................................................... 26 New Books in 2011 ................................................................................................................................................... 28 Percentage of Books Budget Spent on Electronic Books in 2011 ........................................................................... 28
Major Reference Works .............................................................................................................................................. 29 Major Reference Works – Predicted Change for 2012 ............................................................................................ 29 Reasons Why the Number of MRWs is Likely to Change in 2012 ........................................................................... 29 Major Reference Works Formats Being Purchased ................................................................................................. 31
Institutional Repositories ........................................................................................................................................... 32 How Information in Repositories is Stored ............................................................................................................... 32 How Information in Repostiories is Maintained ........................................................................................................ 33 Growth of Institutional Repositories .......................................................................................................................... 33
Inter-Library Loans (ILLS) .......................................................................................................................................... 34

© 2012 Publishers Communication Group, Inc., 875 Massachusetts Avenue, 7th Floor, Cambridge, MA 02139 - (617) 497-6514.
Reproduction strictly prohibited | 1
LIST OF TABLES
Table 1: Budget % Change by Type of Institute .................................................................................................................... 2 Table 2: Average number of Members and Students by Type of Institute ................................................................................ 4 Table 3: Consortia Membership........................................................................................................................................... 5
Table 4: Institutional Repository Ownership .......................................................................................................................... 5
Table 5: Breakdown of Sample by Country and Type of Institute ............................................................................................ 6
Table 6: Overall Library Budget Change for 2012 ................................................................................................................ 10
Table 7: Material Budget Change for 2012 ......................................................................................................................... 12
Table 8: Percentage Expenditure on Electronic Information Resources ................................................................................. 13
Table 9: Materials Budget Change 2015 ............................................................................................................................ 14
Table 10: Ave. Serial Cost for ARL Institutes Reporting in the Year of Estimation .................................................................. 16
Table 11: Serials Budget Change for 2012 ......................................................................................................................... 18
Table 12: Serials Additions in 2012 .................................................................................................................................... 20
Table 13: Breakdown of Serials Subscriptions into Format Type in 2011 ............................................................................... 22
Table 14: Percentage of Serials Expenditure on Electronic Serials (Current year) .................................................................. 23
Table 15: Books Budget Change for 2012 .......................................................................................................................... 27
Table 16: Book Purchasing in 2011 Compared to 2010 ....................................................................................................... 28
Table 17: Average Number of Books in 2011 per Institute Type ........................................................................................... 28
Table 18: Library Book Budget - % Spent on Electronic Books ............................................................................................. 28
Table 19: MRW Budget Change for 2012 ........................................................................................................................... 30
Table 20: Purchasing Patterns for MRWs by Region and Organisation (up to Current Year) ................................................... 31
Table 21: Usage of Institutional Repositories ...................................................................................................................... 32
Table 22: Usage of Institutional Repositories ...................................................................................................................... 32
Table 23: Usage of Institutional Repositories ...................................................................................................................... 33
Table 24:Responsibility for Maintaining Repositories .......................................................................................................... 33
Table 25: Accessibility of Repositories ............................................................................................................................... 33
Table 26: Number of ILLs Change for 2012 ........................................................................................................................ 34

Library Budget Survey - 2012
© 2012 Publishers Communication Group, Inc., 875 Massachusetts Avenue, 7th Floor, Cambridge, MA 02139 - (617) 497-6514.
Reproduction strictly prohibited | 2
EXECUTIVE SUMMARY
WHAT WAS DONE
A global telephone survey was carried out at 509 institutional libraries. Institutes in North America, South America, Europe and Asia Pacific Region were contacted.
Senior librarians with control over and knowledge of library budgets for 2012 were contacted.
Some librarians could only give broad indications as to what they expected to occur in regard to next year’s budget.
Academic institutions were split into categories reflecting the size of their institute.
Telephone survey was conducted in August 2011
SUMMARY OF RESULTS
The economic turmoil continues to impact libraries around the world; the threat of a double-dip recession hangs over some of the world’s major economies. Consequently, many institutes in respect to their library spending are adopting a cautious approach. Overall budgets are expected to increase, albeit marginally by 0.2%, last year a drop was forecast (-0.1%). Although this relative change suggests that the worst of the economic crisis may have passed, librarians are conscious that the effects of inflation are eroding their purchasing power to lower levels. The impact of the crisis across different regions and various components of the library budget are a little mixed: materials budgets are predicted to increase, albeit by 0.3%, the main constituent part of this budget, serials, is set to rise by a slightly higher amount 0.5%. To accommodate this, it would appear that books budgets are being squeezed and are forecast to drop (-0.1%). As well as cutting books, librarians are also utilizing other parts of their budget. In North America 1 serials are often protected at the expense of salaries. When you examine change at the regional level more differences emerge. Both Europe and North America predict overall decreases across all library budget areas. Europeans predict the largest decrease in the overall budget (-1.3%), austerity measures will impact the Eurozone, a consequence of the sovereign debt crisis. North America’s predictions are an improvement on last year’s, but it is clear the economic position of the US is having an adverse effect. Many states in the US are running at a deficit and a substantial proportion of public institutes' 2 income is derived from state budgets. Private institutes while less dependent on state funding, have greater exposure to the markets, and here poorer than expected economic growth has impacted their investments and endowments, In this year’s survey we asked librarians to estimate slightly further into future. We asked them to predict by how much they thought the materials budget would change by 2015. Overall, librarians estimate that their materials budget would increase by 1.8% from 2012 levels. The key findings of the study are:
Table 1: Budget % Change by Type of Institute
NB: At a base size of 509, error margin is ±3.7. At base sizes of around 100, the error margin is ±5.8. Arrows green or red indicate change greater than 0.5%
1 Source Association of Research Libraries statistics
2 Source NSF http://www.nsf.gov/statistics/seind10/tables.htm and NCES http://nces.ed.gov/

Library Budget Survey - 2012
© 2012 Publishers Communication Group, Inc., 875 Massachusetts Avenue, 7th Floor, Cambridge, MA 02139 - (617) 497-6514.
Reproduction strictly prohibited | 3
When reviewing the results of this survey while knowing the absolute increases is valuable, what is important are the relative differences between regions, budgets and institute types, and how your own institute might compare to these regional or institute type average figures.
Overall library budgets are set to increase by 0.2% (last year a -0.1% decrease was forecast).
Europe predicts the biggest decrease (-1.3%), North America is the only other region to predict an overall decrease (-0.2%).
Asia Pacific is moving in the opposite direction with a 2.6% increase .This is the fourth successive year that librarians in the Asia Pacific region have predicted an increase of 2% or above.
South America forecasts a 0.6% increase for the second year running. (n.b.: our respondent base for South America is 35, so these figures should be treated with caution). Emerging countries predict a 3.6% increase (see p6 for details of countries).
26% of institutes expect their budget to increase, 51% to remain static, 23% to decrease.
Materials budgets (all information content provision) are predicted to increase by 0.3% (last year saw a forecast of a 0.1% increase).
This breaks down into a 1.0% decrease for Europe (same as last year) and a 0.5% decrease for North America, a slight improvement on last year’s forecast (-1.2%). In contrast both Asia Pacific and South America will see increases of 2.8% and 0.6% respectively. The emerging countries group predicts a 3.3% increase.
28% of institutes predict an increase, 49% remain static, 22% predict a decrease.
Of those institutes expecting a decrease in their materials budget, the key reason was to due to a reduction in funding.
It is estimated that approximately 49.6% of the library materials budget is spent on electronic information sources (up 0.3%)
Looking ahead to the 2015 materials budget, overall, institutes expect their budget to increase by 1.8% compared to 2012.
Serials budgets are forecast to increase by 0.5% (last year a 0.3% decrease was predicted)
North America, however will drop by 0.1% (a decrease of 0.6% was forecast last year). Europeans anticipate a decrease of 0.2% (last year a decrease of 0.5% was forecast). In contrast, South America predicts an increase of 0.4%. Asia Pacific has the highest forecast with a 2.3% increase, which is an improvement on last year’s prediction of a 0.1% increase. Emerging countries estimate that their serials spend will increase by 2.1%
34% of institutes predict an increase in budget, 45% to remain static and 19% to decrease.
A reduction in available funds was the main reason given by those who expect their serials budget to decrease.
The Library Journal periodical survey (see p15) indicates that the cost of an average serial increased 7.6%, an analysis of ARL serial expenditure suggests that the average serial cost actually dropped by 7%.
Book expenditure is forecast to decrease by 0.1% (an increase of 0.7% was predicted last year).
Two regions predict a decrease: North America down 2.4% (last year -1.1%) and Europe by 0.8% (last year predicted a 1.0% increase).
South America predicts that their budget will remain static. This continues the recovery to their books budget after a decrease of 25.7% was forecast for the 2010 budget and a 0.9% decrease for 2011.
Asia Pacific and the emerging countries group both predict increases (3.7% and 3.8% respectively).
The majority (54%) of institutes believe their budgets will remain static. 23% predict that budget expenditure for 2012 will decrease while 23% predict an increase.
The number of Major Reference Works (MRWs) to be purchased in 2012 is set to decrease by -1.4% (last year was a predicted decrease of -2.4%). Only Asia Pacific and the emerging countries are predicting an increase (1.5% and 0.7% respectively). North America has the worst forecast, with a -3.1% decrease.
E-Journal services 98% of institutes take an e-journal service (static compared to last year). E-only journals continue to represent 56% of journal subscriptions. Institutes still take a reasonable portion of their subscriptions in print only form (22%), while the remainder (22%) is part of a combined print and electronic package.
43% of those with E-journal services have a separate budget for them, the majority of which (51%) are predicted to increase in 2012. The average budget change for e-journals is a 3.1% increase.
A&I Services are provided by 84% of institutes. 20% have a separate budget which is forecast to increase by 0.1% (last year an increase of 1.8% was forecast).

Library Budget Survey - 2012
© 2012 Publishers Communication Group, Inc., 875 Massachusetts Avenue, 7th Floor, Cambridge, MA 02139 - (617) 497-6514.
Reproduction strictly prohibited | 4
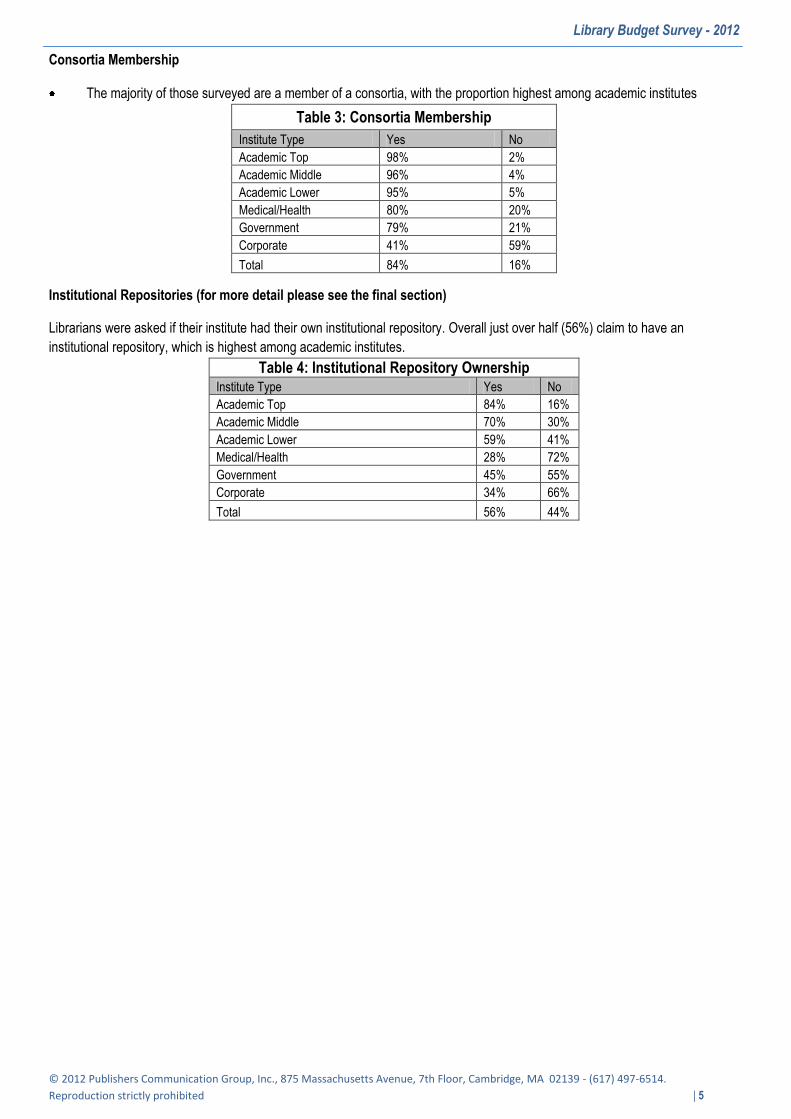
Institutional Repositories – These are fairly widespread with just over half (56%) of institutes either owning or sharing ownership. This figure rises to 84% for top academic institutes. Research articles continue to be the most commonly stored information type, with 87% of repositories holding them. In terms of content expansion, 41% felt that the repository was growing fast and 7% that it was growing very fast.
WHO WAS SURVEYED
Altogether 509 institutes were successfully surveyed, from a range of countries and institute types
This provides a 3.7%± confidence interval at 90% confidence levels with the variance we have been seeing; however it must be borne in mind that the estimates made by some librarians are indications, rather than the known budgeted amount.
Librarians who were surveyed last year were approached again this year to take part in the survey.
The survey was completed in North America, South and Mid-America, Europe and the Asia Pacific Region.
Institutions were chosen from North America (USA, Canada), South America (Argentina, Brazil, Chile, Columbia, Mexico, Venezuela), Europe (20 countries) and Asia Pacific (9 countries). Since the 2009 survey, we have included a category, ‘emerging countries’, which cuts across geography (see next section for countries included in this group).
Librarians were asked to quantify the number of members for the library. The average results by region and institute type are in the table opposite.
Europe – Austerity measures hit
2012 (change)
Overall -1.3%
Materials -1.0%
Serials -0.2%
Books -0.8%
North America – Slow recovery
2012 (change)
Overall -0.2%
Materials -0.5%
Serials -0.1%
Books -2.4%
Asia Pacific - Budgets buoyant
2012 (change)
Overall 2.6%
Materials 2.8%
Serials 2.3%
Books 3.7%
South America – Cautious recovery
2012 (change)
Overall 0.6%
Materials 0.6%
Serials 0.4%
Books 0.0%
Table 2: Average number of Members and Students by Type of Institute
Region Level Members/Users
North America
Academic top 26,136
Academic middle 16,093
Academic lower 5,912
Medical/Health 5.024
Government 2,605
Corporate 13,202
Europe
Academic top 29,453
Academic middle 15,833
Academic lower 7,685
Medical/Health 7,188
Government 4,784
Corporate 7,752
Asia Pacific
Academic top 33,068
Academic middle 17,419
Academic lower 5,135
Medical/Health 4,920
Government 963
Corporate 3,273
South America
Academic top 35,833
Academic middle 17,813
Academic lower 4,714
Medical/Health 3,929
Government 21,625
Corporate 15,375
Library Budget Survey - 2012
© 2012 Publishers Communication Group, Inc., 875 Massachusetts Avenue, 7th Floor, Cambridge, MA 02139 - (617) 497-6514.
Reproduction strictly prohibited | 5
Consortia Membership
The majority of those surveyed are a member of a consortia, with the proportion highest among academic institutes
Table 3: Consortia Membership
Institute Type Yes No
Academic Top 98% 2%
Academic Middle 96% 4%
Academic Lower 95% 5%
Medical/Health 80% 20%
Government 79% 21%
Corporate 41% 59%
Total 84% 16%
Institutional Repositories (for more detail please see the final section)
Librarians were asked if their institute had their own institutional repository. Overall just over half (56%) claim to have an
institutional repository, which is highest among academic institutes.
Table 4: Institutional Repository Ownership
Institute Type Yes No
Academic Top 84% 16%
Academic Middle 70% 30%
Academic Lower 59% 41%
Medical/Health 28% 72%
Government 45% 55%
Corporate 34% 66%
Total 56% 44%

Library Budget Survey - 2012
© 2012 Publishers Communication Group, Inc., 875 Massachusetts Avenue, 7th Floor, Cambridge, MA 02139 - (617) 497-6514.
Reproduction strictly prohibited | 6
SAMPLE FRAME
The sample frame was constructed into several organisation types: Academic, Corporate, Medical and Government - the Academic sector was further split into three groups based upon size of the institute. The breakdown by country and type is in the table below. Emerging countries are a grouping introduced in 2009 and are a subset of countries that cross the below geographical categories and includes: India, China, Czech Republic, Hungary, Poland, Romania, Russia, Argentina, Brazil, Chile, Columbia, Mexico and Venezuela.
Table 5: Breakdown of Sample by Country and Type of Institute
Region Country
Academic
Corp. Gov't Medical Total
% of overall sample top middle lower
Asia Pacific
Australia 3 3 0 1 1 1 9 2%
China 7 7 8 3 2 4 31 6%
HK 1 1 1 0 0 0 3 1%
India 3 3 2 3 1 2 14 3%
Japan 2 11 13 10 6 9 51 10%
Korea 2 2 2 3 1 2 12 2%
Malaysia 1 1 1 0 0 0 3 1%
New Zealand 1 1 1 0 0 0 3 1%
Taiwan 2 2 3 2 1 2 12 2%
Total 22 31 31 22 12 20 138 27%
Europe
Austria 2 0 1 0 0 1 4 1%
Belgium 1 1 1 1 1 1 6 1%
Czech Republic 1 1 1 1 1 0 5 1%
Denmark 1 1 1 1 1 1 6 1%
Finland 1 1 1 0 0 1 4 1%
France 2 4 3 3 3 3 18 4%
Germany 4 5 3 5 3 3 23 5%
Hungary 1 1 1 1 1 1 6 1%
Ireland 1 1 1 0 0 1 4 1%
Israel 1 1 1 0 0 1 4 1%
Italy 2 4 3 2 2 2 15 3%
Netherlands 2 0 1 1 1 1 6 1%
Poland 2 2 1 1 1 1 8 2%
Portugal 1 2 0 0 0 1 4 1%
Romania 1 0 2 0 0 0 3 1%
Russia 1 2 3 1 1 0 8 2%
Spain 3 1 2 2 2 2 12 2%
Sweden 1 1 1 1 1 1 6 1%
Switzerland 1 1 1 1 1 1 6 1%
UK 3 4 5 4 3 3 22 4%
Total 32 33 33 25 22 25 170 33%
North America
Canada 1 4 4 2 2 2 15 3%
USA 32 23 26 20 18 32 151 30%
Total 33 27 30 22 20 34 166 33%
South America
Argentina 2 2 2 1 1 1 9 2%
Brazil 2 2 2 1 1 2 10 2%
Chile 1 1 1 0 0 1 4 1%
Colombia 1 1 1 0 0 1 4 1%
Mexico 2 1 0 0 0 1 4 1%
Venezuela 1 1 1 0 0 1 4 1%
Total 9 8 7 2 2 7 35 7%
Grand Total 96 99 101 71 56 86 509 100%
Overall % 19% 19% 20% 14% 11% 17% 100%

Library Budget Survey - 2012
© 2012 Publishers Communication Group, Inc., 875 Massachusetts Avenue, 7th Floor, Cambridge, MA 02139 - (617) 497-6514.
Reproduction strictly prohibited | 7
LENGTH OF IMPACT OF THE ECONOMIC CRISIS
Most librarians believe that effects of the current down-turn will last until the end of next year, it was a similar picture last year, but given the recent economic turmoil it is not surprising that librarians are re-evaluating the length of impact.
Overall, 26% of librarians say that the economic crisis has had no impact on their budget
Figure 1

Library Budget Survey - 2012
© 2012 Publishers Communication Group, Inc., 875 Massachusetts Avenue, 7th Floor, Cambridge, MA 02139 - (617) 497-6514.
Reproduction strictly prohibited | 8
OVERALL LIBRARY EXPENDITURE
OVERALL LIBRARY BUDGET BROKEN DOWN
The overall library budget includes the ongoing costs of maintaining a library, salary, materials and operating expenditure.
By examining the Association of Research Libraries (ARL) expenditure we can get an idea of how library budgets breakdown.
The ARL statistics include details of collections, expenditures, staffing, and service activities for its member libraries and the majority of the libraries are large North American academic institutes.
For 2010 the 114 members of the ARL reported a combined expenditure of $3.2 billion. This expenditure broke down into four areas: salaries (45%), materials (42%), binding (1%) and other operating expenditures (11%) made up the remainder of the budget. It is worth noting that salaries have been sacrificed for materials. As a portion of overall library expenditure salaries have dropped by 6% since 1991, while materials have increased by 9% (operating and binding expenses reduced to make up the remainder of the increase).
The materials budget further broke down into serials expenditure (68%), books expenditure (20%) with the remaining being allocated to miscellaneous expenditure or other materials. (NB this split is based upon 81 institutes reporting on all elements of the budget)
Figure 2
OVERALL LIBRARY BUDGET CHANGE FOR 2012
% Change: After back to back predicted decreases for the overall library budget for 2010 and 2011 the picture for 2012 looks a little brighter, but only just, with a predicted 0.2% increase in overall budgets.
o Region: Although still predicting a decrease in budget (-0.2%), the position in North America has improved compared to last year, when a 1% drop was forecast. In Europe librarians also predict a decrease (-1.3%), which is very slightly worse than last year (-1.2%). In contrast both South America and Asia Pacific predict increases (0.6% and 2.6% respectively), while the emerging countries forecast the highest increase of 3.6%.
o Type of institute: Academic markets expect a 0.2% increase overall, North American and European academics predict their budgets to shrink more (-0.6% and -1.7% respectively). Asia Pacific shows strong performance a 3.1% increase as do academic institutes in emerging countries (3.7% although it should be noted that this is down 0.9% on last year’s figure).

Library Budget Survey - 2012
© 2012 Publishers Communication Group, Inc., 875 Massachusetts Avenue, 7th Floor, Cambridge, MA 02139 - (617) 497-6514.
Reproduction strictly prohibited | 9
Qualitative predictions: (see table 7) suggest that the majority of institutions (51%) believe their budget will remain static. A higher percentage of institutions predict increases than decreases (26% compared to 23%). Government institutes expect the largest decline of -1.9% with 29% expecting a decrease. Although a higher proportion of academic middle institutes predict a decrease (34%), the mean percentage change is lower at -0.7%. The sector likely to be hardest hit is North American government: a -4.6% decrease is predicted here.
Figure 3 Figure 4
Figure 5

Library Budget Survey - 2012
© 2012 Publishers Communication Group, Inc., 875 Massachusetts Avenue, 7th Floor, Cambridge, MA 02139 - (617) 497-6514.
Reproduction strictly prohibited | 10
Table 6: Overall Library Budget Change for 2012
Qualitative Predictions Quantitative Predictions
% respondents predicting
Region Organisation Increase Static Decrease % Budget Change
North America
Academic Top 27% 45% 27% -0.8
Academic Middle 22% 37% 41% -3.1
Academic Lower 43% 40% 13% 2.1
All Academic 31% 41% 27% -0.6
Medical/Health 35% 53% 12% 1.6
Government 15% 45% 40% -4.6
Corporate 36% 59% 5% 2.5
Overall 31% 46% 22% -0.2
Europe
Academic Top 16% 47% 38% -2.0
Academic Middle 18% 39% 42% -1.7
Academic Lower 9% 64% 24% -1.4
All Academic 14% 50% 35% -1.7
Medical/Health 4% 56% 36% -2.1
Government 23% 55% 23% -1.1
Corporate 16% 72% 8% 1.0
Overall 14% 55% 29% -1.3
Asia Pacific
Academic Top 50% 32% 18% 3.7
Academic Middle 26% 45% 29% 2.0
Academic Lower 39% 42% 19% 3.7
All Academic 37% 40% 23% 3.1
Medical/Health 35% 55% 10% 4.8
Government 42% 33% 25% 0.4
Corporate 36% 55% 9% 0.0
Overall 37% 44% 19% 2.6
South America
Academic Top 44% 56% 0% 2.2
Academic Middle 13% 88% 0% 0.6
Academic Lower 0% 100% 0% 0.0
All Academic 21% 79% 0% 1.0
Medical/Health 0% 71% 29% -1.4
Government 50% 50% 0% 2.5
Corporate 0% 100% 0% 0.0
Overall 17% 77% 6% 0.6
Emerging Countries
Academic Top 44% 48% 8% 3.5
Academic Middle 38% 54% 8% 4.0
Academic Lower 28% 48% 20% 3.6
All Academic 36% 50% 12% 3.7
Medical/Health 27% 60% 13% 4.9
Government 44% 44% 11% 3.9
Corporate 42% 50% 8% 0.9
Overall 36% 51% 12% 3.6
Overall
Academic Top 30% 44% 26% 0.1
Academic Middle 21% 44% 34% -0.7
Academic Lower 28% 52% 18% 1.3
All Academic 26% 47% 26% 0.2
Medical/Health 23% 56% 20% 1.0
Government 25% 46% 29% -1.9
Corporate 28% 63% 7% 1.1
Overall 26% 51% 23% 0.2

Library Budget Survey - 2012
© 2012 Publishers Communication Group, Inc., 875 Massachusetts Avenue, 7th Floor, Cambridge, MA 02139 - (617) 497-6514.
Reproduction strictly prohibited | 11
MATERIALS EXPENDITURE
MATERIALS BUDGET CHANGE FOR 2012
The material budget covers all the costs a library incurs when purchasing content for the library, including journal subscriptions, book costs, inter-library loans etc.
% Change: Overall material budgets are set to increase in 2012 by 0.3% (last year was a 0.1% increase). o Region: North America is predicted to suffer a -0.5% decrease; whilst Europe has the least positive outlook with a -
1.0% decrease. The Emerging countries grouping perform strongly with a predicted 3.7% increase. Asia Pacific region is forecasting an increase of 2.8%, followed by South America at 0.6%.
o Type of institute: Academic libraries follow a similar pattern, with a 0.3% mean increase (last year was also a 0.3% increase). As with overall budgets, Asia Pacific and Emerging countries are healthiest, with predicted increases of 3.3% and 4.1% respectively. As with the overall budget, Government institutes are predicting the largest decrease (-1.5%). Academic Middle is the only other sector to predict a decrease (-0.7%)
Qualitative predictions: suggest that 28% of institutes will see an increase in their budget with the majority, as is the case with the overall budget, believing their budget will remain static. The number of institutes forecasting a drop in budget for 2012 is 22%. o Region: Europe has the highest number of institutes predicting a decrease (32%), followed by North America
(22%). In South America, only the medical sector anticipates a decrease. o As in the previous two years, the most optimistic region is Asia Pacific, with 41% predicting an increase (a 6%
rise on last year). o Type of institute: Although the academic institutes in the Asia Pacific region have a lesser proportion of predicted
increases (39%) when compared to the region’s average, this is still markedly higher than the proportions for other regions. Just 20% of European academic institutes expect an increase, but this is an improvement on last year’s figure of 14%.
Reasons for change: In terms of reasons why budgets are decreasing, institutes report that it is mostly due to reduction in funding. As for budget increases, most common reasons include the inflation of prices for materials, and the acquisition of new subscriptions.
Figure 6 Figure 71
Figure 8

Library Budget Survey - 2012
© 2012 Publishers Communication Group, Inc., 875 Massachusetts Avenue, 7th Floor, Cambridge, MA 02139 - (617) 497-6514.
Reproduction strictly prohibited | 12
Table 7: Material Budget Change for 2012
Qualitative Predictions Quantitative Predictions
% respondents predicting
Region Organisation Increase Static Decrease % Budget Change
North America
Academic Top 33% 45% 21% -0.8
Academic Middle 15% 48% 37% -3.0
Academic Lower 37% 50% 13% 1.8
All Academic 29% 48% 23% -0.6
Medical/Health 38% 44% 18% 1.7
Government 10% 45% 45% -5.0
Corporate 23% 64% 5% 1.0
Overall 28% 49% 22% -0.5
Europe
Academic Top 19% 41% 41% -1.9
Academic Middle 18% 39% 42% -1.8
Academic Lower 24% 42% 33% -1.2
All Academic 20% 41% 39% -1.6
Medical/Health 16% 48% 32% -0.6
Government 18% 59% 23% -0.5
Corporate 16% 68% 12% 0.8
Overall 19% 48% 32% -1.0
Asia Pacific
Academic Top 55% 32% 14% 5.0
Academic Middle 35% 52% 13% 2.2
Academic Lower 32% 48% 16% 3.3
All Academic 39% 45% 14% 3.3
Medical/Health 50% 35% 15% 2.4
Government 50% 17% 25% 2.0
Corporate 36% 55% 9% 1.4
Overall 41% 43% 14% 2.8
South America
Academic Top 44% 56% 0% 2.2
Academic Middle 13% 88% 0% 0.6
Academic Lower 0% 100% 0% 0.0
All Academic 21% 79% 0% 1.0
Medical/Health 0% 71% 29% -1.4
Government 50% 50% 0% 2.5
Corporate 0% 100% 0% 0.0
Overall 17% 77% 6% 0.6
Emerging Countries
Academic Top 52% 40% 8% 4.6
Academic Middle 42% 50% 8% 3.9
Academic Lower 24% 56% 16% 3.7
All Academic 39% 49% 11% 4.1
Medical/Health 40% 47% 13% 2.9
Government 33% 44% 11% 3.8
Corporate 42% 50% 8% 2.5
Overall 39% 48% 11% 3.7
Overall
Academic Top 34% 42% 24% 0.5
Academic Middle 22% 49% 28% -0.7
Academic Lower 29% 50% 20% 1.1
All Academic 28% 47% 24% 0.3
Medical/Health 31% 45% 22% 0.9
Government 23% 45% 30% -1.5
Corporate 24% 63% 8% 1.0
Overall 28% 49% 22% 0.3

Library Budget Survey - 2012
© 2012 Publishers Communication Group, Inc., 875 Massachusetts Avenue, 7th Floor, Cambridge, MA 02139 - (617) 497-6514.
Reproduction strictly prohibited | 13
EXPENDITURE OF MATERIALS BUDGET ON ELECTRONIC INFORMATION SOURCES
The below figures do not represent a prediction, but an estimate of spend on electronic resources during the year the survey was conducted.
With the exception of Europe, all regions have increased their percentage spend on electronic resources. Overall, the percentage spend is roughly on a par with last year (up 0.3%)
At organisation level, Academic Top re-establishes its position as the sector with highest take-up as Corporate drops 2.8%
Regionally, North America has by far the highest proportion of spend on electronic information resources. At 60.4%, it is 12% ahead of the nearest rival (Asia Pacific).
Table 8: Percentage Expenditure on Electronic Information Resources
Region Organisation %
(2004) %
(2005) %
(2006) %
(2007) %
(2008) %
(2009) %
(2010) %
(2011)
North America
Academic Top 29.6 30.6 30.5 39.1 51.3 60.2 61.3 64.0
Academic Middle 26.4 34.5 31.5 37.1 54.3 52.2 64.4 65.6
Academic Lower 27.7 23.1 25.1 23.4 44.2 44.6 50.5 49.6
Medical/Health 29.5 30.1 33.1 34.2 39.3 46.4 54.8 59.1
Government 29.9 34.7 32.5 51.4 43.6 52.7 50.9 62.6
Corporate 38.5 45.5 39.9 48.8 48.1 54.1 72.0 62.2
Overall 29.7 31.4 31.4 37.2 47.7 51.2 58.8 60.4
Europe
Academic Top 27.8 38.2 27.9 45.7 43.5 44.5 50.5 46.3
Academic Middle 23.4 34.1 34.0 38.3 40.7 40.7 42.9 45.7
Academic Lower 25.6 27.3 31.1 33.8 40.7 41.8 47.2 43.8
Medical/Health 25.5 44.1 38.8 40.0 42.1 36.8 44.7 41.9
Government 33.2 32.6 31.4 45.5 42.5 46.2 46.7 37.8
Corporate 41.5 37.9 45.6 45.3 50.8 31.2 46.9 46.4
Overall 28.5 35.5 34.0 40.7 42.7 40.8 46.4 43.9
Asia Pacific
Academic Top 25.8 30.0 29.8 38.8 37.8 41.4 51.3 53.4
Academic Middle 25.6 38.6 31.3 39.2 28.6 42.8 45.5 48.8
Academic Lower 10.5 26.4 16.3 23.2 39.7 37.5 34.3 42.5
Medical/Health 16.8 15.3 7.6 33.3 54.9 32.7 56.0 43.1
Government 19.1 14.9 31.4 33.0 29.4 28.9 46.3 47.3
Corporate 26.3 19.1 22.6 45.3 29.2 51.7 52.0 55.1
Overall 20.1 25.7 23.5 33.2 39.1 39.4 46.8 48.1
South America
Academic Top 29.4 42.5 40.6 42.9
Academic Middle 29.2 38.6 39.3 40.0
Academic Lower 21.0 23.3 22.5 27.9
Medical/Health 15.0 27.1 27.1 29.9
Government 15.0 15.0 15.5 18.5
Corporate 15.0 15.0 15.5 17.5
Overall 24.2 30.6 30.6 33.8
Emerging
Academic Top 28.9 48.5 40.4 43.5
Academic Middle 33.4 44.0 35.9 39.8
Academic Lower 36.5 39.5 28.7 29.4
Medical/Health 17.5 38.4 37.2 32.5
Government 26.9 41.6 22.8 25.6
Corporate 37.5 42.5 37.7 36.3
Overall 38.0 42.5 34.6 35.8
Overall
Academic Top 28.1 33.5 29.4 41.7 43.7 48.5 53.2 53.7
Academic Middle 24.9 35.4 32.4 38.2 44.3 44.0 49.6 51.6
Academic Lower 20.8 25.5 23.6 27.1 38.9 39.5 42.2 43.9
Medical/Health 24.8 32.9 30.2 36.9 37.0 38.4 49.6 48.1
Government 29.1 28.2 31.7 44.9 41.0 41.6 46.9 47.5
Corporate 36.2 34.0 37.7 46.7 48.8 42.5 55.9 53.1
Overall 27.0 32.0 30.0 38.0 42.0 42.5 49.3 49.6

Library Budget Survey - 2012
© 2012 Publishers Communication Group, Inc., 875 Massachusetts Avenue, 7th Floor, Cambridge, MA 02139 - (617) 497-6514.
Reproduction strictly prohibited | 14
MATERIALS BUDGET CHANGE TO 2015
Respondents were asked to think ahead over to 2015, respondents were asked to predict whether their budget was likely increase year on year, remain static year on year, or decrease year on year or vary (i.e. increase one year, but decrease the following year). Furthermore, respondents were asked to predict by how much the materials budget would have changed by 2015 compared to 2012. It is important to note that it was difficult to answer and while figures have been quoted they are likely to be indicative.
All regions predict an overall increase with the exception of Europe, which predicts a -2.2% decrease. Asia Pacific predicts the largest overall increase of 5.4%, however this seems low given the predicted increase from 2011 to
2012 is 2.8% alone.
Table 9: Materials Budget Change 2015
Qualitative Predictions Quantitative Predictions
% respondents predicting
Region Organisation Increase Same Decrease Vary % Budget Change
North America
Academic Top 48% 27% 3% 12% 4.5
Academic Middle 22% 37% 19% 19% -1.0
Academic Lower 43% 43% 7% 7% 2.5
All Academic 39% 36% 9% 12% 2.1
Medical/Health 44% 38% 6% 6% 5.0
Government 20% 45% 20% 15% -0.7
Corporate 45% 35% 5% 5% 3.9
Overall 38% 37% 9% 10% 2.6
Europe
Academic Top 6% 38% 28% 16% -3.9
Academic Middle 15% 21% 27% 27% -3.2
Academic Lower 12% 27% 24% 15% -2.1
All Academic 11% 29% 27% 19% -3.1
Medical/Health 17% 17% 33% 25% -1.8
Government 14% 18% 18% 23% -2.3
Corporate 25% 25% 8% 21% 1.4
Overall 14% 25% 24% 21% -2.2
Asia Pacific
Academic Top 55% 18% 9% 14% 8.5
Academic Middle 39% 35% 16% 6% 3.9
Academic Lower 43% 30% 13% 13% 7.9
All Academic 45% 29% 13% 11% 6.6
Medical/Health 55% 30% 10% 5% 6.5
Government 36% 36% 27% 0% 0.5
Corporate 45% 36% 9% 5% 2.6
Overall 46% 31% 13% 8% 5.4
South America
Academic Top 44% 56% 0% 0% 6.7
Academic Middle 0% 88% 0% 13% 1.9
Academic Lower 0% 100% 0% 0% 0.0
All Academic 17% 79% 0% 4% 3.1
Medical/Health 0% 71% 29% 0% -3.6
Government 50% 50% 0% 0% 7.5
Corporate 0% 100% 0% 0% 0.0
Overall 14% 77% 6% 3% 1.9
Emerging Countries
Academic Top 52% 28% 4% 16% 6.8
Academic Middle 38% 38% 8% 17% 4.0
Academic Lower 38% 38% 8% 8% 6.7
All Academic 42% 34% 7% 14% 5.8
Medical/Health 27% 40% 13% 20% 4.2
Government 50% 25% 0% 0% 6.3
Corporate 33% 50% 8% 0% -1.0
Overall 40% 36% 7% 12% 4.9
Overall
Academic Top 35% 31% 13% 13% 2.8
Academic Middle 23% 35% 19% 17% -0.1
Academic Lower 30% 38% 14% 11% 2.6
All Academic 29% 35% 15% 14% 1.8
Medical/Health 35% 33% 16% 11% 2.8
Government 22% 33% 20% 15% -0.6
Corporate 37% 34% 7% 10% 2.5
Overall 31% 34% 15% 13% 1.8

Library Budget Survey - 2012
© 2012 Publishers Communication Group, Inc., 875 Massachusetts Avenue, 7th Floor, Cambridge, MA 02139 - (617) 497-6514.
Reproduction strictly prohibited | 15
SERIALS EXPENDITURE
In this section we track several measures drawn from two sources: Library Journal periodical survey3 for the average serial cost, and the Association of Research Libraries (ARL) statistical data for serial expenditure and amounts of serials purchased among North American institutes4.
The ARL in North America annually tracks library expenditure and includes amongst its members some of the largest universities in the USA and Canada. 112 libraries contributed data to the ARL statistics for 2010..
In reference to figure 14 below, until 2002, broadly annual changes in serial expenditure reflect annual changes in average serial costs as tracked in the Library Journal. Although serials expenditure change appears to follow serials cost change, they do so at a lower level. After 2002 the changes are no longer in tandem.
This disconnect is likely due to the impact of a number of factors. It should be borne in mind that the average serial costs produced by the Library Journal are based on catalogue prices. In recent years serials agents and publishers have introduced more and more individualized deals. Consequently the list price of journals rarely reflects the actual cost paid. Since 1997, there have been increases year-on-year in the number of subscriptions taken. The year-on-year increases are likely to be explained by the addition of electronic versions, at modest additional costs, via individualized deals and/or libraries accommodating the purchase of new and cheaper subscriptions through cancellation of a few expensive titles.
Instead of the Library Journal average serial costs, the ARL average serial costs are perhaps more indicative of the true costs incurred by institutes (it is derived by dividing the number of serials purchased by serial expenditure). These figures suggest that the cost paid by institutions per serial has broadly been falling since 2001. In fact the average serial cost in 2010 at $150.78 is the lower than the average price paid in 1991 when it was $151.00 (see table 12).
Figure 9 NB. From 2007 the ARL has changed its method for tracking serials purchased, no longer reporting institutes count the number of subscriptions, but instead unique titles, thus an institute that previously took 3 copies of ‘Nature’ would now be counted as taking 1, this is likely to explain the subsequent decline in the number of serials purchased.
3 http://www.libraryjournal.com/info/CA6435067.html?q=periodical+survey
4 http://interactive.arlstatistics.org/home

Library Budget Survey - 2012
© 2012 Publishers Communication Group, Inc., 875 Massachusetts Avenue, 7th Floor, Cambridge, MA 02139 - (617) 497-6514.
Reproduction strictly prohibited | 16
Table 10: Ave. Serial Cost for ARL Institutes Reporting in the Year of Estimation
Year
No of
Institutes
reporting
Ser Unit Cost:
US$ Mean % Change
1991 76 151.00 9.2%
1992 76 166.16 10.0%
1993 77 185.77 11.8%
1994 81 194.20 4.5%
1995 81 210.71 8.5%
1996 81 231.17 9.7%
1997 81 248.67 7.6%
1998 80 252.82 1.7%
1999 82 261.41 3.4%
2000 83 276.81 5.9%
2001 82 267.13 -3.5%
2002 86 266.82 -0.1%
2003 84 266.87 0.0%
2004 89 270.70 1.4%
2005 88 247.55 -8.6%
2006 89 241.60 -2.4%
2007 101 201.26 -16.7%
2008 107 178.17 -11.5%
2009 108 161.95 -9.1%
2010 112 150.78 -6.9%
NB: ARL institutes reported in table above and in Figure 9 are only those institutes that are universities and have reported values for the number of serials purchased and serial expenditure in a given year.

Library Budget Survey - 2012
© 2012 Publishers Communication Group, Inc., 875 Massachusetts Avenue, 7th Floor, Cambridge, MA 02139 - (617) 497-6514.
Reproduction strictly prohibited | 17
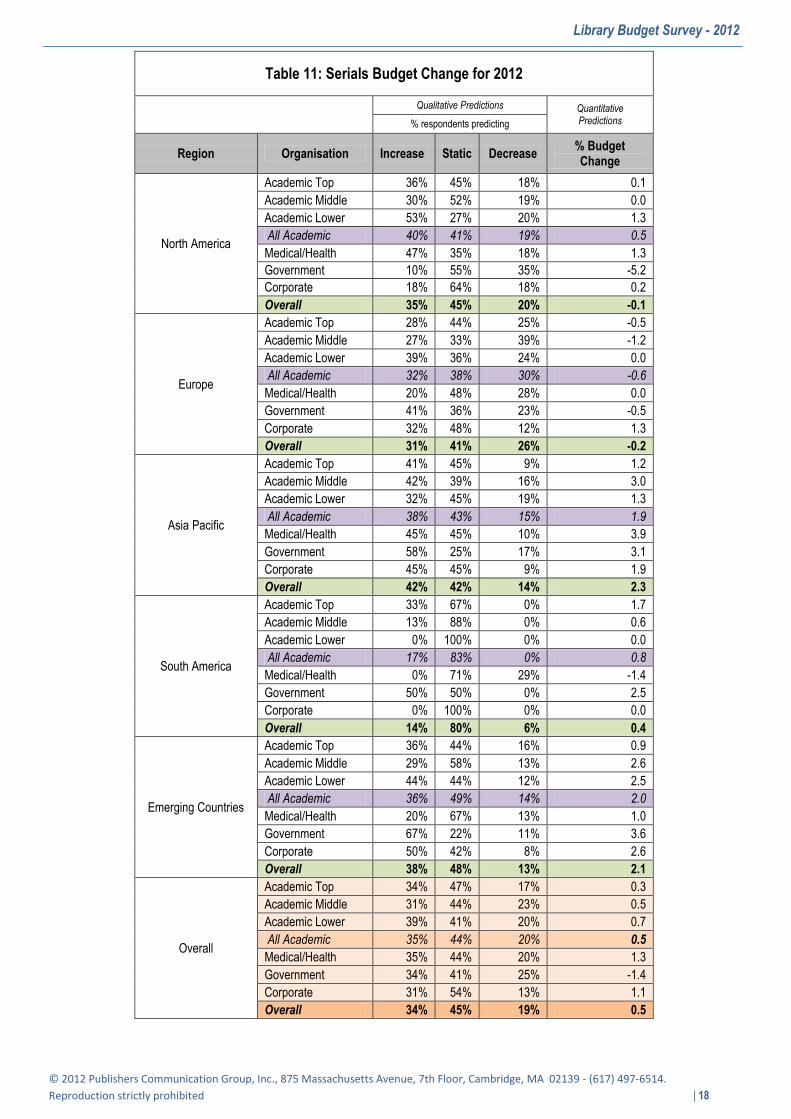
SERIALS BUDGET CHANGE FOR 2012
% Change: The serials budget in 2012 is set to increase by 0.5%, a welcome return to growth after two successive years of decreases. o Region: North America is projecting a decrease of - 0.1% (a decrease of 0.6% was forecast last year) and Europe a
decrease of -0.2% (last year a decrease of -0.5% was forecast). Asia Pacific predicts an increase of 2.3% (last year was 0.1%), while South America predicts an increase of 0.4%.
o Type of institute: Academic institutional budgets are predicted to increase overall by 0.5% (last year forecast 0.1% increase). Academic Top institutes predict the least growth in budgets from the academic sector, with European top academic institutes predicting a drop (-0.5%). Overall, Government budgets will be hardest hit, with a predicted decrease of -1.4%. North American government predicts a -5.2 decrease.
Qualitative predictions: suggest that just over a third of institutes (34%) forecast an increase in their serials budget for 2012 – up 9% from last year. 19% predict a decrease, a slight improvement on last year’s figure of 20%.
Figure 10 Figure 21
Figure 12
Library Budget Survey - 2012
© 2012 Publishers Communication Group, Inc., 875 Massachusetts Avenue, 7th Floor, Cambridge, MA 02139 - (617) 497-6514.
Reproduction strictly prohibited | 18
Table 11: Serials Budget Change for 2012
Qualitative Predictions Quantitative
Predictions % respondents predicting
Region Organisation Increase Static Decrease % Budget Change
North America
Academic Top 36% 45% 18% 0.1
Academic Middle 30% 52% 19% 0.0
Academic Lower 53% 27% 20% 1.3
All Academic 40% 41% 19% 0.5
Medical/Health 47% 35% 18% 1.3
Government 10% 55% 35% -5.2
Corporate 18% 64% 18% 0.2
Overall 35% 45% 20% -0.1
Europe
Academic Top 28% 44% 25% -0.5
Academic Middle 27% 33% 39% -1.2
Academic Lower 39% 36% 24% 0.0
All Academic 32% 38% 30% -0.6
Medical/Health 20% 48% 28% 0.0
Government 41% 36% 23% -0.5
Corporate 32% 48% 12% 1.3
Overall 31% 41% 26% -0.2
Asia Pacific
Academic Top 41% 45% 9% 1.2
Academic Middle 42% 39% 16% 3.0
Academic Lower 32% 45% 19% 1.3
All Academic 38% 43% 15% 1.9
Medical/Health 45% 45% 10% 3.9
Government 58% 25% 17% 3.1
Corporate 45% 45% 9% 1.9
Overall 42% 42% 14% 2.3
South America
Academic Top 33% 67% 0% 1.7
Academic Middle 13% 88% 0% 0.6
Academic Lower 0% 100% 0% 0.0
All Academic 17% 83% 0% 0.8
Medical/Health 0% 71% 29% -1.4
Government 50% 50% 0% 2.5
Corporate 0% 100% 0% 0.0
Overall 14% 80% 6% 0.4
Emerging Countries
Academic Top 36% 44% 16% 0.9
Academic Middle 29% 58% 13% 2.6
Academic Lower 44% 44% 12% 2.5
All Academic 36% 49% 14% 2.0
Medical/Health 20% 67% 13% 1.0
Government 67% 22% 11% 3.6
Corporate 50% 42% 8% 2.6
Overall 38% 48% 13% 2.1
Overall
Academic Top 34% 47% 17% 0.3
Academic Middle 31% 44% 23% 0.5
Academic Lower 39% 41% 20% 0.7
All Academic 35% 44% 20% 0.5
Medical/Health 35% 44% 20% 1.3
Government 34% 41% 25% -1.4
Corporate 31% 54% 13% 1.1
Overall 34% 45% 19% 0.5

Library Budget Survey - 2012
© 2012 Publishers Communication Group, Inc., 875 Massachusetts Avenue, 7th Floor, Cambridge, MA 02139 - (617) 497-6514.
Reproduction strictly prohibited | 19
REASONS FOR DECREASE IN SERIALS BUDGET
Librarians were asked why they believed their budgets had changed.
Altogether 96 librarians gave reasons as to why they thought it had decreased. 68% indicated that it was a reduction in available funds and 25% that it was due to price inflation which rather than reducing their budget directly eroded their purchasing power. 25% also gave the consequence of the shift from print to electronic as a reason for decrease.
REASONS FOR INCREASE IN SERIALS BUDGET
172 librarians were able to specify why their budget had increased. The most often stated reason (55%) was to match journal price inflation and to enable purchasing of new subscriptions in order to meet new demand (38%).
PLANS FOR SERIAL ADDITIONS AND CANCELLATIONS
Many libraries manage their budgets by cancelling and subscribing to different journals in order to minimize costs. It is entirely feasible for an institute to see a decrease in their serials budget but an increase in the number of journals purchased (through the acquisition of more inexpensive titles). Change is often based upon usage data, a desire to streamline particular subjects, or simply cancelling the most expensive titles.
The percentage of institutes cancelling (45%) is equal to those adding (45%). However, the average number of serials added (45) is greater than those cancelled (12).
Asia Pacific shows the highest level of predicted additions (149). This is largely driven by one institute in the medical sector which is planning to add 10,000 journals (this answer was confirmed with a re-contact, although the respondent stated this to be an estimate).
It is difficult to be precise about how institutes go about deciding how to cancel titles, in order to gain further insight it is worth looking at the strategy that Stanford University follows for cancellations, it is referenced by other members of the library community. Source: http://sulair.stanford.edu/scholarly_com/cancels.html#projects STANFORD’s strategy for cancellations:
Consult with faculty to identify the highest priorities for collections.
Eliminate virtually all remaining duplicate print subscriptions.
Migrate subscriptions from print or print plus online to online only whenever possible.
Perform cost-benefit analysis for titles, cancel higher cost per use titles and acquire articles on-demand as needed.
Reduce expenditures on books and other non-serials.
Cancel unique titles.
Continue to pursue cooperative agreements that benefit campus.
Monitor and influence the future of scholarly publishing.

Library Budget Survey - 2012
© 2012 Publishers Communication Group, Inc., 875 Massachusetts Avenue, 7th Floor, Cambridge, MA 02139 - (617) 497-6514.
Reproduction strictly prohibited | 20
Table 12: Serials Additions in 2012
Serials Cancellations in 2012
Qualitative Predictions Quantitative Predictions
Qualitative Predictions Quantitative Predictions % respondents predicting
% respondents predicting
Region Organisation Increase No
Additions Unable to
say Ave no. of Additions
Cancels No
Cancels Unable to say
Ave no. of Cancels
North America
Academic Top 73% 27% 0% 11.6
85% 15% 0% 38.5
Academic Middle 70% 30% 0% 18.4
74% 26% 0% 19.2
Academic Lower 63% 33% 3% 14.4
40% 50% 10% 10.0
All Academic 69% 30% 1% 14.6
67% 30% 3% 23.7
Medical/Health 65% 32% 3% 4.2
76% 24% 0% 6.8
Government 45% 55% 0% 1.8
70% 30% 0% 20.4
Corporate 45% 50% 5% 4.5
27% 45% 27% 2.8
Overall 62% 36% 2% 9.6
64% 31% 5% 17.5
Europe
Academic Top 38% 47% 16% 30.0
44% 31% 25% 23.7
Academic Middle 39% 45% 15% 9.8
39% 36% 24% 10.2
Academic Lower 42% 52% 6% 11.0
42% 33% 24% 7.8
All Academic 40% 48% 12% 16.6
42% 34% 24% 13.8
Medical/Health 40% 44% 16% 3.8
48% 16% 36% 8.8
Government 41% 45% 14% 35.4
36% 41% 23% 5.6
Corporate 28% 48% 24% 9.8
24% 32% 44% 7.0
Overall 38% 47% 15% 16.3
39% 32% 29% 11.2
Asia Pacific
Academic Top 36% 41% 23% 23.7
45% 55% 0% 11.9
Academic Middle 39% 26% 35% 157.0
29% 68% 3% 18.2
Academic Lower 32% 48% 19% 74.4
32% 65% 3% 5.1
All Academic 36% 38% 26% 87.1
35% 63% 2% 11.7
Medical/Health 40% 35% 25% 670.1
30% 70% 0% 1.3
Government 33% 67% 0% 5.1
17% 83% 0% 1.8
Corporate 32% 41% 27% 11.9
45% 50% 5% 7.1
Overall 36% 41% 24% 149.6
34% 64% 2% 8.6
South America
Academic Top 67% 33% 0% 33.3
22% 78% 0% 8.9
Academic Middle 38% 63% 0% 11.3
25% 75% 0% 7.5
Academic Lower 14% 86% 0% 1.4
29% 71% 0% 2.9
All Academic 42% 58% 0% 16.7
25% 75% 0% 6.7
Medical/Health 14% 86% 0% 2.9
43% 57% 0% 5.7
Government 0% 100% 0% 0.0
0% 100% 0% 0.0
Corporate 0% 100% 0% 0.0
0% 100% 0% 0.0
Overall 31% 69% 0% 12.0
26% 74% 0% 5.7
Emerging Countries
Academic Top 44% 36% 20% 30.9
28% 64% 8% 9.3
Academic Middle 42% 42% 17% 144.5
25% 67% 8% 12.8
Academic Lower 24% 56% 20% 33.9
24% 72% 4% 2.9
All Academic 36% 45% 19% 69.8
26% 68% 7% 8.2
Medical/Health 20% 73% 7% 2.4
40% 53% 7% 4.1
Government 56% 44% 0% 8.9
0% 89% 11% 0.0
Corporate 42% 33% 25% 18.6
33% 50% 17% 10.2
Overall 36% 47% 16% 48.5
26% 65% 8% 7.2
Overall
Academic Top 52% 38% 10% 22.0
56% 35% 8% 24.8
Academic Middle 47% 36% 16% 48.2
44% 46% 9% 15.3
Academic Lower 44% 48% 9% 28.6
38% 50% 12% 7.2
All Academic 48% 41% 12% 32.7
46% 44% 10% 15.7
Medical/Health 48% 41% 12% 135.4
55% 35% 10% 5.7
Government 39% 55% 5% 14.5
43% 48% 9% 10.3
Corporate 34% 48% 18% 8.1
31% 44% 25% 5.5
Overall 45% 43% 12% 44.8
45% 43% 12% 12.2

Library Budget Survey - 2012
© 2012 Publishers Communication Group, Inc., 875 Massachusetts Avenue, 7th Floor, Cambridge, MA 02139 - (617) 497-6514.
Reproduction strictly prohibited | 21
ELECTRONIC JOURNALS AND BREAKDOWN OF SERIAL SUBSCRIPTION INTO FORMAT TYPE
Librarians were asked if they took an e-journal service and if they did what proportion of their subscriptions were received in electronic form.
98% of institutes surveyed currently use e-journal service providers. This is static compared to last year.
The proportion of journals taken in e-only format has also remained static at 56%. Just over a fifth of subscriptions are still taken in the print format (22%), and this rises to 44% when you take into account the print portion of the combined subscription.
North America has the highest proportion of e-only subscriptions (64%). The emerging countries have the lowest proportion of print only format (17%).
Corporate institutes are most likely to take e-only subscriptions (61%), just ahead of academic top and academic middle (both at 59%).
Only North America has 100% take up on provision of electronic journal services. However, looking at the academic markets, North America, Europe and South America all have 100% take up.

Library Budget Survey - 2012
© 2012 Publishers Communication Group, Inc., 875 Massachusetts Avenue, 7th Floor, Cambridge, MA 02139 - (617) 497-6514.
Reproduction strictly prohibited | 22
Table 13: Breakdown of Serials Subscriptions into Format Type in 2011
% of journals received in different formats % of institutes using
electronic journal services
% respondents predicting
Region Organisation e-only Comb Print
North America
Academic Top 73% 11% 16% 100%
Academic Middle 66% 18% 17% 100%
Academic Lower 61% 24% 15% 100%
All Academic 63% 15% 22% 100%
Medical/Health 55% 18% 27% 100%
Government 59% 15% 26% 100%
Corporate 70% 12% 18% 100%
Overall 64% 16% 20% 100%
Europe
Academic Top 48% 28% 23% 100%
Academic Middle 53% 26% 21% 100%
Academic Lower 53% 30% 17% 100%
All Academic 57% 23% 20% 100%
Medical/Health 53% 28% 20% 96%
Government 44% 31% 25% 100%
Corporate 55% 20% 26% 96%
Overall 51% 27% 22% 99%
Asia Pacific
Academic Top 63% 23% 14% 100%
Academic Middle 66% 13% 21% 100%
Academic Lower 57% 20% 22% 97%
All Academic 62% 16% 22% 99%
Medical/Health 51% 14% 35% 95%
Government 59% 20% 22% 92%
Corporate 58% 8% 34% 91%
Overall 60% 16% 24% 96%
South America
Academic Top 39% 45% 16% 100%
Academic Middle 40% 40% 20% 100%
Academic Lower 23% 48% 30% 100%
All Academic 32% 49% 19% 100%
Medical/Health 31% 49% 21% 100%
Government 40% 40% 20% 50%
Corporate 50% 30% 20% 50%
Overall 34% 45% 21% 94%
Emerging Countries
Academic Top 52% 33% 15% 100%
Academic Middle 55% 29% 16% 100%
Academic Lower 46% 38% 16% 96%
All Academic 56% 25% 18% 99%
Medical/Health 46% 36% 18% 100%
Government 49% 34% 17% 89%
Corporate 43% 28% 29% 67%
Overall 50% 33% 17% 95%
Overall
Academic Top 59% 23% 18% 100%
Academic Middle 59% 21% 19% 100%
Academic Lower 54% 27% 19% 99%
All Academic 58% 21% 21% 100%
Medical/Health 51% 22% 26% 98%
Government 52% 23% 25% 96%
Corporate 61% 14% 26% 94%
Overall 56% 22% 22% 98%

Library Budget Survey - 2012
© 2012 Publishers Communication Group, Inc., 875 Massachusetts Avenue, 7th Floor, Cambridge, MA 02139 - (617) 497-6514.
Reproduction strictly prohibited | 23
EXPENDITURE ON ELECTRONIC SERIALS
Within the serials budget the proportion spent on electronic information source has increased 5% since 2010 to 57%. North America has seen the largest increase this year, up 8% on 2010. In South America and emerging countries the amount being spent on electronic services continues to be considerably lower than other regions.
Table 14: Percentage of Serials Expenditure on Electronic Serials (Current year)
Region Organisation 2006 2007 2008 2009 2010 2011
North America
Academic Top 23 42 48 69 65 80
Academic Middle 25 39 48 63 64 75
Academic Lower 14 21 32 55 62 65
All Academic 21 35 44 62 64 73
Medical/Health 32 34 31 40 57 64
Government 40 50 45 54 60 64
Corporate 39 40 27 48 69 75
Overall 26 37 40 55 63 71
Europe
Academic Top 31 40 45 52 52 57
Academic Middle 35 42 42 49 43 54
Academic Lower 36 33 44 51 50 55
All Academic 34 38 44 51 48 56
Medical/Health 38 38 42 38 44 53
Government 38 44 38 55 54 47
Corporate 43 38 41 36 45 58
Overall 36 39 42 47 48 55
Asia Pacific
Academic Top 24 38 35 40 61 56
Academic Middle 33 49 40 45 48 54
Academic Lower 26 41 35 39 41 47
All Academic 27 43 37 42 49 52
Medical/Health 9 34 29 33 52 42
Government 31 31 44 35 43 46
Corporate 18 37 39 40 47 54
Overall 25 41 37 40 49 50
South America
Academic Top n/a n/a 38 41 41 42
Academic Middle n/a n/a 41 41 39 42
Academic Lower n/a n/a 21 23 23 26
All Academic n/a n/a 34 34 34 37
Medical/Health n/a n/a 50 27 27 30
Government n/a n/a 15 15 15 21
Corporate n/a n/a 15 15 15 21
Overall n/a n/a 32 31 31 34
Emerging Countries
Academic Top n/a n/a 27 34 45 45
Academic Middle n/a n/a 31 39 35 44
Academic Lower n/a n/a 34 31 37 35
All Academic n/a n/a 31 35 39 41
Medical/Health n/a n/a 38 31 31 30
Government n/a n/a 17 38 29 31
Corporate n/a n/a 29 30 41 43
Overall n/a n/a 29 34 38 39
Overall
Academic Top 26 41 44 52 58 63
Academic Middle 30 43 43 49 50 59
Academic Lower 24 33 36 45 48 53
All Academic 27 39 41 48 52 58
Medical/Health 30 36 36 36 49 53
Government 37 43 41 48 52 52
Corporate 35 39 34 39 53 61
Overall 29 39 40 45 52 57

Library Budget Survey - 2012
© 2012 Publishers Communication Group, Inc., 875 Massachusetts Avenue, 7th Floor, Cambridge, MA 02139 - (617) 497-6514.
Reproduction strictly prohibited | 24
E-JOURNAL BUDGETS
43% of institutes with a serials budget indicate that they have a separate budget for e-journals. This is a rise of 12% against last year. A further 19% do not have a separate budget, but were able to predict the changes to the amounts spent on e-journals.
E-journal budgets overall are set to increase by 3.1% (last year’s forecast was 3.5%). Adding in the institutes without a separate budget but that were able to make an estimate, this figure drops to a 2.4% increase.
51% of institutes with an e-journal budget forecast an increase for 2012, with an average increase of 7%. 42% expect to maintain their current position, while the minority (7%) forecast an average decrease of -7%.

Library Budget Survey - 2012
© 2012 Publishers Communication Group, Inc., 875 Massachusetts Avenue, 7th Floor, Cambridge, MA 02139 - (617) 497-6514.
Reproduction strictly prohibited | 25
ABSTRACTING AND INDEXING SERVICES
The majority of institutes (86%) provide access to abstracting and indexing (A&I) services.
% Budget Change: Of those who take A&I services, 12% have a separate budget for A&I services, which is less than last year. Many institutes pay for their A&I service using their serial budgets. Of those institutions with budget, 45% believe that it will remain static in 2012, whilst 37% expect an increase. On average, A&I budgets are expected to rise by 0.1% in 2012. While the majority do not have a separate budget, a further 20% were able to estimate the predicted change on spend for A&I services. Adding these institutes in, 70% of institutes expect the budget to remain static.
Qualitative predictions suggest that 37.3% believe there will be an increase in budget for 2012 (this is up from 17.2% last year, but based on roughly half the number of institutes). However, those predicting an increase estimate an increase of 6.5%, much lower than last year’s estimate of 11.5%. Overall A&I budget change for 2012 is 1.1% (last year a 1.8% increase was predicted).
Number of A&I Services Taken: Of the institutes that provide access to A&I databases, the majority (81%) take two or more A&I services. More institutes are taking more services. Last year 45% of institutes took four or more services. This has grown to 57% this year and accounts for the increases in penetration.
Figure 13

Library Budget Survey - 2012
© 2012 Publishers Communication Group, Inc., 875 Massachusetts Avenue, 7th Floor, Cambridge, MA 02139 - (617) 497-6514.
Reproduction strictly prohibited | 26
BOOKS EXPENDITURE
BOOKS BUDGET CHANGE FOR 2012
Books budgets, which includes electronic books, are predicted to decrease (-0.1%) in 2012.
Regions: North America predicts a drop of 2.4% (last year -1.1%). Europe shows a decrease (-0.8%) after a 1.0% increase last year. o Those in Asia Pacific are more optimistic and predict an increase of 3.7%, higher than the 2.7% increase forecast last
year. Academic institutes are set to perform just under the regional average, with a 3.4% increase predicted. Within Asia Pacific, only the government sector predicts a decrease (-1.1%)
o The South American region expects their books budget to remain static. Last year saw a -0.9% decrease predicted. Academic Top predicts a small increase (0.6%) which is cancelled out by predicted -0.7% decrease in the medical sector.
o Emerging countries predict a 3.8% increase, and are the strongest performing group for the second consecutive year. The non-academic sector, particularly medical, shows higher predictions than the academic sector.
o Overall, in terms of institute types, only academic lower and medical institutes predict an increase (0.6% and 1.6% respectively). Worst performing is the government sector, with a prediction of a -2.1% decrease
Qualitative forecasts indicate that the majority (54%) of institutes believe their budgets will remain static. 23% of institutes predict that their budget expenditure for 2012 will decrease, which represents 7% more than those predicting a decrease last year.
Figure 14 Figure 15
Figure 16

Library Budget Survey - 2012
© 2012 Publishers Communication Group, Inc., 875 Massachusetts Avenue, 7th Floor, Cambridge, MA 02139 - (617) 497-6514.
Reproduction strictly prohibited | 27
Table 15: Books Budget Change for 2012
Qualitative Predictions Quantitative Predictions % respondents predicting
Region Organisation Increase Static Decrease % Budget Change
North America
Academic Top 24% 30% 45% -3.6
Academic Middle 7% 48% 44% -4.8
Academic Lower 30% 50% 20% 0.4
All Academic 21% 42% 37% -2.6
Medical/Health 32% 41% 26% -0.7
Government 0% 55% 45% -4.7
Corporate 18% 64% 18% -2.1
Overall 20% 46% 33% -2.4
Europe
Academic Top 25% 44% 31% -1.7
Academic Middle 24% 42% 33% -0.8
Academic Lower 30% 45% 24% -0.5
All Academic 27% 44% 30% -0.9
Medical/Health 4% 72% 24% -1.8
Government 18% 55% 27% -0.4
Corporate 16% 64% 20% 0.2
Overall 21% 52% 27% -0.8
Asia Pacific
Academic Top 50% 45% 5% 5.1
Academic Middle 29% 61% 10% 3.5
Academic Lower 26% 45% 23% 1.9
All Academic 33% 51% 13% 3.4
Medical/Health 50% 45% 5% 10.5
Government 17% 58% 25% -1.1
Corporate 27% 68% 5% 1.4
Overall 33% 54% 12% 3.7
South America
Academic Top 11% 89% 0% 0.6
Academic Middle 0% 100% 0% 0.0
Academic Lower 0% 100% 0% 0.0
All Academic 4% 96% 0% 0.2
Medical/Health 0% 86% 14% -0.7
Government 0% 100% 0% 0.0
Corporate 0% 100% 0% 0.0
Overall 3% 94% 3% 0.0
Emerging Countries
Academic Top 44% 48% 8% 4.0
Academic Middle 29% 58% 13% 3.4
Academic Lower 36% 44% 12% 2.2
All Academic 36% 50% 11% 3.2
Medical/Health 40% 53% 7% 6.3
Government 33% 56% 11% 3.8
Corporate 33% 67% 0% 4.2
Overall 36% 53% 9% 3.8
Overall
Academic Top 29% 44% 27% -0.6
Academic Middle 19% 55% 26% -0.5
Academic Lower 27% 50% 21% 0.5
All Academic 25% 50% 25% -0.2
Medical/Health 26% 55% 20% 1.6
Government 11% 57% 32% -2.1
Corporate 20% 66% 14% -0.1
Overall 23% 54% 23% -0.1

Library Budget Survey - 2012
© 2012 Publishers Communication Group, Inc., 875 Massachusetts Avenue, 7th Floor, Cambridge, MA 02139 - (617) 497-6514.
Reproduction strictly prohibited | 28
NEW BOOKS IN 2011
We asked librarians to indicate whether or not the number of books purchased this year represented a decrease or increase when compared to the previous year.
Librarians estimate that the number of books purchased this year is down (-1%) when compared to 2010.
We also asked librarians how many books they purchased this year. The average amount of books is 11,546.
Table 16: Book Purchasing in 2011 Compared to 2010
Movement of books 11 against 10 Count % Mean Min Max
Increase 108 21% 9.4 1 100
Same 268 53% 0.0 0 0
Decrease 124 24% -12.6 -100 -1
Don’t know 9 2%
Total 509 100% -1.0 -100.0 100.0
Table 17: Average Number of Books in 2011 per Institute Type
Institution Mean Count
Academic Top 29,732 74
Academic Middle 14,842 71
Academic Lower 10,694 78
Medical/Health 1,495 72
Government 4,660 37
Corporate 403 48
Overall 11,546 380
*68% of respondents stated that the number of books purchased would be 5,000 or less, but some institutions predicted very high numbers which has raised the average considerably. One respondent indicated the high number was due to starting an e-books collection.
PERCENTAGE OF BOOKS BUDGET SPENT ON ELECTRONIC BOOKS IN 2011
Librarians were asked to estimate the proportion of their book budget spent on electronic books. This year, there has been a noticeable increase overall to 16.3% - almost double the proportion of 2010. Academic Top institutes are leading the way – almost a quarter (22.4%) of their books budget is now spent on e-books.
Table 18: Library Book Budget - % Spent on Electronic Books
Region Organisation 2006 2007 2008 2009 2010 2011
Overall
Academic Top 3.3 5.7 4.7 8.3 14.1 22.4
Academic Middle 3.2 5.9 5.6 8.5 9.0 14.8
Academic Lower 3.0 5.7 5.1 8.0 7.1 15.7
All Academic 3.2 5.8 3.2 8.3 10.0 17.6
Medical/Health 2.0 5.9 3.7 6.5 4.8 15.0
Government 2.6 9.2 5.9 2.4 9.4 10.9
Corporate 4.6 3.8 3.5 2.7 11.5 16.8
Overall 3.1 6.0 4.9 6.6 9.4 16.3

Library Budget Survey - 2012
© 2012 Publishers Communication Group, Inc., 875 Massachusetts Avenue, 7th Floor, Cambridge, MA 02139 - (617) 497-6514.
Reproduction strictly prohibited | 29
MAJOR REFERENCE WORKS
MAJOR REFERENCE WORKS – PREDICTED CHANGE FOR 2012
Librarians were asked whether the number of Major Reference Works (MRWs) to be purchased in 2012 would be greater, remain the same or be less than in 2011. 486 librarians indicated what they thought the likely change would be and the percentage movement.
% Change: Overall, the budget for MRWs is predicted to decrease (-1.4%) which is slightly better than the position last year when a drop of 2.4% was forecast.
o Region: North America is the weakest area, with a drop of 3.1% predicted (last year a 5.9% drop was forecast).
o Asia Pacific budgets are predicted to increase next year. The 1.5% increase is largely driven by the corporate sector.
o Europe again predicts a decrease (-2.2%), but its academic sector performs slightly better than the regional average with a -1.8% decrease.
o South America remains relatively static, with a -0.1% predicted decrease. In fact, only the medical sector predicts any kind of change (a -0.7% decrease).
Qualitative Predictions: Just 6% of institutes feel that the number of major reference works purchased in 2012 will increase. The majority of institutes (72%) believe the number of purchases will remain static, and 17% anticipate a decline. Explanations as to why these changes may have occurred are listed in the next section.
Figure 17 Figure 18
REASONS WHY THE NUMBER OF MRWS IS LIKELY TO CHANGE IN 2012
Librarians were asked why the amount of MRWs purchased had changed from the previous year. The top three reasons for increases and decreases are below: Increases:
New publications/ updated editions are coming out User demand Updated editions are coming out
Decreases: Information is available for free on the internet Budget cuts Low usage of MRWs

Library Budget Survey - 2012
© 2012 Publishers Communication Group, Inc., 875 Massachusetts Avenue, 7th Floor, Cambridge, MA 02139 - (617) 497-6514.
Reproduction strictly prohibited | 30
Table 19: MRW Budget Change for 2012
Qualitative Predictions Quantitative Predictions % respondents predicting
Region Organisation Increase Static Decrease % Budget Change
North America
Academic Top 3% 58% 39% -4.6
Academic Middle 11% 63% 22% -3.2
Academic Lower 10% 67% 20% -1.5
All Academic 8% 62% 28% -3.2
Medical/Health 6% 88% 6% 0.4
Government 0% 70% 25% -7.0
Corporate 5% 82% 14% -4.9
Overall 6% 71% 21% -3.1
Europe
Academic Top 3% 66% 28% -1.8
Academic Middle 0% 76% 21% -1.2
Academic Lower 6% 58% 30% -2.2
All Academic 3% 66% 27% -1.8
Medical/Health 0% 68% 28% -1.7
Government 0% 82% 18% -1.0
Corporate 16% 56% 28% -5.2
Overall 4% 67% 26% -2.2
Asia Pacific
Academic Top 9% 68% 14% 0.4
Academic Middle 10% 77% 6% 1.4
Academic Lower 10% 74% 10% -3.6
All Academic 10% 74% 10% -0.7
Medical/Health 5% 85% 0% 0.8
Government 17% 75% 0% 0.5
Corporate 18% 68% 0% 11.7
Overall 11% 75% 6% 1.5
South America
Academic Top 0% 100% 0% 0.0
Academic Middle 0% 100% 0% 0.0
Academic Lower 0% 100% 0% 0.0
All Academic 0% 100% 0% 0.0
Medical/Health 0% 86% 14% -0.7
Government 0% 100% 0% 0.0
Corporate 0% 100% 0% 0.0
Overall 0% 97% 3% -0.1
Emerging Countries
Academic Top 8% 72% 8% 1.5
Academic Middle 4% 71% 13% 0.1
Academic Lower 12% 60% 12% 0.2
All Academic 8% 68% 11% 0.6
Medical/Health 7% 73% 20% 0.4
Government 22% 67% 11% 0.4
Corporate 25% 42% 8% 1.9
Overall 11% 65% 12% 0.7
Overall
Academic Top 4% 67% 26% -2.2
Academic Middle 6% 75% 15% -0.9
Academic Lower 8% 68% 19% -2.2
All Academic 6% 70% 20% -1.8
Medical/Health 3% 81% 12% -0.2
Government 4% 77% 16% -2.8
Corporate 13% 69% 14% -0.2
Overall 6% 72% 17% -1.4

Library Budget Survey - 2012
© 2012 Publishers Communication Group, Inc., 875 Massachusetts Avenue, 7th Floor, Cambridge, MA 02139 - (617) 497-6514.
Reproduction strictly prohibited | 31
MAJOR REFERENCE WORKS FORMATS BEING PURCHASED
90% of organisations surveyed have purchased an MRW in one form or another.
Print still predominates as the format of choice (78%), with online purchases catching up quickly (68%). Last year, the gap between these two formats was 20%: this year it is just 10%. Just over a quarter of institutes have purchased MRWs in all three formats (26%), a 5% rise on last year.
Asia Pacific continues to lag behind other regions in terms of uptake of online MRWs (47%). Europe now has the highest percentage of online MRW uptake. At 81%, this is an 11% increase on last year and therefore overtakes North America (73%).
Overall, academic institutes have the highest uptake of online (78%), corporate and medical have the lowest (49%).
Table 20: Purchasing Patterns for MRWs by Region and Organisation (up to Current Year) % all respondents taking MRW % respondents purchasing MRW formats
Region Institution MRW
None Total MRW Print
MRW CD ROM
MRW Online
All MRW Formats (any format)
North America
Academic Top 94% 6% 100% 58% 15% 91% 12%
Academic Middle 96% 4% 100% 59% 11% 93% 11%
Academic Lower 93% 7% 100% 73% 17% 90% 17%
All Academic 94% 6% 100% 63% 14% 91% 13%
Medical/Health 82% 18% 100% 74% 6% 50% 3%
Government 80% 20% 100% 70% 20% 40% 15%
Corporate 82% 18% 100% 41% 18% 64% 5%
Overall 89% 11% 100% 63% 14% 73% 10%
Europe
Academic Top 100% 0% 100% 88% 34% 88% 31%
Academic Middle 97% 3% 100% 82% 42% 88% 39%
Academic Lower 94% 6% 100% 88% 39% 88% 39%
All Academic 97% 3% 100% 86% 39% 88% 37%
Medical/Health 80% 20% 100% 72% 28% 60% 28%
Government 100% 0% 100% 91% 41% 100% 41%
Corporate 92% 8% 100% 84% 20% 56% 20%
Overall 94% 6% 100% 84% 35% 81% 34%
Asia Pacific
Academic Top 86% 14% 100% 77% 27% 68% 23%
Academic Middle 97% 3% 100% 90% 42% 65% 32%
Academic Lower 90% 10% 100% 87% 45% 52% 32%
All Academic 92% 8% 100% 86% 39% 61% 30%
Medical/Health 60% 40% 100% 60% 20% 15% 0%
Government 83% 17% 100% 83% 50% 42% 33%
Corporate 91% 9% 100% 91% 36% 27% 23%
Overall 86% 14% 100% 83% 37% 47% 25%
South America
Academic Top 100% 0% 100% 100% 100% 56% 56%
Academic Middle 88% 13% 100% 88% 63% 50% 50%
Academic Lower 100% 0% 100% 100% 71% 57% 57%
All Academic 96% 4% 100% 96% 79% 54% 54%
Medical/Health 100% 0% 100% 100% 100% 100% 100%
Government 100% 0% 100% 100% 50% 50% 50%
Corporate 100% 0% 100% 100% 50% 50% 50%
Overall 97% 3% 100% 97% 80% 63% 63%
Emerging Countries
Academic Top 96% 4% 100% 92% 48% 60% 28%
Academic Middle 96% 4% 100% 96% 38% 50% 25%
Academic Lower 92% 8% 100% 92% 52% 72% 44%
All Academic 95% 5% 100% 93% 46% 61% 32%
Medical/Health 80% 20% 100% 80% 47% 47% 47%
Government 100% 0% 100% 100% 56% 78% 44%
Corporate 83% 17% 100% 83% 33% 33% 25%
Overall 92% 8% 100% 91% 45% 57% 35%
Overall
Academic Top 95% 5% 100% 76% 32% 81% 25%
Academic Middle 96% 4% 100% 79% 35% 79% 30%
Academic Lower 93% 7% 100% 84% 37% 75% 32%
All Academic 95% 5% 100% 80% 35% 78% 29%
Medical/Health 78% 22% 100% 72% 23% 49% 17%
Government 89% 11% 100% 82% 36% 64% 30%
Corporate 89% 11% 100% 73% 25% 49% 17%
Overall 90% 10% 100% 78% 32% 68% 26%

Library Budget Survey - 2012
© 2012 Publishers Communication Group, Inc., 875 Massachusetts Avenue, 7th Floor, Cambridge, MA 02139 - (617) 497-6514.
Reproduction strictly prohibited | 32
INSTITUTIONAL REPOSITORIES
The data show that institutional repositories are fairly widespread, with just over half (56%) of all institutions either owning, or sharing ownership of a repository. This figure remains static from last year.
As expected, the most widespread repository ownership is in the academic sector, with just over two thirds (71%) of institutions providing a repository. This rises to 84% for top academic institutes – a rise of 8% compared to last year. The lowest level of repository ownership remains in the medical sector, just less than a third (28%).
Research Articles are the most preferred content with 87% of institutes indicating they post research articles into their repository. Dissertations and Theses (82%) are the next most frequently mentioned type. The “other” formats mentioned include books and in-house publications.
There has been a noticeable increase in the percentage of institutes storing datasets in their repositories. Overall, this figure has risen 12% to 53%. Academic middle and lower account for most of this rise, increasing by 17% and 15% respectively.
Table 21: Usage of Institutional Repositories
Organisation % access a repository
Type kept in repository
Dissertations/ theses
Research articles
Teaching materials
Datasets Other
Academic Top 84% 95% 83% 57% 58% 10%
Academic Middle 70% 96% 87% 55% 51% 6%
Academic Lower 59% 92% 90% 58% 47% 3%
All Academic 71% 94% 86% 57% 52% 7%
Medical/Health 28% 67% 96% 42% 67% 4%
Government 45% 40% 88% 28% 48% 16%
Corporate 34% 38% 83% 25% 54% 13%
Overall 56% 82% 87% 50% 53% 8%
HOW INFORMATION IN REPOSITORIES IS STORED
The 283 institutions which reported having a repository were asked some follow up questions about the format of information being stored and how the repositories are maintained.
Text is the format most often stored within the repository, with 98% of institutions keeping information in text format. This is static against last year. The proportion of institutes storing images has risen 16% compared to last year and now stands at 63% and is now the second most popular format stored. Video and Audio also increase their presence in repositories, rising 15% and 16% respectively to 54%.
Table 22: Usage of Institutional Repositories
Organisation
Format kept in repository
Text Video Audio Images
Academic Top 99% 59% 56% 72%
Academic Middle 94% 52% 57% 65%
Academic Lower 97% 53% 58% 53%
All Academic 97% 55% 57% 64%
Medical/Health 100% 75% 71% 75%
Government 100% 40% 44% 56%
Corporate 100% 33% 29% 42%
Overall 98% 54% 54% 63%

Library Budget Survey - 2012
© 2012 Publishers Communication Group, Inc., 875 Massachusetts Avenue, 7th Floor, Cambridge, MA 02139 - (617) 497-6514.
Reproduction strictly prohibited | 33
HOW INFORMATION IN REPOSTIORIES IS MAINTAINED
Currently, most of the information stored within institutional repositories is deposited voluntarily; the ratio is around 65:35 in favour of voluntary submission. This shows evidence of more institutions implementing mandatory deposits as the ratio last year was 70:30. This rise is driven by non-academic institutes.
Table 23: Usage of Institutional Repositories
Type Mandatory Voluntary
Academic
Dissertations/ theses 38% 62%
Research articles 30% 70%
Teaching materials 27% 73%
Datasets 31% 69%
Other 7% 93%
Non-Academic
Dissertations/ theses 47% 53%
Research articles 42% 58%
Teaching materials 55% 45%
Datasets 43% 58%
Other 38% 63%
GROWTH OF INSTITUTIONAL REPOSITORIES
All institutes were asked how fast they thought their institutional repositories were growing, 41% thought they were growing fast, but the majority indicated that they were growing slowly or very slowly (52%).
Geographically, South America is making the least progress with repositories – 80% say they are growing slowly or very slowly.
Table 24:Responsibility for Maintaining Repositories
Maintenance Proportion
Library staff at the institute 93%
Staff at the institute, but not based in the library
4%
3rd party agency 2%
Table 25: Accessibility of Repositories
Access Type Proportion
It is only available to individuals based in your institute
41%
Available to anyone in the country in which the institute is
5%
Available to all 54%

Library Budget Survey - 2012
© 2012 Publishers Communication Group, Inc., 875 Massachusetts Avenue, 7th Floor, Cambridge, MA 02139 - (617) 497-6514.
Reproduction strictly prohibited | 34
INTER-LIBRARY LOANS (ILLS)
ILLs are predicted to increase by 2.1% next year (last year was a predicted 0.9% increase).
In terms of qualitative predictions more estimate that the number of ILLs will increase than decrease (32% vs. 14%); the majority (42%) believe the number will remain static.
The biggest increase in demand is expected in the emerging countries (4%) and Asia Pacific (3.3%) .
As in previous years librarians were asked why they believed ILLs were likely to increase or decrease.
Increases in ILLs have been mainly caused by a reduction in the number of information sources in the library (32%) and by online usage stimulating demand for journals the library does not carry (31%).
Decreases, as we would expect, are due to increased electronic access diminishing demand (84%).
Table 26: Number of ILLs Change for 2012
Qualitative Predictions
Quantitative Predictions % respondents predicting
Region Organisation Increase Static Decrease % Change in no. of ILLs
North America
Academic Top 48% 24% 18% 1.0
Academic Middle 52% 33% 11% 4.2
Academic Lower 33% 30% 33% 1.8
All Academic 44% 29% 21% 2.3
Medical/Health 26% 47% 26% 1.5
Government 40% 25% 20% 4.0
Corporate 23% 41% 5% 4.5
Overall 37% 34% 20% 2.5
Europe
Academic Top 44% 44% 13% 0.9
Academic Middle 30% 39% 30% 0.2
Academic Lower 36% 39% 15% 3.2
All Academic 37% 41% 19% 1.4
Medical/Health 16% 60% 12% 1.0
Government 36% 64% 0% 2.5
Corporate 12% 36% 12% -0.1
Overall 30% 46% 15% 1.3
Asia Pacific
Academic Top 36% 41% 5% 5.6
Academic Middle 48% 35% 13% 2.7
Academic Lower 42% 35% 16% 4.9
All Academic 43% 37% 12% 4.2
Medical/Health 25% 25% 20% -3.5
Government 33% 42% 0% 5.1
Corporate 23% 18% 5% 2.2
Overall 36% 33% 11% 3.3
South America
Academic Top 0% 100% 0% 0.0
Academic Middle 0% 100% 0% 0.0
Academic Lower 0% 100% 0% 0.0
All Academic 0% 100% 0% 0.0
Medical/Health 0% 100% 0% 0.0
Government 0% 100% 0% 0.0
Corporate 0% 100% 0% 0.0
Overall 0% 100% 0% 0.0
Emerging Countries
Academic Top 20% 76% 0% 3.8
Academic Middle 46% 46% 4% 3.9
Academic Lower 48% 44% 0% 6.4
All Academic 38% 55% 1% 4.6
Medical/Health 20% 60% 0% 2.7
Government 22% 78% 0% 0.4
Corporate 33% 33% 0% 5.7
Overall 34% 55% 1% 4.0
Overall
Academic Top 40% 42% 11% 1.8
Academic Middle 39% 41% 17% 2.0
Academic Lower 35% 40% 20% 3.0
All Academic 38% 41% 16% 2.3
Medical/Health 21% 50% 19% 0.5
Government 36% 46% 7% 3.4
Corporate 18% 34% 7% 2.1

Library Budget Survey - 2012
© 2012 Publishers Communication Group, Inc., 875 Massachusetts Avenue, 7th Floor, Cambridge, MA 02139 - (617) 497-6514.
Reproduction strictly prohibited | 35
About Publishers Communication Group Publishers Communication Group, Inc., a division of Publishing Technology, is a full-service marketing and sales consulting firm with locations in Boston, Oxford, São Paulo, New Delhi and Beijing. PCG was established in 1990 as a resource for scholarly publishers to more effectively work with the global library market. PCG offers international multi-lingual telemarketing services, qualitative and quantitative marketing research, customer services operations based in the UK, US, Brazil, India and China, sales representation and strategic consulting. PCG's original aim was to direct European publishers to the gateway of North American libraries and the goals they could achieve. Our services quickly expanded to include the needs of North American publishers and our focus shifted to the global library community. Our work has become more intricate and involved, allowing PCG to provide comprehensive marketing services that expand and maintain publishers' presence in the world's libraries. Our Market Intelligence Services are designed to uncover the valuable market information that is not available from other sources because each campaign addresses the unique issues and concerns of an organization. PCG's Promotion Services expand the awareness of publications or products to a carefully identified and strategically compiled audience, encouraging them to initiate a subscription or expand their current holdings. PCG's Sales Representation Services offer programs to publishers worldwide that will minimize costs and provide customers with easy, direct contact with them. Publishers Communication Group, Inc. 617-497-6514 www.pcgplus.com www.publishingtechnology.com