Liberalizing Trade in Agriculture - World Bank€¦ · country members of the Asian Development...
28
POLICY RESEARCH WORKING PAPER 2804 Liberalizing Trade in Agriculture Developing Countries in Asia and the Post-Doha Agenda John S. Wilson The World Bank Development Research Group Trade March 2002 Public Disclosure Authorized Public Disclosure Authorized Public Disclosure Authorized Public Disclosure Authorized Public Disclosure Authorized Public Disclosure Authorized Public Disclosure Authorized Public Disclosure Authorized
Transcript of Liberalizing Trade in Agriculture - World Bank€¦ · country members of the Asian Development...
POLICY RESEARCH WORKING PAPER 2804
Liberalizing Trade in Agriculture
Developing Countries in Asiaand the Post-Doha Agenda
John S. Wilson
The World BankDevelopment Research GroupTradeMarch 2002
Pub
lic D
iscl
osur
e A
utho
rized
Pub
lic D
iscl
osur
e A
utho
rized
Pub
lic D
iscl
osur
e A
utho
rized
Pub
lic D
iscl
osur
e A
utho
rized
Pub
lic D
iscl
osur
e A
utho
rized
Pub
lic D
iscl
osur
e A
utho
rized
Pub
lic D
iscl
osur
e A
utho
rized
Pub
lic D
iscl
osur
e A
utho
rized

| POLICY RESEARCH WORKING PAPER 2804
Abstract
Wilson provides an overview and data relevant to the Moreover, data indicate that trade reform in exportinterests of developing countries as they engage in partners, particularly OECD countries, will affect acontinuing agricultural trade negotiations set forth in the significant share of the population in these developingWorld Trade Organization Ministerial held in Doha, countries, resulting in rural poverty alleviation. TradeQatar in November 2001. He examines country liberalization is expected to benefit net exporterperformance in agricultural trade, income levels, and countries, particularly those that are highly open topopulation characteristics, with a focus on developing trade. What is also important, but often neglected, is acountry members of the Asian Development Bank. country's pattern of specialization between clomestic
The author concludes that trends in agricultural trade supply and exports. The impact of trade reform throughin the past 10 years are quite heterogeneous across the WTO negotiations, particularly reforms undertakendeveloping regions. Shares of agriculture in GDP are still in exporting partners can therefore have importanthigh in the East Asia and Pacific and South Asia regions. implications in the post-Doha development agenda.
This paper-a product of Trade, Development Research Group-is part of a larger effort in the group to explore the linkbetween standards, development, and trade. Copies of the paper are available free from the World Bank, 1818 H StreetNW, Washington, DC 20433. Please contact Paulina Flewitt, room MC3-333, telephone 202-473-2724, fax 202-522-1159, email address [email protected]. Policy Research Working Papers are also posted on the Web at http://econ.worldbank.org. The author may be contacted at [email protected]. March 2002. (22 pages)
The Policy Research Working Paper Series disseminates the findings of work in progress to encourage the exchange of ideas aboutdevelopment issues. An objective of the series is to get the findings out quickly, even if the presentations are less than fully polished. Thepapers carry the names of the authors and should be cited accordingly. The findings, interpretations, and conclusions expressed in thispaper are entirely those of the authors. They do not necessarily represent the view of the World Bank, its Executive Director.;, or thecountries they represent.
Produced by the Research Advisory Staff

Liberalizing Trade in Agriculture:
Developing Countries in Asia and the Post-Doha Agenda
John S. WilsonThe World Bank


Liberalizing Trade in Agriculture:
Developing Countries in Asia and the Post-Doha Agenda
John S. WilsonThe World Bank*
Introduction
The developing countries, including those in Asia, have an important stake in the successof continued liberalization in agriculture. As the World Development Report in 2000noted, between 40 and 60 percent of the poorest in the developing world live in ruralareas (World Bank 2000). Expansion of agricultural trade has a direct relationship topoverty reduction and accelerated economic growth. A more integrated world economyin which existing trade barriers are reduced will provide increased opportunities for allcountries to take advantage of gains that growth in trade can provide. Developingcountries should seize this new opportunity to actively participate in the process ofshaping a more integrated world economic environment. Developing countries played aninfluential role in World Trade Organization (WTO) negotiations at the WTO Ministerialin Qatar in November 2001. Developing countries now represent approximately two-thirds of the 134 WTO members, with 54 new members joining since January 1995.
As these countries move toward liberalization and implement domestic reformsnecessary to meet international obligations, both opportunities and challenges willemerge from a development perspective. Initially, as with all trade liberalization, therewill be winners and losers both among and within countries, and between consumers andproducers. Trade policy discussions largely continue to focus, however, on developingcountries as a single bloc with few distinctions made between them. In fact, theimplications of reform and trade policy options that drive reform may be very differentamong developing countries. They are a heterogeneous group with a wide diversity incomparative advantages, industrial composition, resource endowments, and othercharacteristics (Valdes and McCalla 1999).
The basic rules and commitments of the WTO Committee on Agriculture that concludedin 1995 centers on the following areas: (1) use of domestic support programs andsubsidies, including those that raise or guarantee prices and farmers' incomes; (2) exportsubsidies and other methods used to make exports artificially competitive; and (3) marketaccess requirements and trade restrictions on imports. These issues largely remain onthe WTO agenda in 2001 in provide the baseline for the negotiation framework agreed inQatar at the WTO ministerial in November 2001. WTO members will continue to
Paper presented at Asian Development Bank Institute Workshop, Singapore April 16-24, 2001. Theassistance of Tsunehiro Otsuki and Johan Mistiaen in the preparation of this paper gratefullyacknowledged.
2

negotiate over domestic price support programs, export competition rules, and the widerange of issues related to sanitary and phytosanitary standards. Among the latter, debateover food safety rules and the use of genetically modified organisms have dominatedpublic news reports and media coverage of trade in many developed and developingcountries during the past year.
The objective of the paper is to provide background infonnation and data relevant todeveloping country interests, as they engage in agricultural trade negotiations at the WTOas reassessed in the trade ministerial in Doha in November 2001. The material presentedhere builds on and extends the analysis in Valdds and McCalla (1999) by addressing tariffrates of protection as part of an analysis of 5 developing country trade profiles in Asia.The paper first briefly reviews world trends in agricultural trade, with a specific focus ondeveloping country members of the Asian Development Bank (ADB). The paper theninvestigates the perfonnance in agricultural trade, income levels, and populationcharacteristics of ADB developing country members. Following this outline of trends,selected issues and positions taken in Geneva in the agriculture talks underway arereviewed. The conclusions outline recommendations, priorities, and positions for movingforward from a developing country perspective.
World Trends in Agricultural Trade and Protection: A Developing Country Focus
In contrast to gains made by developing countries in penetration of developed countrymarkets in goods, the share of developing country exports in global agricultural tradeincreased only slightly over the period from 1990 through 1999, from 40.5 percent to 43percent (WTO 2001). Trade barriers in both goods and agricultural markets confrontedby developing countries in other developing country markets remain significantly higherthan those in the industrialized nations (World Bank 2000). Average agricultural tariffrates faced by developing country exporters in other developing coumtry markets is 18.3percent vs. 15.3 percent in high-income markets (Hertel and Martin 2000). This isparticularly important as shares of south-south trade in 1999 totaled approximately 40percent.
Based on data from the Organization for Economic Cooperation and Development(OECD 2000), from the mid-1980s to the mid-1990s, agricultural producer support hasdeclined as a share of gross farm receipts.' As prices have declined, however, subsideshave increased. The largest level of subsidy is provided by the European Union. Theaverage annual value of subsidies is approximately 60 percent of total world trade inagriculture and about double the value of exports from developing countries (Worlcl Bank2000).
The Uruguay Round made progress in restraining tariff escalation overall. In areas ofparticular concern to the least developed nations, however, a number of serious barriersremain. This includes tariffs on processed foods. Imports of processed foods from
'Based on calculations in the Producer Support Estimate (PSE) database of the OECD. PSE is defined asthe annual monetary value of gross transfers from consumers and taxpayers to producers for all policymeasures. A description of PSE valuation is available on page 68 of the OECD report: Agriculture Policiesin Emerging and Transition: Special Focus on Non-Tariff Measures, OECD Paris, 2001.
3

developing countries as a percent of apparent consumption has fallen in the United States,Canada, and European Union, for example, over the period 1985-1995. Tariffs on fullyprocessed foods are subject to high rates of protection, including 65 percent rates inJapan, for example. Evidence suggests that if protection via tariffs and subsidies werelowered, even the poorest countries would expand exports. Successful exporters of fruits,vegetables, and cut flowers in developing countries over the past decade support thisassumption.
What are the estimates of the benefits of reducing traditional trade barriers throughtariffs and quantitative restrictions in agriculture? Ianchovichina, Mattoo, and Olarreaga(2000) estimate, for example, that if the Quad countries of Japan, the U.S., EuropeanUnion, and Canada provided duty free access to low-income countries in Africa, netagricultural exports would rise by 6 percent.
The agricultural commodities included in this analysis follow the definitions outlined inthe WTO Agriculture Agreement. According to the World Bank classification of worldregions, developing countries can be divided into six regions:
1. EAPAC: East-Asia and Pacific
2. SA: South Asia
3. LAC: Latin America and Caribbean
4. MENA: Middle-East and North Africa
5. ECA: East-Europe and Central Asia
6. SSA: Sub-Saharan Africa
The EAPAC region is a net agricultural exporter in most of the period examined. Theregion's trade position after the WTO was created, however, has been fluctuating. Theregion became a net importer in 1996 followed by rapid growth in net exports in 1998.SA is also a net agricultural exporter throughout this period. This reflects the fact thattrade flows from India and Sri Lanka, both net agricultural exporters, dominates that inother South Asia countries, which are net agricultural importers. The ECA region was netagricultural importer during most of this period, with imports rising dramatically afterconclusion of the Uruguay Round.
The trend of EAPAC countries dominates in the trend of agricultural trade in the ADBdeveloping member countries as their trade flows outweigh those in other developingmember countries in SA and ECA. The LAC region exhibits quite different trends thanthe other developing regions. These countries were net agricultural exporters in 1990 andagricultural exports have increased rapidly during the period 1990-1998. The MENAregion and SSA were net agricultural importers throughout the period. MENA hasrapidly increased net imports during the period, whereas net agricultural imports havegenerally remained unchanged.
4

Figure 1. Trends in Net Agricultural Export in the Developing Regions
30
25
20 --+ ADB
15 --/-EAPAC
o0 10-h_ ECA
E 5 -- LAC
v °- t___ MENA
-5 \ -- SA
-10 - - SSA
-15 t
-20-,,-, _
1990 1992 1994 1996 1998
Year
Source: Author calculations based on UN COMTRADE database.
The Importance ofAgriculture in Region's Trade
Trends in the share of agriculture in total trade are not homogeneous across thedeveloping regions. The share of agriculture in EAPAC has been 7 to 10 percent and hasdeclined slightly during the period 1990-1998. This trend can also be seen in ADBdeveloping member countries' trade profiles. The SA region exhibits a higher importanceof agriculture, though not as much as LAC. This indicates that agriculture is still animportant component of trade in SA.
The ECA region shows a great fluctuation in the share of agriculture in trade, varyingfrom the low of 1.5 percent in 1990, to the high of 19.5 percent in 1992. This trend hasstabilized around 7 percent after 1996. The share of agriculture was low in MENA in1990, but has increased during the period 1990-1998 to nearly 5 percent. As indicatedpreviously, its net agricultural import has increased. This suggests that agriculturalexport actually did increase, but the growth in agricultural import was greater in MENA.This trend can also be seen in SSA, but not as strong. Finally, agriculture is highlyimportant in LAC.
5

Figure 2. Share of Agriculture in Region's Total Export
25.0 -
-- ADB-U- EAPAC
15.0 ECA
*-LAC10.0 -*-- MENA
-0O- SA5.0 SSA
0.0 -lIll
1990 1992 1994 1996 1998
Year
Source: Author calculations based on US COMTRADE database, World Bank Development Indicators.
Taxonomy of ADB Member Developing Countries
Overall: ADB Developing Members
Developing countries are indeed diverse in income levels and trade position (Valdes andMcCalla, 1999). The impact of trade liberalization, therefore, should be analyzedconsidering this heterogeneity.
Table 1 indicates a great diversification of ADB developing country members in termsof GDP, population, GDP per capita, agricultural GDP, and agricultural and ruralpopulation. 1998 GDP per capita ranges from US$ 220 in Nepal, to US$ 11,000 inKorea. The regional average of GDP per capita is US$ 1820 and US$ 580 in EAPACand South Asia in 1998, respectively, indicating three times difference. GDP per capitagrew for most of the members from 1994 to 1998, indicating a greater growth in GDPthan population. South Asia had the highest growth at 14 percent.
The share of agriculture in GDP is generally high for countries with low GDP percapita. The highest GDP share fot agriculture is found in Laos at 52 percent in 1998,whereas the lowest share is 6 percent in Korea. GDP share of agriculture slightly declinedon average in all regions from 1994 to 1998. While the shares of rural populations have ahigh correlation with GDP shares of agriculture, they are quite high in most of thecountries, ranging from 23 percent in Korea, to 94 percent in Bhutan. The difference inthese shares appears to be accounted for by a high degree of non-farm agriculturalproduction, such as textiles. These facts imply that domestic agricultural policies and achanging agricultural trade environment will have an effect on low-income countries,particularly those with large rural populations.
Valdes and McCalla (1999) examine relationships between income levels and countrycharacteristics such as self-sufficiency of food supply, and trade position for 148developing countries in the world. They group countries in three income levels: LowIncome Country (LIC), Lower-middle Income Country (LMIC), and Upper-middle
6

Income Country (UMIC), using the World Bank classification. Their findings aresummarized as follows:
1. 58 of the 63 LICs are also Low Income Food Deficit Countries (LIFDCs)2:
2. A significant majority of Transition Economy (TRANS) and Small IslandDeveloping Economy (SIDCs) are in the middle-income category:
3. While two-thirds (105) of the 148 developing countries are net foodimporters (NFIMs), two-fifths (63) are net agricultural exporters (NAEXs)including 33 low-income countries.
These findings lead to their conclusion that many more developing countries are netagricultural exporters than commonly thought.
The same framework is employed here for ADB developing country members, and ispresented in Table 2:
1. 17 of 19 LIC countries are also LIFDC.
2. Unlike the case of all developing countries, the majority of TRANS areLIC, while the majority of SIDC are in the middle-income group.
3. More than half of 34 ADB developing country members are NAEXincluding 10 LICs. This rate is greater than that for the entire group. ButNFIM is still two-thirds (22), and NFEX is only one third of the 34 ADBdeveloping countries. This implies that the ADB developing countrieshave a comparative advantage in non-food agricultural export.
Openness to Trade and Capacity to Finance Food Imports
Valdes and McCalla introduce indicators used to rank countries according to openness totrade in agriculture and to food import capacity. The Agricultural Tradability (AT)index, which is a ratio of total agricultural import and export and agricultural GDP,measures how open or vulnerable a country is to changes in trade patterns. Food importcapacity (FIC), which is a ratio of value of food imports to that of total non-food exports,measures the capacity of a country to have foreign exchange to finance food imports.
Table 3 shows AT and FIC scores for ADB developing country members. On average,EAPAC and ECA are much more open to South Asia regarding agricultural trade.Malaysia and the Fiji Islands are the most open (1.00). The least open are Laos and India(0.09). This range is quite high, and hence the vulnerability to trade is highlyheterogeneous among ADB developing countries.
2 The definition follows the UN definition.
7

Table 1. Agricultural Sector Ind.icators for ADB Developing MembersName GDP (S billion) GDP per Agricultural GDP Agricultural Agricultural Population Rural Population
capita (Sbillion) GDP (as % of labor force (million) Size (as % of($ 1,0001 ___ total) .(as %) of total) total)
1994 1998 Change 1994 1998 19I94 19981 Change 1994 1998 1994 1998 19941 1998 19941 1998___ (%) (%~~~~~~~~~~~/)
East Asia andPacificCambodia 2.7 3.2 17 0.26 0.281 1.4 1.61 II1 53 50 68 66 10.4 11I.5 86 85
China 634.0 900.0 42 0.53 0.73 137.0 162.0 18 22 1 8 7 1 69 1190 1238 7 1 69
Fiji Islands 1.9 1.9 -l 2.52 2.42 0.4 0.3 -22 21 16 42 41 0.8 0.8 55 5
Indonesia 187.0 198.0 6 0.98 0.97 33.3 36.5 10 18 18 53 50 1190.91 203.7 65 1 61
Kiribati 0.04 0.1 20 0.55 0.60 0.01 0.01 0 17 14 0.11 0.1 64 1 62
Korea, 449.0 512.0 14 10.10 11.03 28.4 30.6 8 6 6 14 1 1 44.5 46.4 23 20Republic of I_I_ILaos 1.7 2.1 27 0.37 0.42 0.9 1.1 18 56 52 4.5 5.0 80 78
Malaysia 79.8 94.3 I 1 8 3.97 4.25 11.0 10.9 -1I 1 4 1 2 24 20 20.1 22.2 47 44
Mongolia 0.9 1.1 1 7 0.37 0.41 0.3 0.4 24 3 6 3 8 29 26 2.4 2.6 40 3 8
Myanmar 76 761 42.41 44.5 741 7 3
Papua New 5.1 5.0 -2 1.22 1.08 1.3 1.3 -3 25 25 77 75 4.2 4.6 841 83Guinea II IIPhilippines 70.8 82.1 1 6 1.03 1.09 15.9 16.0 1 22 191 42 39 68.7 75.2 47 43
Samoa 0.1 0.2 1 9 0.86 1.00 0.2 0.2 79 79
Solomon 0.3 0.3 2 0.83 0.75 76 74 0.4 0.4 83 *- iIslands Thailand 154.0 157.0 2 2.62 2.57 18.3 19.3 5 12 12 60 57 58.7i 61.2 80 79
Tonga 0.2 0.2 -3 1.65i 157i 0.04 0.04 I -61 27 26 0.1 0.1 65i 63
Tuivalu
Vanuatu 0.2 0.3 1 3 1.39 1.40 0.1 23 0.2 0.2 8 1 80
Vietnam 18.5 25.3 37 0.26 0.33 5.5 6.5 1 8 30 261 7 1 70 71.7 .76.5 8 1 80
Regional 9-1.5 116 6 I4 1 74 1 82 16 9 20 5 6 2 5 24 54 52 95 1 99.7 67 6 5awrrageSouth Asia
Afghanistan 60 56 20.7 25.1 80 1 79
Bangladesh 35.6 43.7 23 0.30 0.35 9.4 10.5 12 26 24 61 58 117.9 125.6 79 77
Bhutan 0.3 0.4 30 043 049 0.1 01 18 40 36 .0.7 0.8 94 93
India 337.0 435.0 29 0.37 0.44 93.3 109.0 17 28 251 631 60 913.6 979.7 73 72
Maldives 0.3 0.3 29 1.07 1.22 0.1 0.1 8 20 16 0.2 0.3 74 75
Nepal 4.2 5.0 17 0.20 0.22 1.7 1.9 9 41 38 95 95 20.8 22.9 90 89
Pakistan 58.2 67.2 15 0.49 0.51 13.3 16.5 24 23 25 56 54 119.4 131.6 66 64
Sri Lanka 12.4 15.1 22 0.69 0.80 2.6 2.7 4 21 18 47 45 17.9 18.8 78 77
Regsoal 64 0 81 0 24 0 51 0 58 17 2 20 1 1 3 28 26 64 62 151 4 163 1 79 783%seraveEast Europeand CentralAsiaAzerbaijan 3.3 3.4 1 4 0.43 10.43 0.8 0.8 -5 24 22 29 27 7.6 7.9 45 43
Kazakhstan 21.7 20.0 -g 1.33 1.28 3.3 1.9 -42 1 5 9 21 20 16.3 15.6 43 744
Kyrgyzstan 3.5 4.0 13 0.79 0.85 1.4 1.8 28 39 44 30 26 4.5 4.7 65 66
Tajikistan 1.9 1.8 -7 0.33 0.29 0.4 . 1 8 37 35 5.8 6.1 72 73
Turkey 158.0 201.0 27 2.65 3.17 24.9 27.6 1 I 16 14 5 1 48 59.7 63.4 32 27
Turkmenistan 6.3 5.1 -19 1.44 1.08 32 3 1 4.4 4.7 55 55
Uzbckistan 16.4 17.7 81 0.731 0.741 45 46 3 27 26 32 28 22.4 24.1 6 1 62
Regional 30 2 36 1 3 1 1 10 1121 59 73 - 23 23 331 311 17 2 181 I 3 5
Source: World Bank Development Indicators
8

Table 2. Income Taxonomy for ADB Developing Members l (WB by UN)
19 LIC 12 LMIC 3 UMIC
25 LIFDC 17 8 0
6 TRANS 4 2 0
7 SIDC 1 6 0
22 NFIM 13 8 I
12 NFEX 6 4 2
15 NAIM 9 5 1
19 NAEX 10 7 2
lSee VaIdds and McCalla (1999) for definitions for LIFDC.
Table 4 indicates FIC scores for the country group. A higher score implies a lowercapacity to finance food imports. On average, EAPAC has the lowest capacity (0.47) andECA has the highest capacity (0.22). Among the members, Thailand has the highestcapacity (0.02) and Samoa has the lowest capacity (2.31). They are both in EAPAC,which indicates a great heterogeneity of EAPAC members regarding capacity to financefood imports.
The Case of Thailand, Philippines, Vietnam, Bangladesh, and Sri Lanka
This section examines five ADB developing country members that are also WTOmembers as of 2000. The five differ in income levels, net trade positions, ruralpopulation, and agricultural labor composition. Thailand and the Philippines are LMICs;the former is a net agricultural and food exporter, while the latter is a net agricultural andfood importer. Vietnam and Bangladesh are LICs; the former is a net agricultural andfood exporter, while the latter is a net agricultural and food importer. Sri Lanka is LMIC,which is NAEX but NFIM.
The shares of agriculture in GDP and population and shares of rural population arecompared between these five countries in Figure 3. While Thailand is the largestagricultural exporter, the shares of agriculture in GDP are the lowest among the five.This appears to be the case due to the fact that a large share of agricultural production inThailand is devoted to exports. This is supported by the country's high value ofagricultural exports per agricultural labor as seen in Table 4.
In contrast, the Philippines has a higher GDP share of agriculture than Thailand, but itsvalue of agricultural exports per agricultural labor is much smaller. In addition, thedeviation between agricultural labor shares and shares of rural population in Thailandimplies a significant degree of non-farm agricultural production. Part of this can beaccounted for by processing firms that intend to export their products.
9
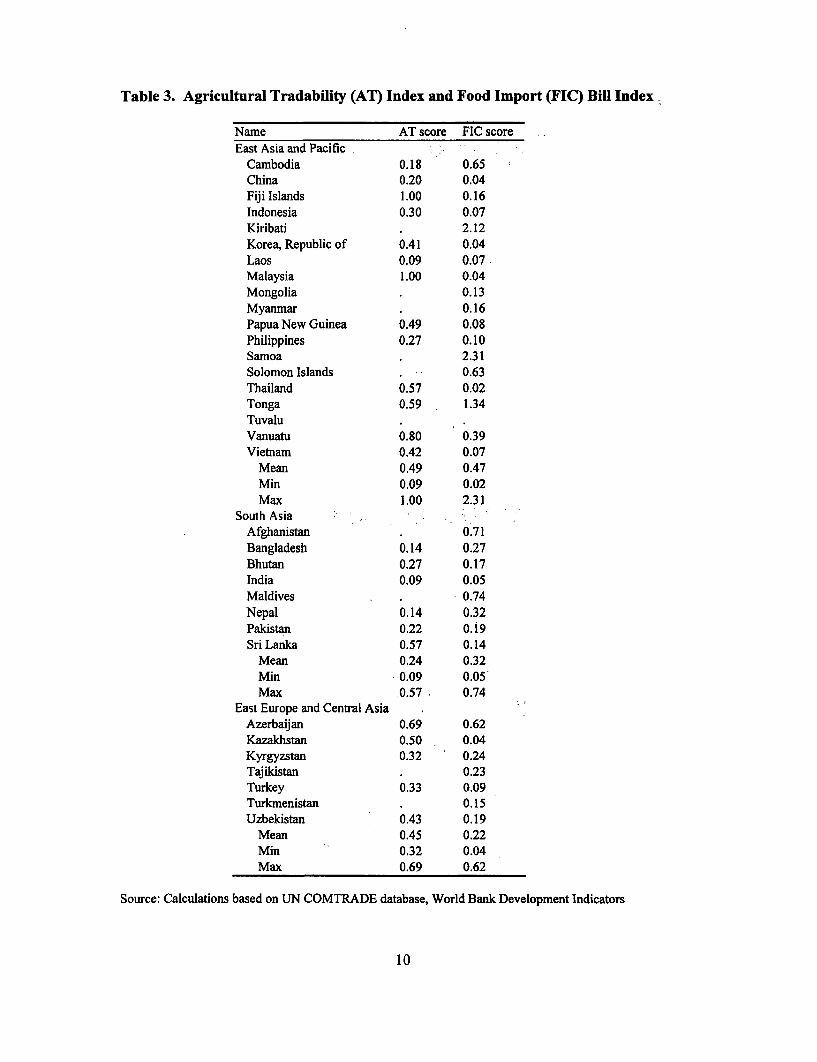
Table 3. Agricultural Tradability (AT) Index and Food Import (FIC) Bill Index
Name AT score FIC scoreEast Asia and Pacific
Cambodia 0.18 0.65China 0.20 0.04Fiji Islands 1.00 0.16Indonesia 0.30 0.07Kiribati . 2.12Korea, Republic of 0.41 0.04Laos 0.09 0.07Malaysia 1.00 0.04Mongolia . 0.13Myanmar . 0.16Papua New Guinea 0.49 0.08Philippines 0.27 0.10Samoa . 2.31Solomon Islands . 0.63Thailand 0.57 0.02Tonga 0.59 1.34TuvaluVanuatu 0.80 0.39Vietnam 0.42 0.07
Mean 0.49 0.47Min 0.09 0.02Max 1.00 2.31
South AsiaAfghanistan . 0.71Bangladesh 0.14 0.27Bhutan 0.27 0.17India 0.09 0.05Maldives . 0.74Nepal 0.14 0.32Pakistan 0.22 0.19Sri Lanka 0.57 0.14
Mean 0.24 0.32Min 0.09 0.05Max .0.57 0.74
East Europe and Central AsiaAzerbaijan 0.69 0.62Kazakhstan 0.50 0.04Kyrgyzstan 0.32 0.24Tajikistan . 0.23Turkey 0.33 0.09Turkmenistan . 0.15Uzbekistan 0.43 0.19
Mean 0.45 0.22Min 0.32 0.04Max 0.69 0.62
Source: Calculations based on UN COMTRADE database, World Bank Development Indicators
10

Vietnam and Bangladesh appear to have similar characteristics in terms of the role ofagriculture, but their positions in trade are different. Vietnam is active in agriculturalexports and outward oriented according to its high AT value. The value of agriculta.ralexports per agricultural labor is much lower in Bangladesh (US$ 2) than in Vietnam (US$40). Vietnam's share of agricultural labor and rural population are similar, which impliesthat unlike Thailand, food products constitute a significant part of Vietnam's agriculturalexports.
The divergence of the shares of agricultural labor and rural population in Sri Lankaresembles that of Thailand. The country is significantly export-oriented. A greaterspecialization in non-farm agricultural products makes it both NAEX and NFIM.
As Table 4 shows, the value of agricultural exports per agricultural labor are alsoindicative of a country that specializes in agricultural exports relative to the domesticproduction of agricultural products. Thailand has the highest score, while its share ofagriculture in GDP is low. This implies that agricultural production in Thailand is highlyexport-oriented Thailand has a clear competitive advantage in agricultural exports andrelatively skilled labor force deployed in agriculture. The extent to which barriers areremoved through WTO negotiations to producers such as Thailand is of significantimportance. Thailand could also benefit more directly than others in the region fromfurther unilateral and bilateral moves to liberalize. Vietnam and Sri Lanka are NAEX, butthe values of exports per agricultural labor are not as high as that of Thailand. Thisimplies that their agricultural production is more diverse between domestic supply andexports. Thailand, consequently, is more sensitive to change in trade reform.
The destination of agricultural exports and import partners for these countries are alsohighly diverse. Table 5 and Table 6 indicate the shares of import and export value, andimports to a countries' own region, and to developed countries, respectively. The topthree partner countries are shown in Table 7. Trade flow is computed as an average ofannual trade flow between 1996 and 1998. These tables indicate the concentration of thedirection of trade, particularly with regard to exports. They also show a high dependencyof these countries' exports to developed country markets. This is particularly true forEAPAC countries.
While developing countries in EAPAC are Vietnam's major export partners, Japan andthe US are the major market for both Thailand and Philippines exports. These lattercountries are more capable of accessing distant markets. South Asian countries exportmore to the Middle East and Transition Economies than to their own regions anddeveloped countries. India is a major import partner for both countries. Since Thailandis NAEX, it is most interested in domestic policy reform in developed countries. On theother hand, domestic policy reform in the Philippines is of interest to the US andAustralia.
The WTO Agenda and Potential Impact of Trade Liberalization on ADB MemberDeveloping Countries
Nineteen of the 34 ADB developing countries were WTO members in 2001. Ninecountries held observer status. This suggests a growing participation of ADB developingcountries in the WTO. As discussed earlier, the shares of agriculture in their exports and
11

GDP is still significant, and hence they are expected to pursue their trade intereststhrough WTO negotiations and other regional FTA such as the APEC. They very oftensubmit their proposals in a coalition of countries with common interests, such as ASEAN,Cairns Group, Caricom, Mercosur, etc.
Figure 3. Share of Agriculture in GDP and Population
90 - 0 GDP share of agriculture
80 _ *~~~~~~~ Agricultural labor force 80 _0 O Rural population
70-
60-
, 50_
a.40-
30-
20-
10-
Bangladesh Vietnam Philippines Thailand Sri Lanka
Source: Author calculations based on World Bank Development Indicators
Table 4. Agricultural and Food Trade Indicators
Exports Growth Exports per Net Net food Income Food AT FIC($ 1994- unit agricultural trade level Deficitmillion) 1998 agricultural trade position
(%) labor ($) positionThailand 7951 10.7 380 Exporter Exporter LMIC 0.57 0.02Philippines 1832 -6.1 147 Importer Importer LMIC LIFDC 0.27 0.10Vietnam 1089 71.4 40 Exporter Exporter LIC 0.42 0.07Bangladesh 84 17.3 2 Importer Importer LIC LIFDC 0.14 0.27SriLanka 708 11.1 193 Exporter Importer LMIC LIFDC 0.57 0.14Source: Calculations based on UN COMTRADE database, World Bank Development Indicators
Table 5. Share of Regional Exports and Exports to Developed Countries
Country Export partner Value of Market share Export value Market shareregion regional export (%) to developed countries (%)
($ million) ($million)Thailand EAPAC' 2861 33 5475 64Philippines *EAPAC 348 18 1595 85
12

Vietnam EAPAC 523 48 762 70Bangladesh SA 13 24 14 26SriLanka SA 64 7 383 43' All East Asia and Pacific except Japan.Source: Calculations based on UN COMTRADE database, World Bank Development Indicators
Table 6. Share of Regional Imports and Imports from Developed Countries
Country Import partner Value of Market share Import value from Market shareregion regional import (%) developed countries (%)
($ million) ($million)Thailand EAPAC 311 10 1649 55Philippines EAPAC 821 28 1850 62Vietnam EAPAC 245 65 241 64Bangladesh SA 288 21 499 37SriLanka SA 173 21 440 54Source: Calculations based on UN COMTRADE database
Table 7. Agricultural Export and Import Partners
Country Export Export value Market share Import Import value Market sharepartner ($million) partner ($million)
Thailand Japan 1606 19 USA 656 22Thailand USA 1175 14 Australia 374 13Thailand Indonesia 600 7 India 143 5
Philippines USA 618 33 USA 840 28Philippines Netherlands 286 15 Australia 399 13Philippines Japan 280 15 China 249 8
Vietnam Singapore 196 18 Singapore 72 19Vietnam Japan 240 22 Korea 64 17Vietnam Korea, Rep. 87 8 Japan 41 11Vietnam Taiwan 41 11
Bangladesh Poland 13 23 India 259 19Bangladesh Pakistan 6 12 Australia 136 10Bangladesh Afghanistan 6 12 USA 128 10
SriLanka Arnenia 107 12 India 119 15Sri Lanka Russia 87 10 USA 75 9Sri Lanka Turkey 58 6 Australia 71 9Source: Calculations based on UN COMTRADE database
The Agreement on Agriculture of the WTO was established to ensure continued reformtoward more open trade in agriculture and competitive markets. LDC members weregiven special treatment through lengthened implementation timetables for tariffreductions and reduction of subsidies. There were 44 proposals submitted by 90countries to the WTO for various topics in the negotiations as of March 21, 2001. Theseproposals are summarized in Table 8. The issues of the most concern for food exporting
13

developing countries (for example, the Cairns group3) include market access, subsidy anddomestic support, and sanitary and phytosanitary standards as a new agenda item.
The elimination of protection and price supports should result in gains for net exportersand losses for net importers. The effect of elimination of protections and supportsdepends upon which countries initiate these reforms, and on the extent to which thesemeasures affect importing or exporting sectors. Table 10 summarizes potential impacts oftrade policy reform in industrial countries, and in their own countries, whereliberalization involves elimination of protection and support.
Market Access
The WTO Agreement on Agriculture limits the scope of 'market access' to tariffs alone.Quotas and other non-tariff measures should be converted to tariff equivalents. Targetsfor tariff cuts were set on food and non-food agricultural products among WTO members.Tariff rates in agricultural imports are still high, but are being reduced as scheduled in theWTO member countries.
Table 9 indicates weighted averages of applied tariff rates for developing and developedcountries and selected ADB member countries. Developing countries, except LDCs,should reduce tariffs on farm products by 24 percent in the period 1995-2004. Minimumcuts per product should be 10 percent. The base level for tariff cuts was the bound ratebefore January 1, 1995, and for unbounded tariffs, the actual rate charged in September1986 when the Uruguay Round began. Quotas on textiles are scheduled to be reduced tozero over a 10-year period.
The impact of tariff reductions is predicted for the selected five countries. Thailand isNAEX and NFEX, but has high taliff rates on agricultural products. It maintains, as notedin Table 9 tariff rates of 32. 1%. This is a weighted average of all tariffs and even thoughproductivity is high relative to other producers in the region, it continues to maintaintariff protection. Since it is NAEX, this implies that proportional tariff reduction willincrease its exports, if export partners reduce tariffs and increase imports in their homecountries. The former change can be larger since it's AT score, which measuresopenness, is high. In the latter case, it is still unlikely to change its trade position toNAIM, because its exports, which are supported by high agricultural labor productivity,significantly outweigh its imports. Its impact on domestic food bills will be small, sinceits FIC score is quite low. In sum, a competitive producer such as Thailand has much togain from unilateral reduction in tariff rates through the process of WTO negotiations.
The Philippines is NAIM and NFIM, and hence tariff reduction in export partners tendsto deepen its net trade position. If this increases relative to the world price of imports,then the country can suffer from an increase in agricultural import prices. If its domestictariffs are cut, imports can increase. There are factors to offset the impact of domestictariff reduction. It has an average tariff rate much lower than Thailand. This implies thatproportional tariff reduction in the Philippines will have less impact on its agriculturalimports. It also has a lower AT score than Thailand, which also mitigates impacts on the
3 The Cairns Group was established in 1986 by a group of medium-sized agricultural exporting countries topursue common agricultural trade objectives in the Uruguay Round.
14

imports. Consumers tend to gain from tariff reduction. Because it is LIFDC-it has toimport food -lower prices for imported products will reduce food bills. Imports arerestrained, however, by their low total export revenue (a higher FIC score than inThailand).
Vietnam has the lowest agricultural tariff rate among the 5 selected countries. Since it isNAEX and NFEX with a high AT score, tariff reduction is anticipated to have a largeeffect on agricultural imports and exports in the same direction as it would on those inThailand. But the impact of domestic tariff reduction is likely to be smaller if tariffs arereduced proportionally. Furthermore, growth in agricultural exports in Vietnam is about70 percent. Continuous high growth in agricultural exports is anticipated.
Table 8. Selected Proposals Received f in WTO Agricultural Negotiations
Proposals Discussion papers /submissionsComprehensive US, EU, Japan, Switzerland,
Mauritius, small island developingstates, Rep of Korea, Mali,Norway, India, Poland, Morocco,Turkey, Egypt, Nigeria, Congo(Dem Rep), Kenya, Senegal,Mexico
Export competition Cairns Group, EU Mercosur+
* Export restrictions, taxes . Cairns Group
* Export credits * Mercosur, Bolivia, Chile,Costa Rica, Guatemala,India and Malaysia
Domestic support Cairns Group, US
* Blue box * EU
* Green box * Developing countriesgroup (2)
* Transition issues * Transition economies
Market access Canada, Cairns Group, developingcountries group (3), transitiongroup, Caricom
* food quality * EU
* tariff-rate quotas * US
* and S&D for small * Swazilanddeveloping countries
Non-trade concerns 38 countries, Argentina
15

* animal welfare * EU
Development, S&D Developing countries group (1),ASEAN
Other:
* state trading enterprises * Mercosur+
Source: Based on World Trade Organization (2001) documents.
In contrast, Bangladesh will increase exports to its partners, if tariff rates in thedestination market are reduced with the possibility of increases in import prices. Ifdomestic tariff rates are reduced, it will deepen its position as NAIM and NFIM. Sinceits average tariff rate is higher than that of Vietnam, a proportional tariff reduction athome will result in a greater increase in agricultural imports. A lower import price isexpected to benefit domestic consumers, but its capacity to finance food imports willlimit this benefit from accruing to an extent greater than in the case of the Philippines, asits FIC score is higher.
Bangladesh and Sri Lanka have moderate levels of tariff protection. But the effect oftariff reduction can be different as both countries are different in agricultural tradepositions. Since Bangladesh is NAIM and NFIM, tariff reduction at home will increaseagricultural imports in general. On the other hand, tariff reduction at home will increasefood imports, but may not affect non-food agricultural products in Sri Lanka, since it isNAEX and NFIM. Whether tariff reduction in the export partners will benefit Sri Lankawill also depend on product sectors.
Table 9. Applied Rates of Tariff on Agricultural Products(Weighted Average), 1996-1999
Developing countries (90) 18.1Industrialized countries (23) 6.4
East Asia (13) 16.8South Asia (6) 24.0Transition Europe (15) 16.2ADB (19) 21.8
Thailand 32.1Philippines 18.9Vietnam 14.3Bangladesh 21.4Sri Lanka 23.8
Source: Calculated based on World Bank data
Export Subsidies and Domestic Support
16

As the Uruguay Round recognizes, all developing countries except LDCs are obligated toreduce the value of subsidies and subsidized quantities of exports by 24 and 14 percentfor the base period 1986-1990, respectively. The Agreement on Agriculture furtherrequires members to notify the WTO of their intent to use export subsidies (WTO 2000a).
As of February 2001, 25 member countries are now allowed to use the subsidy. Theyare mainly middle to high-income countries, and Indonesia is the only one that was on thelist. This is partly because many developing countries are incapable of financing exportsubsidies.
Domestic supports such as production subsidies are more common among developingcountries and are often market distorting. Due to their variety and complexity, it isdifficult to establish common measures for support. Aggregate measurements of support(AMS) were used in the Uruguay Round (2000b). AMS should be reduced by 13 percentfor the base period of 1986-1988. The Agreement on Agriculture classifies countries intofour groups: (1) those with AMS in an acceptable range (Green Box), (2) those who havehigh AMS but have agreed to reduce (Amber Box), (3) those with AMS beyond the rangeof (2) (Red Box)-forbidden, and (4) those who are exempt from the general rule, but withpayment associated with acreage or animal numbers.
Like the case of tariff reduction, implication of elimination of subsidy and support isderived and presented in Table 10.
In general, elimination of export subsidies and domestic support of export partners canincrease relative competitiveness of exporting countries, likely resulting in an increase ofexports of a country. This kind of reform tends to benefit net agricultural exporters morethan net importers. It can however increase world price of previously supportedproducts. This change is unfavorable for net agricultural importers, since it tends toresult in greater import prices for these products. Elimination of export subsides anddomestic support in the home country can reduce their exports. More significant losseswill occur to net exporters. Furthermore, elimination of domestic support can adverselyaffect domestic producers that have also been supported by the policy (e.g., productionsubsidies).
Sanitary and Phytosanitary Standards and New Agenda Items
Debate over sanitary and phytosanitary standards, although not directly part of thenegotiations on agriculture, provides part of the subtext for discussion on liberalization inthe sector overall. There are a number of key issues for developing countries, asexpressed in proposals submitted to the WTO as part of the agriculture negotiationsthrough March 2001. The emphasis on developing country concerns at the WTO is alsoreflected in the involvement of the General Council in the debate over implementation ofthe SPS and TBT Agreements for developing countries starting in early 2001 "WTOGeneral Council, Implementation-Related Issues and Concerns."
It is important to note that the majority of submissions to the WTO have centered ondeveloping countries and the SPS, although it is clear that there is not a unified positionbeing taken by all middle income or least developed countries. A number of proposalsunder discussion reference equivalence and harmonization of standards and Article 4 of
17

the SPS Agreement. From developing country perspectives, concerns aboutharmonization center largely on problems in access to information and lack ofparticipation in international standard-setting activities (World Bank 2000b). Standardsdeveloped by CODEX, the International Plant Protection Convention (IPPC), andInternational Office of Epizootics (OIE) can facilitate harmonization, however, limitedresources in developing countries precludes their access and active engagement in theirdevelopment.
The proposal submitted by the Small Island Developing States (G/AGING/W97) to theWTO, along with several others, suggests access to the appropriate technology to meetSPS standards and assistance to participate in international standards setting. These arefirst steps necessary before concrete progress can be made toward harmonization.
It is difficult for most developing countries to have their standards accepted as"equivalent" by developed countries. Mutual Recognition Agreements (MRAs) are notfeasible given the lack of modern facilities to test and certify in many countries. Evenunder conditions of technological parity between trading partners, such as the U.S.,Europe, and Japan, there is little evidence that MRAs will facilitate trade. . Submissionsby Cuba and other members in the Western Hemisphere, Asia, and Africa (G/AG/W37)suggest that "failure to recognize equivalence of measures" is a major problemconfronting developing countries.
The SPS Committee did agreed, however, in October 2001 on guidelines on recognizingthe equivalence of differing SPS measures. The decision clarifies the type of informationimporting and exporting countries should provide and factors that importing countriesneed to consider, such as historical trade patterns and avoiding obstacles to trade. Thedecision also references importance of technical assistance and emphasizes methods tofacilitate transparent regulatory measures.
The requirements on the application of science and risk assessment in decision-makinghave also been addressed in proposals by developing countries to the agriculturenegotiations. The SPS Agreement (Articles 2 and 5) includes obligations that SPSmeasures be based on principles of international science and risk assessments of harm inorder to minimize trade distortions. A central problem in the SPS framework concernsthe lack of balanced considerations of dynamic benefits to economic development andtrade under conditions in which acceptable risk is not set at zero tolerance levels. Whencombined with the lack of progress on harmonization of standards and escape clauses forsetting regulation to meet national needs, developing country exporters are at a cleardisadvantage.
As noted in the case of aflatoxin standards set in Europe, setting regulations at differinglevels within a range of risk tolerance levels can have a significant impact on trade.Several proposals reflect concern over balancing science and risk in the SPS Agreement.India (G/AG//NG/W102) argues that overly strict SPS measures have denied marketaccess opportunities for developing countries. The Small Island Developing States(G/AG/NG/W97) suggest that developing countries should not be subject to risk
18
assessment requirements when bans are imposed to protect bio-diversity andenvironmental balance.4
Discussions regarding the precautionary principle and food safety are important areas offocus for developing countries. The SPS Agreement in Article 5.7 does provide flexibilityfor provisional or temporary measures to regulate for safety reasons under conditions inwhich scientific evidence is "insufficient." The EU proposal, however, is counter to theimplicit movement toward objective risk assessments based on international consensusscience embedded in the SPS Agreement. Broadening escape clauses in the SPSAgreement, even framed within general principles reflected in other sections of theAgreement (transparency, non-discrimination) to provide a check against the use of newtechnology in agriculture, is likely not consistent with needs to improve productivity inthe developing world. Several net food-importing members, however, have noted theimportance that food safety standards are met by exporters (Mauritius, among others).Kenya has raised the need to ensure that imports meet international food safety standardsso that exporters cannot divert lower quality exports to overseas markets(GIAG/WNG/136).
Special and differential (S&D) treatment for developing countries is referenced in Article10 of the SPS Agreement. Some WTO members have suggested that S&D treatmentshould include mandatory provision of technical assistance, or that longer phase-in periodsbe allowed for developing countries to implement obligations under the SPS Agreement.It is doubtful, however, that a focus on the expansion of S&D treatment is in the long-terminterests of developing countries, especially the least developed in Asia and Africa.Integration into the WTO system requires a focus on the tools to implement commitmentsand exercise rights, not a process of S&D treatment that provides an easy way to postponenecessary action on technical assistance.
Finally, the debate over genetically modified organisms (GMO) in agriculture is also ofparticular relevance to developing countries in the current negotiations. The adaptationof technology to expand agricultural production should be of central concern to both netfood importers, as well as exporters. The benefits of adoption of GMO techniques based
4Developing countries also have a stake in the outcome of debate over the proposed recognition of the"multi-functionality" of agricultural production. The European Union (EC Comprehensive NegotiatingProposal, G/AG/NGIW/90) has suggested that non-trade concerns should be addressed in WTOagreements, including the SPS Agreement, in order to address environmental, consumer, and other needls.Poland and other Eastern European countries have expressed general support for inclusion of these topics inthe negotiations. Animal welfare considerations, along with the role of agriculture in cultural heritage andpreservation of rural lifestyles, biological diversity, amnong other issue are generally reference in the debateover multi-functionality or non-trade concerns. To the extent recognition of non-trade concerns providesadditional channels through which trade is restricted in agricultural commodities, net exporters from theleast developed nations will be disadvantaged. At a minimum, detailed debate and negotiating resourcesdevoted to issues that are not central to the basic functioning of the SPS agreement in regard to notification,risk assessment and management techniques, use of international standards, will only delay progress inbuilding on the foundations of the Agreement. India's submission (G/AG/NG/W114) includes reference tosimilar notes of caution in this area.

on experience and technology in use in the U.S., Canada, Europe, and other developedcountries is clear. The problems in today's international trading system include a lack ofconsensus on the basic elements of a regulatory approach, and a system suited to GMcrops and byproducts, the costs and benefits of labeling programs, and whether WTOdisciplines in the TBT and SPS Agreements are suited to this type of technology.Moreover, the relationship between the Biosecurity Protocol and WTO disciplinesremains uncertain. Proposals in the agriculture negotiations have addressed GMO andrelated labeling protocols, including submissions by Korea, Japan, Europe and otherWTO members. Egypt has banned imports of tuna canned in oil based on perceptions ofrisk related to GM modified soybeans. Thailand has registered complains arguing thatthe tuna is not prepared with GM soybeans. A certification program may provide ameans to settle the dispute. Whether consensus on labeling, harmonized conformityassessment mechanisms, or the need for regulation in this area at all can be achievedwithin the context of WTO negotiations is not certain.
Table 10. Developing Country Perspectives on the Major Agricultural Trade Issues
A. Partner Country Country to B. Own Domestic Country toReforms gain Trade Policy Effect gain
1. Market Access Net Exporters [+ I 1 Thailand I PhilippinesNet Importers [-1 2 Vietnam Net Importers [+] 2 Bangladesh
AT score [mag] 3 Sri Lanka AT score [mag]FIC1 [+LIFDC [+]
2. (Elimination of) Net Exporters [+] I Thailand Net Exporters [-]Export Subsidies Net Importers [-] 2 Vietnam
AT score [mag] 3 Sri Lanka AT score [mag]FIC-' [+1
_ _ _ _ _ _ _ _ _ _ _ _ _ _ _ _ _ _ _ _ _ _ _ _ _ _ _ _ _ _ _ _ _ _ _ _ _ _ _ L IF D C 1+1 _ _ _ _ _
3. (Elimination of) Net Exporters [+] I Thailand Net Exporters [-]Domestic Support Net Importers [-] 2 Vietnam Net Importers [+] I Philippines
AT score [mag] 3 Sri Lanka AT score [mag] 2 BangladeshFIC-' 1+]LIFDC [+]
4. (Elimination of) SPS Net Exporters Net Exportersmeasures [+ if protective]2 I Thailand [- if trade-promoting]
2 Vietnam Net Importers I Philippines[- if trade-promoting] 3 [+ if protective]4 2 BangladeshAT score [mag] AT score [mag]
_ _ _ _ _ _ _ _ _ _ _ _ _ _ _ _ _ _ _ _ _ _ _ _ _ _ _ _ _ _ _ L IF D C +Notes:1. The nature of the impact is denoted by [+] beneficial and [-] adverse.
[mag] denotes 'magnifying' the impact.2. Gain in market access due to less restrictive regulation.3. Loss in market access due to lower SPS standards.4. The effect of reform on domestic food safety is not considered.Source: Adopted from Valdes and McCalla (1999) and modified by authors.
20

Concluding Remarks: Doha and Beyond
Trends in agricultural trade in past 10 years are quite heterogeneous across developingregions. Though slowly declining for past 10 years, shares of agriculture in GDP are stillhigh in East Asia and Pacific and South Asia. Shares of rural population are still highamong ADB developing country members. Trade reform in their export partners,particularly, the OECD countries, will affect a significant share of population in thesecountries, resulting in rural poverty alleviation.
The East Asia and Pacific region includes a significant number of net agriculturalexporters. India and Sri Lanka among South Asian countries also are net agriculturalexporters that have had a dominant role in the regions' exports.
Trade liberalization is expected to benefit these net exporter countries, particularly thosethat are highly open to trade. It is anticipated they will support the liberalization. India'sagricultural exports have penetrated the South Asian market, and hence domestic policiesin its regional partners will be an issue of priority. Seven out of nine WTO observersamong the ADB developing countries are net agricultural importing countries. They areexpected to be more cautious about trade reforms whose benefits and costs are mixed.
What is also important, but often neglected, is a country's pattern of specializationbetween domestic supply and export. Our analysis of allocation of production resourcessuch as labor indicates a great divergence among the ADB developing countries. Forexample, Thailand is highly specialized in export, and hence impact of trade reform,particularly reforms in exporting partners, can have an important implication for itsexport. Countries whose production is directed mainly to domestic production tend to bemore sensitive to change in domestic support. Therefore, positions toward the WTOnegotiations can be different even among net exporters.
21

References
Bale, M. (1999). East Asia: Economic Recovery and Agricultural Trade Reform. Paperpresented at The Conference on Agriculture and New Trade Agenda in the WTO 2000Negotiations, October 1-2, 1999, Geneva, Switzerland.
Blarel, B., G. Pursell, and A. Valdes, eds. (1996). Implications of the Uruguay RoundAgreement for south Asia: The Case of Agriculture. Washington, D.C. and Rome, Italy:The World Bank/Food and Agriculture Organization.
Fukase, E. and W. Martin (1999). "A Quantitative Evaluation of Vietnam's Accession tothe ASEAN Free Trade Area." Policy Research Working Paper #2220.
Washington, D.C.: The World Bank.
Hertel, T. and W. Martin (2000). "Liberalizing Agriculture and Manufactures in aMillennium Round: Implications for Developing Countries." World Economy, 23 (4):455-469.
Valdes, A. and A. F. McCalla (1999). Issues, Interests and Options of DevelopingCountries. Paper presented at The Conference on Agriculture and New Trade Agendain the WTO 2000 Negotiations, October 1-2, 1999, Geneva, Switzerland.
World Bank (2000a). Average Tariff Rates by sector and FDI Inflows for all countries inrecent years. http://wwwl.worldbank.org/wbiep/trade/TR_Data.html.
. (2000b). World Development Report 2000/2001: Attacking Poverty.Washington, D.C.: The World Bank.
World Trade Organization (WTO) (2000a). Export Subsidy. Document G/AGING/S/5,May 11, 2000. Geneva: WTO.
. (2000b). Domestic Support. WTO document G/AG/NG/S/1, April 13, 2000.Geneva: WTO.
. (200 1c). Agriculture Negotiations Backgrounder: the Issues, and Where We AreNow. http://www.wto.org/english/tratop_e/agric_e/negoti_e.htm. March 21, 2001.Geneva: WTO.
22


Policy Research Working Paper Series
ContactTitle Author Date for paper
WPS2778 Technology and Firm Performance Gladys L6pez-Acevedo February 2002 M. Gellerin Mexico 85155
WPS2779 Technology and Skill Demand Gladys L6pez-Acevedo February 2002 M. Gellerin Mexico 85155
WPS2780 Determinants of Technology Adoption Gladys L6pez-Acevedo February 2002 M. Gellerin Mexico 85155
WPS2781 Maritime Transport Costs and Port Ximena Clark February 2002 E. KhineEfficiency David Dollar 37471
Alejandro Micco
WPS2782 Global Capital Flows and Financing Ann E. Harrison February 2002 K. LabrieConstraints Inessa Love 31001
Margaret S. McMillan
WPS2783 Ownership, Competition, and Geroge R. G. Clarke February 2002 P. Sintim-AboagyeCorruption: Bribe Takers versus Lixin Colin Xu 37644Bribe Payers
WPS2784 Financial and Legal Constraints to Thorsten Beck February 2002 A. YaptencoFirm Growth: Does Size Matter? Asli Demirguc-Kunt 38526
Vojislav Maksimovic
WPS2785 Improving Air Quality in Metropolitan The Mexico Air Quality February 2002 G. LageMexico City: An Economic Valuation Management Team 31099
WPS2786 The Composition of Foreign Direct Beata K. Smarzynska February 2002 P. FlewittInvestment and Protection of 32724Intellectual Property Rights: Evidencefrom Transition Economies
WPS2787 Do Farmers Choose to Be Inefficient? Donald F. Larson February 2002 P. KokilaEvidence from Bohol, Philippines Frank Plessmann 33716
WPS2788 Macroeconomic Adjustment and the Pierre-Richard Agenor February 2002 M. GosiengfiaoPoor: Analytical Issues and Cross- 33363Country Evidence
WPS2789 "Learning by Dining" Informal Somik V. Lail February 2002 Y. D'SouzaNetworks and Productivity in Sudeshna Ghosh 31449Mexican Industry
WPS2790 Estimating the Poverty Impacts of Jeffrey J. Reimer February 2002 P. FlewittTrade Liberalization 32724

Policy Research Working Paper Series
ContactTitle Author Date for paper
WPS2791 The Static and Dynamic Incidence of Dominique van de Walle February 2002 H. SladovichVietnam's Public Safety Net 37698
WPS2792 Determinants of Life Insurance Thorsten Beck February 2002 A. YaptencoConsumption across Countries Ian Webb 31823
WPS2793 Agricultural Markets and Risks: Panos Varangis February 2002 P. KokilaManagement of the Latter, Not the Donald Larson 33716Former Jock R. Anderson
WPS2794 Land Policies and Evolving Farm Zvi Lerman February 2002 M. FernandezStructures in Transition Countries Csaba Csaki 33766
Gershon Feder
WPS2795 Inequalities in Health in Developing Adam Wagstaff February 2002 H. SladovichCountries: Swimming against the Tide? 37698
WPS2796 Do Rural Infrastructure Investments Jocelyn A. Songco February 2002 H. SutrisnaBenefit the Poor? Evaluating Linkages: 88032A Global View, A Focus on Vietnam
WPS2797 Regional Integration and Development Maurice Schiff February 2002 P. Flewittin Small States 32724
WPS2798 Fever and Its Treatment among the Deon Filmer March 2002 H. SladovichMore or Less Poor in Sub-Saharan 37698Africa
WPS2799 The Impact of the Indonesian Lisa A. Cameron March 2002 P. SaderFinancial Crisis on Children: Data from 33902100 Villages Survey
WPS2800 Did Social Safety Net Scholarships Lisa A. Cameron March 2002 P. SaderReduce Drop-Out Rates during the 33902'Indonesian Economic Crisis?
WPS2801 Policies to Promote Saving for Dimitri Vittas March 2002 P. InfanteRetirement: A Synthetic Overview 37642
WPS2802 Telecommunication Reforms, Access Antonio Estache March 2002 G. Chenet-SmithRegulation, and Internet Adoption Marco Manacorda 36370in Latin America Tommaso M. Valletti
WPS2803 Determinants of Agricultural Growth Yair Mundlak March 2002 P. Kokilain Indonesia, the Philippines, and Donald F. Larson 33716Thailand Rita Butzer