Liberalisation and - Universiteit Twente
83
Liberalisation and wind energy adoption in Europe Stijn van Ewijk
Transcript of Liberalisation and - Universiteit Twente

Liberalisation and
wind energy adoption
in Europe
Stijn van Ewijk

Liberalisation and wind energy
adoption in Europe
MASTER THESIS
In partial fulfilment of the requirements for the
Master of Science in Sustainable Energy Technology and the
Master of Science in Public Administration at the
University of Twente
Author
Stijn van Ewijk
Supervisors
Dr. M. J. Arentsen
Dr. T. Hoppe
Prof. dr. ir. T. H. van der Meer
Twente Centre for Studies in Technology and Sustainable Development
Enschede, 24-05-2013
Cover image: Merriam Webster Learner‘s Dictionary.

2

3
Summary
The last two decades were transformative for the European electricity supply industry
(ESI). Markets were liberalised and renewable energy sources took a significant share of
the supply. This study relates liberalisation to the development of wind energy in the Eu-
ropean electricity industry. It uses the multi-level perspective (MLP) to analyse the effect
of liberalisation on the transition towards wind energy. The theory serves as an inspiration
for a panel data analysis of electricity reform and wind energy adoption in 19 European
countries.
The theoretical framework is based on the multi-level perspective on technological transi-
tions (TT) (Geels, 2002). The MLP conceptualizes three levels that matter to TT. Technolog-
ical innovation originates at the niche level where particular applications of the technolo-
gies enable maturation. If sufficiently mature, the technology may enter the regime level
where technologies are applied on a large scale and on a competitive basis. The regime
describes the electricity supply industry from generation to transmission, distribution and
retail. Finally, at the landscape level, neoliberal thinking affects the regime by imposing
liberalisation measures.
The hypotheses on the effect of separate liberalisation measures on the degree of wind
energy adoption are tested by means of panel data analysis. Liberalisation is captured as
a set of seven measures with scores according to their level of implementation. Wind en-
ergy adoption is described by shares of wind in national electricity production and shares
in electric capacity. The control variables describe the relevant dimensions of the regime,
niche and landscape levels that influence wind development. A fixed effects test shows
correlations between liberalisation and wind energy shares.
The descriptive analysis reveals that privatisation was introduced rather independently of
other measures. The explanatory analysis shows that third party access, wholesale markets
and privatisation have mostly positive effects on wind energy adoption. An independent
regulator negatively affects wind shares. For unbundling, the results are ambiguous. Retail
markets for industry negatively affect wind energy whereas full retail markets have no
significant effect. The explanatory power of the outcomes may be compromised due to a
small sample size, rather crude data and mono-method bias.
Future research may focus on other renewables like solar and biomass, the nexus between
liberalisation, renewable energy development and sectoral policy, or the combined appli-
cation of the multi-level perspective and quantitative methods on other technological
transitions. The results of this study can be an inspiration or guide for understanding
technological transitions, combining qualitative and quantitative methods or designing
energy policy and regulation.

4

5
Foreword
Of the great construction projects of the last century, none has been more
impressive in its technical, economic and scientific aspects, none has been more
influential in its social effects, and none has engaged more thoroughly our
constructive instincts and capabilities than the electric power system.
(Hughes, 1993, p. 1)
As illustrated by Hughes (1993), the electric power system offers challenges that fall with-
in both the realms of social sciences and engineering sciences. It is therefore the perfect
theme for a combined thesis in Sustainable Energy Technology and Public Administration.
The far reaching implications of electrification make it a subject that is not only multi-
disciplinary, but also highly relevant and very challenging.
The drawing on the cover explains much of the developments this thesis aims to analyse.
In the early days, the Dutch harvested the power of the wind to drain marshes. Through-
out Europe, wind power was used to grind, saw and bore. In Denmark firstly, wind was
converted to electricity and used to electrify rural villages. Today, environmental concerns
have made wind energy an important source of electricity in Europe.
The ―great construction project‖ of the electricity supply industry led to publicly owned
and vertically integrated monopolistic industries that supplied every European citizen with
electric energy and provided the backbone of economic development. Liberalisation of
electricity markets aims to improve the performance of this industry: higher efficiency,
lower costs, better market response. And perhaps: more wind energy?
The latter question is the theme of this thesis: what is the effect of liberalisation on wind
energy adoption? In answering this question I chose to adopt a well-known qualitative
framework on technological change and combine it with econometric analysis of panel
data. As such, my thesis is not only a study into liberalisation and wind energy adoption
but also an attempt at innovating theory and methodology.
As a learning experience, this work allowed me a glimpse of what scientific research en-
tails. I learned the pitfalls of lacking data, the unfathomability of statistics, the elusiveness
of scientific discourse and the fragility of scientific rigour. I never felt as if I had to climb
too steep, but firm ground to build on often lacked. With this thesis, I hope to have
drained the marsh a little bit more for other researchers and policy makers.
I am grateful to many people. To Maarten Arentsen, who was a great inspiration and who
helped me do research as a social scientist in spite of my engineering background. To
Evren Özcan, who made sure I remained an engineer with a healthy scepticism towards
social sciences. To Thomas Hoppe, Theo van der Meer, Peter Geurts and my colleagues at
CSTM who made it an instructive and enjoyable experience to work on my thesis.
Stijn van Ewijk

6

7
Abbreviations
The following abbreviations are used throughout the thesis.
AC Alternating Current
CCGT Combined Cycle Gas Turbine
CCOT Combined Cycle Oil-fired Turbine
CFBC Circulating Fluidised Bed Combustion
DC Direct Current
DSO Distribution System Operator
ESI Electricity Supply Industry
ETS Emissions Trading System
EU European Union
FE Fixed Effects (statistics)
GDP Gross Domestic Product
ICDE Internal Combustion Diesel Engine
ISO Independent System Operation
ITO Independent Transmission Operator
kW Kilowatt
kWh Kilowatt hour
MW Megawatt
M Million
MLP Multi-level perspective
nTPA Negotiated TPA (see: TPA)
OCGT Open Cycle Gas Turbine
OECD Organization for Economic Co-operation and Development
OTC Over The Counter (wholesale model)
PCA Principal Component Analysis
PCC Pulverized Coal Combustion
PV Photovoltaic
RD&D Research, Development and Deployment
rTPA Regulated TPA (see: TPA)
SB Single Buyer TPA (see: TPA)
TPA Third Party Access
TSO Transmission System Operator
TT Technological Transition(s)
VI Vertically Integrated Undertaking

8

9
Contents
Summary .................................................................................................................................. 3
Foreword .................................................................................................................................. 5
Abbreviations .......................................................................................................................... 7
1. Introduction .................................................................................................................. 11
1.1. Background ......................................................................................................................................................... 11
1.2. Research question ............................................................................................................................................ 11
1.3. Theoretical framework .................................................................................................................................... 12
1.4. Methodology ...................................................................................................................................................... 13
1.5. Contribution ........................................................................................................................................................ 13
1.6. Structure of the thesis .................................................................................................................................... 14
2. Theoretical framework ................................................................................................ 15
2.1. Multi-level perspective ................................................................................................................................... 15
2.2. Landscape: electricity reform ....................................................................................................................... 22
2.3. Regime: adaptive capacity ............................................................................................................................ 25
2.4. Niche: wind energy innovation ................................................................................................................... 39
2.5. Hypotheses .......................................................................................................................................................... 43
3. Methodology ................................................................................................................ 45
3.1. Sample ................................................................................................................................................................... 45
3.2. Operationalization ............................................................................................................................................ 46
3.3. Data collection ................................................................................................................................................... 53
3.4. Statistical analysis ............................................................................................................................................. 53
4. Results ............................................................................................................................ 59
4.1. Descriptive statistics ........................................................................................................................................ 59
4.2. Explanatory statistics ....................................................................................................................................... 64
4.3. Discussion ............................................................................................................................................................ 66
5. Conclusion ..................................................................................................................... 71
Bibliography .......................................................................................................................... 73
Appendices ............................................................................................................................ 79
Appendix A – Empirical evidence in several studies on liberalisation ......................................................... 79
Appendix B – Conversion routes for common electricity generation technologies .............................. 80
Appendix C – Comparative performance of wind energy ................................................................................ 81
Appendix D – Survey questions and answer options ......................................................................................... 82

10

11
1. Introduction
A great network of power lines which will forever order the way in which
we live is now superimposed on the industrial world.
Thomas P. Hughes (1993, p. 1)
This thesis studies the relationship between liberalisation of the electricity supply
industry and the adoption of wind energy technology. The empirical analysis is em-
bedded in the multi-level perspective on technological transitions. The following
sections explain the background of the research, the research question, the theoret-
ical framework, the methodology, and the contribution of this study to the litera-
ture. Finally, the structure of the thesis is illustrated.
1.1. Background
Led by a determination to create a competitive internal energy market and bring down
prices, the European electricity market has been gradually liberalised since the 1990s.
Technical progress or environmental concerns were never a priority or driving force for
these reforms (Verbong and Geels, 2007; Jamasb and Pollitt, 2008). In light of the growing
concerns regarding climate change and environmental pollution, the effect of liberalisa-
tion on renewable energy development seems very relevant. Furthermore, quantitative re-
search on this topic is scarce.
The reform of national European electricity markets is aimed at ultimately enabling a sin-
gle European energy market. Liberalisation entails changing a vertically integrated public-
ly owned electricity supply industry (ESI) into a competitive and privately owned industry.
The main steps for liberalisation are restructuring of the industry, the introduction of
competitive markets, introduction of new regulation, and changes in ownership. The re-
forms of the European electricity market were initiated with the EU Directives of 1996 and
2003 (EC, 1996; EC, 2003).
Wind energy is a major source of renewable energy in the European Union. It is the se-
cond largest renewable source of electricity after hydropower. Besides, it features a much
higher growth rate than hydropower; electricity production from wind has grown nearly
200 fold over the last 20 years (Eurostat). As such, wind energy seems a very relevant form
of renewable energy. Moreover, it can be more easily captured than other renewables
since wind energy is not used in complex hybrid forms (like bio-energy) or at widely vary-
ing scales (like solar energy).
1.2. Research question
This research aims to find the relationship between the liberalisation of the electricity
supply industry and the adoption of wind energy in electricity generation. It tries to an-
swer the following research question.

12
What are the effects of liberalisation of the electricity supply industry on
wind energy adoption in European countries?
The specific research questions focus on the effect of the specific measures observed in
the liberalisation process. They are of the following form: ―What is the effect of a specific
liberalisation measure in the electricity supply industry on wind energy adoption in Euro-
pean countries?‖. The measures are: introduction of an independent regulator, unbun-
dling of existent utilities, retail market opening, wholesale market opening, introduction
of third party access and privatisation of incumbents.
1.3. Theoretical framework
The theoretical framework is the multi-level perspective (MLP) developed by Geels (2002).
The MLP provides a framework for analysis of technological change through interactions
at three different levels. Innovation originates at the niche-level and permeates to the re-
gime level under increasing pressure from the landscape level. MLP suits well for the em-
pirical analysis since it explicitly distinguishes niche developments (wind energy) and
landscape pressures (liberalisation). Furthermore, it takes into account many important
non-technological factors that influence transitions.
The MLP has already been used for numerous case studies on the energy sector (Kemp,
1994; Geels, 2002; Geels, 2005; Verbong and Geels, 2007; Verbong and Geels, 2010;
Shackley and Green, 2007; Kern and Smith, 2008; Foxon, 2011; Yuan, 2012). Following rec-
ommendations found in literature, this study aims to more rigorously and systematically
apply the MLP (e.g. Genus and Coles, 2008). Since the framework has not been operation-
alized for panel data analysis before, this research may further develop the MLP.
Landscape
Liberalisation
(independent variable)
Wind resources
Population density
GDP
↓ ↓
Regime
Lib
era
lisa
tio
n Unbundling
Wholesale market
Retail markets
Independent regulator
Third Party Access
Privatisation
→
Adaptive capacity → Wind share
(dependent variable)
No
n-l
ibera
lisa
tio
n
Capacity mgmt.
Electricity use
Clusters
Feed-in-tariff
Attitudes
→
↑
Niche
Turbine size
RD&D
Figure 1 – Theoretical framework: causal relationships embedded in the MLP.

13
Figure 1 displays the theoretical framework as operationalized in this thesis. The general
theory is explained section 2.1. The figure shows the causal relationships between the in-
dependent variable (liberalisation), the dependent variable (wind share), and the control
variables. The variables are located at the different levels of the MLP: landscape, regime
and niche. The hypotheses regard the either positive or negative effect of the separate
liberalisation measures on the wind energy share. The concept of adaptive capacity expli-
cates the causality.
The three levels have distinct properties. The landscape describes slowly changing varia-
bles and high level (European Union) politics. The regime describes the domestic electrici-
ty supply industry. The niche is a protective space for novel technologies like wind tur-
bines. The adaptive capacity describes the susceptibility of the regime to technological
innovations springing from the niche. The adaptive capacity is determined by a set of var-
iables within the regime. These variables are partly affected by the landscape through lib-
eralisation and partly independent of liberalisation.
1.4. Methodology
The hypotheses are tested through analysis of panel data on the electricity supply indus-
tries of 21 European countries from 1990 till 2007. The relation between wind energy
adoption and liberalisation is studied by means of statistical analysis. Descriptive statistics
provide insight in the dynamics of the liberalisation process and wind energy adoption.
The interrelatedness of the liberalisation measures is studied by means of factor analysis.
A fixed effects test discloses the average effect of each liberalisation measure on the
share of wind energy in electricity generation and the electric capacity.
The sample includes 19 EU member states and Norway and Switzerland. Other EU mem-
ber states were left out mainly due to lack of data. Most of the data on liberalisation is
derived from an OECD survey (Conway and Nicoletti, 2006). It is supplemented by several
other sources (Grote, 2008; OECD, 2003). The data on wind energy adoptions is from Eu-
rostat and the control variables are based on a variety of sources including the Interna-
tional Energy Agency (IEA), Eurostat, World Economic Forum (WEF) and the European
Wind Energy association (EWEA).
1.5. Contribution
Previous work on liberalisation and renewable energy development is mainly of two types.
First, liberalisation has been analysed statistically with regard to performance indicators
like electricity price (Steiner, 2000; Hattori and Tsutsui, 2004; Copenhagen Economics,
2005; Zhang et al., 2008; Nagayama, 2009; Schmitt and Rammerstorfer, 2010). Of these
studies, none focusses specifically on both renewables and liberalisation. As an exception,
Carley (2009) includes deregulation in a panel data analysis of many factors influencing
renewables.
Second, the link between liberalisation and renewable energy development has been
studied qualitatively. Delmas et al. (2007) analyse the effect of deregulation on renewa-
bles, but from a utility perspective. Milstein and Tishler (2011) study the effect of intermit-
tency on fuel mix and market prices in deregulated markets. However, to the authors
knowledge, liberalisation and renewable energy development have not been the core in-
terest of a quantitative study so far. As such, this study aims to fill the literature gap on
the relation between electricity market reform and renewable energy adoption.

14
1.6. Structure of the thesis
Figure 2 displays the structure of thesis. It illustrates the contents of the chapters 2-5 and
distinguishes the sections on the three levels of the MLP with three separate columns.
First, the upcoming chapter presents the theoretical framework by explaining MLP in gen-
eral and subsequently discussing each level in depth. From this discussion, the hypothe-
ses follow. The methodology chapter starts with the sample followed by the operationali-
zation of the variables. After that, data collection for these variables is briefly described.
Then, the statistical analyses are explained. Based on the analyses, the results chapter pre-
sents the descriptive and explanatory statistics and a discussion of the findings. The thesis
wraps up with a conclusion.
Chapter Sub Content
2. Theory 2.1 Multi-level perspective
2.2 Landscape
2.3
Regime
2.4 Niche
2.5 2.5 Hypotheses
3. Methodology 3.1 Sample
3.2 Operationalization
3.2.1 Landscape: liberalisation
3.2.2 Regime: wind energy
3.2.3 Landscape controls Regime controls Niche controls
3.3 Data collection
3.4 Statistical analysis
4. Results 4.1 Descriptive statistics
4.2 Explanatory statistics
4.3 Discussion
5. Conclusion 5 Conclusion
Figure 2 – Structure of the thesis.
15
2. Theoretical framework
He who loves practice without theory is like the sailor who boards ship
without a rudder and compass and never knows where he may cast.
Leonardo da Vinci (1970)
The empirical study of liberalisation and wind energy adoption is embedded in the
multi-level perspective on technological transitions. First, the MLP is described gen-
erally and operationalized for this study. Subsequently, the operationalization is
further explained by highlighting the mechanisms reigning each level of the MLP.
The levels are discussed in separate sub chapters. Finally, the hypotheses on the ef-
fect of liberalisation on wind energy adoption are formulated.
2.1. Multi-level perspective
This subchapter gives an introduction to the theoretical framework. It first explains the
origin and prevalence of the multi-level perspective and subsequently describes the main
features of the theory. The sections that follow operationalize the MLP for liberalisation
and wind energy adoption and present a causal diagram based on the MLP. The theoreti-
cal justification for the chosen operationalization is given in the sub chapters on the three
levels of the MLP (sections 2.2-2.4).
2.1.1. Origin and prevalence
The MLP was first presented in its most popular form by Geels (2002). It uses elements of
evolutionary economics and technology studies and draws on earlier multi-level ap-
proaches like Rip and Kemp (1998). The MLP is meant as a heuristic and analytical frame-
work for studying technological transitions, but not as an ontological description of reality
(Geels, 2002). MLP aims to avoid pitfalls of other methodologies by focussing on dynamic
processes instead of end states and by inclusion of social dynamics and contexts. It deals
with discontinuous change and tries to balance endogenous and exogenous dynamics
(Verbong and Geels, 2010).
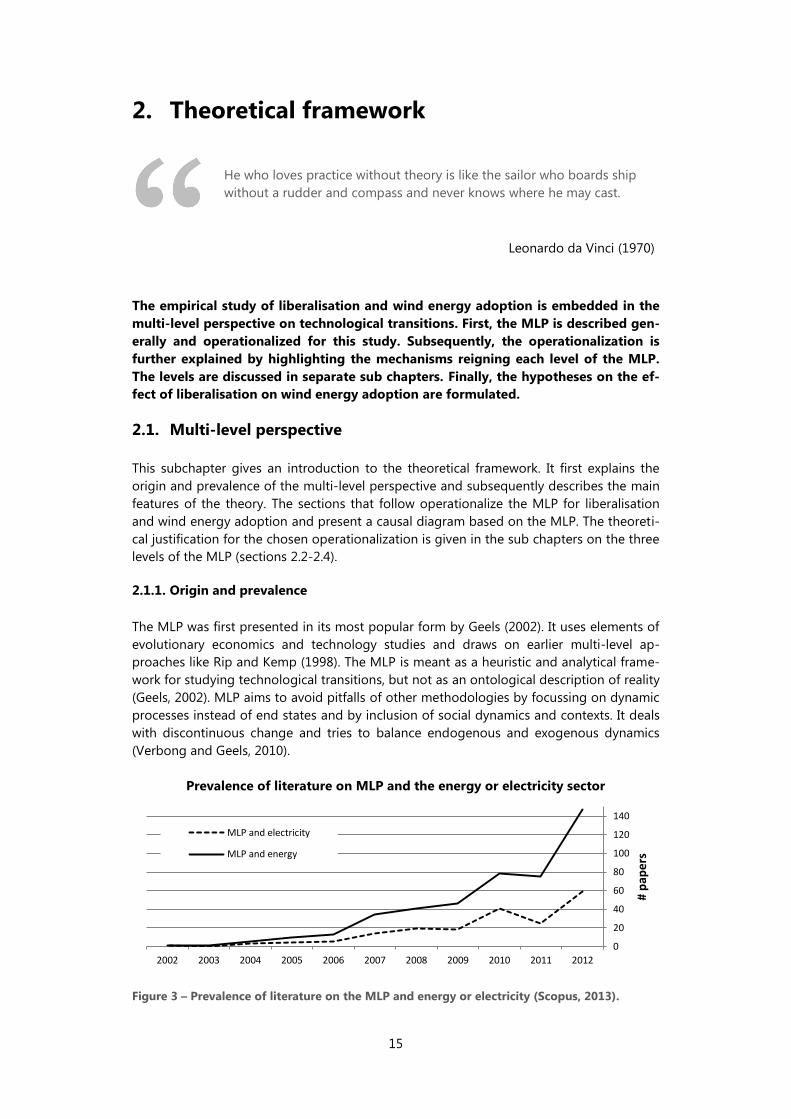
Prevalence of literature on MLP and the energy or electricity sector
Figure 3 – Prevalence of literature on the MLP and energy or electricity (Scopus, 2013).
0
20
40
60
80
100
120
140
20122011201020092008200720062005200420032002
# p
ape
rs
MLP and electricity
MLP and energy

16
Several authors have used the multi-level perspective (MLP) to discuss the technological
transition in the energy sector (Kemp, 1994; Geels, 2002; Geels, 2005; Verbong and Geels,
2007; Verbong and Geels, 2010; Shackley and Green, 2007; Kern and Smith, 2008; Foxon,
2011; Yuan, 2012). All these studies concern case studies of the energy sector in specific
countries or general theoretical discussions. Figure 3 shows the prevalence of MLP litera-
ture on energy or electricity in the past ten years in the Scopus scientific literature data-
base.1 Clearly, there has been an enormous growth in the literature. Other fields of inter-
est for MLP scholars are transport, infrastructures and sustainability (Geels, 2011).
2.1.2. Transitions in the MLP
The MLP aims to describe technological transitions in socio-technical configurations like
the Electricity Supply Industry. The ESI can be categorized as a socio-technical configura-
tion since it fulfils the societal function of powering homes, businesses and industries by
means of technology. Socio-technical configurations consist of technologies, infrastruc-
tures, markets and user practices, industrial networks, sectoral policy, techno-scientific
knowledge and cultural and symbolic meanings (Geels, 2002). Jacobsson and Bergek
(2004) speaks of comparable ―technological systems‖ consisting of actors and their com-
petences, networks and institutions.
The liberalisation of the ESI and the introduction of renewable energy technology can be
analysed as technological transitions. TT are ―major, long-term technological changes in
the way societal functions are fulfilled‖ and describe changes in possibly all aspects of so-
cio-technical configurations. TT mean a change of one socio-technical configuration to
another (Geels, 2002). It involves replacement or supplementing of technology, change in
institutions that support the conventional technologies and the emergence of actors that
trump those with vested interests in the old system (Jacobsson and Bergek, 2004).
Landscape
Landscape pressure Regime pressure
Regime
Old regime
Regime destabilization
New regime
Niche innovation
Niche
Time
Figure 4 – Transitions in the multi-level perspective (Adapted from Geels (2004)).
1 Based on two queries in Scopus (03-2012): ALL(―Multi-level perspective‖ electricity) and ALL(‖Multi-level per-
spective‖ energy).

17
Figure 4 displays the essence of the MLP. The middle level of the MLP consists of the
aforementioned socio-technical configuration or regime. The seven-pointed shapes indi-
cate the regime and its dimensions. The regime is embedded in the highest level: the
technological landscape. This level is described by highly inert technology-external factors
such as economic growth, political trends and norms and values. Change is only incre-
mental. On the lowest level there are so-called niches where technologies are shielded
from the market selection of the regime and radical innovations can develop.
The arrows in figure 4 display technological transitions as theorized in the MLP. Techno-
logical transitions come about through interactions between processes at the three levels.
First, changes at the landscape level such as economic development or political shifts cre-
ate pressure on the regime. Second, niche-innovations build pressure on the regime
through learning processes, improvement of technical and economic performance and
support from influential actors. Third, the destabilization of the regime through landscape
pressures opens the door for niche-innovations. The newly established regime may sub-
sequently influence the landscape (Geels, 2004).
Technological transitions thus originate in technological niches where novel technologies
emerge in protected markets such as aerospace applications. Novelties may ―move up‖ in
the socio-technical regimes through improvement of their performance and strategic
niche management. Landscape trends regarding regime performance put pressure on the
regime. Solar cells for instance entered the mainstream market through better perfor-
mance, supportive regulation like feed-in tariffs and concerns over the environmental per-
formance of the regime. Subsequently, the transition may influence landscape develop-
ments. In Germany for instance, solar cell technology is nowadays responsible for signifi-
cant economic activity shaping the country‘s economic policies.
Regime change does not come easily since several mechanisms grant regimes stability.
First, cognitive, normative and formal rules stabilize the regime through fixed search heu-
ristics of engineers, rigid perceptions of proper behaviour, and legally binding standards
and contracts. Second, interdependencies in actor networks contribute to organisational
capital that leads to resistance to change. Third, material structures like power plants and
the grid are inert through lumpy investments, compatibility issues and network externali-
ties (Geels, 2004). These stabilizing effects will be addressed throughout the thesis.
2.1.3. Operationalization
In order to analyse transitions in the electricity supply industry, the three levels of the MLP
need to be demarcated clearly. By definition, regimes are already defined on a functional
basis: they are socio-technical configurations that fulfil societal functions (Geels, 2002).
The following sections operationalize the MLP in three steps. First, liberalisation and wind
energy adoption are positioned within the MLP. Second, the geographical delineation on
the basis of national borders is presented. Lastly, the regime is delineated more precisely
by discussing the boundaries of all seven dimensions of the regime. By delineating the
regime, the boundaries of the landscape and niche are defined at the same time.
18
Landscape, regime, niche
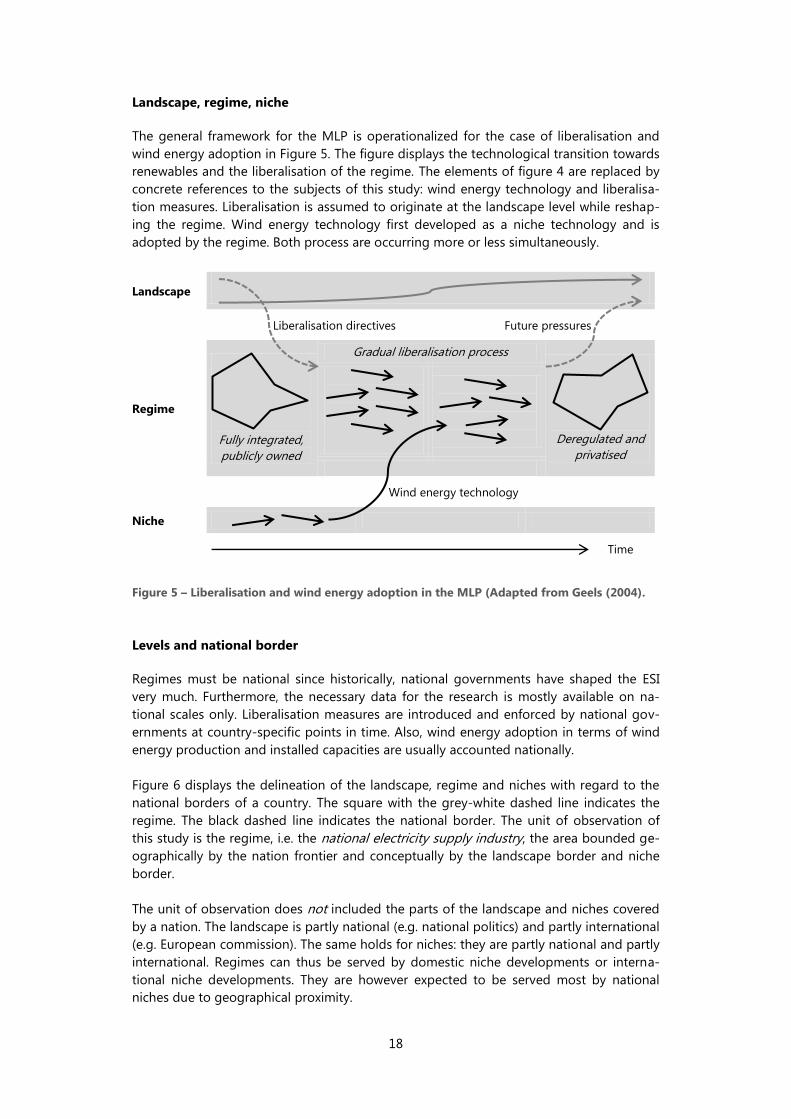
The general framework for the MLP is operationalized for the case of liberalisation and
wind energy adoption in Figure 5. The figure displays the technological transition towards
renewables and the liberalisation of the regime. The elements of figure 4 are replaced by
concrete references to the subjects of this study: wind energy technology and liberalisa-
tion measures. Liberalisation is assumed to originate at the landscape level while reshap-
ing the regime. Wind energy technology first developed as a niche technology and is
adopted by the regime. Both process are occurring more or less simultaneously.
Landscape
Liberalisation directives Future pressures
Regime
Fully integrated,
publicly owned
Gradual liberalisation process
Deregulated and
privatised
Wind energy technology
Niche
Time
Figure 5 – Liberalisation and wind energy adoption in the MLP (Adapted from Geels (2004).
Levels and national border
Regimes must be national since historically, national governments have shaped the ESI
very much. Furthermore, the necessary data for the research is mostly available on na-
tional scales only. Liberalisation measures are introduced and enforced by national gov-
ernments at country-specific points in time. Also, wind energy adoption in terms of wind
energy production and installed capacities are usually accounted nationally.
Figure 6 displays the delineation of the landscape, regime and niches with regard to the
national borders of a country. The square with the grey-white dashed line indicates the
regime. The black dashed line indicates the national border. The unit of observation of
this study is the regime, i.e. the national electricity supply industry, the area bounded ge-
ographically by the nation frontier and conceptually by the landscape border and niche
border.
The unit of observation does not included the parts of the landscape and niches covered
by a nation. The landscape is partly national (e.g. national politics) and partly international
(e.g. European commission). The same holds for niches: they are partly national and partly
international. Regimes can thus be served by domestic niche developments or interna-
tional niche developments. They are however expected to be served most by national
niches due to geographical proximity.

19
Landscape
Regime
Niche
White-grey dashed line: regime. Black dashed line: country border.
Figure 6 – Delineation of the MLP for the electricity supply industry.
Delineation of dimensions
The regime is contrasted more precisely from niches and the landscape on the basis of
the seven dimensions that span the regime: technologies, infrastructures, markets and us-
er practices, industrial networks, sectoral policy, techno-scientific knowledge and cultural
and symbolic meanings. Based on this delineation, the dimensions are further operation-
alized in section 2.3 with a focus on the likelihood of adoption of niche-innovation. The
delineation of the landscape and niches follows from the delineation of the regime.
Technology defines most clearly the border between niches and regimes. Technologies
are simplified to generation technologies and their add-ons within the geographical (i.e.
national) boundaries of a regime. All other technological features are considered under
infrastructure. Landscapes refer to wider ―technology-external‖ factors (Geels, 2002) and
do thus not include technological features.
The border between regimes and niches is drawn by competition. Niches allow for devel-
opment of radical novelties through protection from ―normal‖ market selection in the re-
gime (Geels, 2002). Niches serve as protective spaces for radical innovation that may not
survive the selection environment of the regime (Rip and Kemp, 1998). So, niches are ap-
plications of new technologies that do not, or only indirectly, compete with the existent
regime of the electricity supply industry. The following categories of competition can be
distinguished.
1. Direct competition may occur when renewable electricity generation is either con-
nected or disconnected to the grid. When connected, electricity sources compete
with each other since they deliver the same product to the same market. When dis-
connected, users may still choose between electricity from the grid or the stand-
alone generation unit. Rooftop solar panels may compete through delivering electric-
ity to the grid or by acting as an alternative to electricity from the grid.
2. Indirect competition occurs when electricity is generated at locations that are not,
but may potentially be, grid-connected. Since there is no alternative electricity source
direct competition is absent. The production of electricity with stand-alone units may
however decrease the demand for grid extensions to the concerned location, imply-
ing a weak form of competition. In Europe however, non-grid connected settlements
are very rare and this category of competition can thus be neglected.
ESI ESI ESI
International
National
National
International

20
3. Absence of competition is likely when renewable electricity generation is applied in
mobile applications or when future grid connection is unfeasible. A mobile applica-
tion of wind energy that does not compete with the grid are sailing ships. Further-
more, wind turbines and solar photovoltaic systems can be set up at distant locations
the grid will never reach. Such applications are niche-applications since there is no
competition with the regime.
Within the regime, technologies may also be protected through additional measures (e.g.
feed-in tariff). This does not count as a niche since the technology is still in competition
with other regime components performing the same function. Feed-in-tariffs and other
protective policies are a confirmation of the existence of competition rather than a signal
that competition is absent. Such policies will be discussed further in section 2.3.4.
Infrastructure of the regime includes all the distribution and transmission nodes and links
of the national electricity grid. Cross-border connections lead to overlaps in national in-
frastructures. Their effect is similar to the European Union directives on energy policy:
they balance differences between countries. Since niche-technologies are by definition
not grid connected, there is no infrastructure overlap with niches.
Markets are limited to retail and wholesale markets in this study. The retail market is al-
ways defined national, the wholesale market is either national or international. As liberali-
sation unfolds, wholesale markets are increasingly international. For the sake of practicali-
ty, markets are assumed national and fit within national borders. Niches are separate mar-
kets with competition conditions separate from those in the regime.
Sectoral policy consists of rules and laws regarding the electricity supply industry. Policy is
imposed by the landscape on the regime. The regime does not make policy itself apart
from regulations by a dedicated authority. The mandate for this authority however, origi-
nates in the landscape. Actors in the landscape are European Union officials and high lev-
el national politicians and bureaucrats.
Networks for the electricity supply industry are found to cover both the regime, land-
scape and niche and are therefore hard to delineate in any way. For analytical reasons, it
is more interesting to look at clusters instead of networks. Clusters are network-like ar-
rangements and by definition geographically bounded (Porter, 2000). They can therefore
by analysed as phenomena that fall within national boundaries.
Culture and symbolic meaning can be described as the behavioural attitudes towards
technological functions in the regime. Again, the national boundaries of the regime de-
scribes the relevant population that may hold these attitudes. This seems reasonable since
public perceptions of technology may be strongly defined by national politics, national
norms and values and national experiences.
Techno-scientific knowledge is found at the niche level and the regime level. Typical re-
gime level knowledge regards optimization of incumbent technology with technological
and economic knowledge. At the niche level, knowledge regards breakthrough innovation
based on both fundamental sciences and applied sciences. At the landscape level, being
explicitly technology-external, techno-scientific knowledge is not relevant.

21
2.1.4. Causal diagram
The MLP is a process-oriented theory (Geels, 2011) and does not explicitly address causal-
ity. The causality of technological transitions can be conceptualized further using the no-
tion of adaptive capacity (Smith et al., 2005). The adaptive capacity represents the ability
of the regime to adopt niche innovations and is affected by landscape pressures like lib-
eralisation. The following sections explain the notions of adaptive capacity, landscape
pressure and niche pressure.
a) Adaptive capacity
A decisive characteristic of the regime in analysing transitions is its ability to handle pres-
sure and adapt accordingly. This dimension is expressed by Smith et al. (2005) in terms of
adaptive capacity. Niche-innovations can be an important source of adaptation of re-
gimes (e.g. Rip and Kemp, 1998; Geels, 2002). So, the adaptive capacity can be formulated
as ―the ability to adopt niche-innovations to increase performance‖. Performance criteria
are for instance cost and environmental impact.
Landscape Liberalisation
(independent variable)
Macro trends
↓ ↓
Regime
Liberalisation measures →
Adaptive capacity → Wind share
(dependent variable)
Regime variables →
↑
Niche Wind technology
Figure 7 – Causal diagram based on the MLP.
Figure 7 presents the causal structure between liberalisation and wind energy adoption. In
the illustration, liberalisation or neoliberal thinking at the landscape level results in the
implementation of liberalisation measures in the regime. The measures influence the
adaptive capacity. Also, several other regime level variables (relating to the regime dimen-
sions) influence the adaptive capacity. Wind energy adoption is affected by the adaptive
capacity, third variables at the landscape level and novel technologies offered by the
niche level.
The following three subchapters discuss the relevant processes at each of the three levels
and justify the causal structure in figure 7. First, in section 2.2, liberalisation is shown to be
a landscape pressure originating in neoliberal thinking. Second, in section 2.3, the adap-
tive capacity of the regime is discussed with regard to liberalisation and non-liberalisation
factors. Third, in section 2.4, the niche is shown to pressure the regime by offering novel
technology. From these three subchapters, hypotheses are derived in section 2.5.

22
2.2. Landscape: electricity reform
Electricity reform originates at the landscape level in neoliberal thinking and affects the
regime through concrete liberalisation measures. The following sections discuss first how
reform originates in the landscape and why the envisioned effects of neoliberalism are
disputable. Next, privatisation is identified as a trend separate from other reform
measures. Subsequently, the European Union directives regarding the implementation of
liberalisation are explained.
2.2.1. Neoliberalism
The origins of electricity reforms are found in neoliberal thinking. Neoliberalism is gener-
ally held to be ―political-economic governance premised on the extension of market rela-
tionships‖ (Larner, 2000). As public policy, neo-liberalism is mostly defined by privatisation
and liberalisation of services delivered in network industries that were previously state-
owned monopolies (Belloc and Nicita, 2012). Neoliberalism is based on the proposition
that ―both parties to an economic transaction benefit from it, provided the transaction is
bilaterally voluntary and informed‖ (Friedman, 1962, p. 55). Furthermore, neoliberalism
presupposes that markets decide the value and thus the salary of workers and will auto-
matically self-adjust to full employment (Palley, 2005).
The addition ―neo‖ suggests it regards a rejuvenated form of liberalism, meaning that lib-
eralism has been flourishing, declined and is now on rise again (Thorsen, 2009). The de-
cline and revival of liberalism implies the existence of a competing paradigm, identified by
Larner (2000) as ―Keynesian welfarism‖. Simply put, under neo-liberalism governments
abandon the welfare state and widen the space for markets. Economic liberalism first
flourished in nineteenth century England with laissez-faire economics and free trade. After
the second World War Keynesianism was the dominant paradigm with comparatively
strong regulations, powerful unions, and extensive social protection. The revival of liberal-
ism – neo-liberalism – in the last quarter of the twentieth century commenced with the
economic policies of Thatcher in the UK (1979) and Ronald Reagan in the US (1980) (Pal-
ley, 2005).
Critique on neoliberalism is three-fold. First, the assumptions on the functioning of mar-
kets is thought to be wrong due to market failures like network effects. Second, liberal-
ized markets are thought to have harmful effects like high income inequality. Third, the
virtues of free market transaction are contested. Barnett (2009) holds that ―proponents of
free-markets think that people should act like utility-maximising rational egoists, despite
lots of evidence that they don‘t‖. On the other hand, ―critics of neoliberalism tend to as-
sume that increasingly people do act like this, but they think that they ought not to‖.
Finger and Künneke (2011) note that liberalisation is ubiquitous in spite of ―very different
technological conditions of the sectors involved, different socio-political preferences and
needs, and different political ideologies‖ (p. 1). An explanation for this high support for
neoliberalism may be that neo-liberalism is more than an economic policy that derives
popularity from its economic performance. Larner (2000) understands neo-liberalism both
as a policy, an ideology and a discourse and notes that neo-liberalism may be more an
ethical ideal than a set of established institutions. Clarke (2005) holds a similar view by
claiming the neo-liberal model does not aim ―so much to describe the world as it is, but
the world as it should be‖.

23
Amable (2011) argues that social support for neo-liberal ideology can be based on the
ethics of self-reliance. The ethics of self-reliance derives its popularity from the explicit re-
jection of discrimination and equal treatment of all. This frames neo-liberalism as the
―American dream‖ were the upward social ladder is open to everybody. Amable (2011)
notes that those expecting to go up the ladder will be in favour of neo-liberalism, those
going down will oppose it. Logically, given the pyramid distribution of social status, ne-
oliberalism can therefore count on majority support.
It is important to know whether or not the share of renewables is somehow a driver for
liberalisation since this would complicate causal inference. According to empirical evi-
dence by Drillisch and Riechmann (1998), liberalisation is insignificantly related to envi-
ronmental commitment. The share of renewables is included in their operationalization of
environmental commitment. This finding coincides with notions of other authors about
environmental concerns not being on the liberalisation agenda (e.g. Verbong and Geels,
2007; Jamasb and Pollitt, 2008).
2.2.2. Privatisation
There are several reasons to isolate privatisation from neoliberalism and explore its own
rationale. Contrary to other reform measures, there is solid evidence that privatisation ful-
fils at least the promise of higher efficiency. Furthermore, there is mixed evidence that as
opposed to other liberal policies like easing market entry, privatisation has not successful-
ly crossed the ideological cleavage and diffused to left-wing politics (Belloc, 2011; Pitlik,
2007, Potrafke, 2010). Also, factor analysis in this study shows that privatisation is execut-
ed relatively independently from all other measures in electricity reform.
Privatisation seems to have its own appeal through its promise of efficiency and utility as
a ―political weapon‖. Vickers (1991) analyses privatisation as the balance between gov-
ernment failure and market failure. In the case of state ownership, a government bureau-
crat has both the objective of maximizing welfare and a possible personal agenda. The
pursuit of a personal agenda is the cause of government failure but can be restrained by a
well-functioning political system. However, political success is not always related to state-
enterprise performance. Only in cases like plant closure the pressure to serve the public
good may sufficiently strong to establish the feedback loop between society and bureau-
cratic performance.
Private ownership implies that the enterprise is driven by private profit maximization.
Since social welfare is related to profit this can be advantageous for society as a whole.
This effect may however be compromised in two ways. First, similar to bureaucrats, man-
agers may feel only limited pressure to not follow their personal agenda. The perfor-
mance of managers may be hard to relate to performance indicators like share prizes or
product quality. Second, benefits to social welfare may be less than optimal due to market
failures like distributional effects and market power.
The empirical evidence surveyed by Vickers (1991) supports the idea that privatisation can
yield more efficient performance under competitive conditions. A more recent survey by
Megginson and Netter (2001) shows that privatisation leads almost always to higher effi-
ciency while lost jobs are offset by increased performance. Boycko et al. (1996) develops a
model that supports the thesis that politicians are more problematic than managers. So,
privatisation can be successful since it ―controls political discretion‖. The superiority of
private ownership under market power is however questionable and seems to depend
very much on additional regulation.

24
Feigenbaum (1994) analyses privatisation through a political lens. Whereas privatisation
can be a ―tool box‖ for public officials or a ―preferred mechanism‖ for economist, it is a
―weapon‖ to politicians. The political perspective is not based on the premise of a ubiqui-
tously accepted idea of public interest but on the assumption of a divide of interest and
conflict. Motivations for privatisation can be 1) pragmatic, such as reducing budget drain,
2) tactical, such as attracting voters or rewarding supporters, or 3) systemic, such as low-
ering government expectations and transforming the stakes in the political game.
Feigenbaum (1998) shows in a cross-country case study of France, the UK and the US that
privatisation motives are indeed political of nature and based, to some extent, on the ide-
al to change the political and societal culture. Additionally, some empirical evidence for
the contention that politics matter is provided by Bortolotti et al. (2000), who show that
budget constraints are drivers for privatisation. Bortolotti and Pinotti (2003) demonstrate
that privatisation can be tactical game since right wing executives try to boost their re-
election chances by spreading shares of public offerings among domestic voters.
2.2.3. European directives
In Europe, neoliberal thinking has materialized in the European Union directives on the
single market. Most reforms of the electricity market are either directly ordered by the Eu-
ropean electricity directives or a consequence of those directives. In some cases, like for
the United Kingdom, many reform measure were already in place before the directives.
Some countries became EU Member States in a later phase and where thus not directly
affected by the directives in earlier years.
The Single European Act (EC, 1987) established the principle of one European internal
market and paved the way for the Internal Energy Market (EC, 1988) working document.
This document signalled the start of the reforms throughout the 1990s and was followed
up by several directives (Bower, 2002). Liberalisation was realized through directives in
1996, 2003, and 2009 (EC, 1996; EC, 2003; EC, 2009). Table 1 displays the measures as
mandated by these directives. The content of each measure and its aim are explained in
the coming sections. Privatisation is not explicitly required by the directives.
Table 1 – Liberalisation steps as order by EU directives (based on EC, 1996; EC, 2003; EC, 2009).
1996 Directive 2003 Directive 2009 Directive
Date of enforcement 19-02-1997 04-08-2003 03-09-2009
Implementation deadline 19-02-1999 01-07-2004* 03-03-2011**
New capacity Authorization
Tendering
Authorization
Tendering***
Authorization
Tendering***
Unbundling
Transmission (T) and
distribution (D) from
other activities
Accounting Legal D: Legal
T: Ownership/ISO/ITO
Third Party Access
Regulated TPA
Negotiated TPA
Single Buyer
Regulated TPA Regulated TPA
Retail market
> 40 GWh (1997)
> 20 GWh (2000)
> 9 GWh (2003)
Non-household (2004)
All (2007) All
Regulation N/A Regulatory
authority
Regulatory
authority
*The unbundling of distribution operators may be postponed till 01-07-2007.
**The unbundling of transmission should take effect before 03-03-2012.
***Only when authorization is not sufficient to ensure security of supply.

25
2.3. Regime: adaptive capacity
The adaptive capacity of the regime depends on the relationships between the niche-
innovations and the many elements of the incumbent regime. This subchapter first ex-
plains the implications of the ESI being a network industry. Second, the specific political,
economic, technical, and environmental features of the ESI are discussed. Third, the pos-
sible effects of different liberalisation measures are treated. Lastly, several non-
liberalisation factors with possible effects on the adaptive capacity are reviewed.
2.3.1. Network effects
The electricity supply industry is a network industry with particular economic characteris-
tics called network externalities or network effects. This subchapter explains what network
effects are and how they affect the economics of the industry. The following sections first
discuss the components of the industry. Next, the occurrence of network externalities is
explained. Finally, the existence of monopolies and the possibilities of vertical integration
of the different stages of the industry are discussed.
Network structure
Network industries provide a service through a structure of complementary components
connected via links and nodes. Examples are telecom, railroad and electricity. In electricity
networks, the transmission and distribution cables are the links. Nodes serve as connec-
tions between links and may transform, redirect or separate the electricity flow. The com-
ponents are generators of electricity and consumers of electricity. In some cases compo-
nents both generate and consume electricity.
Economides (1996) identifies one-way and two-way network. In one-way networks like
broadcasting there is only one direction between components. In two-way networks like
railroad and telecom the direction matters: one can ride in both directions or call and be
called. The electricity network cannot be classified as either a one-way or a two-way net-
work. It is a one-way network since many customers are provided with electricity by a
central power plant. At the same time, hydropower plants, larger businesses and industry
as well as households (e.g. with rooftop solar) may be both suppliers and consumers.
Figure 8 displays the main components (continuous outline), nodes (dotted outline) and
links (arrows) in the ESI. Generators (G) are dedicated to producing electricity and feed it
to the transmission nodes and links (T). Some generators like hydropower plants also con-
sume for electricity storage (G7). The transmission operator guides the electricity to the
distribution nodes and links (D). The distribution network is connected to the consumers
(C), small producers (P) and components that both produce and consume (CP). There are
mostly one-way links and some two-way links in the network.
G1 G2 G3 G5 G6 G7
↓ ↓ ↓ ↓ ↓ ↕
T1
↓ ↓
D1 D2
↓ ↑ ↕ ↓ ↑ ↕
C1 P1 CP1 C2 P2 CP2
Figure 8 – Network structure of the electricity supply industry.

26
Network externalities
Networks feature positive externalities or network effects regarding production and con-
sumption. Network effects are said to occur when the utility of a product increases with
the number of users. Katz and Shapiro (1985) mention direct and indirect network effects.
Direct positive externalities entail the increase of the possible number of interactions be-
tween network customers that can be made with each added customer (e.g. more mobile
phone users increases the utility of a mobile phone). Indirect positive externalities arise
when the addition of a new customer increases the variety in the offered service (e.g. a
larger electricity grid implies more electric products). Typical one-way networks only fea-
ture indirect network effects (Economides, 1996).
Supply and demand curves for regular products and network products
9a. Regular product 9b. Network product
Figure 9 – Supply and demand curves for regular products and for network products.
Figure 9 displays the effect of network externalities on the supply and demand curves of
network products. Graph 9a shows the supply and demand curve for normal products
under perfect competition. For a higher unit price P, more suppliers are willing to pro-
duce. For a lower unit price P, more consumers are willing to buy the product. The curves
meet at the equilibrium price Peq for the equilibrium quantity Qeq. The upper marked area
illustrates gains for consumers if the price is lower than the price they are willing to pay.
Similarly, the lower marked area shows gains for suppliers in case the price is higher than
the price at which they are willing to produce.
Graph b shows that in network industries, supply and demand curves are radically differ-
ent. The quantity expresses the network size (expected number of connections) and the
price is expressed as willingness to pay.2 The demand curve start at zero since a network
with zero connections has no value. For more than zero connections, the product value
rapidly increases. At some point, the curve declines since some customers find the service
less valuable. Clearly, the lower equilibrium needs to be reached in order to make the
network industry profitable. For a monopolist without price discrimination, maximum
profits are found in between Qeq1 and Qeq2. As such, a monopolist would not provide the
highest social benefit. Competition can push prices down (and expectations up) to Peq at
Qeq2.
2 For regular products, a lower price leads to a higher demand. For network products, a higher demand leads to
a higher willingness to pay. As such, the causality between price and demand is reversed. In other words, the
price increases with the expected number of units sold.

27
Monopolies and vertical integration
The transmission and distribution networks are natural monopolies because competition
would entail a duplication of the infrastructure (Steiner, 2000). Without price discrimina-
tion, a monopolist utility would find the highest profits between Qeq,1 and the Qeq,2 in fig-
ure 9.3 As such, a monopolist would most likely not serve all customers that are in fact
willing to pay for the service. A competitive market could drive the number of connec-
tions closer to Qeq,2. In the presence of network externalities, an oligopolistic market (with
few suppliers) thus leads to a larger network and lower prices than a monopoly (Econo-
mides and Himmelberg, 1995).4
Vertical integration is the bundling of several network activities (generation, transmission,
distribution) under single ownership. Vertical integration allows actors to increase their
economic control and offers monopolistic profits (Künneke, 1999). Vertical integration can
be a necessity when the complementary nature of network services obstructs separate
pricing of services: when metering and accounting of each stage in the network is impos-
sible, only a total price can be paid for the network service and thus only one company
can be rewarded.
Vertical integration of generation and transmission is attractive for transmission operators
since generators depend fully on transmission operators. Integration could lead to better
planning of infrastructure and generation investment and operation. However, vertical in-
tegration under the assumption of non-overlapping transmission infrastructure implies
that generation effectively becomes a monopoly and thus the benefits of competition will
be lost (Steiner, 2000).5 The same is true for the integration of production with distribu-
tion. From a societal perspective, unbundling may therefore be attractive.
2.3.2. Electricity features
The theory so far analysed the electricity supply industry in a very generic way by focus-
sing solely on network effects. The industry has however unique technical, economic, po-
litical and environmental features that are decisive for its lay-out and make it distinct from
other network industries. These features complicate the industrial organisation of the ESI
and may matter in the adoption of novel technologies. The following sections discuss
technological, economic, political and environmental features.
Technology
A major technical challenge posed by the electricity system is load balance. In most parts
of the electricity grid, there are no storage options and electricity is delivered via a net-
work that needs instantaneous balance of supply and demand (Jamasb and Pollitt, 2005).
Supply and demand can be matched by influencing generation (supply side management)
and consumption (demand side management) or, sometimes, by storing electricity. In the
case of renewable electricity production, the means of generation vary in adaptability of
power supply or dependency on weather conditions. The balancing of supply and de-
mand is therefore becoming increasingly complex.
3 Monopolist profits are calculated as the product of the difference between the supply and demand curve and
the number of connections. 4 An oligopoly here means a small number of local monopolists instead of a single national monopolist. An oli-
gopoly does not entail duplication of infrastructure. 5 A competitive effect is only possible if there is more than 1 transmission operator and customers can choose
different generation/transmission companies that are all connected to their distribution grid.

28
Supply side management consists of adapting the electric power production of genera-
tors in order to meet demand. In liberalised markets, demand is met by assigning produc-
tion slots through a merit-order or auction system to power plants. Power plants that
produce at the lowest costs get the first slots, followed by those with slightly higher pric-
es. Renewable electricity comes first in the merit order through low operational and fuel
costs (Klessmann et al., 2008).
Demand side management entails steering demand directly or indirectly in order to flat-
ten the demand curves. This may increase the efficiency of the supply-side by allowing
power plants to keep running at their optimal production level. Additionally, for systems
with a large share of nuclear energy, demand side management may guarantee consump-
tion of base load production since nuclear plants cannot be shut off due to safety and
technical reasons. Drawing on Strbac (2008), the following categories of demand side
management can be distinguished.
- Price-discrimination entails higher pricing of peak hours to incentivize consumers to
spread their consumption. Real-time info on electricity prices with use of smart me-
ters allows users to adapt to prices on a smaller time scale. Consumers may also
agree on consumption reduction in advance in exchange for financial benefits.
- Direct load control allows utilities to steer the power consumption of appliances di-
rectly through for instance radio control. Customers taking part in direct control pro-
grams are compensated via their electricity bill.
- Indirect load control consists of steering power consumption by enabling appliances
to react on frequency changes. Because of simple physics, the frequency of the cur-
rent drops when supply cannot keep up with demand. Smart appliances note this
drop and may adapt their consumption.
- Load limiting entails capping the energy use of customers. Load limiting schemes al-
low customers to plan their energy use within certain boundaries but shave the peaks
through limiting the maximum consumption.
Storage of electricity is possible in a variety of ways. Storage systems can be mechanical
(pumped hydro, compressed air, flywheel), electrochemical (batteries), chemical (hydro-
gen), electric (capacitor, magnetic field) or thermal (heat storage). Currently, global stor-
age capacity covers about 3 per cent of generation capacity. Pumped hydro storage is
applied at the largest scale and covers about 99 per cent of all electric storage capacity in
the world. Compressed air energy storage and batteries are most popular after hydro.
Several types of batteries as well as pumped hydro storage are considered most mature
technologies (IEC, 2011).
Economics
Economically, electricity is a commodity that poses unique challenges regarding pricing,
investment and positive externalities. First, like mentioned in section 2.3.1., separate verti-
cal stages require measurement and accounting of electricity flows between the stages.
However, the lack of possibilities to store electricity make it difficult to trade and set pric-
es in a manner similar to other commodities (Jamasb and Pollitt, 2005). As such, advanced
systems are needed to allow for competition. The introduction of competition in certain
segments of the electricity production chain is only possible with modern metering and
information technology.

29
Second, electricity does not have distinct characteristics per generation technology, i.e.
the possibilities for transforming and marketing the product are limited (Defeuilly, 2009).
Competition is therefore strongly focused on price. This characteristic is important since
the political and environmental issues discussed in the following sections are partly
caused and strengthened by it. Since other characteristics such as reliability, security of
supply and environmental impact are not felt when using the product, market demand for
them may be poorly articulated.
Third, the conventional generation technologies and transport systems have large scales
and last for decades (Jaag and Trinkner, 2011). Time horizon and scale of investment in
innovation are thus high and therefore risky. Investments are sunk and asset-specificity is
high. In other words: incurred costs are irreversible and are not taken into account in fur-
ther decision making. Rational asset owners exploit their assets as long as there is return
on operational costs. This makes asset owners vulnerable to abusive price-setting (i.e.
price setting that only allow return on operational costs, not on total investment).
Politics
Electricity is regarded a ―basic good‖ to which all people should have access. The high
consumer utility of electricity and the lack of alternatives result in a very low price elastici-
ty. Monopolists may easily exploit their market power and raise prices to undesirable lev-
els. Additionally, utilities may be inclined to deny access to customers if the marginal
costs outrun marginal profits. Public intervention is felt legitimate when it warrants secure,
safe and affordable supply of electricity to all and refrains utilities from abusing a monop-
oly position (Arentsen and Künneke, 1996).
Politics may however be incentivized ―too strongly‖ to intervene. Widespread domestic
consumption makes consumers roughly the same group as voters and infrastructure per-
formance thus highly political. The political importance of energy supply incentivizes gov-
ernment to behave opportunistically towards the producing company, i.e. to keep the
prices at marginal cost. Producers will react with underinvestment in technologies with
low market return, high payback periods, and high asset specificity. Moreover, mainte-
nance will be kept to a minimum. As such, politics may jeopardize the long term perfor-
mance of the industry (Spiller, 2011).
Environment
The size of the ESI makes its environmental performance of no small importance. Conven-
tional modes of electricity supply feature neglected costs including negative impacts from
discovery, extraction, production, distribution and consumption of resources and electrici-
ty. The ESI typically fails to internalize environmental impacts of its services. Social costs
like pollution and global warming are not included in the costs, resulting in higher than
optimal consumption levels (Brown, 2001).
In Europe, electricity generation is one of the major sources of carbon dioxide. The emis-
sion trading system (ETS) was launched in 2005 and aims to reduce carbon dioxide emis-
sion by ―cap and trade‖. The system allows energy-intensive industrial plants and electric
utilities to trade rights or permits to emit carbon dioxide. The trading scheme internalises
the environmental implications of carbon dioxide to some degree. The EU ETS is the larg-
est emission trading scheme in the world (Convery, 2007).
30
2.3.3. Liberalisation measures
This subchapter discusses the different liberalisation measures and their possible effects
on the adaptive capacity of the regime with regard to the earlier explained network ef-
fects and specific economic, political, environmental and technical features of the indus-
try. The measures are unbundling of the vertical stages, introduction of wholesale mar-
kets, introduction of retail markets, establishing an independent regulator, introduction of
third party access and privatisation of incumbent utilities. After a brief overview, the sepa-
rate measures are discussed.
a. Overview
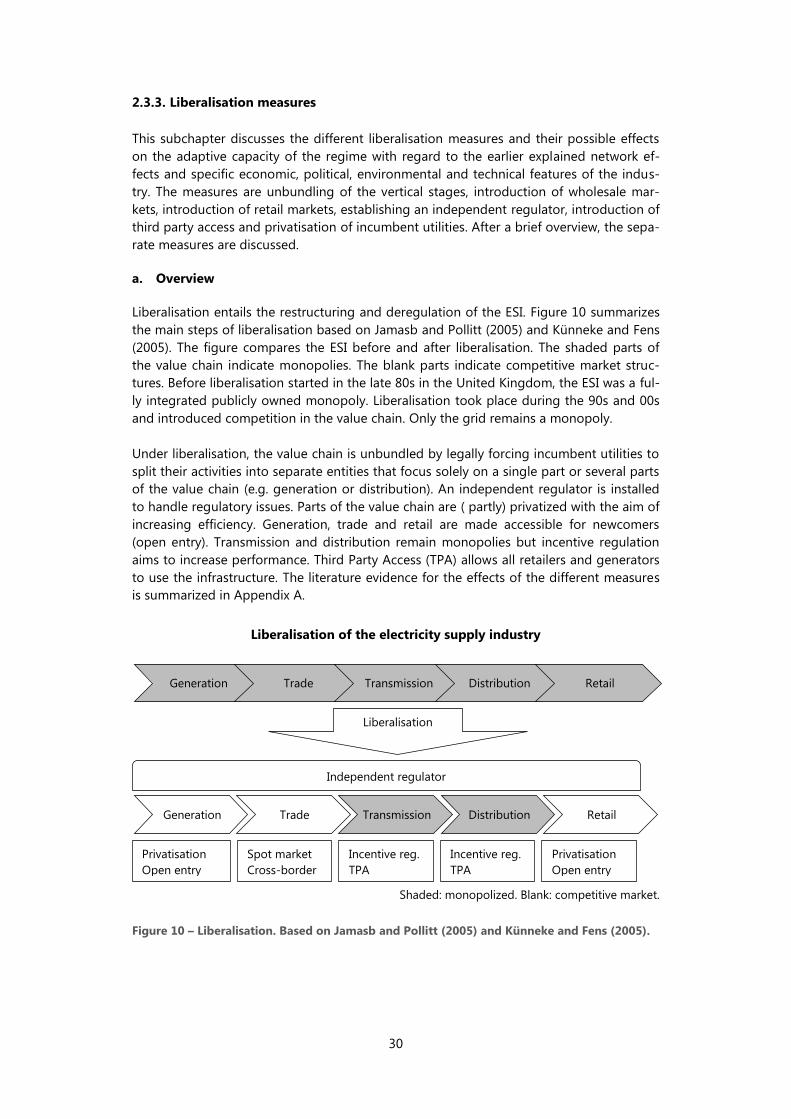
Liberalisation entails the restructuring and deregulation of the ESI. Figure 10 summarizes
the main steps of liberalisation based on Jamasb and Pollitt (2005) and Künneke and Fens
(2005). The figure compares the ESI before and after liberalisation. The shaded parts of
the value chain indicate monopolies. The blank parts indicate competitive market struc-
tures. Before liberalisation started in the late 80s in the United Kingdom, the ESI was a ful-
ly integrated publicly owned monopoly. Liberalisation took place during the 90s and 00s
and introduced competition in the value chain. Only the grid remains a monopoly.
Under liberalisation, the value chain is unbundled by legally forcing incumbent utilities to
split their activities into separate entities that focus solely on a single part or several parts
of the value chain (e.g. generation or distribution). An independent regulator is installed
to handle regulatory issues. Parts of the value chain are ( partly) privatized with the aim of
increasing efficiency. Generation, trade and retail are made accessible for newcomers
(open entry). Transmission and distribution remain monopolies but incentive regulation
aims to increase performance. Third Party Access (TPA) allows all retailers and generators
to use the infrastructure. The literature evidence for the effects of the different measures
is summarized in Appendix A.
Liberalisation of the electricity supply industry
Shaded: monopolized. Blank: competitive market.
Figure 10 – Liberalisation. Based on Jamasb and Pollitt (2005) and Künneke and Fens (2005).
Generation Trade Transmission Distribution Retail
Generation Trade Transmission Distribution Retail
Liberalisation
Independent regulator
Privatisation
Open entry
Incentive reg.
TPA
Incentive reg.
TPA
Spot market
Cross-border
Privatisation
Open entry

31
b. Unbundling
Unbundling is the separation of potentially competitive activities (Künneke, 2007) and
aims to improve performance through competition. Separating formerly vertically inte-
grated companies may increase competition by preventing anti-competitive behaviour of
incumbents and easing access to newcomers (Jamasb and Pollitt, 2005). Unbundling en-
tails separation of Distribution System Operators (DSO) and Transmission System Opera-
tors (TSO) from other activities in formerly vertically integrated undertakings (VI) (EC,
2003). Relevant other activities within VI are generation and retail (also called supply).
The European Union distinguishes ownership unbundling, legal unbundling, functional
unbundling and accounting unbundling (EU, 2005). Using slightly different terms,
Künneke (2007) states that ownership unbundling presents the greatest magnitude of
economic and legal unbundling, followed by legal, management (functional) unbundling
and administrative (accounting) unbundling. The 1996 directive mandated at least ac-
counting separation, the 2003 directive set legal unbundling as the minimum norm (EC,
1996; EC, 2003). However, legal unbundling of TSOs has not led to effective unbundling
(EC, 2009). Therefore, the 2009 directive requires more stringent forms of unbundling.
The 2009 directive gives three options (EC, 2010). Ownership unbundling requires full
ownership unbundling of transmission from other activities in the ESI. It may be chosen if
the network company is vertically integrated or already (legally) unbundled. The inde-
pendent transmission operator (ITO) may only be chosen when the network company is
vertically integrated. It requires independence of the transmission operator, but not own-
ership unbundling. Independence can be seen as a form of unbundling in between legal
and ownership unbundling. An alternative to the ITO is the independent system operator
(ISO). In this case, the transmission assets remain with the vertical integrated company but
other tasks concerning transmission are outsourced to an independent operator.
Empirical evidence is far from conclusive on the benefits of unbundling. Steiner (2000)
finds the effect of unbundling of transmission and generation on price negative but insig-
nificant in a study on 19 OECD countries. Using an extended dataset and a fixed effects
analysis, Hattori and Tsutsui (2004) find price to be positively and significantly related.
Schmitt and Rammerstorfer (2010) finds no significant relationships. Copenhagen Eco-
nomics (2005), studying the EU-15 member states, conclude price to be negatively signifi-
cantly related to TSO unbundling.
The effect on the utilization rate was found positive and significant by Copenhagen Eco-
nomics (2005). The reserve margin deviation is found negatively significantly related by
Steiner (2000). Investment is positively significantly related to unbundling of TSO, but
negatively significantly related to unbundling of the whole chain (Schmitt and Rammer-
storfer, 2010). The latter contradiction is problematic since it does not allow for general
explanations of the merits of unbundling, especially since the independent variables part-
ly overlap (unbundled TSOs lead to at least partly unbundled chains).
Vertically integrated companies are incentivized to obstruct entry of renewable electricity
generation as this may take a share of their conventional production (Alderfer, 2000).
Separation of generation and transmission (or distribution) is thus crucial for avoiding an-
ti-competitive behaviour by incumbents and ensuring access to new entrants (Jamasb and
Pollitt, 2005). The liberalisation in the UK provides evidence of the importance of cross
subsidizing when separation led companies to leave the retail market altogether (Jamasb
and Pollitt, 2005). In summary, unbundling may advantage renewables.

32
c. Wholesale markets
Wholesale markets are expected to increase competition between generators through
competitive allocation of production time slots. Wholesale markets can be seen as a result
of unbundling of transport and production (Boisseleau, 2004). Because of this, electricity
became a commodity that could be traded through either a bilateral market or an orga-
nized market. There are three theoretical models for generation dispatch: vertically inte-
grated monopoly, bilateral markets and power pools. In the vertically integrated monopo-
ly, generation dispatch is decided by the monopolist based on cost and technical con-
straints and there is no competition.
The bilateral model or ―Over The Counter‖ (OTC) model entails tailor-made contracts be-
tween buyers and sellers. It is not considered a full wholesale market in this study due to
numerous market failures (it is operationalized as absence of a wholesale market). Bois-
seleau (2004) highlights four market failures in bilateral markets. First, price transparency
is low due to a lack of a common market place with published prices. Second, this lack of
transparency allows for price discrimination since buyers and sellers have an interest not
to tell anyone their contract terms. Third, market liquidity is low since tailor-made con-
tracts are hard to substitute (partly) with contracts with new partners. Fourth, transaction
costs are high since buyers and sellers have to seek each other. These seeking costs may
be prohibitively high for the short-term contracts that are essential to competition.
The power pool model allows generators and consumers to exchange electricity through
a single-price clearing auction for certain time slots. This type of market gathers the bids
of buyers and sellers and uses them to construct a supply and demand curve. The price at
which supply and demand meet is called the single clearing price and is paid by the buy-
ers to the sellers. If the results of the auction do not fit with the transmission capacities,
generators at different locations may be forced to increase or decrease their production.
The costs of this are shared by all producers. The resulting price system is however highly
complex and susceptible to manipulation (Boisseleau, 2004).
Power pools may use a locational pricing model to compensate for varying transmission
and congestion costs. As such, the price for electricity and transmission are bundled in-
stead of separated. The transmission system operator collects all bids and calculates the
price taking into account the technical capabilities of the network. The approach is espe-
cially useful for weak networks and may incentive generators to invest in new plants at
more suitable spots concerning transmission capacity. A disadvantage of the system is the
complex and not fully transparent price-setting, although traders are served by having to
deal with only one product instead of two (Boisseleau, 2004).
Empirical evidence on the functioning of wholesale markets regards price, utilization rate
and investments. There are two significant relationships: wholesale markets are found to
affect prices negatively significantly according to Steiner (2000) but positively significantly
according to Hattori and Tsutsui (2004). Hattori and Tsutsui (2004) explain their outcomes
with reference to possible exercise of market power as noticed by authors such as Green
and Newbery (1992), Brennan and Melanie (1998), Ocaña and Romero (1998) and Boren-
stein and Bushnell (1999). Schmitt and Rammerstorfer (2010) and Copenhagen Economics
(2005) do however not find significant relationships for price.

33
The competitive wholesale market poses challenges for renewable electricity generation.
Wholesale electricity markets are largely based on a day-ahead markets but weather pre-
dictions are not accurate enough to approximate production as well as for conventional
sources. By the time predictions are sufficiently accurate, the electricity generation rights
have already been allocated and market liquidity is low. Conventional generators can
profit from this in two ways. First, in case of high renewable energy production, conven-
tional generators may buy back electricity under cost price. Second, in case of low renew-
able energy production, they can sell their electricity above cost (Neuhoff, 2005). Alto-
gether, wholesale markets may hamper the adoption of renewables.
d. Retail markets
Retail markets introduce competition by allowing consumers to select their supplier of
preference. Removal of price controls and other regulation should enable price setting
under free market conditions. The European Union demands market opening since 1997
for large consumers (EC, 1996). Since 2007, all consumers including households should be
able to choose their supplier freely (EC, 2003).
For consumers, free market choice is not completely free. Defeuilly (2009) summarizes
three components of the costs of switching of supplier. First, search costs entail identify-
ing alternatives and comparing their offers. Second, learning costs entail building the rela-
tionship with the new supplier which includes for instance understanding bills and service
structures. Third, transaction costs occur because of negotiating (most relevant for larger
users) and formalising the contract. These switching costs may bar consumers from
choosing new suppliers even if their offer is better than the incumbents‘.
Retail markets have several possible effects on the electricity supply industry. Through
competition, geographical niches (e.g. remote areas) and other niches (e.g. green power)
that were neglected by the incumbent may be served better. Price levels may go down
and service levels may increase. Also, the pressure on the whole supply chain to decrease
prices through higher efficiency can rise through competition (Defeuilly, 2009).
There is no evidence that the promises of lower prices through retail markets have been
fulfilled. Retail market opening has been found to significantly influence prices negatively
by Hattori and Tsutsui (2004). Copenhagen Economics (2005) finds a negative but insig-
nificant relationship between retail market opening and price. The utilization rate is not
affected at all by consumer choice (Copenhagen Economics, 2005).
In retail markets, new products that match better with individual consumer interests may
be developed (Defeuilly, 2009). More specifically, consumers may spur renewable elec-
tricity generation through green power demand. A study by Bird et al. (2002) shows that
green power marketing becomes more popular under competition. Both new entrants
and incumbents are encouraged to offer green power to obtain or retain clients. However,
the construction of new capacity lags far behind green power programs. As such, retail
markets may boost renewables, albeit slowly.

34
e. Independent regulator
Independent regulators are considered a precondition to successful liberalisation. They
have three possible activities. First, they regulate monopolies through tariff setting,
providing access rules, and licensing operators. Second, they oversee competition in
wholesale and retail markets. Third, they protect customers by handling their complaints.
In some case, regulators commit to wider policy obligations such as promotion of renew-
ables (Larsen et al., 2006).
Three features of independent regulators stand out. First, they are at arm‘s length of the
government through for instance earmarked funding and exception from civil service sal-
ary rules. Second, they are at arm‘s length of stakeholders in the ESI through arrange-
ments that avoid personal interests of regulators in the ESI . Third, they have independent
decision-making competencies concerning rule making, rule application and litigation
(Larsen et al., 2006).
Independent regulators have two important possible effects on electricity markets. First,
they may avoid market failures like excess competition (leading to loss of capacity) and
opportunism by monopolists. Second, they could limit political opportunism vis-à-vis in-
vestors in the ESI by creating a stable regulatory framework (Zhang et al., 2008) (Larsen et
al., 2006). There is little empirical evidence on the effect of independent regulators.
With regard to renewables, independent regulators may be advantageous mostly because
of a possible reduction of investment risk. Since wind energy poses high investment risks
as compared to other sources of energy, introduction of an independent regulator may
disproportionally stimulate investment in wind energy. Also, supportive policies for re-
newables may be embedded in a stronger regulatory framework due to an independent
regulator.
f. Third Party Access
Third Party Access forces network operators to provide access to generators and retailers.
It is complementary to the opening of trade and retail markets. There are three forms of
TPA. Negotiated Third party Access (nTPA) allows suppliers and consumers to freely ne-
gotiate a contract. Single Buyer Third Party Access (SB) gives states the right to designate
single buyers within the area covered by the network to handle trade. Regulated Third
Party Access (rTPA) grants access to networks on the basis of fixed pre-published tariffs
(Bier, 1999).
There is debate on the virtues of each system, without any outcomes. Jamasb (2006)
notes that regulated TPA is more likely to guarantee easy access as negotiated TPA has
caused disputes and uncertainty in ―some‖ countries. Bier (1999) considers neither of the
systems ―clearly superior‖. Empirical evidence on the merits of TPA is contradictory. Hatto-
ri (2004) finds a negative significant relationship between a dummy variable for both TPA
and retail access and price and price ratio. However, Copenhagen Economics (2005) finds
TPA for transmission to be significantly positively related to price. Steiner (2000) and
Schmitt and Rammerstorfer (2010) find TPA of no significant influence on price.

35
Regarding wind energy, TPA seems crucial in allowing new, innovative actors to enter the
regime. Local energy initiatives that proved successful in Denmark (Meyer, 2007) may
more easily enter the regime under TPA. Wind energy producers may more easily gain ac-
cess to the grid under fair and transparent entrance rules. Since innovative technologies
need high investment in research and development, strong regulation may be needed to
protect the financially vulnerable actors in this field (Ramesohl et al., 2002). Furthermore,
local initiatives, that can only function with TPA, have been suggested to have success
rates superior to those of projects typically undertaken by large incumbent utilities (Mey-
er, 2007; McLaren Loring, 2007).
g. Privatisation
Privatisation entails the partial or complete sale of public enterprises to private actors. Pri-
vatisation is expected to lead to cost saving and efficiency improvement in the affected
firms, provides proceeds for the government, and reduce future liabilities (Jamasb and
Pollitt, 2005). Zhang (2008) summarizes four effects of privatisation of the ESI: different
managerial incentives through a change in property rights, access to private capital mar-
ket instead of tax revenues for investment, more precise and measurable objectives, and
removal of political and interest group influence.
Empirical evidence for the effects of privatisation in the ESI is contradictory. Steiner (2000)
and Schmitt and Rammerstorfer (2010) find a positive significant relationship with (indus-
try) price but Hattori and Tsutsui (2004) find price to be negatively significantly related
(Schmitt reverses the indicator so the sign changes). However, Copenhagen Economics
(2005) does not find significant relationships. Zhang et al. (2008) conclude privatisation to
be positively significantly related with capacity per capita and labour productivity.
The effect of privatisation on wind energy adoption is hard to predict. Privatisation may
direct R&D activities towards themes that more directly benefit the private shareholders
(Munari, 2002). Moreover, adopting wind energy implies the development of a new busi-
ness model. Private companies can be expected to focus on (short-term) profitability.
Since wind energy may not be as profitable as other sources of energy and needs more
risky investments, it is unlikely that privatisation will spur wind energy adoption.
2.3.4. Non-liberalisation factors
The adaptive capacity of the electricity supply regime can be expressed more elaborately
using the elements of regime proposed by Geels (2002). The following sections discuss
each element. The main constructs of interest in this study – liberalisation and wind ener-
gy – cover already partly the regime dimensions of technology and markets. Since there is
still much more to technology and markets, they are discussed in the same way as the
other dimensions.
a. Technology
For adoption to be successful, wind energy needs to be an attractive alternative to in-
cumbent technologies regarding its performance. As will be shown in section 2.4.2., the
competitive advantage of wind energy depends on the characteristics of incumbent tech-
nologies regarding siting, risk, cost and pollution. Thus, the relative performance of niche
technologies with regard to regime technologies is of great influence on the adoption of
novelties. In other words, the technology dimension describes the difference in perfor-
mance between regime and niche technology.

36
Assuming that regime performance is comparatively stable, the technology dimension
can be operationalized solely at the niche level. This makes sense, since especially the cost
element of wind has changed dramatically: total costs per unit of electricity from wind in
Denmark nearly halved from 1990 to 2006 (Krohn, 2009). Furthermore, siting issues have
become of much smaller importance since the capacity per installed turbine in Europe has
risen from approximately 0.1 MW in 1990 to 1.7 MW in 2007 (Krohn, 2009). Such radical
performance changes cannot be noted for conventional technologies. The technology
dimension is further discussed as a niche trait in section 2.4.2.
b. Infrastructure
Grid-connected distributed generation faces two challenges: installation of new lines and
management of intermittent production. Regarding new lines, the relatively small scale of
renewable electricity generation demands small and numerous grid connections. Renew-
able electricity projects may be inhibited by lumpy investments for connections. This can
be solved by either coordination or socialization of costs. In the first case, project devel-
opers concentrate their investments on certain areas to share the costs. In the second
case, the project developers only pay the connection charge of the cable from the last
distribution point. The additional costs are shared among the other network users
(Neuhoff, 2005).
The grids ability to management intermittent production depends on the total electricity
generation fuel mix, the transport capacities, the storage capacities, and the cross-border
capacities. Large shares of adaptive sources like hydropower and gas allow for large
shares of wind energy whereas large shares of base load power like nuclear energy com-
plicate capacity management. As such, the fuel mix, as a characteristic of the infrastruc-
ture to which new wind capacity is connected, can be of great importance for its adaptive
capacity.
c. Markets
Geels (2002) calls markets the ―application domain‖ of technologies. Of all dimensions of
the regime, markets may be influenced most by liberalisation. In other words, a liberalised
regime is distinct from a non-liberalised regime mostly because of its market structure.
Apart from all the measures of liberalisation such as retail market opening or unbundling,
there are some more characteristics of markets that may matter in the adaptive capacity
of the regime.
Electricity markets feature many distortions and market failures that may influence the
transition. Prices may not reflect cost and benefits through unpriced pollution and indi-
rect or direct subsidies. Furthermore, a lack of capital and improper discounting deters in-
vestors in renewable energy (Sovacool, 2008; Neuhoff, 2005). Also, Carley (2009) shows
that the adoption of renewables is correlated with average electricity retail price and the
electricity use per capita.
d. Networks
Actors and networks with their mutual interdependencies grant the regime stability in the
form of ―organizational capital‖ (Geels, 2002). At the same time, networks allow for the
exchange of tacit and explicit knowledge and may induce problem identification and vi-
sions of the future and thereby the development of novel solutions. Networks provide ac-
tors with a resource base in terms of knowledge, information and ideas for the future (Ja-
cobsson and Johson, 2000; Jacobsson and Bergek, 2004).
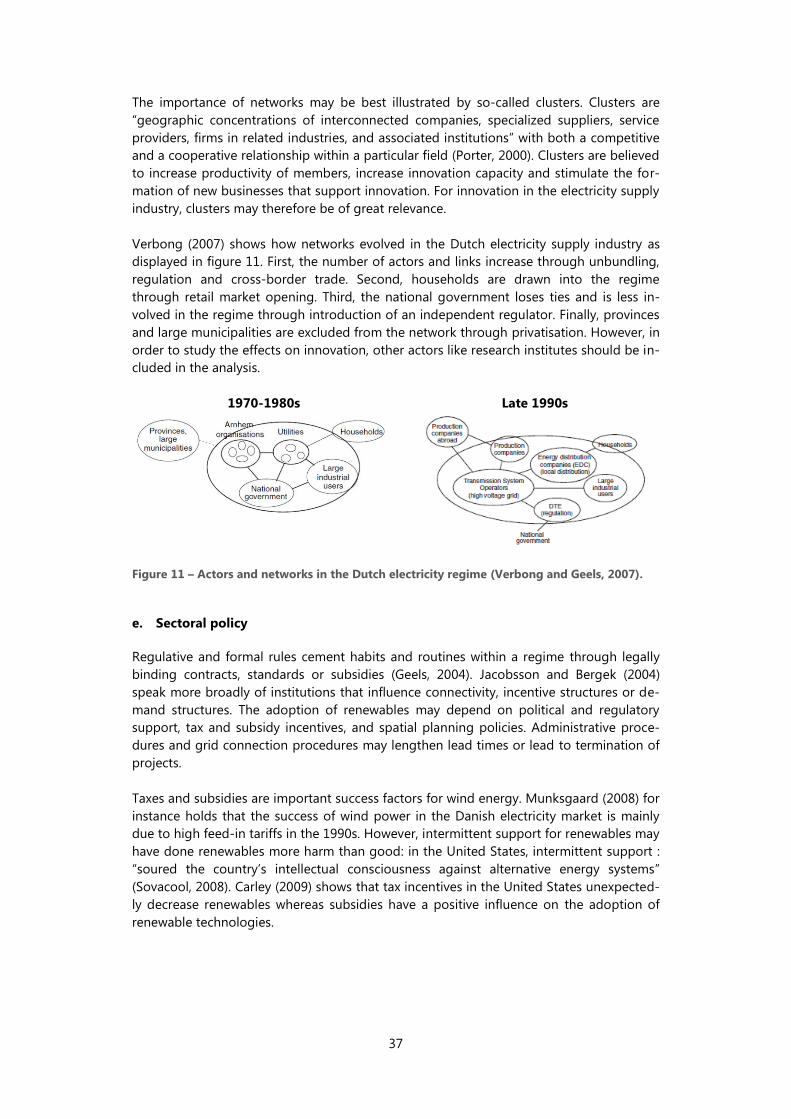
37
The importance of networks may be best illustrated by so-called clusters. Clusters are
―geographic concentrations of interconnected companies, specialized suppliers, service
providers, firms in related industries, and associated institutions‖ with both a competitive
and a cooperative relationship within a particular field (Porter, 2000). Clusters are believed
to increase productivity of members, increase innovation capacity and stimulate the for-
mation of new businesses that support innovation. For innovation in the electricity supply
industry, clusters may therefore be of great relevance.
Verbong (2007) shows how networks evolved in the Dutch electricity supply industry as
displayed in figure 11. First, the number of actors and links increase through unbundling,
regulation and cross-border trade. Second, households are drawn into the regime
through retail market opening. Third, the national government loses ties and is less in-
volved in the regime through introduction of an independent regulator. Finally, provinces
and large municipalities are excluded from the network through privatisation. However, in
order to study the effects on innovation, other actors like research institutes should be in-
cluded in the analysis.
1970-1980s Late 1990s
Figure 11 – Actors and networks in the Dutch electricity regime (Verbong and Geels, 2007).
e. Sectoral policy
Regulative and formal rules cement habits and routines within a regime through legally
binding contracts, standards or subsidies (Geels, 2004). Jacobsson and Bergek (2004)
speak more broadly of institutions that influence connectivity, incentive structures or de-
mand structures. The adoption of renewables may depend on political and regulatory
support, tax and subsidy incentives, and spatial planning policies. Administrative proce-
dures and grid connection procedures may lengthen lead times or lead to termination of
projects.
Taxes and subsidies are important success factors for wind energy. Munksgaard (2008) for
instance holds that the success of wind power in the Danish electricity market is mainly
due to high feed-in tariffs in the 1990s. However, intermittent support for renewables may
have done renewables more harm than good: in the United States, intermittent support :
―soured the country‘s intellectual consciousness against alternative energy systems‖
(Sovacool, 2008). Carley (2009) shows that tax incentives in the United States unexpected-
ly decrease renewables whereas subsidies have a positive influence on the adoption of
renewable technologies.
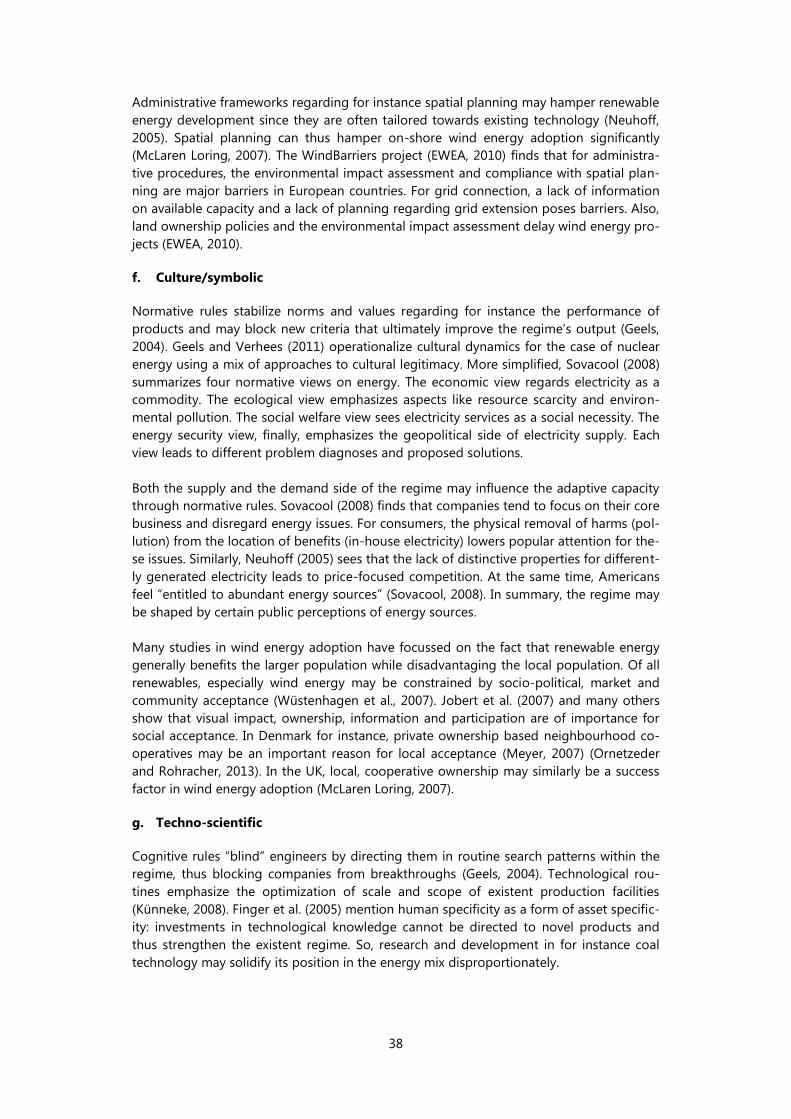
38
Administrative frameworks regarding for instance spatial planning may hamper renewable
energy development since they are often tailored towards existing technology (Neuhoff,
2005). Spatial planning can thus hamper on-shore wind energy adoption significantly
(McLaren Loring, 2007). The WindBarriers project (EWEA, 2010) finds that for administra-
tive procedures, the environmental impact assessment and compliance with spatial plan-
ning are major barriers in European countries. For grid connection, a lack of information
on available capacity and a lack of planning regarding grid extension poses barriers. Also,
land ownership policies and the environmental impact assessment delay wind energy pro-
jects (EWEA, 2010).
f. Culture/symbolic
Normative rules stabilize norms and values regarding for instance the performance of
products and may block new criteria that ultimately improve the regime‘s output (Geels,
2004). Geels and Verhees (2011) operationalize cultural dynamics for the case of nuclear
energy using a mix of approaches to cultural legitimacy. More simplified, Sovacool (2008)
summarizes four normative views on energy. The economic view regards electricity as a
commodity. The ecological view emphasizes aspects like resource scarcity and environ-
mental pollution. The social welfare view sees electricity services as a social necessity. The
energy security view, finally, emphasizes the geopolitical side of electricity supply. Each
view leads to different problem diagnoses and proposed solutions.
Both the supply and the demand side of the regime may influence the adaptive capacity
through normative rules. Sovacool (2008) finds that companies tend to focus on their core
business and disregard energy issues. For consumers, the physical removal of harms (pol-
lution) from the location of benefits (in-house electricity) lowers popular attention for the-
se issues. Similarly, Neuhoff (2005) sees that the lack of distinctive properties for different-
ly generated electricity leads to price-focused competition. At the same time, Americans
feel ―entitled to abundant energy sources‖ (Sovacool, 2008). In summary, the regime may
be shaped by certain public perceptions of energy sources.
Many studies in wind energy adoption have focussed on the fact that renewable energy
generally benefits the larger population while disadvantaging the local population. Of all
renewables, especially wind energy may be constrained by socio-political, market and
community acceptance (Wüstenhagen et al., 2007). Jobert et al. (2007) and many others
show that visual impact, ownership, information and participation are of importance for
social acceptance. In Denmark for instance, private ownership based neighbourhood co-
operatives may be an important reason for local acceptance (Meyer, 2007) (Ornetzeder
and Rohracher, 2013). In the UK, local, cooperative ownership may similarly be a success
factor in wind energy adoption (McLaren Loring, 2007).
g. Techno-scientific
Cognitive rules ―blind‖ engineers by directing them in routine search patterns within the
regime, thus blocking companies from breakthroughs (Geels, 2004). Technological rou-
tines emphasize the optimization of scale and scope of existent production facilities
(Künneke, 2008). Finger et al. (2005) mention human specificity as a form of asset specific-
ity: investments in technological knowledge cannot be directed to novel products and
thus strengthen the existent regime. So, research and development in for instance coal
technology may solidify its position in the energy mix disproportionately.

39
Public investment in techno-scientific knowledge may prevent lock-in. Public investment
is important since firms may not reap the benefits of private innovation and therefore ab-
stain from it, for two reasons. First, there is the risk of losing potential profits through
spill-over. Patents in energy technology can more easily be circumvented than in for in-
stance pharmaceutical industries (Neuhoff, 2005). Second, only large scale application of
novelties leads to significant learning and thus cost-reduction. Firms alone may not be
able to realize such learning and reap the benefits.
As such, government investment in energy innovation can be key in the adaptive capacity
of the regime. However, such investments mostly facilitate techno-scientific learning in
niches instead of regimes. Government funding for breakthrough innovation may rather
be directed to newcomers or research institutes than to incumbents. Therefore, the niche
level seems more apt for operationalizing changes in techno-scientific knowledge that
support the adoption of wind energy technology. This is discussed further when the tech-
no-scientific knowledge is quantified in section 3.2.3.
2.4. Niche: wind energy innovation
Niches act as ―incubation rooms‖ for radical innovations (Schot, 1998). For wind energy,
stand-alone units for rural electrification seem to be the main niche applications in recent
decades. To fully understand the development of wind turbines, the following sections
take a long-term perspective starting in the 12th
century. Subsequently, the maturity of
wind energy technology is discussed and expressed in terms of performance in compari-
son with conventional technology. Also, the development of wind turbine performance
over time is discussed.
2.4.1. Niche applications
The first grid connected wind turbines for regular electricity production marked the en-
trance of wind energy in the regime. On a long-term time-scale, two niche-developments
preceded this: the application of wind mills for production processes that peaked in the
18th
century and stand-alone turbines for rural electrification that were introduced at the
start of the 20th
century. Since the 1950s, wind power has made its way into the European
electricity supply industry regime.
The earliest records of windmills are of the 12th
century in England and France. By the 14th
century, the Dutch were leading in the development of windmills and used them for
draining marshes in the Rhine delta. In the centuries that followed, many more applica-
tions of windmills were introduced, mainly by the Dutch. Table 2 lists applications of
windmills and their first occurrence for the period 1500-1800. Windmills were at their
heights in the 18th
century. After that, the numbers ―rapidly declined‖ (Fleming and Prob-
ert, 1984). A large windmill in the Netherlands in 1720 had a capacity of approximately 5
kW (Smil, 2007).
The introduction of steam engines phased out wind powered production processes. Wind
energy only became popular again with the introduction of electricity. The first electricity
producing wind turbines were designed and installed around 1900 in Denmark for rural
electrification. By 1910, there were hundreds of turbines supplying villages with electricity.
Batteries guaranteed electrical power during windless days. The turbines had capacities of
5 to 25 kW and rotor diameters of up to 23 meters (Fleming and Probert, 1984).

40
Wind energy started entering the regime after World War II. The interest in wind energy
grew because of fuel shortages, rising electricity costs, energy independence concerns
and the recognition that fossil fuels are finite. Also, there was an increasing knowledge of
aerodynamics. Research into wind energy for electricity generation intensified in the
1950s and turbines were connected to grid. In spite of technical successes, the commer-
cialization of wind energy was slowed down by relatively cheap fossil fuels and the prom-
ise of abundant and cheap electricity from nuclear fission. The oil crisis in the 70‘s howev-
er motivated developed countries to invest in research and development (Fleming and
Probert, 1984). Ever since, shares of wind energy in the electricity sector have been in-
creasing.
Table 2 – Applications of windmills and their first occurrence (Davids, 2007, p. 62-63).
16th
century 17th
century 18th
century
Application 1st time Application 1
st time Application 1
st time
Oil < 1550 Gunpowder 1600-1625 Cacao 1700-1800
Mine-pumping c. 1550 Hulling 1600-1625 Pumping seawater in salt pans
1772
Paper 1586 Tanning 1600-1625
Hemp 1589 Brasilwood 1601
Washleater 1592 Fulling c. 1620
Saw 1592 Mortar c. 1628
White lead c. 1630
Trass c. 1630-1660
Mustard 1630-1675
Stone sawing c. 1658
Tobacco/snuff c. 1660
Iron grinding c. 1677
Canon boring c. 1689
2.4.2. Maturity
Geels and Schot (2007) speak of sufficiently or not sufficiently developed niche-
innovations. This notion may be operationalized quantitatively to assess the potential of
innovations. The adoption of novelties depends on the regime criteria for technology and
the performance of novelties with regard to these criteria and barriers. The following sec-
tions first derive indicators to assess the relative performance of wind turbine technology.
Subsequently, the historical development of wind turbine performance is discussed.
Comparative performance
To qualitatively assess the maturity of wind energy turbines in comparison to convention-
al technologies, four basic indicators can be constructed. They concern cost, pollution, risk
and siting. Siting may be the least obvious choice but can be regarded an important so-
cio-political characteristic of technologies. Wüstenhagen (2007) notes that small plant siz-
es lead to a larger number of siting decisions. Second, low energy densities (i.e. capacity
factor) lead to a high visual impact per generated unit of output. These features are mu-
tually reinforcing since visual impacts play a major role in siting procedures.
Table 3 gives an overview of common generation technologies. The choice of technolo-
gies is based on EC (2008). Included are Open Cycle Gas Turbine (OCGT), Combined Cycle
Gas Turbine (CCGT), Internal Combustion Diesel Engine (ICDE), Combined Cycle Oil-fired
Turbine (CCOT), Pulverized Coal Combustion (PCC), Circulating Fluidised Bed Combustion
(CFBC), Nuclear power, hydropower, wind power and solar photovoltaic.

41
Appendix B gives an abstract overview of the conversion steps and conversion products
for these technologies. The conversion chains start with hydrogen since this is the com-
mon source for energy carriers used in electricity production. It is found in the sun (where
it is turned into radiation) and in other stars that are the original source of uranium for
nuclear power plants. The final product is alternating current (AC). The aim of the figure is
to give an overview of the fundamentals of each technology and show the main differ-
ences and similarities. The part of the conversion chain covered by the actual power plant
is indicated with dotted lines.
Table 3 – Key figures for generation technologies (EC, 2008; Eurelectric, 2009; own analysis).
* Based on total capacities and outputs in EU-27.
**Hydropower is dependent on the seasons, but storage capacities in (artificial)
lakes make it incomparable to intermittent sources like wind and solar.
Based on table 3, the indicators can be constructed for each technology. The indicators
serve as proxies for the relative attractiveness of the technologies under certain economic,
environmental and socio-political conditions. In a competitive market for instance, total
cost may matter. Under great environmental awareness, pollution may matter. The indica-
tors are calculated as follows.
- Cost is represented by the total production costs per unit of electricity. Cost indicates
the attractiveness of generation technologies for public or private decision-makers.
The indicator omits subsidies and taxes that may be decisive in the actual production
costs and related profits.
- Pollution is represented by carbon dioxide equivalent emissions during the whole life-
time per produced unit of electricity. Pollution may serve as a proxy of social and po-
litical resistance to generation technologies. The indicator neglects pollution like par-
ticulate matter and toxic substances and the score is therefore relatively low for coal
and solar photovoltaic.
- Risk is the ratio between investment per unit of electricity and operational, mainte-
nance and fuel costs per unit of electricity. Risk is a proxy for the financial uncertain-
ties of generation technologies. The indicator does not compensate for fuel price sen-
sitivity. The risk for gas and oil specifically may therefore be higher.
Technology
Production
cost
[€/MWh]
Investment
cost
[€/kW]
O&M
cost
[€/kW]
Fuel
cost
[€/MWhe]
Plant
size
(MW]
Capacity
factor*
[ - ]
Intermittent
/adaptable?
[Yes or No]
Emissions
[kg CO2
eq./MWh]
Gas - OCGT 70 310 10 56,6 250 0,48
No/Yes 640
Gas - CCGT 55 635 25 37,1 650 No/Yes 420
Oil - ICDE 113 800 40 84,1 50 0,18
No/Yes 690
Oil - CCOT 100 1.000 50 71,4 175 No/Yes 585
Coal - PCC 45 1.265 60 16,5 800 0,59
No/No 820
Coal - CFBC 50 1.400 70 19,3 300 No/No 960
Nuclear 68 2.680 90 8,1 1.600 0,76 No/No 15
Hydro
large 90
1.350
1.800
2.510
40
55
75 -
20
75
250 0,27
No**/Yes
6
Hydro
small 123
2.900
4.500
85
130
2
10 No**/Yes
Wind
onshore 93 1.140 35 - 2 0,21 Yes/No 11
Wind
offshore 113 2.000 80 - 3,6 0,34 Yes/No 14
Solar PV 700 4.700 80 - 1 0,09 Yes/No 45

42
- Siting is represented by the inverse of the product of typical size and capacity factor.
It serves as a proxy of difficulties in siting new capacity due to the amount of siting
procedures and the visibility of installations. The indicator suffers from the wide range
and plant sizes for both wind (one turbine or a whole wind farm) and solar photovol-
taic (few panels to fields full of them).
Figure 12 presents the scores of all indicators. All scores are normalized for better inter-
indicator comparison and the square root is taken to compensate for outliers and to visu-
alize low scores better. It can be observed that fossil technologies generally come with
high pollution but at low cost, low to intermediate risk and few siting problems. Nuclear
fission and most renewables are non-polluting, have low costs but pose an intermediate
financial risk. Only solar photovoltaic performs very differently from the other renewables:
it has high costs, poses high risks and has highly problematic siting. In Appendix C, the
scores of wind energy are directly compared to those of other technologies.
Pollution, cost, risk and siting scores for generation technologies
(Square root of normalized scores)
Figure 12 – Performance of generation technologies (input values from table 3).
Dynamic performance
The dynamic performance of wind energy entails the increase in performance over time
through learning. Learning is mostly expressed in economic or technological terms. Learn-
ing regarding economic performance in wind energy typically focus on the price of capac-
ity or the price of produced electricity as a function of cumulative capacity, cumulative
energy or cumulative units installed or produced (Junginger et al., 2005). Learning rates in
multiple European countries have been calculated by Neij (1999) and IEA (2000).
0,0 0,1 0,2 0,3 0,4 0,5 0,6 0,7 0,8 0,9 1,0
Gas-OCGT
Gas-CCGT
Oil-ICDE
Oil-CCOT
Coal-PCC
Coal-CFBC
Nuclear
Hydro large
Hydro small
Wind onshore
Wind offshore
Solar PV
Siting Risk Cost Pollution

43
Regarding technological learning, there is a clear trend in increasing wind turbine sizes as
illustrated in figure 13. This trend is driven by economic concerns and the desire to fit
more capacity within the space dedicated to a wind farm (Hansen, 2007). Turbine size
seems of importance for both economic and siting barriers to wind energy. As larger tur-
bines tend to be more cost-effective, increased turbines size may help to overcome eco-
nomic barriers. Also, the larger the turbine, the less siting issues can be expected since
wind farms can be smaller and less numerous.
Average turbine size sold in Europe
Figure 13 – Average turbine size sold in Europe and capacity factor (Krohn, 2009).
2.5. Hypotheses
The hypotheses can be derived from the analysis of the measures of liberalisation (in sec-
tion 2.3.3), the descriptions of the elements of regime with regard to adaptive capacity (in
section 2.3.4), and the analysis of the niche (section 2.4) . Table 4 summarizes what main
effects the liberalisation measures are expected to have on different criterion for each el-
ement of the electricity supply industry regime. The fourth column briefly explains the
mechanism through which wind energy adoption is affected. Several measures are men-
tioned more than once since they have an effect on different elements of the regime. The
sign of the correlation is however similar for each occurrence of the same measure.
0
400
800
1.200
1.600
2.000
19
90
19
91
19
92
19
93
19
94
19
95
19
96
19
97
19
98
19
99
20
00
20
01
20
02
20
03
20
04
20
05
20
06
20
07
P (
kW)
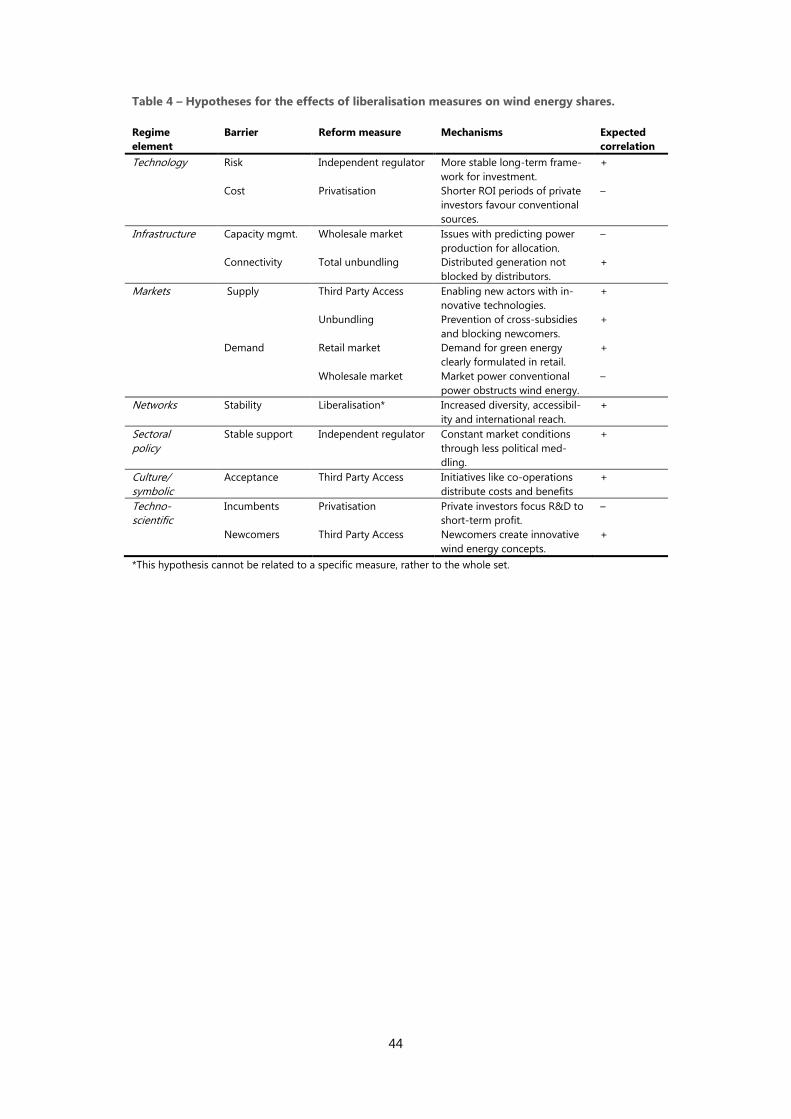
44
Table 4 – Hypotheses for the effects of liberalisation measures on wind energy shares.
Regime
element
Barrier Reform measure Mechanisms Expected
correlation
Technology
Risk
Cost
Independent regulator
Privatisation
More stable long-term frame-
work for investment.
Shorter ROI periods of private
investors favour conventional
sources.
+
–
Infrastructure Capacity mgmt.
Connectivity
Wholesale market
Total unbundling
Issues with predicting power
production for allocation.
Distributed generation not
blocked by distributors.
–
+
Markets
Supply
Demand
Third Party Access
Unbundling
Retail market
Wholesale market
Enabling new actors with in-
novative technologies.
Prevention of cross-subsidies
and blocking newcomers.
Demand for green energy
clearly formulated in retail.
Market power conventional
power obstructs wind energy.
+
+
+
–
Networks Stability Liberalisation* Increased diversity, accessibil-
ity and international reach.
+
Sectoral
policy
Stable support
Independent regulator Constant market conditions
through less political med-
dling.
+
Culture/
symbolic
Acceptance Third Party Access Initiatives like co-operations
distribute costs and benefits
+
Techno-
scientific
Incumbents
Newcomers
Privatisation
Third Party Access
Private investors focus R&D to
short-term profit.
Newcomers create innovative
wind energy concepts.
–
+
*This hypothesis cannot be related to a specific measure, rather to the whole set.

45
3. Methodology
It is impossible not to envy the man who can dismiss reason, although
we know how it must turn out at last.
Charles Sanders Peirce (1877)
The research questions can be answered by choosing a sample, operationalizing the
theoretical framework, collecting the data and choosing the means for data analy-
sis. The hypotheses are tested with a fixed effects test of liberalisation measures and
wind energy shares in 17 European Union countries and Norway and Switzerland.
This chapter first discusses the choice of the sample. Then, the operationalization of
all variables is explained and the data collection is discussed. Finally, the statistical
methods for data exploration and hypothesis testing are considered.
3.1. Sample
The unit of observation is the electricity supply industry regime. As discussed in section
2.1.3, the regime is defined by national borders. So, for the statistical analysis, the units of
observation are effectively countries. The sample consists of 17 countries within the Euro-
pean Union (as of 2010) as well as Norway and Switzerland. Of the EU member states,
Malta, Cyprus, Slovakia, Slovenia, Bulgaria, Romania, the Baltic States and Luxembourg are
left out. The sample is comprised because of data availability issues, late accession dates
and unexploited wind energy markets. With yearly observations in a time span ranging
from 1990 to 2007 and 19 countries, there are 342 observations per variable.
The markets of Malta, Cyprus, Slovakia and Slovenia are left out since they are ―unexploit-
ed‖ as compared to other national European markets who are either emerging, growing
or developed (EWEA, 2010). As such, these markets feature many zero‘s and unstable
growth with relatively high jumps in production levels. The shares of wind energy are
probably too low to serve for a meaning statistical analysis. Moreover, data for many vari-
ables is lacking. The Baltic States are removed from the sample mainly because they are
not included in the main source of data on liberalisation (Conway and Nicoletti, 2006).
The data could not be derived from other sources since for several indicators (like privati-
sation) there is no information on how the survey questions were interpreted.
Norway and Switzerland are included in the sample since they feature very European
conditions regarding climate, institutions and wealth. Moreover, cooperation is very close
between Norway, Switzerland and the European Union when it comes to energy. As such,
policies are very alike. Norway, has a leading position in introducing reforms whereas
Switzerland is relatively slow. This enriches the sample. A disadvantage of including Nor-
way and Switzerland is that they lack incentives for renewables and emission targets given
by the European Union. The sample is therefore tested both with and without Switzerland
and Norway.

46
The availability of data seems to be biased towards larger and more developed countries.
At the same time, larger and more developed countries also feature earlier accession
dates to the European Union. These biases should be taken into account when interpret-
ing the results. It basically means that outcomes are only representative of developed
states within the European Union or with similar energy sectors due to intensive coopera-
tion (Norway and Switzerland).
3.2. Operationalization
This section describes the indicators and operationalization of liberalisation and the tran-
sition towards renewable energies. There are seven indicators on liberalisation and three
regarding the transition towards renewable electricity generation. Two liberalisation indi-
cators are partially overlapping and cannot be used simultaneously in statistical tests.
First, the liberalisation indicators are treated and subsequently the wind energy adoption
variables are presented. Furthermore, the control variables are discussed. The operational-
ization is summarized in table 5.
3.2.1. Independent variable: liberalisation
Liberalisation is captured by the variables unbundling, introduction of a wholesale market,
introduction of a retail market, establishing an independent regulator, third party access
and change of ownership. The indicators have been chosen based on Jamasb and Pollitt
(2005) and with an eye on existent empirical studies (Hattori and Tsutsui, 2004; Naga-
yama, 2009; Steiner, 2000; Zhang et al., 2008; Copenhagen Economics, 2005). Like for
some aforementioned studies, data is derived from Conway and Nicoletti (2006). Much of
the operationalization is predefined by this database.
Regarding the choice of measures, there is not much flexibility since the OECD database
(Conway and Nicoletti, 2006) is by far the best and most complete source. In comparison
with studies like Steiner (2000), this research aims to be more complete by not only using
the OECD database (Conway and Nicoletti, 2006) but also information on the introduction
of independent regulators (from other sources). Furthermore, by using dummies for vari-
ables with more than two scores, the statistical analysis can reveal more information. The
following sections describe the operationalization and data sources per indicator.
a. Unbundling
Unbundling is represented by two indicators: one for unbundling of generation and
transmission and one for unbundling of the total industry. Unbundling of generation and
transmission is represented as either integrated, accounting separated or fully unbundled
(Conway and Nicoletti, 2006). Similar to Hattori and Tsutsui (2004), the accounting separa-
tion is ignored since it is much closer to full integration than to separation and therefore
distorts the indicator representativeness. Unbundling of the total chain is expressed as in-
tegrated, mixed or unbundled. It serves as a crude indicator for unbundling effects
throughout the chain. There is a dummy for each case. Data is provided by Conway and
Nicoletti (2006).

47
Table 5 – Operationalization of liberalisation, wind energy shares and control variables.
Category Indicator Operationalization
Liberalisation Unbundling transmission
Unbundling of transmission and generation
0/1 = integrated/separate companies
Unbundling total chain Degree of unbundling in total chain
0/1 = not integrated/integrated
0/1 = not mixed/mixed
0/1 = not unbundled/unbundled
Wholesale market Presence of wholesale trade market
0/1 = no market/market
Retail market Presence of retail market
0/1 = not partly opened/partly opened
0/1 = not fully opened/fully opened
Independent regulator Presence of independent regulator
0/1 = no regulator/regulator
Third Party Access Presence of TPA for transmission
0/1 = no TPA/TPA
Ownership Ownership structure of the ESI
0/1 = not public/public
0/1 = not mostly public/mostly public
0/1 = not mixed/mixed
0/1 = not mostly private/private
0/1 = not fully private/fully private
Wind energy Share in production Lagged share wind energy in electricity production
[%]
Share in capacity Lagged share wind energy in electric capacity
[%]
Controls
Landscape Wealth
Wind resources
Population density
Gross domestic product (GDP) per capita
[Current US$/capita]
Ratio of wind potential and average sector size
[-]
Amount of people per unit of area
[Capita/km2]
Regime Grid access Grid access lead time
[months]
Electricity use/capita Electricity consumption per capita
[kWh/capita]
Clusters Survey score on well-developed, deep clusters
[-]
Administrative barriers Administrative lead time
[months]
Attitudes Share population willing to pay more for renewables
[%]
Niche Turbine size Avg. turbine size sold in Europe
[kW]
RD&D Total RD&D over five preceding years
[M Euro]
- Existence wind Dummy for wind energy or not
0/1 = no wind energy/wind energy

48
b. Wholesale market
The existence of a wholesale market is represented by a dummy variable (0 or 1) similar to
Steiner (2000) and Hattori and Tsutsui (2004). Unfortunately, it is hard to find and opera-
tionalize the actual sizes of the power exchanges. Not all electricity is traded via power
exchanges and power exchanges have become increasingly international. This all may
have an influence on the degree of competition and the possibly resulting price decreas-
es. It must be assumed that deviations in the actual size of the wholesale market are ap-
proximately randomly distributed. Data is provided by Conway and Nicoletti (2006).
c. Retail market
Retail market opening is operationalized as not existent, open to some or all non-
household consumers, or fully opened. This is different from Steiner (2000) who uses the
consumer threshold and Hattori and Tsutsui (2004) who combine TPA and retail access in
one indicator. The opened market share in per cent may be the best indicator of competi-
tion (and consumer thresholds a distorted reflection of this). The sources on opened mar-
ket share are however contradictory and incomplete. Moreover, such values do not explic-
itly account for the (in this study) essential difference between households and non-
households since households as compared to businesses may have a totally different ap-
proach to choosing renewable or non-renewable electricity. So, the indicator is split into
three dummies indicating the absence of retail access, access of non-households and ac-
cess for all. Data is provided by Conway and Nicoletti (2006).
d. Independent regulator
Independent regulators are operationalized as either absent (0) or present (1). This offers
sufficient distinction to analyse the effect of the credibility and regulatory stability they
grant to the industry. The operationalization is similar to Steiner (2000). Zhang et al.
(2008) include a binary indicator for regulatory independence in their regulatory indicator
but also address the source of income of the regulator. This seems more applicable to
their data set (developing and transitional countries) than to the data set of this study
since European governments can be assumed to not abuse their power through cutting
financing. Data is provided by Grote (2008), OECD (2003) and regulator websites.
e. Third Party Access
Third Party Access is operationalized as either absent (0) or present (1). Steiner (2000) dis-
tinguishes different models of TPA. However, the hypotheses in this study do not discrim-
inate between the different forms of TPA. Even if there were clear ideas on differences in
virtues of the systems, the data still provides very limited possibilities to draw statistically
significant conclusions. This is because initially nearly all the states choose for rTPA and in
2003 the EU even made rTPA the sole option (EC, 2003). Data is provided by Conway and
Nicoletti (2006).
f. Ownership
Ownership structure is operationalized as either public, mostly public, mixed, mostly pri-
vate, or fully private. This quite elaborate distinction is drawn from the Conway and Ni-
coletti (2006) database. It would be presumptuous to think that privatisation has just an
either negative or positive effect. Possibly, there is an optimum between fully public and
fully privatized. Therefore, the variable is separated into dummies in order to find out the
optimal balance between public and private ownership.

49
3.2.2. Dependent variable: wind shares
Wind energy adoption is captured by two variables: the share of wind energy in the total
electricity production and the share of wind energy in the total installed electric capacity.
The variables cover both the aspects of constructing new capacity and using it efficiently
for electricity generation. As commonly done, the third variable total production or total
capacity is controlled for by calculating shares instead of absolute amounts. There is a
one-year lag between the wind energy variables and the liberalisation variables. Data is
from Eurostat and the US Energy Information Administration (EIA) (the latter source for
total capacities only).
The two dependent variables have complementary strength and weaknesses. The produc-
tion variable suffers from fluctuating total production levels whereas the capacity variable
neglects the effect of varying capacity factors. Total production levels may vary much be-
cause of third variables like international trade or economic growth. Capacity factors vary
per country and per year mainly due to differences in weather and climate. At the same
time, the production variable incorporates the consequences of capacity factors rather
well, while the capacity variable suffers much less from fluctuation in total capacities. To-
gether, the variables draw a fairly representative picture of wind energy adoption.
Wind energy adoption is not expected to react immediately to liberalisation. Zhang et al.
(2008), focussing on liberalisation and new capacity, do however not use lagged variables.
The same holds for Carley (2009) who studies among others deregulation and renewable
energy in the ESI. Only Copenhagen Economics (2005) uses one-year lagged variables
when comparing liberalisation and price. It may even be possible that only the an-
nouncement of certain measures already has an effect; i.e. the chosen operationalization
allows effects to precede causes. Steiner (2000) aims to capture this by introducing a vari-
able ―time to liberalization‖. However, Hattori and Tsutsui (2004) find this variable to be
representative of time only since it mostly depicts a linear trend.
For capacities however, a lag seems even more urgent than for prices. The use of capacity
may increase swiftly under changing policies but installing new capacity generally takes
years. Production may therefore change on both the short and long run. As a result, the
amount of lag is rather arbitrary and it is uncertain whether all measures really have their
most important impact with a delay of one year. Each measure for liberalisation possibly
has its own distribution of impacts over the years following its introduction. As a com-
promise, this study uses a one-year lag. In other words, the liberalisation measures in year
t are compared with wind energy shares in year t+1.
3.2.3. Control variables
The control variables are derived from the MLP and related to the three levels. On the
landscape level, the control variables are GDP/capita, population density and wind re-
source potential. For the regime, the control variables concern grid access, electricity use
per capita, cluster development, administrative lead times and willingness to pay for re-
newables. Niche processes are captured by turbine size developments and RD&D spend-
ing. Much of the theory behind the control variables has already been presented in sec-
tion 2.3.4.
50
Outside the theory of MLP, there is one more control variable: existence of wind energy.
This variable is introduced merely because of a statistical technicality. As will be shown in
the statistical analysis in section 3.4.1., there are many zeros in the data for wind energy
shares. These values may give a false idea of stagnated growth while they actually only il-
lustrate that wind energy adoptions have yet to start. Therefore, a control variable that is
1 for the existence of wind energy and 0 for the absence of wind energy is included.
Landscape
On the macro-level, three control variables are used: GPD/capita, population density and
wind resource potential. Carley (2009) shows that wealth in terms of GDP/capita and wind
resource potential are of significant influence on renewable energy success in the US.
Population density is expected to be relevant with regard to siting issues. The data for the
GDP/capita is from Eurostat. For population density, both the Eurostat and World Bank
database are incomplete, but for different years and countries. As a solution, population
density is the average of the figures of Eurostat and the World Bank. Wind resource po-
tential in terms of possible annual electricity generation by wind energy has been esti-
mated for 2030 by the European Environment Agency (2009).
For wind resource potential, detailed analysis on economically feasible potential is carried
out for onshore wind energy only. Therefore, the control variable is limited to the ―unre-
stricted technical potential‖ of both onshore and offshore wind energy. In other words,
the control variable captures the theoretical maximum amount of electricity that can be
generated per country using wind energy. The estimates use approximated turbine per-
formances in 2030 but the resulting figures are valid for any year since it is the compara-
tive sizes of country potentials that matter. Since offshore data is only presented as a
graph, the used figures are rounded estimations. For onshore data more precise values
are used. The total unrestricted technical potential is divided by the sector size of the
country. Sector size is calculated as the average amount of electricity produced over the
time span 1990-2007. It is average to avoid confusion with sector growth as an explanato-
ry factor in wind energy shares.
Regime
At the regime level, the control variables are grid access lead times, electricity use per
capita, cluster development, administrative lead times and willingness to pay for renewa-
bles. The control variables are related to the seven dimensions of the regime (Geels,
2002). The control variables for the dimensions of technology (turbine size) and techno-
scientific knowledge (RD&D spending) seem more appropriate for the niche level and can
thus be found there.
Grid access
Regarding infrastructure, capacity management and connectivity have been mentioned as
important factors. Capacity management is not an issue in most sample countries since
they feature relatively low shares of wind energy. Connectivity can be expressed as lead
times for grid access. The WindBarriers project (EWEA, 2010) published lead times for grid
access in most European countries. For some countries, the data is compromised since it
is based on an average of a cluster of similar nations. Moreover, the data is from wind en-
ergy projects in 2007 and 2008 only. It can however be expected that lead times have not
changed radically over time since they are related to slowly changing regulations and
procedures.

51
Electricity use per capita
For markets, it has been mentioned that electricity price and electricity use per capita are
of importance. The electricity price is doubtful as a variable since the relationship is two-
way: high electricity price may make wind energy competitive, but wind energy may also
lead to higher electricity prices. Even with a one-year lag, the variable may only capture
the country-specific effect (e.g. high shares lead to both high prices in the same year and
high shares in years to come). The causality of high electricity use does make sense: it can
be expected that high electricity consumption is relatively hard to cover with renewables
since it takes relatively more space, effort and financial resources as compared to country
or population size. This variable can therefore be a good predictor of the share of wind
energy. Data is from the World Bank.
Cluster development
The World Economic Forum publishes an annual account of global competitiveness in-
cluding the results of a survey on cluster development and deepness among business
leaders from many countries (Schwab and Porter, 2005). There are two issues with the
available data that are threats to the validity of causal inferences. First, the data is too re-
cent and thus the variable scores do not precede wind energy innovation. The oldest data
is from 2005 which means the data is representative of the last years of the time series
only. Second, the data is only available for whole nations without discriminating for sec-
tors. No sector is treated explicitly.
However, it is reasonable to assume that relative cluster spread and deepness has not
changed much between countries. Furthermore, since the data is for the whole country,
the time-precedence issue seems to matter less: it is far more likely that deep and wide-
spread clusters in a whole country lead to wind energy innovation than that wind energy
innovation only can boost clusters in the whole country. Further, it is assumed that coun-
tries with good networks in general also feature good networks in the wind energy sector
since any technology-specific factor stretches many fields of expertise and sectors (e.g.
mechatronics, aerodynamics, mechanics, meteorology).
Sectoral policy
Given the breadth and complexity of sectoral policy, it may be best captured by looking at
its direct consequences rather than the policies itself. The delay of wind energy projects in
terms of administrative lead times is a clear direct consequence of the barriers posed by
sectoral policy. It can be assumed that sectoral policy that leads to large delays, also pre-
vents wind power project from succeeding at all. High administrative barriers and associ-
ated long administrative lead times deter wind energy developers or make projects fail in
an early phase.
The WindBarriers project (EWEA, 2010) studied administrative lead times of wind energy
projects in Europe and provides average administrative lead times per country. The data
has limited value since some countries were bundled in the research on the basis of their
number of wind parks. Also, wind offshore data is not split per country. It can however be
expected that countries with high administrative barriers for onshore wind energy also
feature high barriers for offshore wind energy since the involved actors are partly the
same.

52
Willingness to pay
It has been stated before that social acceptance is key in wind energy projects. Attitudes
to wind energy are hard to capture, especially as times series for all countries in the sam-
ple. The European Union regularly captures public opinion in the Eurobarometer surveys.
The most suitable survey was performed in 2005 and surveys among others the willing-
ness to pay more for energy produced from renewable resources (EC, 2006). Time-series
data is unfortunately not available.
The data is of limited use for two reasons. First, Norway and Switzerland are not included
in the sample. Second, the public opinions may have been influenced by earlier renewable
energy developments and current energy prices. Germans for instance, may not be willing
to pay much more since they already have high shares of renewable electricity. Further-
more, countries with high energy prices may be less willing to pay even more for renewa-
bles. The survey may still be fairly representative however given the large differences in
respondent answers between countries.
Niche
The control variables at the niche level are turbine size and RD&D spending. These con-
trols partly refer to two dimensions of the regime: technology and techno-scientific
knowledge. However, as already argued in section 2.3.4, they seem most appropriate at
the niche-level, since turbine size actually describes the maturity of the niche innovation,
while techno-scientific knowledge on wind energy captures the effort within the niche to
increase the maturity of the technology.
Turbine size
For technology, the competitive advantage regarding cost, risk, pollution and siting has
been mentioned. This advantage is the result of the performance of conventional tech-
nologies and wind energy. The competitive advantages of wind energy may be captured
by looking at shares of other fuels in the energy mix. This is however problematic since
shares add up to 1 and may correlate for that reason only. Also, certain forms of energy
have contradictory effects: coal for instance may boost wind energy since it is polluting
but also hamper its development since it makes wind energy relatively expensive.
As an alternative, the control variable for technology may focus on technological devel-
opment or increase of competitiveness of wind energy. Over time, technological devel-
opment has made wind energy ever more competitive. It can be assumed that conven-
tional technologies have not undergone similar performance increases since they have
been existent for a long time. As such, the competitiveness of wind energy could be cap-
tured by creating a variables on technological development in wind turbines.
Turbine size accounts for increasing economic performance through scale advantages of
larger turbines. Additionally, turbine size may explain non-linear growth of wind energy
production.6 The control variable gives the average turbine size sold in the year the relat-
ed electricity from wind was produced. Data for typical wind turbine size is based on the
average turbine size installed in Europe per year (Krohn, 2009). Due to a lack of data, the
value for 2008 is calculated by averaging the turbine sizes installed in Denmark and Ger-
many (DEI, 2012; Molly, 2012).
6 Wind energy output often grows non-linearly. This may be due to increased technological performance only.
When the installed number of turbines is equal every year, output may grow non-linearly because of increased
turbine size.

53
RD&D
A straightforward indicator of techno-scientific knowledge is the country budget for re-
search, development and deployment (RD&D) in wind energy. The International Energy
Agency (IEA) has data on this. The effect of RD&D may have a time lag longer than the
default lag of 1 year, depending on whether it entails more fundamental or more applied
research. Furthermore, only the cumulative effects of several subsequent years of invest-
ment may be really felt. Therefore, this variable aggregates the RD&D budget of the last
five years. The time lag thus ranges from 6 till 1 years. For some countries, data for some
years is lacking. This is generally only the case for lower RD&D budgets of either early
years or countries with low (close to zero) investment in general. Therefore, this is not
considered a problem.
3.3. Data collection
The dataset for the indicators of liberalisation is mostly derived from the OECD regula-
tions database (Conway and Nicoletti, 2006). Additional data for the establishment of in-
dependent regulators is found in literature (Grote, 2008; OECD, 2003) and on regulator
websites. Wind energy production and capacity shares are calculated on the basis of data
from Eurostat and US the Energy Information Administration (EIA). Control variables are
based on various sources including the European Commission (EC), World Bank, Eurostat,
World Economic Forum (WEF), European Environmental Agency (EEA), European Wind
Energy Association (EWEA), International Energy Agency (IEA), Danish Energy Agency
(DEI) and the German Wind Energy Institute (DEWI) (Molly, 2012). Section 3.2.3 on the
control variables explains which source pertains to which control variable.
The OECD database (Conway and Nicoletti, 2006) is from the OECD international regula-
tion database. It is based on a survey across 26 OECD countries from 1975 to 2008. The
survey questions and answer options are presented in Appendix D. Since most of the data
for liberalisation is derived from a single survey, there might be a mono-operation bias. In
other words, since the operationalization of the construct uses a single method, this
method is part of the construct actually studied (Shadish et al., 2001). This is illustrated by
the fact that some indicator scores do not coincide with values reported by other sources.
Adjustment for these discrepancies is impossible since the OECD database does not ex-
plicitly tell what definitions were used in answering the questions. The main issue that un-
derlies this problem may be that some policy measures are introduced gradually whereas
most studies assume a sudden change in their operationalization.
3.4. Statistical analysis
The hypotheses on liberalisation and wind energy adoption are tested by conducting sta-
tistical analysis. First, exploratory analysis can reveal what has happened regarding liberal-
isation and wind energy during the concerned time period. Second, the explanatory data
analysis can reveal why things have happened. The following sections first treat the ex-
planatory analysis and then discusses choosing the best approach for testing the hypoth-
eses. Subsequently, the chosen fixed effects linear model is discussed in detail.

54
3.4.1. Exploratory analysis
The exploratory analysis of the data set aims to discover the particular characteristics of
the data. First, descriptive statistics can clarify the distribution of the data and highlight
how wind energy shares and liberalisation have developed over time. Second, principal
component analysis aims to discover the relationship between the independent variables,
i.e. it aims to discover whether or not certain liberalisation measures followed roughly the
same introduction pattern. This may enhance the theoretical understanding of the liberal-
isation process.
Descriptive statistics
Descriptive statistics can be used to get acquainted with the characteristics of the dataset.
They present quantitative descriptions in a manageable form (Babbie, 2007). The charac-
teristics or so-called distribution of the data is appropriately described by the mean, min-
imum, maximum and standard deviation. The standard deviation is a measure for the
spread of values in the dataset. The standard deviation SN is calculated as in the equation
1 with N being the total number of observations, xi an observation and the mean (Weis-
stein, 2012c).
√
∑
(1)
Skewness provides a measure of the degree of asymmetry of a distribution (Weisstein,
2012b). Skewness gives additional information about the distribution in terms of preva-
lence of extreme values on either the left side or the right side of the distribution. In a
positively skewed distribution, extreme values are found on the right side. In a negatively
skewed distribution, extreme values are found on the left side of the distribution. SPSS
calculates skewness as the adjusted Fisher-Pearson standardized moment coefficient
which includes an adjustment for smaller sample sizes (Doane, 2011). The maths is given
by equation 2.
∑ (
)
(2)
Additionally, the number of observations is in itself of interest since it is highly decisive in
the significance of later statistical outcomes. A box plot allows visualization of distribution
of the data as well as comparison of distributions over time. All these exploratory tech-
niques are mainly interesting for the data on wind energy adoption but not so much for
the variables on liberalisation. The following section describes an exploratory technique
that grants insight in the liberalisation indicators.
Factor analysis
Factor analysis reveals the interrelatedness of a set of variables by giving a number of fac-
tors and their relatedness to the concerned variables. The factors represent a number of
liberalisation variables that form a cluster through similar patterns. Such clusters mean in
practice that the variables describe phenomenon that occurred in roughly the same way,
e.g. two liberalisation measures were introduced at the same time or with the same speed
in most countries. When the variables are somehow related, the number of relevant fac-
tors will be lower than the number of variables, i.e. if variables are related they are corre-
lated most with a few factors only.

55
Following Steiner (2000), principal component analysis (PCA) is chosen over other meth-
ods. The input for the PCA is all the data for the different measures of liberalisation. The
analysis returns a number of factors and a weight for each combination of factor and vari-
able. The weights indicate to what degree a variable coincides with a factor. From these
results it can be observed whether certain measures were introduced as packages or if
they were introduced more separately. The variables that have their highest weight with
the same factor, are closely related.
Component extraction in SPSS. Analyse – Dimension reduction – Factor.
3.4.2. Choosing the right test
Descriptive statistics and factor analysis provide some insight in what is happening with
liberalisation and wind energy. To understand why this happens the variables need to be
related using statistical tests. Since the data features time series of individual countries,
the observations may be auto-correlated. In other words, the wind energy shares of sepa-
rate countries may be structurally different. A multi-level analysis with the independent
variables modelled as fixed effects accounts for this. The following sections first discuss
country-specific effects and subsequently address random and fixed effects.
Country-specific effects
A simple F-test can be used to test for country-specific effects (Steiner, 2000). Country-
specific effects are structural differences between the wind shares of different countries.
The problem of country-specific effects is illustrated in figure 14 by means of example da-
ta. The thin regression lines are for five different units of observation, the thick regression
line is for the combined data. Due to the structural differences in wind shares of countries,
the single regression misrepresents the actual relationship between the variables per
country.
Differences in the means of country data are indicative for structural differences between
countries. The F-test compares the means of different of wind energy scores per country.
In other words, the mean wind energy share of one country is compared with the mean
wind energy share of another country. The null-hypothesis of equal means of country
wind shares is rejected. As such, the simple linear model should be rejected. The following
section discusses the possible causes of country-specific effect and
Example of bias through unit-specific effect in linear regression
Figure 14 – The possible role of unit-specific effects in linear regression (no real data).
Country-specific effects in SPSS. Compare means – One-way ANOVA.
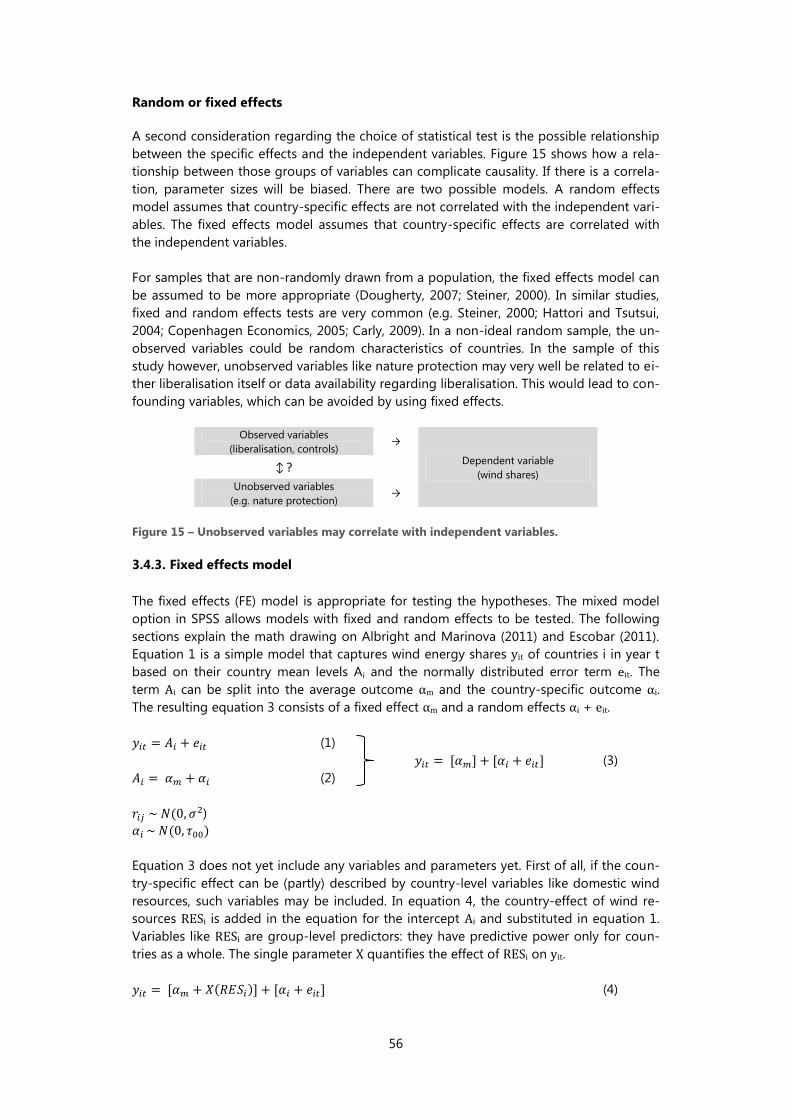
56
Random or fixed effects
A second consideration regarding the choice of statistical test is the possible relationship
between the specific effects and the independent variables. Figure 15 shows how a rela-
tionship between those groups of variables can complicate causality. If there is a correla-
tion, parameter sizes will be biased. There are two possible models. A random effects
model assumes that country-specific effects are not correlated with the independent vari-
ables. The fixed effects model assumes that country-specific effects are correlated with
the independent variables.
For samples that are non-randomly drawn from a population, the fixed effects model can
be assumed to be more appropriate (Dougherty, 2007; Steiner, 2000). In similar studies,
fixed and random effects tests are very common (e.g. Steiner, 2000; Hattori and Tsutsui,
2004; Copenhagen Economics, 2005; Carly, 2009). In a non-ideal random sample, the un-
observed variables could be random characteristics of countries. In the sample of this
study however, unobserved variables like nature protection may very well be related to ei-
ther liberalisation itself or data availability regarding liberalisation. This would lead to con-
founding variables, which can be avoided by using fixed effects.
Observed variables
(liberalisation, controls) →
Dependent variable
(wind shares) ↕ ?
Unobserved variables
(e.g. nature protection) →
Figure 15 – Unobserved variables may correlate with independent variables.
3.4.3. Fixed effects model
The fixed effects (FE) model is appropriate for testing the hypotheses. The mixed model
option in SPSS allows models with fixed and random effects to be tested. The following
sections explain the math drawing on Albright and Marinova (2011) and Escobar (2011).
Equation 1 is a simple model that captures wind energy shares yit of countries i in year t
based on their country mean levels Ai and the normally distributed error term eit. The
term Ai can be split into the average outcome αm and the country-specific outcome αi.
The resulting equation 3 consists of a fixed effect αm and a random effects αi + eit.
(1)
(3)
(2)
)
Equation 3 does not yet include any variables and parameters yet. First of all, if the coun-
try-specific effect can be (partly) described by country-level variables like domestic wind
resources, such variables may be included. In equation 4, the country-effect of wind re-
sources RESi is added in the equation for the intercept Ai and substituted in equation 1.
Variables like RESi are group-level predictors: they have predictive power only for coun-
tries as a whole. The single parameter X quantifies the effect of RESi on yit.
(4)

57
The fixed effect parameter X will explain some of the variance in yit and therefore de-
creases the value of the random effect αi in equation 4 as compared to its value in equa-
tion 3. So, instead of assuming that country-specific effects are randomly distributed over
the cases, they are explicitly related to independent variables like domestic wind re-
sources. This distinguishes the fixed effects model specification from the random effects
model. In the random effects model, the variation of the intercept Ai (the specific effect)
would be assumed random instead of correlated with RESi.
Besides the country-level effects, also within-country effects may be included. The within-
country variance can be assigned to time-variant variables like Gross Domestic Product
(GDP). Such variables are individual level predictors, i.e. they predict on the level of indi-
vidual observations for a single country at a single point in time. The effect of GDP within
a certain country i is measured by parameter Yi. The parameters Yi can be split into βm
and βi to allow for a distinction between the average effect and the country-specific ef-
fect. Equation 7 combines country-level and within-country effects.
( ) (5)
(6)
( ) (7)
Again, just like for the intercept Ai, it is not assumed that the estimates for Zi are randomly
distributed across countries. Therefore, the term Zi must not only be explained by the av-
erage effect βm and the random effect βi, but also by variables like RESi. In equation 8, the
variable RESi is added to equation 7. Subsequently, equation 9 is the rewritten version of
equation 8 by ordering the fixed and random effects. The error term is now a three-fold
term that correlates with the independent variable.
( ) (8)
( ) ( ) ( ) (9)
Equation 9 shows what kind of model is used by SPSS. Naturally, the other variables are
included in the same way as RESi (when time-invariant) or GDPij (when time-variant). The
parameter estimates for X and βm are of core interest. Furthermore, the grand mean αm is
given by SPSS. The random effects terms describe the unexplained variance. However,
due to the multi-level nature of mixed models, there is no standard approach for finding
the explained variance (e.g. Edwards et al., 2008).
The mixed model function of SPSS allows the user to first distinguish the grouping (or
subject) variable. In this study, the countries are the subject variables. Subsequently, the
explanatory variables can be added as fixed effects to the model. All ordinal variables are
split into dummies. Only main effects are considered, since the data set is too small to
feature sufficient observations with combined effects. At t-test shows the significance of
the parameters estimates.
Fixed effects in SPSS. Analyse – Mixed Model – Linear.

58

59
4. Results
Now I know why there are so many people who love chopping wood. In
this activity one immediately sees the results.
Albert Einstein
(Seelig, 1956)
This chapter presents the results of the data-analyses and reflects on them. First,
there are exploratory statistics that provide a general understanding of liberalisa-
tion and wind energy adoption. Subsequently, the explanatory statistics explicate
the effects of single liberalisation measures on wind energy shares. Finally, the dis-
cussion of the results includes the evaluation of the hypotheses, reflection on the
use of the MLP and recommendations for future research.
4.1. Descriptive statistics
Descriptive statistics provide first insight in the dataset on liberalisation and wind energy
shares. First, key descriptive indicators are given. They are frequency, mean, standard de-
viation and skewness. Second, the progress in electricity reform is visualized through time.
Third, principal component analysis is used to find cluster of liberalisation measures. The
current state of implementation for the clusters is plotted. For wind energy, a plot of ca-
pacity and production shares as well as a box plot for production offer understanding of
the data.
4.1.1. Key descriptive indicators
Table 6 gives the key descriptive indicators. The frequency column shows that the differ-
ent scores for all indicators of liberalisation but privatisation are moderately well spread.
This provides sufficient opportunities to find statistically significant relationships. The
skewness of the indicators shows that most indicators, except for the independent regula-
tor and third party access, are right-tailed, i.e. there are relatively few high values. This
means that the sample features more instances of weak liberalisation than of strong liber-
alisation.
As a result of the moderately even spread of indicator scores, the means of binary indica-
tors vary around 0,5. For shares of wind energy, the mean is 1,16, i.e. the average share of
wind energy in the sample for the years 1990-2007 is 1,16 per cent. The standard devia-
tions do not give much additional information for the indicators of liberalisation since the
limited number of scores lead to easy to understand distributions. For wind energy, the
relatively low standard deviation shows that values are concentrated around the mean.
For wind shares, roughly 16 per cent of the values are exactly zero. This may have an un-
desirable effect on estimator sizes in further analyses; zeros can give a false ideas of stag-
nated growth whereas they in fact represent the absence of an wind energy industry.
Therefore, a variable controlling for the existence of wind energy is introduced (see also
section 3.2.3). Skewness testing shows that wind shares are relatively often low. This coin-
cides with the high number of zero‘s and may point to exponential growth.

60
Table 6 – Descriptive statistics: frequency, mean, standard deviation and skewness.
Indicator Frequency Mean St. dev. Skewness
Wind share
0 %
0 – 18,92 %
18,92 %
378
59
318
1
1,16 2,77 3,92
Wholesale market
No market
Market
378
239
139
0,37 0,48 0,55
Unbundling Total
Integrated
Mixed
Unbundled
378
170
153
55
0,70 0,71 0,52
Unbundling TSO
Integrated
Unbundled
378
208
170
0,45 0,50 0,20
Retail market
No market
Business only
All
378
176
99
103
0,81 0,84 0,38
Independent regulator
No regulator
Regulator
378
177
201
0,53 0,50 -0,13
Third Party Access
No TPA
TPA
378
166
212
0,56 0,50 -0,25
Privatisation
Public
Mostly public
Mixed
Mostly private
Private
378
146
119
56
34
23
1,12 1,20 0,94
4.1.2. Electricity reform
Electricity reform can be analysed statically or dynamically. This section starts with the dy-
namic analysis by visualizing the historical implementation of the liberalisation measures.
Figure 16 displays the number of sample countries that have taken certain measures dur-
ing the period 1990 – 2007. The interval between the first directive (1996) and the second
directive (2003) shows a ―wave‖ of reforms. The relationship between the measures is con-
firmed by the graph. For instance retail markets can only function if other measures like
unbundling and TPA have been introduced. Therefore, the introduction of retail markets
lags behind whereas TPA is a ―frontrunner‖ from the later nineties onwards. Similarly,
most measures are preceded by an independent regulator since the regulator is needed
to actually execute the measure and oversee the implementation.
The current state of electricity reform can be retrieved from the data in two steps. First,
the current state comprises of the levels of reform and the experience of countries with
those levels of reform. Great Britain, for instance, has 20 years of experience with a com-
pletely privatized industry whereas Hungary has 12 years of experience with mixed own-
ership in the industry. The UK thus features a highly reformed industry in terms of levels
and experience. Second, since reform measures may be highly correlated they may need
to be represented by aggregate indicators to grasp the real state of affairs. Third party ac-
cess and retail market opening for instance often go together for instance since they are
complementary and may thus be represented by a single indicator.

61
Number of countries that have introduced reforms (in total 19 countries)
Figure 16 – Measures introduced in sample countries (sources mentioned in section 3.3).
Factor analysis reveals the statistical relationships between the independent variables. Ta-
ble 7 shows the factor loadings. A factor loading close to 1 indicates that a variables is
closely related with that factor. Three factors can be distinguished. The first factor seems
to represent mostly elements of competition, the second has to do mostly with access for
newcomers (though an element of competition, so the distinction is not perfect) and the
third represents the single variable privatisation. The first and second factor can also be
summarized as ―deregulation‖ (again, wording is not perfect, merely pragmatic) as op-
posed to ―privatisation‖ since the values indicate that the first two factors are highly cor-
related with each other.
Table 7 - Rotated component matrix for the indicators for liberalisation.7
Indicator Competition Access Privatisation
Wholesale market 0,870 0,295 0,101
Unbundling Total 0,758 0,340 0,303
Unbundling TSO 0,688 0,613 0,088
Retail market 0,670 0,553 0,244
Independent regulator 0,298 0,895 0,102
Third Party Access 0,463 0,759 0,216
Privatisation 0,182 0,140 0,968
7 Extraction Method: Principal Component Analysis. Rotation Method: Varimax with Kaiser Normalization. Rota-
tion converged in 5 iterations.
0
2
4
6
8
10
12
14
16
18
20
19
90
19
91
19
92
19
93
19
94
19
95
19
96
19
97
19
98
19
99
20
00
20
01
20
02
20
03
20
04
20
05
20
06
20
07
Independent regulator
Wholesale market
Full retail market
Mixed or private industry
Separate TSO
Mixed or unbundled industry
TPA
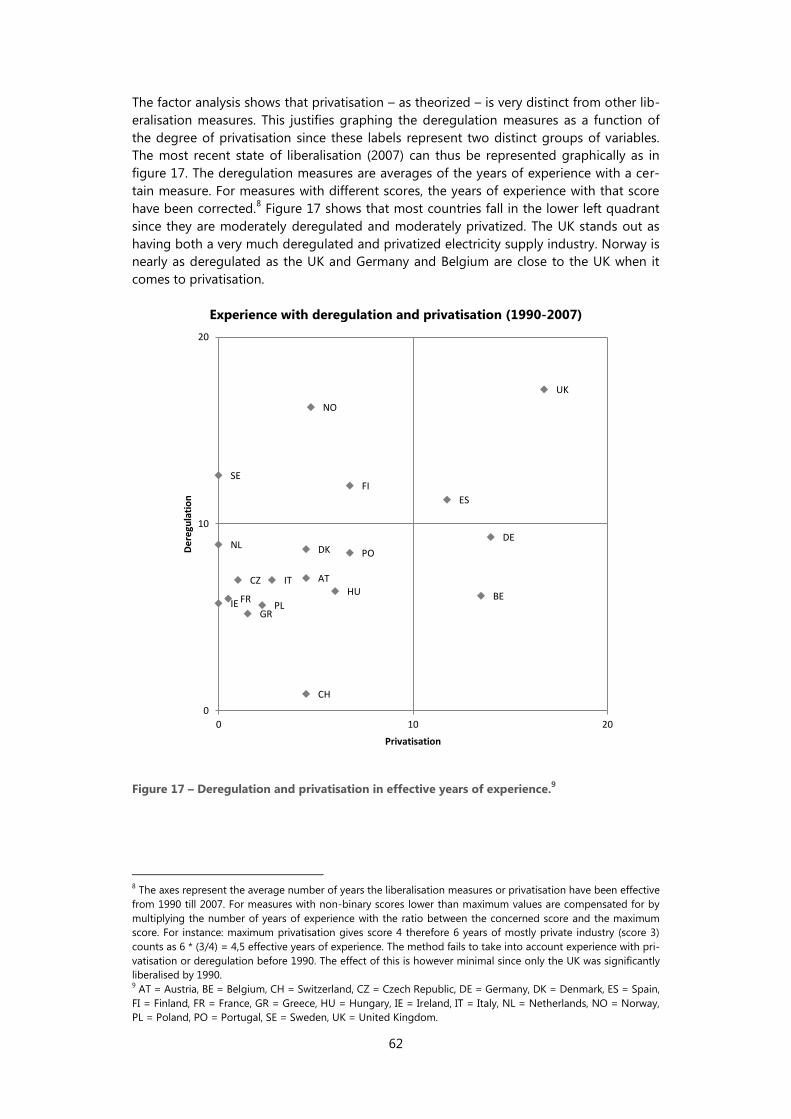
62
The factor analysis shows that privatisation – as theorized – is very distinct from other lib-
eralisation measures. This justifies graphing the deregulation measures as a function of
the degree of privatisation since these labels represent two distinct groups of variables.
The most recent state of liberalisation (2007) can thus be represented graphically as in
figure 17. The deregulation measures are averages of the years of experience with a cer-
tain measure. For measures with different scores, the years of experience with that score
have been corrected.8 Figure 17 shows that most countries fall in the lower left quadrant
since they are moderately deregulated and moderately privatized. The UK stands out as
having both a very much deregulated and privatized electricity supply industry. Norway is
nearly as deregulated as the UK and Germany and Belgium are close to the UK when it
comes to privatisation.
Experience with deregulation and privatisation (1990-2007)
Figure 17 – Deregulation and privatisation in effective years of experience.9
8 The axes represent the average number of years the liberalisation measures or privatisation have been effective
from 1990 till 2007. For measures with non-binary scores lower than maximum values are compensated for by
multiplying the number of years of experience with the ratio between the concerned score and the maximum
score. For instance: maximum privatisation gives score 4 therefore 6 years of mostly private industry (score 3)
counts as 6 * (3/4) = 4,5 effective years of experience. The method fails to take into account experience with pri-
vatisation or deregulation before 1990. The effect of this is however minimal since only the UK was significantly
liberalised by 1990. 9 AT = Austria, BE = Belgium, CH = Switzerland, CZ = Czech Republic, DE = Germany, DK = Denmark, ES = Spain,
FI = Finland, FR = France, GR = Greece, HU = Hungary, IE = Ireland, IT = Italy, NL = Netherlands, NO = Norway,
PL = Poland, PO = Portugal, SE = Sweden, UK = United Kingdom.
AT
BE
CZ
DK
FI
FR
DE
GR
HU IE
IT
NL
NO
PL
PO
ES
SE
CH
UK
0
10
20
0 10 20
De
regu
lati
on
Privatisation
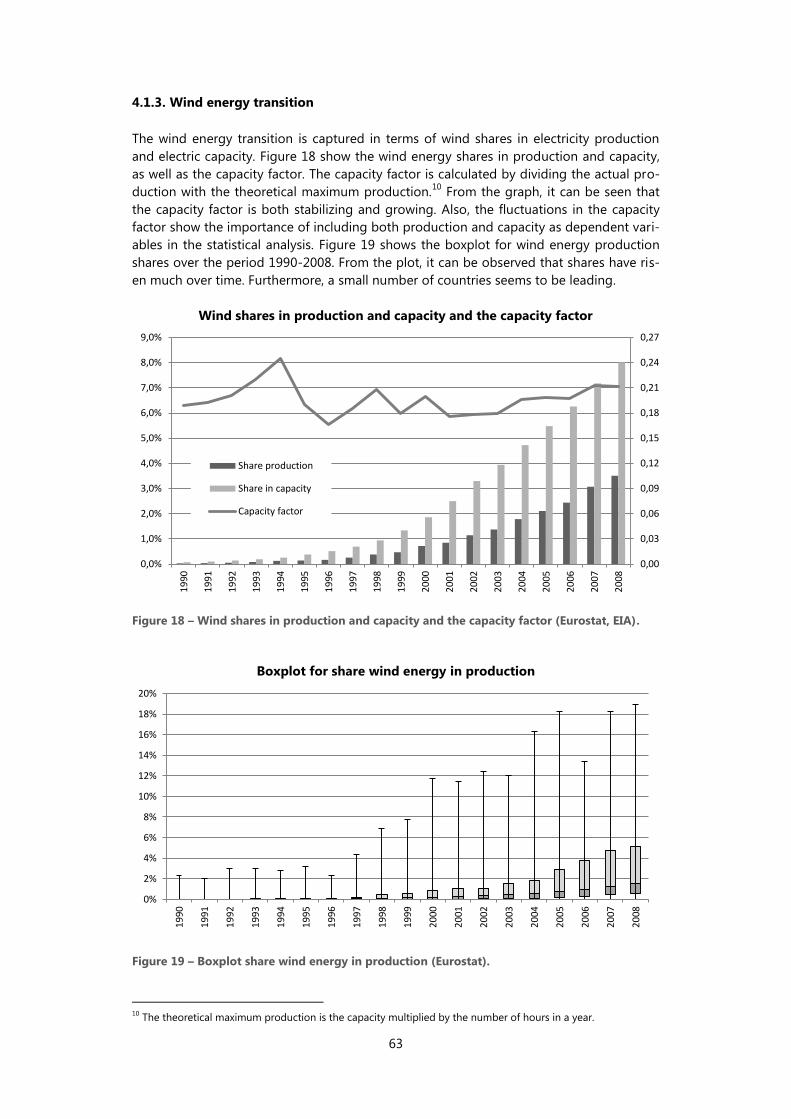
63
4.1.3. Wind energy transition
The wind energy transition is captured in terms of wind shares in electricity production
and electric capacity. Figure 18 show the wind energy shares in production and capacity,
as well as the capacity factor. The capacity factor is calculated by dividing the actual pro-
duction with the theoretical maximum production.10
From the graph, it can be seen that
the capacity factor is both stabilizing and growing. Also, the fluctuations in the capacity
factor show the importance of including both production and capacity as dependent vari-
ables in the statistical analysis. Figure 19 shows the boxplot for wind energy production
shares over the period 1990-2008. From the plot, it can be observed that shares have ris-
en much over time. Furthermore, a small number of countries seems to be leading.
Wind shares in production and capacity and the capacity factor
Figure 18 – Wind shares in production and capacity and the capacity factor (Eurostat, EIA).
Boxplot for share wind energy in production
Figure 19 – Boxplot share wind energy in production (Eurostat).
10
The theoretical maximum production is the capacity multiplied by the number of hours in a year.
0,00
0,03
0,06
0,09
0,12
0,15
0,18
0,21
0,24
0,27
0,0%
1,0%
2,0%
3,0%
4,0%
5,0%
6,0%
7,0%
8,0%
9,0%
19
90
19
91
19
92
19
93
19
94
19
95
19
96
19
97
19
98
19
99
20
00
20
01
20
02
20
03
20
04
20
05
20
06
20
07
20
08
Share production
Share in capacity
Capacity factor
0%
2%
4%
6%
8%
10%
12%
14%
16%
18%
20%
19
90
19
91
19
92
19
93
19
94
19
95
19
96
19
97
19
98
19
99
20
00
20
01
20
02
20
03
20
04
20
05
20
06
20
07
20
08

64
4.2. Explanatory statistics
Table 8 gives the results of the fixed effects model test. Each column represents the re-
sults of a different test. There is variety regarding the dependent variable, the type of un-
bundling and the sample countries. The estimator sizes represent the average increase in
the share of wind energy under the implementation of this measure. For some variables,
like privatisation, the scores are ambivalent: more privatisation is not positively correlated
in general, but a privatisation score of 3 is associated with the highest shares of wind en-
ergy. Similarly, for the retail market, opening up only seems to boost wind energy if
households are included and not only businesses.
Table 8 – Results of fixed effects test of liberalisation measures and wind energy shares.
Wind energy production share Wind energy electric capacity share
Unbun-
dling TSO
Unbun-
dling to-
tal chain
EU, un-
bundling
TSO
EU, un-
bundling
total
chain
Unbun-
dling TSO
Unbun-
dling to-
tal chain
EU, un-
bundling
TSO
EU, un-
bundling
total
chain
Independent
regulator
-0,709 -1,161 -0,624 -0,965 -1,751 -2,255 -1,830 -2,086
-1,540* -2,555*** -1,255 -1,926** -2,369*** -3,039*** -2,310** -2,583***
Wholesale
market
1,489 1,040 1,576 1,168 3,094 2,553 3,295 2,910
3,243*** 2,336*** 3,402*** 2,551*** 4,192*** 3,514*** 4,464*** 3,944***
Unbundled
TSO
-0,876 -0,890 -1,497 -1,543
-1,733** -1,678** -1,843** -1,827**
Mixed total
chain
-0,560 -0,588 -0,680 -0,503
-1,442* -1,348* -1,073 -0,716
Unbundled
total chain
1,009 0,538 0,685 -0,126
1,805** 0,885 0,751 -0,129
Third party
access
1,033 1,058 1,642 1,607 1,859 1,698 2,894 2,586
2,008** 2,116** 2,928*** 2,906*** 2,247** 2,080** 3,238*** 2,902***
Retail market
industry
-1,463 -1,291 -1,715 -1,615 -2,894 -2,760 -3,352 -3,320
-2,683*** -2,394*** -3,062*** -2,897*** -3,301*** -3,136*** -3,756*** -3,694***
Retail market
household
0,236 0,231 0,680 0,455 -0,160 -0,271 0,549 0,366
0,371 0,369 0,977 0,657 -0,156 -0,265 0,495 0,328
Privatisation:
mostly public
1,146 1,087 1,587 1,396 1,570 1,558 2,322 2,318
3,698*** 3,531*** 4,313*** 3,656*** 3,153*** 3,101*** 3,961*** 3,765***
Privatisation:
mixed
-0,342 -0,239 -0,536 -0,386 -0,751 -0,510 -1,100 -0,799
-0,779 -0,549 -1,176 -0,840 -1,064 -0,719 -1,514* -1,079
Privatisation:
mostly private
1,707 1,100 1,864 1,182 3,034 2,438 3,538 3,202
3,090*** 1,971** 2,952*** 1,758** 3,418*** 2,675*** 3,515*** 2,956***
Privatisation:
fully private
1,382 0,765 1,212 0,885 3,712 3,292 3,358 3,460
1,920** 1,042 1,655** 1,179 3,209*** 2,747*** 2,878*** 2,861***
GDP/capita 0,000 0,000 0,000 0,000 0,000 0,000 0,000 0,000 1,415* 0,627 1,630* 1,207 0,673 0,216 0,681 0,558
Population
density
-0,002 -0,002 -0,002 -0,003 -0,002 -0,002 -0,002 -0,003
-0,882 -0,979 -1,059 -1,439* -0,659 -0,795 -0,683 -0,890
Wind
resources
0,003 0,000 0,002 0,000 -0,007 -0,009 -0,006 -0,006
0,387 0,050 0,364 0,000 -0,681 -0,828 -0,550 -0,529
Grid access -0,026 -0,032 -0,034 -0,042 -0,058 -0,063 -0,069 -0,073 -2,791*** -3,425*** -2,507*** -3,041*** -3,789*** -4,112*** -3,157*** -3,250***
Electricity use 0,000 0,000 0,000 0,000 0,000 0,000 0,000 0,000 -1,039 -1,071 -0,287 -0,616 -1,155 -1,258 -0,316 -0,509
Cluster
development
-1,535 -1,328 -1,494 -1,394 -1,826 -1,632 -1,683 -1,623
-4,891*** -4,246*** -4,568*** -4,274*** -3,621*** -3,195*** -3,229*** -3,087***
Administrative
barriers
0,022 0,020 0,034 0,029 0,049 0,047 0,068 0,068
2,184** 2,031** 2,908*** 2,506*** 2,981*** 2,875*** 3,692*** 3,607***
Willingness
to pay
-0,345 0,635 -1,837 -1,594
-0,240 0,418 -0,800 -0,651
Turbine size 0,001 0,001 0,001 0,001 0,003 0,003 0,002 0,002 2,770*** 2,720*** 1,017 1,189 4,194*** 4,061*** 2,385*** 2,163**
RD&D 0,002 -0,002 0,002 -0,002 -0,010 -0,014 -0,010 -0,011 0,325 -0,325 0,248 -0,303 -0,878 -1,182 -0,822 -0,866
Wind or not 1,133 1,150 1,716 1,645 1,756 1,762 2,848 2,813 2,255** 2,327*** 3,065*** 2,934*** 2,173** 2,183** 3,193*** 3,112***
T-statistic in italics. *p < 0.1, **p < 0.05, ***p < 0.01

65
Figure 20 visualizes the results of table 8 by graphing the estimator sizes as bars. All eight
experiments are plotted. The absence or presence of an outline for the bars represent the
distinction between the dependent variables (capacity share or production share). Per
type of dependent variable, the four scenarios are indicated by different shades. The ef-
fect size for capacities are larger in general since capacity shares are larger than produc-
tion shares. This is due to the below average capacity factor of wind energy. The names of
the liberalisation measures at the vertical axis also mention the number of statistically sig-
nificant results among the total number of measured effects sizes for that measure. The
number of measured effect sizes differs per measure since not all measures were included
in all experiments. If the findings are significant across all tests (p ≤ 0.1) they can be as-
sumed to be solid. Based on this, the following can be concluded.
- Mostly private and mostly public industries have a positive effect on both shares of
production and share of capacities. Fully private industries have a positive effect that
is significant in most experiments. Mixed industries have a small negative effect that is
significant in only one instance.
- Retail market opening for industry has significantly negatively affected wind energy
adoption. Full market opening has a positive effect in most tests but none of the tests
yields significant outcomes.
- Third party access has a positive and significant effect on wind energy adoption in all
eight tests.
- Full unbundling of the total chain yields positively affects wind energy whereas mixed
unbundling of the total chain has negative effects. For unbundling of the TSO, only
significant negative effects are found.
- Wholesale markets are found to have positive significant effects on wind energy
adoption in all tests.
- The independent regulator has a negative effect on wind energy development that is
significant in 7 out of 8 tests.
- Of the control variables, grid access, cluster development, administrative barriers, and
turbine size have significant effects in all eight tests. The control variable for the exist-
ence of wind is also significant. Unexpectedly, cluster development has a negative ef-
fect and administrative barriers have a positive effect.

66
Average effect size of liberalisation measures on capacity and production shares
The numbers behind the measures at the vertical axis indicate the occurrence of significant effects among all ef-
fects for this measure. For some variables, there are less than 8 effects since they were not included in all tests.
Figure 20 – Average estimated effect of liberalisation measures.
4.3. Discussion
Empirical evidence suggests that liberalisation has a mixed effect on wind energy adop-
tion in the electricity supply industry. In this subchapter, the analyses and the assumptions
are reflected upon. The following sections discuss the results of hypothesis testing, possi-
ble methodological flaws, the merits of the multi-level perspective, the significance of the
results and possible directions for further research.
4.3.1. Evaluation of hypotheses
Generally, liberalisation has a mixed effect on wind energy adoption. There are both
measures that have a positive significant effect and measure that have a negative signifi-
cant effect. Since interactions have not been analysed, the cumulative result of liberalisa-
tion cannot be assessed. The following section discusses the hypotheses regarding each
measure.
-4 -3 -2 -1 0 1 2 3 4
Independent regulator (7/8)
Wholesale market (8/8)
Unbundled TSO (4/4)
Mixed total chain (2/4)
Unbundled total chain (1/4)
TPA (8/8)
Retail market industry (8/8)
Retail market household (0/8)
Privatisation: mostly public (8/8)
Privatisation: mixed (1/8)
Privatisation: mostly private (8/8)
Privatisation: private (6/8)
Average effect on share in capacity or production (percent point)
Capacity EU, unbundling total chain Capacity EU, unbundling TSO
Capacity, unbundling total chain Capacity, unbundling TSO
Production EU, unbundling total chain Production EU, unbundling TSO
Production, unbundling total chain Production, unbundling TSO

67
Privatisation
Privatisation was expected to negatively influence wind energy adoption but the statistical
outcomes mostly suggest that privatisation has a positive effect. Industries with mixed
ownership do however not feature a positive influence on wind energy. The results may
not be fully consistent since the number of observations is rather low per category of
ownership. Furthermore, the dataset speaks of public or private industries whereas in real-
ity companies are either more privatized or not. This heterogeneity is lost in the opera-
tionalization. Also, privatisation may be restricted to certain stages of the value chain, e.g.
only production companies may be privatized in one country whereas only distribution is
privatized in other countries.
Independent regulators
Regulators are unexpectedly shown to have a negative effect that is significant in most
tests. There are two explanations. First, Johanssen et al. (2004) notes that 8 out of 15 Eu-
ropean regulators have the objective of an environmentally friendly electricity supply
whereas 11 out of 15 have the objective of economic efficiency and 14 out of 15 strive for
more competition. If this means that environmental concerns are ranked much lower than
economic efficiency, regulators may disadvantage relatively costly options like wind ener-
gy. Second, the positive effect of regulators may already be captured by the other
measures. Regulators may play an important role in the proper execution of other liberali-
sation measures. As such, their net effect may still be positive. Additional insight could be
gained by studying the combined effects of regulators and measures like unbundling. The
dataset may however be too small to justify such analyses.
Unbundling
Unbundling does not have the clear positive effect that was expected. The unbundling of
transmission and generation has significant negative influences. Since wind capacity is not
connected to the transmission grid but to the distribution grid, the meaning of this is ra-
ther limited. A fully unbundled industry, i.e. including unbundling of distribution and
smaller production units, does have a mostly positive effect however. A mixed industry
has a negative effect. This may point to the conclusion that unbundling of distribution has
a positive effect. Since there is no separate variable for unbundling of distribution, this
hypothesis cannot be tested however.
Wholesale markets
Wholesale markets were expected to negatively influence wind power but in fact have a
significantly positive influence. This may have to do with cross-border transport since
wholesale markets are often international and thus allow excess wind energy to be traded
to other countries. Germany is a good example of this. In literature, this finding is con-
firmed by Bird et al. (2005) who argue that in the United States, sufficiently flexible and
fluid markets that do not penalize intermittent production can help to facility wind energy
adoption. The European wholesale markets perhaps meet these criteria.

68
Retail markets
Retail market opening was expected to have a positive effect on wind energy shares. Sup-
plier choice for industry has a negative effect whereas full retail market opening has
mostly a modest positive effect. This suggests that in a fully opened market, household
supplier choice compensates for the negative effect of industry supplier choice. It could
thus be true that consumers boost wind energy but that this effect is offset by industry
choosing for less costly conventional sources of electricity. However, since the results on
full retail market opening are not significant, it is not possible to draw clear conclusions
on this measure.
Third party access
Third party access is found to have the expected positive effect. The results are significant
for all the tests. TPA may thus indeed positively influence wind energy shares through ac-
cess for new and innovative actors. It supports the claims by Meyer (2007) and McLaren
Loring (2007) who argue that local initiatives are generally more successful than projects
undertaken by incumbent utilities.
Control variables
Many of the control variables yield the expected effects on wind energy adoption. Contra-
ry to the expectations, cluster development has a negative effect and administrative barri-
ers a positive effect. Both variables are time-invariant and therefore of limited reliability.
The assumption that countries with well-developed clusters also feature well developed
clusters for wind energy was perhaps unjust. For administrative barriers, the assumption
that large administrative lead times deter developers or correlate with failed projects
could also be incorrect.
4.3.2. Multi-level perspective
The multi-level perspective has, overall, been proven useful as an inspiration for setting
up empirical experiments and establishing hypotheses. Moreover, the use of the MLP for
quantitative analysis of liberalisation and wind energy adoption may provide lessons fur-
ther analyses of technological transitions. The following section first relates some choices
in the use of the MLP in this study to critiques on the MLP found in literature. Subse-
quently, the tension between the complexity of the MLP as a narrative tool and the sim-
plicity of statistical analysis is discussed.
Agency, operationalization and niche emphasis
The MLP has been criticized as focussing too much on structure and not enough on
agency (Smith, 2005; Genus, 2008). Geels (2011) points out that agency is given a role but
may indeed lack in certain forms. It is among others proposed to incorporate findings
from business studies and strategic management to further develop the role of agency.
As an answer to that, this study integrates the theory of clusters in the dimension of net-
works. In general however, the demand for more agency is hard to meet in statistical em-
pirical work. Since aggregation and averaging is an integral part of data collection, agency
is by definition filtered out. This is legitimate since the larger sample size (as compared to
a case study) allows neglecting certain specific events. As such, MLP is in its basic form
perhaps more suited for studies with a larger N than single cases.

69
Among others Genus (2008) calls for better operationalization and delineation of the re-
gime. Geels (2011) responds that MLP is an analytical tool that may be operationalized for
different scopes such as a primary fuel or the complete electricity system. The operation-
alization and delineation used in this study may however be applied more generally. Es-
pecially for network industries, general guidelines on how to operationalize the levels
seem possible. The use of the notion of competition to draw the line between niche and
regime may be a useful addition to the MLP. It is applicable in network industries since
the presence of a connection with an infrastructure is the main criterion for the presence
of competition. More generally, this study has shown that the MLP can operationalized
such that existent data can be used to quantitatively describe the transition.
Berkhout et al. (2004) note that niche processes as drivers for regime change are overem-
phasised in comparison to drivers at the landscape level. Geels (2007) proposes transition
pathways that combine both landscape and niche pressures to avoid the bottom-up bias.
Dahle (2007) identifies similar pathways. However, in this study, both types of pressures
are explicitly dealt with using the concept of ―adaptive capacity‖ (Smith et al., 2005): the
landscape changes the susceptibility of the regime to change whereas niches changes the
regime through offers innovative products. This approach may be more flexible and at-
tractive than the highly stylized and therefore restrictive transition pathways. Archetype
pathways are hard to match with reality and may lead to the creation of many hybrid
pathways. Therefore, the notion of adaptive capacity seems more suitable as an analytical
tool that incorporates landscape pressures and niche developments. Moreover, it can be
easily related to other theory on for instance markets as shown in this study.
Ontology versus methodology
Geels (2011) identifies a tension in social sciences between ontology and methodology
based on the work by Hall (2003) and Abell (2004). Geels (2011) characterizes the MLP as
a process-oriented theory with an ontology that outstrips the simplicity of variance theory
(statistical analysis of variables) and violates the assumptions of regression techniques. He
claims that the MLP ―should not be reduced to a mechanical procedure by forcing it into
a variance theory straightjacket‖ and that ―research of complex phenomena such as tran-
sitions cannot be reduced to the application of methodological procedures‖.
This study combines elements of the MLP with variance theory. It captures a technological
transition through the lens of the MLP and by means of statistical analysis. In other words,
this research studies the relationship between two variables by correlational analysis and
explication of the mechanism between those variables with the use of the MLP. There are
several reasons to do so. First, the approach is actually supported by other statements of
Geels (2002; 2011) claiming that the MLP is mainly a heuristic and not an ontological tool.
As such, it can be a search method for setting up a panel data analysis.
Furthermore, the contention that the MLP outstrips statistical analysis in complexity,
seems exaggerated. There is not so much a problem of analytical tools but rather a data
availability problem. Whereas the MLP case studies do not require standardized data, sta-
tistical analysis requires large standardized data sets. Besides, even without large numbers
of variables, random assignment or appropriate statistical tests that control for instance
specific effects can yield valuable results. Instead of simplifying or violating the theory of
the MLP, such experiments can validate and strengthen the outcomes of case studies.

70
4.3.3. Future research
Future research may focus on three aspects. First, this study focuses on wind energy
whereas many other renewables like solar and biomass may be just as important in relat-
ing environmental performance of the ESI with liberalisation. Wind energy was chosen
since it features exemplary characteristics (it covers most issues that are typical to renew-
ables), relative straightforward applications and good data availability. For solar and bio-
mass, off grid applications and combined heat and power complicate research. As such,
the operationalization of the MLP would need to be different and data collection will be a
challenge of its own. Second, this study is too abstract to result in concrete policy sugges-
tions regarding liberalisation and wind energy. It would be interesting to deepen the un-
derstanding of the nexus between liberalisation, renewable energy development and sec-
toral policy and thus provide outcomes that are more useful to policy makers. Lastly, the
MLP has been operationalized and used for statistical analysis for a rather specific case.
Further research could apply the same approach to a wealth of technological transitions
in for instance transport, energy and communication.

71
5. Conclusion
...no matter how many instances of white swans we may have observed,
this does not justify the conclusion that all swans are white.
Sir Karl R. Popper (1959)
This study relates liberalisation to wind energy adoption by means of statistical analysis of
19 European countries based on the multi-level perspective (MLP) for technological tran-
sitions. Liberalisation was conceptualized as a landscape pressure altering the ability of
the electricity supply industry regime to adopt wind energy technology offered by the
niche level. This process was stylized into a causal diagram that served as the basis for a
fixed effects panel data analysis.
In comparison to similar panel data analyses, this study uses a more elaborate operation-
alization of liberalisation and focuses on the yet unexplored topic of renewable energy
development. Furthermore, it innovatively uses the MLP for setting up a statistical analysis
instead of performing cases studies. As such, this work can be a step forwards in the de-
velopment of the theoretical understanding of technological transitions.
Liberalisation was analysed as two separate processes: privatisation and regulation. The
exploratory analysis confirmed this distinction. Not all hypotheses were confirmed. Privat-
isation had a mostly positive effect on wind energy shares, just like third party access and
wholesale markets. Independent regulators, retail markets for industry and unbundling
have mostly negative effects. For retail markets including households, results were not
significant.
The explanatory power may be compromised since the sample was rather small and fea-
tures very diverse countries. Furthermore, most data on liberalisation is somewhat crude
and suffers from mono-method bias. The MLP proved to be an inspiration and a guiding
concept for understanding the causality of technology adoption and setting up the statis-
tical analysis. Also, the MLP theory provided insight for formulating the hypotheses and
choosing control variables.
This study may provide some references points for designing renewable energy policy in
liberalised electricity markets. Future research may focus on other renewables like solar
and biomass, the nexus between liberalisation, renewable energy development and sec-
toral policy, or the application of MLP and statistical analysis to other technological transi-
tions. Either for public policy or for scientific research, this study can hopefully be a guide-
line and inspiration.

72

73
Bibliography
1. Abell, P. (2004). Narrative explanation: an alternative to variable-centered explanation?. Annual
Review of Sociology, 287-310.
2. Albright, J., & Marinova, D. M. (2010). Estimating multilevel models using SPSS, Stata, SAS, and
R. Information Technology Services, Indiana University (http://www. indiana. edu/~
statmath/stat/all/hlm/).
3. Amable, B. (2011). Morals and politics in the ideology of neo-liberalism. Socio-Economic Re-
view, 9(1), 3-30.
4. Arentsen, M. J., & Künneke, R. W. (1996). Economic organization and liberalization of the elec-
tricity industry: in search of conceptualization. Energy Policy, 24(6), 541-552.
5. Babbie, E. R. (2007). The practice of social research. Wadsworth Publishing Company.
6. Barnett, C. (2009). Publics and markets: what‘s wrong with neoliberalism?. Smith, S. Pain, R.,
Marston, S., Jones Iii, JP (Eds.). The Sage Handbook of Social Geography. London, Uk: Sage,
269-296.
7. Belloc, F., & Nicita, A. (2011). The political determinants of liberalization: do ideological cleav-
ages still matter?. International Review of Economics, 58(2), 121-145.
8. Belloc, F., & Nicita, A. (2012). Neo-liberalism, Partisanship, and Public Policies. Society, 1-7.
9. Berkhout, F., Smith, A., & Stirling, A. (2004). Socio-technological regimes and transition con-
texts. System innovation and the transition to sustainability: theory, evidence and policy. Ed-
ward Elgar, Cheltenham, 48-75.
10. Bier, C. (1999). Network access in the deregulated European electricity market: negotiated
third-party access vs. single buyer. CSLE Discussion Paper.
11. Bird, L., Wüstenhagen, R., & Aabakken, J. (2002). A review of international green power mar-
kets: recent experience, trends, and market drivers. Renewable and Sustainable Energy Re-
views, 6(6), 513-536.
12. Bird, L., Bolinger, M., Gagliano, T., Wiser, R., Brown, M., & Parsons, B. (2005). Policies and mar-
ket factors driving wind power development in the United States. Energy Policy, 33(11), 1397-
1407.
13. Boisseleau, F. (2004, January 26). The role of power exchanges for the creation of a single Eu-
ropean electricity market: market design and market regulation (p. 416). Delft, South Holland,
The Netherlands: Delft University Press.
14. Borenstein, S., & Bushnell, J. (1999). An empirical analysis of the potential for market power in
California‘s electricity industry. The Journal of Industrial Economics, 47(3), 285-323.
15. Bortolotti, B., Siniscalco, D., & Fantini, M. (2000). Privatisation and institutions: a cross country
analysis. (375).
16. Bortolotti, B., & Pinotti, P. (2003). The political economy of privatization. (45.2003).
17. Bower, J. (2002). Seeking the Single European Electricity Market. Oxford Institute for Energy
Studies, Oxford.-VIII.
18. Boycko, M., Shleifer, A., & Vishny, R. W. (1996). A theory of privatisation. The Economic Jour-
nal, 309-319.
19. Brennan, D., & Melanie, J. (1998). Market power in the Australian power market. Energy Eco-
nomics, 20(2), 121-133.
20. Brown, M. A. (2001). Market failures and barriers as a basis for clean energy policies. Energy
policy, 29(14), 1197-1207.
21. Carley, S. (2009). State renewable energy electricity policies: An empirical evaluation of effec-
tiveness. Energy Policy, 37(8), 3071-3081.
22. Gómez-Acebo & Pombo Abogados, S.L., Charles Russell LLP (2005). Unbundling of electricity
and gas transmission and distribution system operators.
23. Clarke, S. (2005). The neoliberal theory of society. Neoliberalism: A critical reader, 50-59.
24. Convery, F. J., & Redmond, L. (2007). Market and price developments in the European Union
emissions trading scheme. Review of Environmental Economics and Policy, 1(1), 88-111.
25. Conway, P. and G. Nicoletti (2006), "Product Market Regulation in non-manufacturing sectors
in OECD countries: measurement and highlights", OECD Economics Department Working Pa-
per No.530. [Database available from:
http://www.oecd.org/eco/reform/indicatorsofregulationinenergytransportandcommunications
etcr.htm]

74
26. Copenhagen Economics. (2005). Market opening in network industries: Part II sectoral anal-
yses. Copenhagen Economics for DG Internal Market.
27. Dahle, K. (2007). When do transformative initiatives really transform? A typology of different
paths for transition to a sustainable society. Futures, 39(5), 487-504.
28. Davids, C. A. (2007). Innovations in Windmill Technology in Europe, c. 1500–1800; The State of
Research and Future. In: Directions of Inquiry,‘ NEHA-Jaarboek voor Economische, Bedrijfs- en
Techniekgeschiedenis 66 (2003): 43–57.
29. Defeuilley, C. (2009). Retail competition in electricity markets. Energy Policy, 37(2), 377-386.
30. Da Vinci, L. (1970). The notebooks of Leonardo da Vinci (Vol. 1). Edited by Jean-Pual Richter).
Courier Dover Publications.
31. Delmas, M., Russo, M. V., & Montes‐Sancho, M. J. (2007). Deregulation and environmental dif-
ferentiation in the electric utility industry. Strategic Management Journal, 28(2), 189-209.
32. DEI (2012). Master data for wind turbines as at end of December. URL: http://www.ens.dk/en-
US/Info/FactsAndFigures/Energy_statistics_and_indicators/OverviewOfTheEnergySector/Regist
erOfWindTurbines/Sider/Forside.aspx
33. Dougherty, C. (2007). An Introduction to Econometrics. Oxford University Press, USA.
34. Drillisch, J., & Riechmann, C. (1998, December). Liberalisation of the Electricity Supply Industry-
Evaluation of Reform Policies. Energiewirtschaftliches Inst.
35. Economides, N., & Himmelberg, C. (1995). Critical mass and network evolution in telecommu-
nications. Toward a competitive telecommunications industry: Selected papers from the 1994
Telecommunications Policy Research Conference. University of Maryland, College Park, MD.
36. Economides, N. (1996). The economics of networks. International journal of industrial organi-
zation, 14(6), 673-699.
37. Edwards, L. J., Muller, K. E., Wolfinger, R. D., Qaqish, B. F., & Schabenberger, O. (2008). An R2
statistic for fixed effects in the linear mixed model. Statistics in medicine, 27(29), 6137-6157.
38. EEA (2009). Europe's onshore and offshore wind energy potential - An assessment of envi-
ronmental and economic constraints.
39. Escobar, M. R. (2011). Mixed effects modelling using SPSS.
http://mixedreviews.files.wordpress.com/2011/08/mixed-effects-modeling-using-spss.doc.
40. Eurelectric (2009). Statistics and prospects for the European electricity sector 37th edition
eurprog 2009.
41. European Commission (1987). Single European Act. Official Journal of the European Commu-
nities, L 169 of 29.6.1987.
42. European Commission (1988) The internal energy market. Commission working document.
COM (88) 238 final, 2 May 1988. [EU Commission - COM Document]
43. European Commission (1996). Directive 96/92/EC of the European Parliament and of the
Council of 19 December 1996 concerning common rules for the internal market in electricity.
Official Journal of the European Union, L, 27, 20-29.
44. European Commission (2003). Directive 2003/54/EC of the European Parliament and of the
Council of 26 June 2003 concerning common rules for the internal market in electricity and
repealing Directive 96/92/EC. Official Journal of the European Union, 46.
45. European Commission (2006). Attitudes towards energy. Special Eurobarometer 247 / Wave
64.2 - TNS Opinion & Social.
46. European Commission (2008). Energy sources, production costs and performance of technol-
ogies for power generation, heating and transport. Commission Staff Working Document ac-
companying the Second Strategic Energy Review, An EU Energy Security and Solidarity Action
Plan. SEC (2008), 2872.
47. European Commission (2009). Directive 2009/72/EC of the European Parliament and of the
Council of 13 July 2009-concerning common rules for the internal market in electricity and re-
pealing Directive 2003/54/EC. Official Journal of the European Union, 14.
48. EWEA. (2010). WindBarriers. Administrative and grid access barriers to wind power. July 2010.
49. Feigenbaum, H. B., & Henig, J. R. (1994). The political underpinnings of privatization. World
Politics, 46(2), 185-208.Feigenbaum, H., Henig, J. R., & Hamnett, C. (1998, November 13).
Shrinking the state: The political underpinnings of privatization. CAMBRIDGE-PRINT ON.
50. Finger, M., Groenwegen, J., & Künneke, R. (2005). Quest for Coherence between Institutions
and Technologies in Infrastructures, The. J. Network Ind., 6, 227.
51. Finger, M., & Künneke, R. W. (2011, November 1). International handbook of network indus-
tries: The liberalization of infrastructure (M. Finger & R. W. Künneke). Edward Elgar Publishing.

75
52. Fleming, P., & Probert, S. (1984). The evolution of wind-turbines: An historical review. Applied
energy, 18(3), 163-177.
53. Foxon, T. J. (2011). A coevolutionary framework for analysing a transition to a sustainable low
carbon economy. Ecological Economics, 70(12), 2258-2267.
54. Friedman, M. with the assistance of Rose Friedman. 1962. Capitalism and freedom.
55. Geels, F. W. (2002). Technological transitions as evolutionary reconfiguration processes: a mul-
ti-level perspective and a case-study. Research policy, 31(8), 1257-1274.
56. Geels, F. W. (2004). From sectoral systems of innovation to socio-technical systems: Insights
about dynamics and change from sociology and institutional theory. Research policy, 33(6),
897-920.
57. Geels, F. W. (2005). Technological transitions and system innovations: a co-evolutionary and
socio-technical analysis. Edward Elgar Publishing.
58. Geels, F. W., & Schot, J. (2007). Typology of sociotechnical transition pathways. Research poli-
cy, 36(3), 399-417.
59. Genus, A., & Coles, A. (2008). Rethinking the multi-level perspective of technological transi-
tions. Research Policy, 37(9), 1436-1445.
60. Geels, F. W. (2011). The multi-level perspective on sustainability transitions: Responses to sev-
en criticisms. Environmental innovation and societal transitions, 1(1), 24-40.
61. Geels, F., & Verhees, B. (2011). Cultural legitimacy and framing struggles in innovation jour-
neys: a cultural-performative perspective and a case study of Dutch nuclear energy (1945–
1986). Technological Forecasting and Social Change, 78(6), 910-930.
62. Green, R. J., & Newbery, D. M. (1992). Competition in the British electricity spot market. Jour-
nal of political economy, 929-953.
63. Grote, D. (2008). Can an ‗independent‘ regulator be effective in a hostile environment? Presen-
tation for the ESRC Centre for Competition Policy (CCP). 11-06-2008. URL:
www.uea.ac.uk/polopoly_fs/1.106475!grote.ppt .
64. Hall, P. A. (2003). Aligning ontology and methodology in comparative research. Comparative
historical analysis in the social sciences, 374.
65. Hansen, A. D., & Hansen, L. H. (2007). Wind turbine concept market penetration over 10 years
(1995–2004). Wind energy, 10(1), 81-97.
66. Hattori, T., & Tsutsui, M. (2004). Economic impact of regulatory reforms in the electricity sup-
ply industry: a panel data analysis for OECD countries. Energy Policy, 32(6), 823-832.
67. Hughes, T. P. (1993, March 1). Networks of power: electrification in Western society, 1880-
1930. Johns Hopkins University Press.
68. IEA (2000). Experience Curves for Energy Technology Policy. International Energy Agency, Par-
is, France.
69. IEC (2011). Electrical Energy Storage White Paper.
70. Jaag, C., & Trinkner, U. (2011). A General Framework for Regulation and Liberalization in Net-
work Industries. In: International Handbook of Network Industries. Finger, M. and Künneke, R.
(eds), 2011, pp. 26‐53.
71. Jacobsson, S., & Johnson, A. (2000). The diffusion of renewable energy technology: an analyti-
cal framework and key issues for research. Energy policy, 28(9), 625-640.
72. Jacobsson, S., & Bergek, A. (2004). Transforming the energy sector: the evolution of techno-
logical systems in renewable energy technology. Industrial and corporate change, 13(5), 815-
849.
73. Jamasb, T., & Pollitt, M. G. (2005). Electricity market reform in the European Union: review of
progress towards liberalisation and integration.
74. Jamasb, T. (2006). Between the state and market: Electricity sector reform in developing coun-
tries. Utilities Policy, 14(1), 14-30.
75. Jamasb, T., & Pollitt, M. (2008). Liberalisation and R&D in network industries: The case of the
electricity industry. Research Policy, 37(6), 995-1008.
76. Jobert, A., Laborgne, P., & Mimler, S. (2007). Local acceptance of wind energy: Factors of suc-
cess identified in French and German case studies. Energy policy, 35(5), 2751-2760.
77. Sander Johansen, K., Holm Pedersen, L., & Moll Sørensen, E. (2004). Independent regulatory
authorities-a comparative study of European energy regulators.
78. Junginger, M., Faaij, A., & Turkenburg, W. C. (2005). Global experience curves for wind farms.
Energy policy, 33(2), 133-150.

76
79. Katz, M. L., & Shapiro, C. (1985). Network externalities, competition, and compatibility. The
American economic review, 75(3), 424-440.
80. Kemp, R. (1994). Technology and the transition to environmental sustainability: the problem of
technological regime shifts. Futures, 26(10), 1023-1046.
81. Kern, F., & Smith, A. (2008). Restructuring energy systems for sustainability? Energy transition
policy in the Netherlands. Energy Policy, 36(11), 4093-4103.
82. Klessmann, C., Nabe, C., & Burges, K. (2008). Pros and cons of exposing renewables to electric-
ity market risks—A comparison of the market integration approaches in Germany, Spain, and
the UK. Energy Policy, 36(10), 3646-3661.
83. Krohn, S., Morthorst, P. E., & Awerbuch, S. (2009, March). The economics of wind energy. Eu-
ropean Wind Energy Association.
84. Künneke, R. W. (1999). Electricity networks: how ‗natural‘is the monopoly?. Utilities Policy, 8(2),
99-108.
85. Künneke, R., & Fens, T. (2007). Ownership unbundling in electricity distribution: The case of
The Netherlands. Energy Policy, 35(3), 1920-1930.
86. Künneke, R. W. (2008). Institutional reform and technological practice: the case of electricity.
Industrial and corporate change, 17(2), 233-265.
87. Larner, W. (2000). Neo-liberalism: Policy, ideology, governmentality. Studies in political econ-
omy, 63.
88. Larsen, A., Pedersen, L. H., Sørensen, E. M., & Olsen, O. J. (2006). Independent regulatory au-
thorities in European electricity markets. Energy policy, 34(17), 2858-2870.
89. McLaren Loring, J. (2007). Wind energy planning in England, Wales and Denmark: Factors in-
fluencing project success. Energy policy, 35(4), 2648-2660.
90. Megginson, W. L., & Netter, J. M. (2001). From state to market: A survey of empirical studies
on privatization. Journal of economic literature, 39(2), 321-389.
91. Meyer, N. I. (2007). Learning from wind energy policy in the EU: lessons from Denmark, Swe-
den and Spain. European Environment, 17(5), 347-362.
92. Milstein, I., & Tishler, A. (2011). Intermittently renewable energy, optimal capacity mix and
prices in a deregulated electricity market. Energy Policy, 39(7), 3922-3927.
93. Molly, J. P. (2012). Status der Windenergienutzung in Deutschland - Stand 31.12.2011. DEWI
GmbH. Presentation.
94. Munari, F. (2002). The effects of privatization on corporate R&D units: evidence from Italy and
France. R&D Management, 32(3), 223-232.
95. Munksgaard, J., & Morthorst, P. E. (2008). Wind power in the Danish liberalised power mar-
ket—Policy measures, price impact and investor incentives. Energy Policy, 36(10), 3940-3947.
96. Nagayama, H. (2007). Effects of regulatory reforms in the electricity supply industry on elec-
tricity prices in developing countries. Energy Policy, 35(6), 3440-3462.
97. Neij, L. (1999). Cost dynamics of wind power. Energy, 24(5), 375-389.
98. Neuhoff, K. (2005). Large-scale deployment of renewables for electricity generation. Oxford
Review of Economic Policy, 21(1), 88-110.
99. Ocaña, C., & Romero, A. (1998). A simulation of the Spanish electricity pool. CNSE, Madrid,
juin.
100. OECD (2003). Stability pact - South East Europe compact for reform, investment, integrity and
growth. Independent regulators in the South-East European countries.
101. Ornetzeder, M., & Rohracher, H. (2013). Of solar collectors, wind power, and car sharing:
Comparing and understanding successful cases of grassroots innovations. Global Environmen-
tal Change.
102. Palley, T. I. (2005). From Keynesianism to neoliberalism: Shifting paradigms in economics.
Pluto Press.
103. Peirce, C. S. (1877). The fixation of belief. Popular Science Monthly 12 (November 1877), 1-15.
From: http://bocc.ubi.pt/pag/peirce-charles-fixation-belief.html
104. Pitlik, H. (2007). A race to liberalization? Diffusion of economic policy reform among OECD-
economies. Public Choice, 132(1-2), 159-178.
105. Popper, K. R. (1959). The logic of scientific discovery. London: Hutchinson, 1.
106. Porter, M. E. (2000). Location, competition, and economic development: Local clusters in a
global economy. Economic development quarterly, 14(1), 15-34.
107. Potrafke, N. (2010). The growth of public health expenditures in OECD countries: do govern-
ment ideology and electoral motives matter?. Journal of Health Economics, 29(6), 797-810.

77
108. Ramesohl, S., Kristof, K., Fischedick, M., Thomas, S., & Irrek, W. (2002). Die technische Entwick-
lung auf den Strom-und Gasmärkten. Eine Kurzanalyse der Rolle und Entwicklungsperspekti-
ven neuer dezentraler Energietechnologien und der Wechselwirkungen zwischen technischem
Fortschritt und den Akteursstrukturen in den Strom-und Gasmärkten. Brief expert opinion for
the Monopolkommission. Wuppertal Institute for Climate, Environment and Energy.
109. Rip, A., & Kemp, R. (1998). Technological Change. In: Rayner S., Malone EL (editors). (pp. 327-
399). Battelle Press.
110. Schmitt, S., & Rammerstorfer, M. (2010). Ownership unbundling, investments and consumer
prices–A panel data analysis.
111. Schot, J. (1998). The usefulness of evolutionary models for explaining innovation. The case of
the Netherlands in the nineteenth century. History and Technology, an International Journal,
14(3), 173-200.
112. Schwab, K., & Porter, M. E. (2005). Global Competitiveness Report: 2004–2005. Growth.
113. Seelig, C. (1956). Albert Einstein: A documentary biography. Staples Press.
114. Shackley, S., & Green, K. (2007). A conceptual framework for exploring transitions to decar-
bonised energy systems in the United Kingdom. Energy, 32(3), 221-236.
115. Shadish, W. R., Cook, T. D., & Campbell, D. T. (2002). Experimental and quasi-experimental de-
signs for generalized causal inference. 2.
116. Smil, V. (2007). Energy. In: Berkshire Encyclopedia of World History, 646-654.
117. Smith, A., Stirling, A., & Berkhout, F. (2005). The governance of sustainable socio-technical
transitions. Research policy, 34(10), 1491-1510.
118. Sovacool, B. K. (2009). The intermittency of wind, solar, and renewable electricity generators:
Technical barrier or rhetorical excuse?. Utilities Policy, 17(3), 288-296.
119. Spiller, P. T. (2011). Basic economic principles of infrastructure liberalization: a transaction cost
perspective. In: International Handbook of Network Industries. Finger, M. and Künneke, R.
(eds), 2011, pp. 11-25.
120. Steiner, F. (2000). Regulation, industry structure, and performance in the electricity supply in-
dustry. Available at SSRN 223648.
121. Strbac, G. (2008). Demand side management: Benefits and challenges. Energy Policy, 36(12),
4419-4426.
122. Thorsen, D. E. (2009). The Neoliberal Challenge. Oslo University.
123. Verbong, G., & Geels, F. (2007). The ongoing energy transition: lessons from a socio-technical,
multi-level analysis of the Dutch electricity system (1960–2004). Energy Policy, 35(2), 1025-
1037.
124. Verbong, G. P., & Geels, F. W. (2010). Exploring sustainability transitions in the electricity sector
with socio-technical pathways. Technological Forecasting and Social Change, 77(8), 1214-
1221.
125. Vickers, J., & Yarrow, G. (1991). Economic perspectives on privatization. The Journal of Eco-
nomic Perspectives, 5(2), 111-132.
126. Weisstein, Eric W. (2012a). "Parametric Test." From MathWorld--A Wolfram Web Resource.
http://mathworld.wolfram.com/ParametricTest.html
127. Weisstein, Eric W. (2012b) "Skewness." From MathWorld--A Wolfram Web Resource.
http://mathworld.wolfram.com/Skewness.html
128. Weisstein, Eric W. (2012c). "Standard Deviation." From MathWorld--A Wolfram Web Resource.
http://mathworld.wolfram.com/StandardDeviation.html
129. Wüstenhagen, R., Wolsink, M., & Bürer, M. J. (2007). Social acceptance of renewable energy
innovation: An introduction to the concept. Energy policy, 35(5), 2683-2691.
130. Yuan, J., Xu, Y., & Hu, Z. (2012). Delivering power system transition in China. Energy Policy.
131. Zhang, Y., Parker, D., & Kirkpatrick, C. (2008). Electricity sector reform in developing countries:
an econometric assessment of the effects of privatization, competition and regulation. Journal
of Regulatory Economics, 33(2), 159-178.

78

79
Appendices
Appendix A – Empirical evidence in several studies on liberalisation
Study Scope Independent
variable
Dependent
variable
Effect/significance
(p = 0.05)
Steiner
(2000)
Electricity sector in 19
OECD countries from
1986 till 1996.
Unbundling G/T
Utilization rate
Industry price
RMD
+ (sign.)
–
– (sign.)
Privatisation
Utilization rate
Industry price
RMD
+
+ (sign.)
–
TPA
Utilization rate
Industry price
RMD
–
–
+
Wholesale Industry price – (sign.)
Time to Lib. Industry price + (sign.)
Time to Priv. Industry price +
Hattori and
Tsutsui
(2004)*
Electricity sector in 19
OECD countries from
1987 till 1999.
Unbundling TSO
Price
Price ratio
+ (sign.)
–
Privatisation
Price
Price ratio
– (sign.)
–
TPA/Retail
Price
Price ratio
– (sign.)
– (sign.)
Wholesale Price
Price ratio
+ (sign.)
–
Copenhagen
Economics
(2005)
Electricity sector in EU-
15 Members from 1993
till 2003.
Free choice
Price
Utilization rate
–
0
Unbundling TSO
Price
Utilization rate
– (sign.)
+
TPA-transmission
Price
Utilization rate
+ (sign.)
–
Ownership
Price
Utilization rate
–
+
Wholesale
Price
Utilization rate
+
+
Congestion mgmt. Price
Utilization rate
+
+
Zhang et al.
(2008)**
Electricity sector in 36
developing and transi-
tion countries from
1985 till 2003.
Regulation
Generation/cap
Capacity/cap
Labour productivity
Utilization rate
–
–
–
+
Competition
Generation/cap
Capacity/cap
Labour productivity
Utilization rate
–
–
–
+
Privatisation Generation/cap
Capacity/cap
Labour productivity
Utilization rate
–
+ (sign.)
+ (sign.)
+
Schmitt and
Rammerstorfer
(2010)***
Electricity sector in 16
European OECD coun-
tries from 1995 till
2007.
Unbundling TSO
Investment
Price
+ (sign.) / NA
–
Overall unbundling
Investment
Price
NA / – (sign.)
+
TPA
Investment
Price
+ / +
+
Wholesale
Investment
Price
+ / –
+
Threshold
Investment
Price
– / –
–
Public ownership Investment
Price
+ / +
– (sign.)
*Based on a fixed effects test excluding time to privatisation and time to liberalisation.
**Based on a simple model without combined effects.
***Basic model. Fixed effect with TSO unbundling/fixed effects with total unbundling.

80
Appendix B – Conversion routes for common electricity generation technologies
Summary of electricity production technologies starting with common energy source hydrogen (own analysis based on multiple non-scientific sources).
Technology Product Conversion Product Conversion Product Conversion Product Conversion Product Conversion Product Conversion Product Conversion Product Conversion Product Conversion Product
Gas - OCGT Hydrogen Fusion Solar
radiation
Photo-
synthesis Organic
Anaerobic
digestion Gas → → → → Burning
Exhaust
flow Turbine Rotation Generator → → AC
Gas - CCGT Hydrogen Fusion Solar
radiation
Photo-
synthesis Organic
Anaerobic
digestion Gas → → → → Burning
Exhaust
flow Turbine Rotation Generator → → AC
↓
↙ ← ← ↙
↓
Exhaust
flow Heating Steam flow Turbine Rotation Generator → → AC
Oil - ICDE Hydrogen Fusion Solar
radiation
Photo-
synthesis Organic
Anaerobic
digestion Oil → → → → Burning
Exhaust
flow
Piston en-
gine Rotation Generator → → AC
Oil - CCOT Hydrogen Fusion Solar
radiation
Photo-
synthesis Organic
Anaerobic
digestion Oil → → Burning
Exhaust
flow Heating
Exhaust
flow Turbine Rotation Generator → → AC
Coal - PCC Hydrogen Fusion Solar
radiation
Photo-
synthesis Organic
Anaerobic
digestion Coal Pulverize Pulver Burning
Exhaust
flow Heating
Exhaust
flow Turbine Rotation Generator → → AC
Coal - CFBC Hydrogen Fusion Solar
radiation
Photo-
synthesis Organic
Anaerobic
digestion Coal Fluidize** Mixture Burning
Exhaust
flow Heating
Exhaust
flow Turbine Rotation Generator → → AC
Nuclear Hydrogen Explosion* → → → → U-238/235 Enrich U-238/235 Fission Radiation Heating Steam flow Turbine Rotation Generator → → AC
Hydro Hydrogen Fusion Solar
radiation → → → → → → → → Heating Water flow Turbine Rotation Generator → → AC
Wind Hydrogen Fusion Solar
radiation → → → → → → → → Heating Air flow Turbine Rotation Generator → → AC
Solar PV Hydrogen Fusion Solar
radiation → → → → → → → → → → → →
Photo-
voltaic DC Converter AC
*In supernova‘s. **The CFBC uses air flow to circulate a suspension of coal and bed material through the furnace for higher efficiency.
Note: dotted lines indicate borders of electricity generation plants.

81
Appendix C – Comparative performance of wind energy
Economic competitiveness: wind versus conventional
Additional production cost per unit of electricity (%)
Siting problems: wind versus conventional
Additional problems per unit of electricity (thousands %)
Environmental pollution: wind versus conventional
Additional CO2 eq. per unit of electricity (%)
Investment risk: wind versus conventional
Additional risk (%)
-50%
0%
50%
100%
150%
200%
Gas
-OC
GT
Gas
-CC
GT
Oil-
ICD
E
Oil-
CC
OT
Co
al-P
CC
Co
al-C
FBC
Nu
clea
r
Hyd
ro la
rge
Hyd
ro s
mal
l
Wind onshore Wind offshore
0%
50%
100%
150%
200%
250%
300%
Gas
-OC
GT
Gas
-CC
GT
Oil-
ICD
E
Oil-
CC
OT
Co
al-P
CC
Co
al-C
FBC
Nu
clea
r
Hyd
ro la
rge
Hyd
ro s
mal
l
-150%
-100%
-50%
0%
50%
100%
150%
Gas
-OC
GT
Gas
-CC
GT
Oil-
ICD
E
Oil-
CC
OT
Co
al-P
CC
Co
al-C
FBC
Nu
clea
r
Hyd
ro la
rge
Hyd
ro s
mal
l
-150%
0%
150%
300%
450%
600%
750%
Gas
-OC
GT
Gas
-CC
GT
Oil-
ICD
E
Oil-
CC
OT
Co
al-P
CC
Co
al-C
FBC
Nu
clea
r
Hyd
ro la
rge
Hyd
ro s
mal
l

82
Appendix D – Survey questions and answer options
Questions of the OECD survey on electricity regulation (Conway and Nicoletti, 2006).
Question Answer options
How are the terms and
conditions of third party
access (TPA) to the elec-
tricity transmission grid
determined?
Regulated TPA Negotiated TPA No TPA
Is there a liberalised
wholesale market for elec-
tricity (a wholesale pool)?
Yes No
What is the minimum
consumption threshold
that consumers must ex-
ceed in order to be able
to choose their electricity
supplier ?
No
threshold
<250
gigawatts
250-500
gigawatts
500-1.000
gigawatts
> 1.000
gigawatts
No
consumer
choice
What is the ownership
structure of the largest
companies in the genera-
tion, transmission, distri-
bution, and supply seg-
ments of the electricity
industry?
Private Mostly
Private
Mixed Mostly
Public
Public
What is the degree of ver-
tical separation between
the transmission and gen-
eration segments of the
electricity industry?
Separate
Companies
Accounting
separation
Integrated
What is the overall degree
of vertical integration in
the electricity industry?
Unbundled Mixed Integrated