Li xLa Zr Mo O x Polymorph via Substitution of Zr by Mo Crystal Chemistry, and Electrochemical...
10
Synthesis, Crystal Chemistry, and Electrochemical Properties of Li 7−2x La 3 Zr 2−x Mo x O 12 (x = 0.1−0.4): Stabilization of the Cubic Garnet Polymorph via Substitution of Zr 4+ by Mo 6+ Daniel Rettenwander,* ,† Andreas Welzl, ‡ Lei Cheng, §,∥ Jü rgen Fleig, ‡ Maurizio Musso, † Emmanuelle Suard, ⊥ Marca M. Doeff, § Gü nther J. Redhammer, † and Georg Amthauer † † Department of Materials Research and Physics, University of Salzburg, 5020 Salzburg, Austria ‡ Institute for Chemical Technologies and Analytics, Vienna University of Technology, 1060 Vienna, Austria § Lawrence Berkeley National Laboratory, Environmental Energy Technologies Division, University of California, Berkeley, California 94720, United States ∥ Department of Materials Science and Engineering, University of California, Berkeley, 94720, United States ⊥ Diffraction Group, Institut Laue-Langevin (ILL), 71 avenue des Martyrs, 38000 Grenoble, France * S Supporting Information ABSTRACT: Cubic Li 7 La 3 Zr 2 O 12 (LLZO) garnets are exceptionally well suited to be used as solid electrolytes or protecting layers in “Beyond Li- ion Battery” concepts. Unfortunately, cubic LLZO is not stable at room temperature (RT) and has to be stabilized by supervalent dopants. In this study we demonstrate a new possibility to stabilize the cubic phase at RT via substitution of Zr 4+ by Mo 6+ . A Mo 6+ content of 0.25 per formula unit (pfu) stabilizes the cubic LLZO phase, and the solubility limit is about 0.3 Mo 6+ pfu. Based on the results of neutron powder diffraction and Raman spectroscopy, Mo 6+ is located at the octahedrally coordinated 16a site of the cubic garnet structure (space group Ia-3d). Since Mo 6+ has a smaller ionic radius compared to Zr 4+ the lattice parameter a 0 decreases almost linearly as a function of the Mo 6+ content. The highest bulk Li-ion conductivity is found for the 0.25 pfu composition, with a typical RT value of 3.4 × 10 −4 S cm −1 . An additional significant resistive contribution originating from the sample interior (most probably from grain boundaries) could be identified in impedance spectra. The latter strongly depends on the prehistory and increases significantly after annealing at 700 °C in ambient air. Cyclic voltammetry experiments on cells containing Mo 6+ substituted LLZO indicate that the material is stable up to 6 V. 1. INTRODUCTION Li 7 La 3 Zr 2 O 12 garnet (LLZO) and its variants are exceptionally well suited for use as electrolytes in “Beyond Li-ion Battery” concepts that employ Li-metal anodes and high voltage cathode materials to enable cells with high energy and power densities. LLZO crystallizes either with tetragonal (I4 1 /acd) or cubic (Ia- 3d) symmetry (see Figure 1). 1,2 From the thermodynamic point of view, tetragonal LLZO, which shows a total Li-ion conductivity (reciprocal of the sum of the bulk and grain boundary resistance, for resistive grain boundaries only) that is approximately 2 orders of magnitude lower (<10 −6 S cm −1 ) than that of the cubic modification (10 −4 to 10 −3 S cm −1 ), is the more stable polymorph at room temperature (RT). 3 For- tunately, the cubic phase can be stabilized at RT by supervalent partial substitution of Li + , La 3+ , or Zr 4+ . However, the substituents that induce this phase transition may strongly influence the Li-ion diffusivity and therefore the Li-ion conductivity. Much effort has been undertaken to understand these effects. Allen et al. investigated Li 6.75 La 3 Zr 1.75 Ta 0.25 O 12 (LLZTO) garnets substituted with Al or Ga and compared them to the parent compound. LLZTO had Li-ion conductivity that was twice as high (8.7 × 10 −4 S cm −1 ) as garnets substituted with Al 3+ (3.7 × 10 −4 S cm −1 ) or Ga 3+ (4.1 × 10 −4 S cm −1 ). They argued that the substituents located at the 24d and/or 96h sites of the Li-ion sublattice possibly had a blocking effect on diffusion in the garnet structure. 4 Recently several of us evaluated this assumption by studying the Li-ion diffusivity of Li 7−3x Ga x‑y Al y La 3 Zr 2 O 12 samples as a function of the site occupancy behavior of Al 3+ and Ga 3+ . 5 It was shown that Ga 3+ as well as Al 3+ occupies both the 24d and 96h sites, but the blocking effect on Li-ion conductivity seemed to be much weaker than the influence of the unit-cell parameter a 0 . Nevertheless, there is some interference with Li- ion diffusivity when the Li + sites are occupied with multivalent ions, as shown recently. 6 Therefore, effort is now being redirected toward finding suitable supervalent ions replacing La 3+ or Zr 4+ instead of Li + . Here, we present the possibility of Received: August 20, 2015 Published: October 9, 2015 Article pubs.acs.org/IC © 2015 American Chemical Society 10440 DOI: 10.1021/acs.inorgchem.5b01895 Inorg. Chem. 2015, 54, 10440−10449
Transcript of Li xLa Zr Mo O x Polymorph via Substitution of Zr by Mo Crystal Chemistry, and Electrochemical...
Synthesis, Crystal Chemistry, and Electrochemical Properties ofLi7−2xLa3Zr2−xMoxO12 (x = 0.1−0.4): Stabilization of the Cubic GarnetPolymorph via Substitution of Zr4+ by Mo6+
Daniel Rettenwander,*,† Andreas Welzl,‡ Lei Cheng,§,∥ Jurgen Fleig,‡ Maurizio Musso,†
Emmanuelle Suard,⊥ Marca M. Doeff,§ Gunther J. Redhammer,† and Georg Amthauer†
†Department of Materials Research and Physics, University of Salzburg, 5020 Salzburg, Austria‡Institute for Chemical Technologies and Analytics, Vienna University of Technology, 1060 Vienna, Austria§Lawrence Berkeley National Laboratory, Environmental Energy Technologies Division, University of California, Berkeley, California94720, United States∥Department of Materials Science and Engineering, University of California, Berkeley, 94720, United States⊥Diffraction Group, Institut Laue-Langevin (ILL), 71 avenue des Martyrs, 38000 Grenoble, France
*S Supporting Information
ABSTRACT: Cubic Li7La3Zr2O12 (LLZO) garnets are exceptionally wellsuited to be used as solid electrolytes or protecting layers in “Beyond Li-ion Battery” concepts. Unfortunately, cubic LLZO is not stable at roomtemperature (RT) and has to be stabilized by supervalent dopants. In thisstudy we demonstrate a new possibility to stabilize the cubic phase at RTvia substitution of Zr4+ by Mo6+. A Mo6+ content of 0.25 per formula unit(pfu) stabilizes the cubic LLZO phase, and the solubility limit is about 0.3Mo6+ pfu. Based on the results of neutron powder diffraction and Ramanspectroscopy, Mo6+ is located at the octahedrally coordinated 16a site ofthe cubic garnet structure (space group Ia-3d). Since Mo6+ has a smallerionic radius compared to Zr4+ the lattice parameter a0 decreases almostlinearly as a function of the Mo6+ content. The highest bulk Li-ion conductivity is found for the 0.25 pfu composition, with atypical RT value of 3.4 × 10⁻⁴ S cm−1. An additional significant resistive contribution originating from the sample interior (mostprobably from grain boundaries) could be identified in impedance spectra. The latter strongly depends on the prehistory andincreases significantly after annealing at 700 °C in ambient air. Cyclic voltammetry experiments on cells containing Mo6+
substituted LLZO indicate that the material is stable up to 6 V.
1. INTRODUCTION
Li7La3Zr2O12 garnet (LLZO) and its variants are exceptionallywell suited for use as electrolytes in “Beyond Li-ion Battery”concepts that employ Li-metal anodes and high voltage cathodematerials to enable cells with high energy and power densities.LLZO crystallizes either with tetragonal (I41/acd) or cubic (Ia-3d) symmetry (see Figure 1).1,2 From the thermodynamicpoint of view, tetragonal LLZO, which shows a total Li-ionconductivity (reciprocal of the sum of the bulk and grainboundary resistance, for resistive grain boundaries only) that isapproximately 2 orders of magnitude lower (<10−6 S cm−1)than that of the cubic modification (10−4 to 10−3 S cm−1), is themore stable polymorph at room temperature (RT).3 For-tunately, the cubic phase can be stabilized at RT by supervalentpartial substitution of Li+, La3+, or Zr4+. However, thesubstituents that induce this phase transition may stronglyinfluence the Li-ion diffusivity and therefore the Li-ionconductivity. Much effort has been undertaken to understandthese effects. Allen et al. investigated Li6.75La3Zr1.75Ta0.25O12
(LLZTO) garnets substituted with Al or Ga and compared
them to the parent compound. LLZTO had Li-ion conductivitythat was twice as high (8.7 × 10⁻⁴ S cm−1) as garnetssubstituted with Al3+ (3.7 × 10⁻⁴ S cm−1) or Ga3+ (4.1 × 10⁻⁴ Scm−1). They argued that the substituents located at the 24dand/or 96h sites of the Li-ion sublattice possibly had a blockingeffect on diffusion in the garnet structure.4 Recently several ofus evaluated this assumption by studying the Li-ion diffusivityof Li7−3xGax‑yAlyLa3Zr2O12 samples as a function of the siteoccupancy behavior of Al3+ and Ga3+.5
It was shown that Ga3+ as well as Al3+ occupies both the 24dand 96h sites, but the blocking effect on Li-ion conductivityseemed to be much weaker than the influence of the unit-cellparameter a0. Nevertheless, there is some interference with Li-ion diffusivity when the Li+ sites are occupied with multivalentions, as shown recently.6 Therefore, effort is now beingredirected toward finding suitable supervalent ions replacingLa3+ or Zr4+ instead of Li+. Here, we present the possibility of
Received: August 20, 2015Published: October 9, 2015
Article
pubs.acs.org/IC
© 2015 American Chemical Society 10440 DOI: 10.1021/acs.inorgchem.5b01895Inorg. Chem. 2015, 54, 10440−10449

stabilizing the cubic LLZO polymorph through the partialsubstitution of Zr4+ by Mo6+. Li7−2xLa3Zr2−xMo6+xO12 garnets(abbreviated Zr2−xMox) with x = 0.10−0.40 were synthesizedby using solid state sintering methods. The samples werecarefully characterized in terms of crystal chemistry, morphol-ogy, and electrochemical properties (e.g., Li-ion conductivity,interfacial resistivity versus Li-metal electrodes, and the voltagestability window) by means of X-ray powder diffraction(XRPD), neutron powder diffraction (NPD), scanning electronspectroscopy (SEM), Raman spectroscopy, electrochemicalimpedance spectroscopy (EIS), and cyclic voltammetry (CV).
2. EXPERIMENTAL SECTION2.1. Synthesis. The synthesis of Li7−2xLa3Zr2−xMo6+xO12 garnets
with x = 0.10−0.40 was performed by high-temperature sintering. Thestarting materials were Li2CO3 (99%, Merck), La2O3 (99.99%,Aldrich), ZrO2 (99.0%, Aldrich), and MoO3 (99.98%, Aldrich).Li2CO3 was mixed with the various oxides in the desired proportionsand intimately ground together using a hand mortar, a pestle, andisopropyl alcohol. These mixtures were uniaxially pressed to a pellet,calcined at 850 °C for 4 h with a heating rate of 5 °C/min, and thencooled in the furnace to approximately 200 °C. Samples mixed withisopropyl alcohol were milled in a Fritsch Pulverisette 7 ball mill for 2h (12 times 800 rpm for 5 min + 5 min break). Finally, powders wereisostatically pressed (24 kbar) to form pellets and sintered at 1230 °Cfor 4 h, with a heating rate of 20.5 °C/min, and afterward cooled toRT.2.2. XRPD. XRPD measurements were performed using a Bruker
D8 Advance DaVinci Design diffractometer (Lynxeye solid statedetector) with Cu Kα radiation. This was done in order to characterizethe synthetic products and to identify all phases present, includingdetermination of the symmetry and unit-cell dimension of the garnets.Data were collected between 10° and 140° 2θ. The lattice parametera0 was determined by using an internal standard (Si with a0 = 5.43088Å) and performing Rietveld refinement with the program Topas V4.2(Bruker AXS).2.3. NPD. The neutron diffraction experiment was done at the
Institut Laue-Langevin, ILL, in Grenoble (France). Powder diffractiondata were acquired in constant wavelength mode (λ = 1.594 Å) usingthe D2B diffractometer on an 8.5 g batch contained in a 14 mmdiameter vanadium sample can at 25 °C. Experiments were performedin the range 5.8° ≤ 2θ ≤ 159.7°, step width 0.04°. Data treatment andrefinement was done using the FULLPROF-suite of programs7 withthe pseudo-Voigt peak shape function. Due to the significantabsorption of neutron radiation by Li an absorption correction wasapplied. The atomic displacement parameters were modeled in theisotropic form, except for the oxygen atom; any refinement with
anisotropic displacement parameters of the other sites led to non-positive definite atomic displacement parameters and high correlationswith the occupation numbers, thus unphysical data.
2.4. SEM. SEM analysis was made using a ZEISS Ultra Plus device.Small polycrystalline chips, taken from the larger pellets, wereembedded in an epoxy holder, and the surface was ground and thenpolished using diamond paste. For the analysis, special attention waspaid with regard to extra phases, grain sizes, grain boundaries, andtextures using a backscattered electron detector (BSE). Energydispersive spectroscopy (EDS) measurements were undertaken tomeasure the atomic ratios of La, Zr, and Mo to determine qualitativelythe upper incorporation limit of Mo in LLZO.
2.5. RAMAN. RAMAN spectra were recorded at RT in the spectralrange of 50−3500 cm−1 using a Thermo DXR Raman microscope witha 10 mW internal laser light source with excitation wavelength at 780nm.
2.6. EIS. EIS measurements were carried out to investigate the Li-ion conductivity. Pt thin films were used as electrodes and were sputterdeposited with a thickness of 200 nm on top of ca. 10 nm Ti, whichimproved the adhesion between the sample and the electrode. For theEIS measurements, a Novocontrol Alpha analyzer was used in thefrequency range of 3 × 106101 Hz. A Julabo F-25 HE circulator wasemployed for cooling and heating the samples under investigation. Settemperatures between −12 and 25 °C (with some measurements at 40°C) were used, leading to true sample temperatures from ca. −8 to 36°C. In the following, true sample temperatures, measured by athermocouple, are indicated in all diagrams. An additional impedancespectrum was taken for a Li/garnet/Li sample at RT in an Ar glovebox.For this, metallic lithium was first applied on the surfaces of a pelletand the pellet was sandwiched with two lithium foil disks in aSwagelok type cell (see ref 18).
2.7. CV. CV measurements were performed using a Li/garnet/Auconfiguration to assess the electrochemical window of garnet pellets.The Au blocking electrode was sputtered on one surface of the garnetpellet, and the reversible Li electrode was applied on the other side ofthe pellet. Ni foam was used as current collectors. The measurementwas carried out inside an Ar glovebox. The cell was scanned at a rate of2 mV/min in the potential range from −0.5 to 6 V vs Li/Li+.
3. RESULTS AND DISCUSSION
3.1. Phase Composition of the Solid Solutions Studiedby XRPD. The dense pellets obtained after the final sinteringstep were slightly yellowish in color, and after grinding thepowder showed a white color. The XRPD patterns of Zr2−xMoxgarnets with x = 0.100.40 are shown in Figure 2 togetherwith reference XRPD patterns for cubic and tetragonalstructures.1,2
Sample Zr1.90Mo0.10 exhibits reflections indicating that bothcubic (∼75%) and tetragonal (∼25%) garnets are present. Byincreasing the amount of Mo6+ to 0.20 pfu the amount of thecubic phase increased (∼83%) whereas the tetragonal phasedecreased (∼17%). With a Mo6+ content of 0.25 pfu no phasesother than cubic LLZO were found in the synthetic product.When the Mo6+ content was 0.3 pfu and above, a mixture ofextra phases (Zr1.70Mo0.30: La2Zr2O7, La2O3, LiLa(MoO4)2,Li4MoO5; Zr1.60Mo0.40: La2Zr2O7, La2O3, LiLa(MoO4)2,Li4MoO5) appeared in addition to the cubic LLZO in theproduct and increased as the Mo6+ content rose.
3.2. Morphology and Phases as Studied by SEMMethods. BSE photos of polycrystalline chips of the samplesare shown in Figure 3.The sample Zr1.90Mo0.10 has large porous and poorly
connected grains with diameters of about 100 μm. With aMo6+ content of 0.2 pfu, the grain size decreased to about 50μm. Compared to Zr1.90Mo0.10, the sample seemed to be denser,and grains were better connected to each other. Sample
Figure 1. Crystal structure of cubic LLZO (Ia-3d). Blue dodecahedra(24c) are occupied by La3+, green octahedra (16a) by Zr4+. Li+ aredistributed over three sites, viz., tetrahedrally coordinated (24d) sitesrepresented by red spheres, octahedrally coordinated (48g) sitesrepresented by yellow spheres, and distorted 4-fold coordinated (96h)sites represented by orange spheres.
Inorganic Chemistry Article
DOI: 10.1021/acs.inorgchem.5b01895Inorg. Chem. 2015, 54, 10440−10449
10441

Zr1.75Mo0.25 showed a significant increase of the grain sizes (inthe range of 200 μm), which may be related to the overallstabilization of the cubic phase. The samples showed lessporosity, but there were still large voids between grains. With aMo6+ content of ≥0.3 pfu, smaller grains (50−100 μm) werefound and extra phases occurred (see Figures 2 and 3). The
density decreased and the porosity within the grains increasedwith higher Mo6+ and impurity content. The qualitativechemical analyses on the polished cross sections of severalgrains using EDS are consistent with the substitution of Zr4+ byMo6+ and an upper incorporation limit close to 0.3 Mo pfu(e.g., Zr1.70Mo0.30 ≈ La3.00Zr1.70Mo0.28 and Zr1.60Mo0.40 ≈La2.94Zr1.77Mo0.30).
3.3. Unit-Cell Parameter of LLZO as a Function of theMo6+ Content as Studied by Diffraction Methods. Theunit-cell parameters of the cubic LLZO phases, a0, as a functionof the amount of Mo6+ in LLZO are shown in Figure 4.
There is a decrease in a0 with increasing Mo6+ content withan almost linear relationship between x = 0.20 and 0.30. Thedecrease of a0 can be related to (i) the smaller ionic radius ofMo6+ (rVI = 0.60 Å) compared to Zr4+ (rVI = 0.72 Å)8 and/or(ii) the reduction of the Li+ content (Mo6+ ↔ Zr4+ + 2Li+).The unit-cell parameters are on the average around 12.964 Å,which has recently been proposed to be the optimum for highionic conductivities.9 Because the unit-cell parameter remainedunchanged at a Mo6+ content of 0.4 pfu, we assume an upperincorporation limit of about 0.3 Mo6+ pfu, which is inagreement with the EDS results (see section 3.2 above).
3.4. Site Occupation Behavior in LLZO: Long-RangeProperties as Studied by NPD. As shown by XRPD andSEM (see section 3.2 and section 3.3 above) the Zr1.75Mo0.25 isthe only composition that is composed of cubic polymorphonly and was therefore used for the NPD study. The Rietveldrefinement results of the NPD pattern shown in Figure 5 andgiven in Table 1 give strong evidence that Mo6+ mainlysubstitutes Zr4+ at the octahedral 16a site, yielding 0.256(21)Mo6+ pfu, a value which perfectly matches the nominalstoichiometry; tests with Mo6+ on the La3+ site gave negativeoccupation numbers, excluding this site for substitution. In afirst model of cationic distribution, the tetrahedral 24d site isexclusively occupied by Li+, thereby giving an approximatelyhalf filled occupation, the remaining being empty, while theinterstitial octahedral coordinated 96h position hosts about4.34(2) Li+ pfu. It might be noted, however, that, with thismodel, the Rietveld refinements yield a formula that is notbalanced in charge but has a deficit of about 0.63 positivecharges, probably as Li+ content. Allowing anisotropic refine-ment of all atoms, by using non-positive definite displacementparameters, did not significantly change the occupationnumbers on 16a and 24d sites, but increased that of the 96hsite to 0.42(4), distinctly reducing the deficit in positive charge.It is assumed that the isotropic handling of atoms fails to
Figure 2. XRPD pattern of Li7−2xLa3Zr2−xMoxO12, with x = 0.100.40. The tetragonal and the cubic diffraction pattern of LLZO areshown for comparison.
Figure 3. BSE images of the polished embedded pellets ofLi7−2xLa3Zr2−xMoxO12, with x = 0.10.4.
Figure 4. Lattice parameter of the cubic LLZO phase, ao, versus thenominal Mo content (x = 0.10.4) in Li7−2xLa3Zr2−xMoxO12.
Inorganic Chemistry Article
DOI: 10.1021/acs.inorgchem.5b01895Inorg. Chem. 2015, 54, 10440−10449
10442

describe the strong anisotropy, especially of the Li2 site, thusgiving Li+ contents on Li2 that are too low.A second model of cationic substitution assumes small
amounts of Mo6+ also on the tetrahedral 24d sites. As Li+ has anegative scattering length (Mo has a positive one), it is alsopossible to put Mo6+ on the tetrahedral site and obtaincomparably good refinements. However, this gives an unrealisti-cally high Mo6+ of 0.7 pfu and Li contents that are too low,when a full occupation of the tetrahedral site is assumed. It ispossible to find a reasonable, charge balanced cationicdistribution, by manipulating the Mo6+ content at 24d byhand, which gives a plausible cationic distribution. This is thecase when 0.048 formula units Mo6+ are placed on thetetrahedral sites, giving a refined Li content of 1.68 pfu at 24dand 4.37(2) Li+ on 96h, i.e., almost identical values. However,the cationic distribution at the 16a site also slightly changes,giving 0.304(23) Mo6+ pfu. The total of 0.35 Mo6+ pfu isdistinctly higher than the nominal stoichiometry. All in all weprefer refinement model 1 (see Table 1), as it gives the morerealistic Mo6+ content. The models are different in siteoccupancies only; atomic coordinates and isotropic/anisotropicdisplacement parameters do not change.3.5. Site Occupation Behavior in LLZO: Short-Range
Properties as Studied by Raman Spectroscopy. Addi-
tional evidence for the above chosen model 1 can be obtainedby Raman spectroscopy. The Raman spectra shown in Figure 6were collected for each sample to determine cubic andtetragonal phase contributions in each product as well as thesite preference of Mo6+ in the garnet oxygen framework.
Because of overlapping features in the Raman spectra ofprobably undetected small amounts of luminescing extraphases, the spectra were baseline corrected and analyzed forqualitative analysis only. A Raman spectroscopy study of LLZOhas been reported by Tietz et al.10 The partial substitution ofZr4+ with Ta5+ was investigated later on by Thompson et al.10
They proposed that the band near 650 cm−1 was related to thestretching of the ZrO6 octahedra. When Ta5+ was added to thesystem, an additional band near 750 cm−1 appeared andincreased in intensity with higher amounts of Ta5+.10 Becausebands near 750 cm−1 seem to correspond to stretching of anoctahedron other than ZrO6, the analogous band in our spectrawas assigned to a MoO6 octahedron. This gives additionalevidence for the site occupancy of Mo6+ at the octahedral 16asite in the oxygen garnet framework. Because Ramanspectroscopy can be used to distinguish cubic and tetragonalLLZO phases, the method can also be used to check phasecomposition. Tietz et al. showed that the bands near 110 cm−1
are most diagnostic of this.10 The reduction of symmetry fromcubic to tetragonal is shown by a splitting of the vibrationalmodes. In our samples, this feature is not well resolved becauseof the broad line shape. Nevertheless, it appears that the lineshape of those modes at about 110 cm−1 converge withincreasing Mo6+ content. This is similar to the observationsmade by Thompson et al. for Li7−xLa3Zr2−xTaxO12 garnets withincreasing amount of Ta5+ up to 0.25 Ta5+ pfu. Above this, theyfound a superposition of the cubic as well as tetragonal phase inthe products. The Raman spectrum of the product with a Mo6+
content of 0.25 in this study looks almost identical to thespectrum reported for single phase cubic Li6.5La3Zr1.5Ta0.5O12.
11
The substitution of Zr4+ by 0.5 Ta5+ or by 0.25 Mo6+ pfu leads
Figure 5. Observed (obs), calculated (calc), and difference patterns(obs-calc) for the Rietveld refinement from neutron powder diffractionof nominal Li6.50La3Zr1.75xMo0.25O12.The short vertical lines below theprofiles mark the peak positions of all possible Bragg reflections ofcubic LLZO (black) and an unknown Li-containing extra phase, whichremain undetected by other analytical methods (red); (inset) crystalstructure of cubic LLZO (Ia-3d) based on the results of Rietveldrefinement given in Table 1.
Table 1. Neutron Powder Diffraction Data ofLi7−2xLa3Zr2−xMo6+xO12 Determined through RietveldRefinementa
site x/a, y/b, z/c Uisob occc
Li1 24d 0, 3/4, 5/8 3.0(5)d 0.50(2)Li2 96h 0.0996(1), 0.6829(1), 0.5834(1) 4.2(5) 0.362(1)La 24c 0, 1/4, 1/8 1.54(5) 1.0000Zr 16a 0, 0, 0 1.71(5) 0.87138Mo 16a 0, 0, 0 1.71(5) 0.12864O 96h −0.03125(1), 0.05443(1), 0.1489(1) 2.18(9) 1.0000
aSpace group: Ia-3d (No. 230) and Z = 8. Lattice parameter: a = b = c= 12.9556(2).R-factors: R = 2.6685, χ2 = 1.9451, RI = 4.1824. b×100[Å2]. cOccupation factor. dConstraint on isotropic atomic displace-ment: Uiso(Zr) = Uiso(Mo).
Figure 6. Baseline corrected Raman spectra, obtained with laserexcitation at 780 nm, of Li7−2xLa3Zr2−xMoxO12, with x = 0.10.3, andtetragonal LLZO for comparison. The uncorrected spectra are shownin the inset. The spectra are normalized to the Raman band marked bya star. The bands at about 110 cm−1 are used to distinguish betweenthe cubic and the tetragonal polymorph. In the range between 600 and800 cm−1 two t2g bands are observable which correspond mostprobably to Zr4+ and Mo6+ in LLZO occupying the 6-fold coordinated16a site in space group Ia-3d.
Inorganic Chemistry Article
DOI: 10.1021/acs.inorgchem.5b01895Inorg. Chem. 2015, 54, 10440−10449
10443

to a decrease in the Li+ content to about 6.5 pfu, which alsoseems to be necessary to stabilize the cubic garnet phase.3.5.1. Investigating the Li-Ion Conduction in Mo6+ Doped
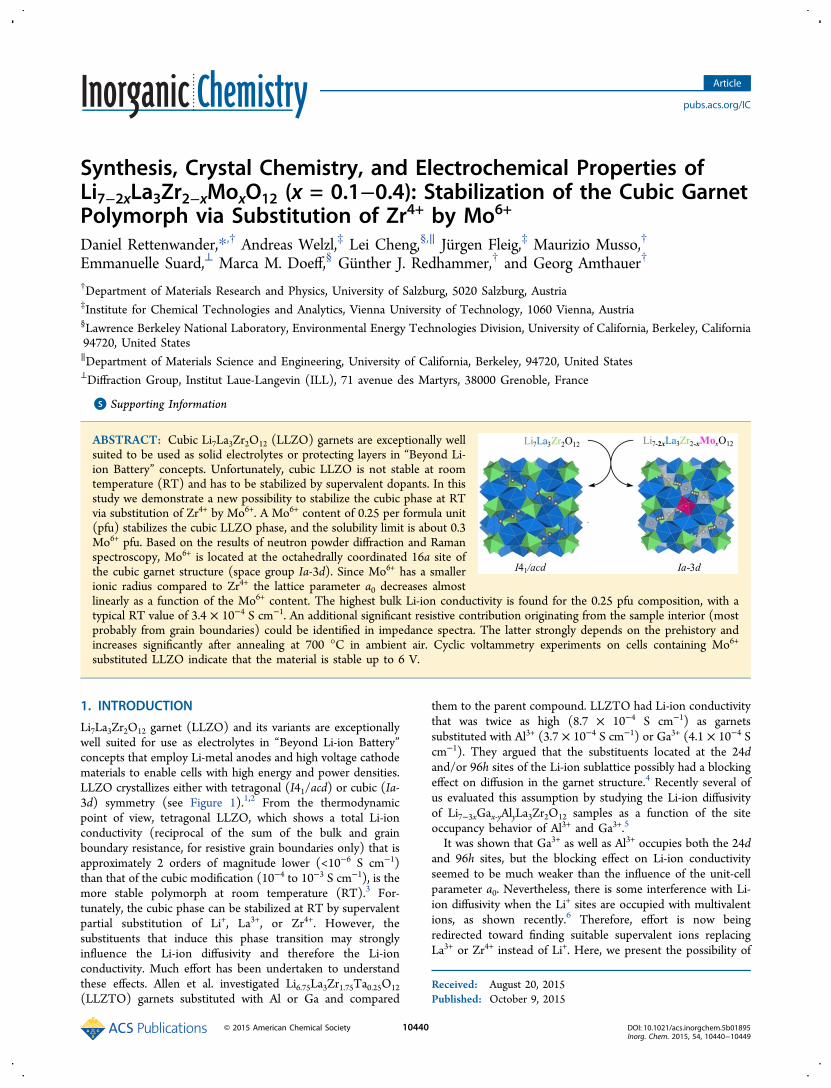
LLZO by Means of Impedance Spectroscopy. Impedancespectra were measured for as-prepared samples of allcompositions at different temperatures. Figure 7 displays the
relevant data, measured at RT = 23.5 °C (a) and lowesttemperature (b), including magnifications of the high frequencyparts. Common to all samples is the existence of a more or lesscomplete high frequency semicircle at low temperatures. Forsome samples, this is followed by a depressed intermediatefrequency arc. Again common to all samples is a strong increaseof the imaginary part of the impedance toward low frequencies,with an almost constant angle in the complex impedance plane,partly resembling the onset of a large depressed arc. The lowfrequency impedance feature depends on the electrode material(see also below) and can be attributed to electrode effects. In a
certain frequency range it can be described by a resistor inparallel to a constant phase element (CPE) with impedance
ω=Z Q1/(i )nCPE (1)
where ω is the angular frequency and Q and n are fitparameters. This electrode equivalent circuit helps with analysisof the sample-specific high frequency features but does notimply any mechanistic information. A discussion of the exactelectrode reaction mechanisms causing this feature (diffusion orcharge transfer processes etc.) is beyond the scope of thispaper.The high frequency arc is attributed to the bulk Li-ion
conduction (σbulk) of the LLZO samples; see also the discussionof capacitances below. For a proper fit analysis of the σbulk andpermittivity (ε1), another resistor (R1) in parallel to a constantphase element (CPE1) was used.Capacitances were then calculated from fit parameters Q1
and n1 according to ref 12:
= −C R Q( )n n1 1
11
1/1 1 (2)
Particularly for samples with low bulk resistances (R1), theunavoidable inductance (L) due to wiring significantly affectsthe data and has to be added to the equivalent circuit. Finally, aproper description of the partial intermediate frequency featureis necessary to obtain a reliable fit of the spectra and thus of theσbulk. As required, e.g., for Zr1.75Mo0.25, Zr1.70Mo0.30, andZr1.60Mo0.40, this feature was again approximated by a resistorin parallel to a constant phase element. A mechanisticdiscussion of this second (i.e., intermediate frequency) arc isgiven below. The resulting equivalent circuit is shown in Figure8 and fits all measurement data acceptably well; fit examples areshown in Figures 7, 8, and 9.
3.5.2. Objections to the Impedance Data Analysis. Twopossible objections to such a data analysis are considered: First,one may question the appropriateness of a R-CPE element fordescribing partly almost horizontal line in the intermediatefrequency range. Here, an additional phenomenon comes intoplay. After annealing the samples at 700 °C for a few minutes
Figure 7. Impedance spectra of as-prepared LLZO samples withdifferent Mo doping concentration measured at RT (a) and at thelowest temperature (ca. −6 °C, a,b). For both temperatures, differentmagnifications are shown and solid fit lines (equivalent circuit modelin Figure 8) are included. Data reflects resistivity, ρ (normalized to thesample area and thickness).
Figure 8. Equivalent circuit used to fit all spectra. Markers indicatefrequencies of experimental data. In some cases R2, CPE2 was notrequired.
Inorganic Chemistry Article
DOI: 10.1021/acs.inorgchem.5b01895Inorg. Chem. 2015, 54, 10440−10449
10444

(without the deposited electrode) to remove Li2CO3depositions and H incorporation formed by degradation/aging processes, the high frequency bulk arc is only slightlychanged, while the intermediate frequency feature becomesmore pronounced and larger (Figure 9). Moreover, the secondarc becomes measurable for all samples, irrespective of whetherit was already visible before annealing (compare Figure 7 andFigure S1). For annealed samples, the circuit in Figure 8describes the data very well, supporting the approach ofapplying this model to spectra obtained on as-preparedsamples. However, particularly for Zr1.70Mo0.30 before annealingand Zr1.90Mo0.10 after annealing, the model is at its limits: nvalues of the constant phase element CPE2 drop below 0.55,and thus also a proper quantification of the bulk arc becomessomewhat questionable. This is most probably the reasonbehind the significant scattering of conductivity data found for afew samples (see below).Second, it is obvious that, for some samples, the onset of a
separate bulk arc is out of the measured frequency range at thehighest temperatures. The influence of the bulk arc on thespectrum is still apparent, but it is hidden in the spur; theminimum of the imaginary part is presumed to appear at higherfrequencies than can be measured in these experiments. Thisraises the question of whether reliable bulk conductivity canstill be obtained.To further investigate this, Figure 10 shows a series of
impedance spectra measured for Zr1.75Mo0.25 between −9.5 °Cand RT after annealing.In this series, the spectra change from an obvious bulk arc at
low temperatures to one in which the spur predominates at RT.However, when starting the fitting procedure at low temper-atures and always using the fit results as starting values of thenext fit procedure at the next higher temperature, veryconsistent capacitance and resistance data can be obtained(see below). Capacitances from CPE1 did not vary too much,and conductivities close to RT are in line with thoseextrapolated from the very reliable low temperature con-ductivity data. Additional evidence for the meaningfulness of
this analysis comes from a measurement performed onZr1.75Mo0.25 of a different batch series with reversible Lielectrodes, see below. Hence, we consider this analysis asmeaningful and able to deduce the proper bulk materialsparameters.
3.5.3. The Bulk Transport of Li-Ions in Mo-Doped LLZO. Astrong argument in favor of R1 representing a bulk transportprocess is the existence of a meaningful geometrical bulkcapacitance in parallel. C1 values are in the 10 pF range, andcalculating a relative permittivity εr,1 from sample area A andsample thickness d (ε0 = vacuum permittivity) according to
ε ε= C d A/r ,1 1 0 (3)
leads to values of the order of 40−60. The relative permittivitiesfor all temperatures and samples before and after annealing aresummarized in Figure S2. The increase close to RT, found forsome samples, reflects the uncertainty due to absence of largeparts of the high frequency arcs. The εr,1 values of ca. 40−60 arevery realistic bulk values for oxides with significant ionicpolarization (and similar to εr of ZrO2
13) and thus support theinterpretation of R1 as a bulk property. We cannot exclude theexistence of highly conducting grain boundaries, since thosewould only add an additional resistor in parallel to R1 and thusdo not change the shape of the spectrum and thecapacitance.14,15 However, to date conclusive experimentalevidence supporting the assumption of fast grain boundaryconduction in LLZO is not available in the literature.Accordingly, the bulk conductivity, σbulk, of Li-ions in ourLLZO samples was determined from R1 by
σ = d R/ Abulk 1 (4)
Arrhenius plots of the Li-ion conductivities are shown inFigure 11 for all samples before (a) and after annealing (b).Data scattering can be largely attributed to fitting inaccuraciescaused by the intermediate frequency arc (see above). Beforeannealing (as-prepared), Li-ion conductivities of mostcompositions (except Zr1.90Mo0.10) coincide at RT. AllArrhenius fits lead to ca. 3.4 × 10⁻⁴ S cm−1; exact values aregiven in Table 2.
Figure 9. Impedance spectra of Zr1.75Mo0.25 before and after annealingat 700 °C, measured in the range of ca. −7 °C and RT. Clearly, theintermediate frequency arc became more pronounced when thesample was annealed. Solid lines are fits using the model in Figure 8.Markers indicate frequencies of experimental data.
Figure 10. Temperature dependence of impedance spectra for an as-prepared Zr1.75Mo0.25. The high frequency arc diminishes in magnitudeas the temperature is raised.
Inorganic Chemistry Article
DOI: 10.1021/acs.inorgchem.5b01895Inorg. Chem. 2015, 54, 10440−10449
10445

Slight differences in activation energies Ea (see Table 2)cause some discrimination at low temperatures withZr1.75Mo0.25 exhibiting the highest low temperature Li-ionconductivity. Annealing at 700 °C leaves the σbulk ofZr1.80Mo0.20 and Zr1.75Mo0.25 virtually identical (∼ 3.4 × 10⁻⁴
S cm−1) at RT, with the best low temperature σbulk found forZr1.75Mo0.25.The samples Zr1.70Mo0.30 and Zr1.60Mo0.40 exhibit a drop in
conductivity by ca. a factor of 2. This decrease of Li-ionconductivity may be related to phase changes since thosesamples are not phase-pure. The Ea values of σbulk·T are in therange of 0.36−0.49 eV (see Table 2), and the best Li-ionconducting composition (Zr1.75Mo0.25) exhibits the lowest value(0.39 eV as-prepared and 0.36 eV after annealing, respectively).All other samples have very similar activation energies with anaverage of ca. 0.45 eV. Activation energies are thus compatible
with other Li-oxide garnets.17 See also Figures S3 and S4 forfurther discussion, particularly of σbulk variations of nominallyidentical samples from different batches.
3.5.4. The Intermediate Frequency Arc: Grain Boundary orNot? Intermediate frequency impedance features are oftenfound in the literature16 and are sometimes interpreted in termsof resistive grain boundaries.3,17 In other cases, an additional arcin the spectrum is attributed to the electrode/LLZO inter-face.18−20 For a more detailed analysis of the intermediatefrequency arcs observed in the Nyquist plots of the samples inthis study, analysis of the corresponding capacitance is helpful.This may give information on the location of the resistor R2.Here, eq 3 cannot simply be applied to C2 since the relevantthickness is unknown; in case of one-dimensional current flowwe should use the thickness of the region(s) causing theresistance.In a first approach, we may assume bulk permittivity also for
C2, and then an effective thickness d2 of the correspondingresistive regions can be determined. This type of analysis is verycommon for grain boundaries (brick layer model)12,21 and leadsto the thickness values shown in Figure 12. The nominalthickness d2 strongly varies between samples, and a systematic
Figure 11. Temperature dependent bulk conductivities for as-prepared(a) and annealed (b) samples of different Mo doping content.
Table 2. Activation Energies, Ea,1 (Bulk) and Ea,2(Intermediate Arca), of σbulk·T and Bulk Conductivities,σbulk, of Zr2−xMox, with x = 0.0−0.4 at RT According to theArrhenius Fitb
xEa,1
ap
[eV]Ea,1
an
[eV]Ea,2
ap
[eV]Ea,2
an
[eV]σbulk
ap [Scm−1]
σbulkan [S
cm−1]
0.10 0.46 0.48 0.44 8.00 × 10⁻⁵ 6.82 × 10⁻⁵
0.20 0.48 0.44 0.62 3.11 × 10⁻⁴ 3.38 × 10⁻⁴
0.25 0.39 0.36 0.44 0.43 3.33 × 10⁻⁴ 3.40 × 10⁻⁴
0.30 0.49 0.44 0.40 0.56 3.69 × 10⁻⁴ 1.00 × 10⁻⁴
0.40 0.48 0.43 0.65 0.66 3.40 × 10⁻⁴ 1.58 × 10⁻⁴
aActivation energies of the intermediate arc, see in the text. bSamplesas-prepared are abbreviated ap and samples after annealing an.
Figure 12. Thickness of the region causing the intermediate frequencyarc, calculated from C2 by assuming bulk permittivity. (a) Values of as-prepared samples for different temperatures. (b) Values of annealedsamples for different temperatures. All open symbols refer to samplesfor which the exponent n of the CPE element is on average below 0.6.Since bulk capacitances and thus bulk permittivities become lessaccurate for increasing temperature (see Figure S2), we used the veryreliable permittivity determined from the lowest temperature tocalculate all d2 values.
Inorganic Chemistry Article
DOI: 10.1021/acs.inorgchem.5b01895Inorg. Chem. 2015, 54, 10440−10449
10446

trend with annealing is not obvious. However, the constantphase elements CPE2 of several samples exhibit very lowexponents (average of n < 0.6); those samples are indicated inFigure 12. The most reliable C2 values consistently lead to athickness d2 of ca. 10−20 μm, independent of annealing.The corresponding resistive region might be serially
distributed within the entire sample (e.g., several serial grainboundaries) or could be located at the two electrode/electrolyte interfaces. In order to further analyze the position,we removed ca. 1/5 of a sample by grinding both sample sidesand measured the impedance again (resulting spectrum isshown in Figure S4). Obviously, some changes compared to theoriginally annealed sample exist, but the intermediate frequencyarc is still present and of similar size as before. This suggeststhat the resistive region is not restricted to a zone near theelectrodes, but rather is an effect that includes regions withinthe entire sample, most probably, the grain boundaries.The measurement of a Zr1.75Mo0.25 sample with Li electrodes
strongly supports this interpretation. Figure 13 displays the
corresponding impedance spectrum. While the high andintermediate frequency arcs are again clearly visible, the lowfrequency electrode response shrank to a tiny feature at verylow frequencies.The latter is typical for Li electrodes18,22 but not further
considered here. Two serial R-CPE elements fit the data well(solid line), and interpretation of R1 in terms of the bulkconductivity leads to σbulk = 2.4 × 10⁻⁴ S cm−1. This is in goodagreement with measurements using Pt/Ti electrodes, partic-ularly in consideration of the fact that a sample of a differentbatch was analyzed and a variation of the conductivity betweendifferent batches was also found for Pt/Ti electrodes, see FigureS3.The capacitance of the intermediate frequency arc can be
determined from eq 2, and the resulting value corresponds to athickness of ca. 7 μm (assuming εr = 50, see Figure S2), whichis in excellent agreement with the measurements using Pt/Tielectrodes. The area-specific capacitance is about 2 orders ofmagnitude smaller than that of Li/LLZO interfacial arcs foundfor similarly prepared electrodes on Al-doped LLZO.18 Thearea-specific resistance of the arc in Figure 13 is much largerthan that of a Li/LLZO interface prepared in Ar18 but fits wellto that found for Ti/Pt electrodes. This supports ourconclusion that the large intermediate frequency arc of ourstudy is not primarily caused by the Li/LLZO interface butlargely originates from regions within the LLZO sample,probably grain boundaries. (A smaller Li/LLZO interfacial arcmight still exist but cannot be separated from the large
intermediate frequency arc.) If R2 is the grain boundaryresistance (Rgb), we can calculate the corresponding grainboundary thickness δgb from the total thickness d2 and the grainsize Lg according to
δ = d L d/gb 2 g (5)
When using the estimates of grain sizes given above, eq 5 leadsto δgb values of the order of 1 μm and thus to a thickness that ismuch larger than typically found for the structurally disorderedgrain boundary core region of oxides (a few nm). It is alsosignificantly larger than a space charge width expected for ahighly Li-ion conductive material with high concentration ofmobile charge carriers. Still other effects close to grainboundaries could lead to such a thickness, e.g., a Li+−H+
exchange mechanism.23
For the sake of clarity it is worth mentioning that thecorrectness of the calculated thickness d2 and thus of δgbdepends on the correct assumption of the permittivity. If, forexample, many voids and gaps exist between grains, the currentmay become constricted to a few contact points and a veryinhomogeneous and frequency dependent current distributionresults. This has been treated in detail in finite element studiesand may also cause intermediate frequency arcs withcapacitances being determined by the voids and thus by εr =1.24 In our case d2 values would then decrease by a factor of 50.However, microstructural images and the strong increase of R2with annealing do not support such an interpretation in termsof voids/pores.
3.5.5. The Li-Ion Conductivity of Resistive Zones in Mo-Doped LLZO. Assuming the appropriateness of the assumptionsε2 ≈ ε1 and homogeneous current flow, a Li-ion conductivity ofthe resistive region (presumably at grain boundaries) can finallybe calculated, irrespective of the transport mechanism andlocation. Arrhenius diagrams of these conductivities are shownfor all samples in Figure 14. Activation energies are similar tothose of the bulk conductivity, typically in the 0.4−0.5 eVrange, partly up to 0.66 eV (see Table 1). Li-ion conductivitiesat RT are of the order of 10−5 to 10−7 S cm−1, depending oncomposition and annealing, and thus many orders of magnitudelower than the Li-ion bulk conductivity. A similar value is foundfor the Li/garnet/Li sample (ca. 5 × 10⁻⁷ S cm−1). (Note thatthis is the true conductivity of the resistive zone. Whenconsidering effective sample conductivities, the resistance R2has to be normalized to the entire sample thickness.) The verylow conductivity of the resistive zone indicates that it is highlyimportant for any application to understand and ultimatelyreduce or eliminate this effect.
3.6. Electrochemical Stability Measured by CV. Finallywe checked the electrochemical stability of Mo-doped LLZO.Therefore, a cyclic voltammetry experiment on a Li/Zr1.75Mo0.25/Au cell was measured to investigate the electro-chemical window of the garnet pellet.As shown in Figure 15, peaks due to an alloying reaction
between Au and Li and extraction of Li from the alloy wereclearly observed without obvious peaks at higher voltages,indicating that Li+ could pass through the garnet pellet withoutpossible degradation reactions. During the anodic sweep of theCV experiment, the garnet was found to be stable up to 6 V.
4. CONCLUSION
Cubic Li7−2xLa3Zr2−xMoxO12 garnets were synthesized usingceramic sintering methods. Since Mo6+ substitutes for twice as
Figure 13. Nyquist plots of symmetrical cells containing pelletssandwiched between lithium electrodes and fit line using two serial R-CPE elements.
Inorganic Chemistry Article
DOI: 10.1021/acs.inorgchem.5b01895Inorg. Chem. 2015, 54, 10440−10449
10447

much Li+ as Ta5+ does, about 0.25 Mo6+ is enough to decreasethe Li+ content to the critical amount of ≤6.5 Li+ pfu, whichstabilizes the cubic LLZO garnet phase. The solubility limit ofMo6+ in LLZO is about 0.3 pfu, lower than that of othersupervalent ions that substitute for Zr4+. Mo6+ has a smallerionic radius than Zr4+ and is located at the 16a site of the cubicoxygen garnet framework causing the unit-cell parameter, a0, todecrease as a function of the Mo6+ content. The highest σbulk isfound for 0.25 Mo6+ pfu LLZO (ca. 3 × 10⁻⁴ S cm−1 at RT with
significant variation for nominally identical samples). Anintermediate frequency arc was found in the impedance spectra,and its detailed analysis indicates that it differs from theinterface-related additional arc found in some studies on LLZO.Rather, the additional resistance can be associated with resistivezones in the sample, most probably grain boundaries, andlowers the effective Li-ion conductivities. It is thus highlyimportant for any application not only to control the interfacialresistance at the electrodes but also to understand andultimately reduce or eliminate any additional resistance withinthe sample. Finally the voltage stability window of Mo6+ dopedLLZO was checked and found to be about 6 V, which enablesthe use of high voltage cathode materials.
■ ASSOCIATED CONTENT*S Supporting InformationThe Supporting Information is available free of charge on theACS Publications website at DOI: 10.1021/acs.inorg-chem.5b01895.
Results from impedance spectroscopy and bulk permit-tivities (PDF)
■ AUTHOR INFORMATIONCorresponding Author*E-mail: [email protected] research was supported by Austrian Science Fund (FWF):Project No. P25702.NotesThe authors declare no competing financial interest.
■ ACKNOWLEDGMENTSWe are grateful to ILL for making all facilities available. Theportion of the work performed at LBNL was supported by theAssistant Secretary for Energy Efficiency and RenewableEnergy, Office of Vehicle Technologies of the U.S. Departmentof Energy under Contract No. DE-AC02-05CH11231.
■ REFERENCES(1) Awaka, J.; Kijima, N.; Hayakawa, H.; Akimoto, J. J. Solid StateChem. 2009, 182, 2046−2052.(2) Awaka, J.; Takashima, A.; Hayakawa, H.; Kijima, N.; Idemoto, Y.;Akimoto, J. Key Eng. Mater. 2011, 485, 99−102.(3) Murugan, R.; Thangadurai, V.; Weppner, W. Angew. Chem., Int.Ed. 2007, 46, 7778.(4) Allen, J. L.; Wolfenstine, J.; Rangasamy, E.; Sakamoto, J. J. PowerSources 2012, 206, 315−319.(5) Rettenwander, D.; Langer, J.; Schmidt, W.; Arrer, C.; Harris, K.;Terskikh, V.; Goward, G.; Wilkening, M.; Amthauer, G. Chem. Mater.2015, 27, 3135−3142.(6) Bottke, P.; Rettenwander, D.; Schmidt, W.; Amthauer, G.;Wilkening, M. Chem. Mater. 2015, DOI: 10.1021/acs.chemma-ter.5b02231.(7) Rodriguez-Carvajal, J. Phys. B 1993, 192, 55−69.(8) Shannon, R. D.; Prewitt, C. T. Acta Crystallogr., Sect. B: Struct.Crystallogr. Cryst. Chem. 1969, B25, 925−946.(9) Zeier, W. G. Dalton Trans. 2014, 43, 16133−16138.(10) Tietz, F.; Wegener, T.; Gerhards, M. T.; Giarola, M.; Mariotto,G. Solid State Ionics 2013, 230, 77−82.(11) Thompson, T.; Wolfenstine, J.; Allen, J. L.; Johannes, M.; Huq,A.; David, I. N.; Sakamoto, J. J. Mater. Chem. A 2014, 2, 13431−13436.(12) Fleig, J. Solid State Ionics 2002, 150, 181−193.(13) Zhao, X.; Vanderbilt, D. Phys. Rev. B: Condens. Matter Mater.Phys. 2002, 65, 075105-1−10.
Figure 14. Temperature dependent Li-ion conductivity of the processcausing the intermediate frequency arc of differently doped LLZOsamples, as-prepared (a) and after annealing at 700 °C (b). The valuesare calculated from the thicknesses in Figure S5 and measured R2values.
Figure 15. Cyclic voltammogram of Li/Zr1.75Mo0.25/Au cell at scanrate of 2 mV/min in the potential range from −0.5 V to 6 V vs Li/Li+.
Inorganic Chemistry Article
DOI: 10.1021/acs.inorgchem.5b01895Inorg. Chem. 2015, 54, 10440−10449
10448

(14) Fleig, J.; Maier, J. Phys. Chem. Chem. Phys. 1999, 1, 3315−3320.(15) Maier, J. Prog. Solid State Chem. 1995, 23, 171−263.(16) Thangadurai, V.; Narayanan, S.; Pinzaru, D. Chem. Soc. Rev.2014, 43, 4714−4727.(17) Tenhaeff, W. E.; Rangasamy, E.; Wang, Y.; Sokolov, A. P.;Wolfenstine, J.; Sakamoto, J.; Dudney, N. J. ChemElectroChem 2014, 1,375−378.(18) Cheng, L.; Crumlin, E. J.; Chen, W.; Qiao, R.; Hou, H.; Lux, S.F.; Zorba, V.; Russo, R.; Kostecki, R.; Liu, Z.; Persson, K.; Yang, W.;Cabana, J.; Richardson, T.; Chen, G.; Doeff, M. Phys. Chem. Chem.Phys. 2014, 16, 18294−18300.(19) Buschmann, H.; Dolle, J.; Berendts, S.; Kuhn, A.; Bottke, P.;Wilkening, M.; Heitjans, P.; Senyshyn, A.; Ehrenberg, H.; Lotnyk, A.;Duppel, V.; Kienle, L.; Janek, J. Phys. Chem. Chem. Phys. 2011, 13,19378−19392.(20) Cheng, L.; Chen, W.; Kunz, M.; Persson, K. A.; Tamura, N.;Chen, G.; Doeff, M. M. ACS Appl. Mater. Interfaces 2015, 7, 2073−2081.(21) Maier, J. Ber. Bunsenges. Phys. Chem. 1986, 90, 26−33.(22) Buschmann, H.; Berendts, S.; Mogwitz, B.; Janek, J. J. PowerSources 2012, 206, 236−244.(23) Wang, Y.; Lai, W. J. Power Sources 2015, 275, 612−620.(24) Fleig, J.; Maier, J. J. Am. Ceram. Soc. 1999, 82, 3485−3493.
Inorganic Chemistry Article
DOI: 10.1021/acs.inorgchem.5b01895Inorg. Chem. 2015, 54, 10440−10449
10449