LG Electronics The Road Ahead Raising brand awareness in developed overseas markets Maintain high...
29
June 2003 LG Electronics
Transcript of LG Electronics The Road Ahead Raising brand awareness in developed overseas markets Maintain high...

June 2003
LG Electronics

As a note, this presentation was released as the dates shown and reflected management views as of
these dates. While reviewing this information, the data and information contain certain forward-looking
statements that are subject to known and unknown risks and uncertainties that may cause actual
results to differ from those stated or implied by such statements. These risks and uncertainties include,
but are not limited to the risk factors noted in the Company’s Earnings Releases and the Company’s
filings with the Financial Supervisory Commission of Korea. The Company assumes no obligation or
responsibility to update the information provided in the presentations in correspondence to their
respective dates.

Highlights
Accomplishments
Revenue grew over 13% CAGR over last three years
Led by strong sales of handsets
Appliance division still growing
Profitability improvement
Restructuring in system and IT related business (PCB, Monitor etc.)Concentrating on premium brand products Low-end production to China
Established framework for enhanced corporate governance
Demerger removed non core assets
Holding company structure limits investments in affiliates

Highlights
The Road Ahead
Raising brand awareness in developed overseas markets
Maintain high ROE and EVA
Expand LG brand appliance in North America
Aggressive marketing on handset in Europe
EVA is a key performance measurement
Invest in key growth products for the futureInvesting for the future despite current difficult market conditions
-> PDP 3rd line, LCD, OLED etc
Efficient cost and risk managementTighter control on receivables and inventory
Cash reserve for sufficient liquidity
Reduce overhead cost by 20%

www.lge.com
Ⅰ. Business Overview
Ⅱ. Home Appliances
Ⅲ. Mobile Handset
Ⅳ. Digital TV

Ⅰ.Business Overview

Business Structure
LG Electronics
LG Corp.
Digital Display& Media
TelecomEquip. & Handset
LG Micron
LG Innotek
LG. Philips LCD
LG. Philips Displays
LGIBM PC
Overseas Subsidiaries
Digital Appliance
CDMA HandsetsGSM Handsets--------------------
Telecom System--------------------
PC
Optical StorageMonitor
TVAudio/Visual
Recording MediaPDP
Air-ConditionerRefrigerator
Washing MachineVacuum Cleaner
Cooking ApplianceOthers

Sales Trend
All divisions registering growthFastest growth seen in handsets Contribution evenly distributed among three divisions
3.44.4
5.3
00 01 02
Appliance
CAGR 25%(US$ bn)
Telecom E & H00
4.04.9 5.4
01 02
(Handset: CAGR 51%)
CAGR 16%
5.1 4.65.6
00 01 02
CAGR 4%
Display & Media

Operating Profit
Appliance maintaining double digit operating margin
Appliance
350
400
450
500
0%
2%
4%
6%
8%
10%
12%
14%
00 01 02
Op margin
Display&Media
Display&Media improving after restructuring in IT divisions
Op margin
100
200
300
400
0%
1%
2%
3%
4%
5%
6%
7%
00 01 02
Telecom E&H
Telecom earning contribution becomes more significant thanks to handset
0
50
100
150
200
250
0%
2%
4%
6%
8%
10%
00 01 02
Op margin
(handset margin)

Reduced debt by 41% over three year periodInternally generated cash flow allows for further debt reductionGoal is to reduce debt-equity ratio to 50%
Balance Sheet
50% Level
Debt Trend
3.93.0 2.9 2.3
118%
95%
128%
96%
2000 2001 UponDemerger 2002
Debt D/E Ratio
(US$ bil.)EBITDA /CAPEX
1,278
1,101
1,283
686
446 426
2000 2001 2002
EBITDA CAPEX
(U$ Mil.)

Creating Shareholder Value
Improved returns via business rationalization EVA is key performance measurement for business divisionsLong-term goal is to maintain ROE above 20%
Return on Equity (ROE)*
9.4%10.4%
12.3%
13.7%
0%
5%
10%
15%
'99 '00 '01 '02
*Adjusted for extraordinary capital gains
Economic Value Added (EVA)
0
200
400
600
'99 '00 '01 '020%
10%
20%
30%
40%
50%
EVA ROIC WACC
(U$ Mil.)

Corporate Governance
Committed to increasing transparency and raising shareholder wealthDisposal of non-core assets via demergerHolding company structure restricts investments in affiliates
LG Department Store (57.7%)
LG CNS (10%)
LG Petrochemical
LG Chemical
LG Cable (6%)
LG Construction (8.6%)
LG International(2.9%)
LG Caltex (3.1%)
LG Mart (50%)
LGIS (41.5%)
Dacom (49.1)
LG Innotek (53.4%)
LG Micron (17.2%)
LG Philips Displays (37.5%)LG Capital (6.2%)LG Telecom (28.1%)LG Philips LCD (50%)LG Sports (39.3%)LG IBM PC (49%)
LG Caltex (3.1%)
LG Investment & Securities(7.2%)
7.5%
10%
5.4%
5.4%6.9%
4.4%
3.2%
30%
5.4%
3%
0.5%4%
10.7%4.8%
4.8%10.7%
4.2%
3.1%
50%
15.8%
6%15.8%
31%
17.4%
10.2%16.4%
6.1%
Before
LG Electronics
DemergerDemerger
As of June 2003
After
LG Corp.LG Corp.
LG Electronics
LG Caltex (50%)
LG H&H (30%)LGIS (48.9%)
LG.Philips LCD (50%)LG.Philips Displays (50%)LG Micron (37%)LG Innotek (70%)LG IBM PC (49%)Hiplaza (100%)LG Sports (25%)LG Inv.&Sec (7%)
LG Telecom (37%)LG Home Shopping (30%)
Dacom (30%)LG Chemical (30%)
LG CNS (64%)Silitron (51%)
(32%)

Product Roadmap
Implementing efficient resource allocation to maximize returnsPreparing for potential demand growth for digital TVsConcentrating on key growth products
Handsets
Digital TV / Home Theater
PDP
OLED
Prof
itabi
lity
Optical Storage
Time
Home Appliances

Ⅱ. Home Appliances

Global Comparison
Revenue grew over 25% CAGR (2000-2002) Profit margins remain above the competitionFurther room for growth with premium brand products
Sales Growth*
0.0%
5.0%
10.0%
15.0%
20.0%
25.0%
Electrolux
GEA
Maytag
LGE Appliance
*3 year CAGR
Whirlpool
Source: Company data
Operating Profit Growth*
-20.0%
-15.0%
-10.0%
-5.0%
0.0%
5.0%
10.0%
15.0%
20.0%
Maytag
Electrolux
Whirlpool
GEA
*3 year CAGR
LGE Appliance
Source: Company data

Moving Up Market
Maintaining product leadership in key product linesNewly introduced premium products driving export growth
DIOSTROMM Cyking Microwave Oven Commercial A/C
(In U$ mill)
64%
63%
0
500
1,000
1,500
2001 2002
ExportDomestic
Sales of Premium Products Premium Portion
2001
2002
2003(E)
22%
30%
35%

Building Brand Power
Aggressively building band awareness in overseas markets
Concentrating marketing activities to North America and Europe Lowering OEM portion
Marketing Spend
0
100
200
300
'00 '01 '02
($ Mil. )
231
10652
10
20
30
40
'99 '00 '01 '02
25%28%30%35%
OEM Portion
TargetZone
Sales*
OP margin10%
10 bil$ Whirlpool
GEA
Electrolux
LGEMatsushita
Maytag
5%0%
5 bil$
*consolidated

Ⅲ. Mobile Handset

Penetrating New Markets
Becoming a major player in the global marketGrowth in CDMA has put LGE in global top tier positionGSM handsets will be the next growth driver
(in million units)
Domestic
CDMA Exports
GSM Exports
'01.1Q 2Q 3Q 4Q '02.1Q 2Q 3Q 4Q '03.1Q
2.0 2.2
3.12.8
3.1
3.7
4.5 4.7
5.6

Market Diversification
Reducing dependence on Korean marketGSM allowing expansion into European marketStill making strides in the global CDMA market
Latin America
1Q 200314%
37%15%
7%Europe
22%
Korea
North America
China
Other
6%
1Q 20031Q 2003
20012001
Korea
North America
Latin Americaother
34%
48%
16%2%

Global Position
LGE is now the fifth largest handset maker globallyBrand awareness growing globallyTargeting No. 3 global market share
1 Nokia 35.6%
2 Motorola 14.9%
3 Samsung 7.3%
4 Siemens 7.3%
5 SEMC 7.1%
6 NEC 2.9%
7 Mitsubishi 2.9%
8 Panasonic 2.7%
9 Alcatel 2.6%
2001
Source : Strategy Analytics
10 LGE 2.5%
1 Nokia 35.1%
2 Motorola 15.4%
3 Samsung 12.2%
4 Siemens 7.4%
2003 1Q
5 LGE 5.2%
6 SEMC 5.0%
7 Kyocera 2.6%
8 Panasonic 2.0%
9 Mitsubishi 1.8%
9 NEC 1.8%

Market and Strategy
Focusing on high-end segment Color handset diffusion is still low globallyCurrent global situation an opportunity for LGE
• Expanding sales to Verizon • Focus on high-end phones to Sprint
• Growing in Italy and Russia• Actively discussing with major operators
• Gradual recovery seen• Introduce new models → focusing on replacement demand
ASP 1Q 2003LGE $165Samsung $163Nokia $159SEMC $144Motorola $144
Source: Strategic Analytics
• High inventory and SARS effecting demand• Falling ASP a concern→ Focus on high-end market

Ⅳ. Digital TV/ PDP

Market Expansion
Entering the “sweet spot” for digital TV demand
Digital TV market is expanding in major developed countries
Preparing to meet the future head on
Product Life Cycle
ConceptionStage
‘99 ‘00 ‘01 ‘02 ‘03 ‘04 ‘05
DTV PortionOver 10%
Theoretical “Sweet spot”
DTV market Outlook
* Source : In-Stat, SRI, TSR, NRI, Displaysearch etc.
40%
21%
22%
17%
CRT
PTV
LCD
Total
PDP
'03 '04 '05 '06
28.0
10.1
16.5
21.7
CAGR(%)
61%
16%
38%
42%
55%Mil. units

LGE Competitiveness
Technological leadership in next generation displaysVertical integration in display devices and componentsPDP targeting > 40” digital TV market
• Best brightness and contrast (1000:1)• Best yield in Industry (over 90%)• Full product line-up from 40”~60”
PDP
TV Set
Top Tier Position in Capacity and Yield
PDP
Top M/S in CRT
Flat CRT
Global No.1 in LCD module
LCD
Display Devices
LCD
• Full product line-up (from 13”to 52”)• Offers various choice of design• Pre-emptive investment in next generation fab
CRT
PTV
• Secure technology on MD engine in LCD & DLP projection TV
• In house production of Lens, Optical components
• Largest distribution channel
• Largest global production base
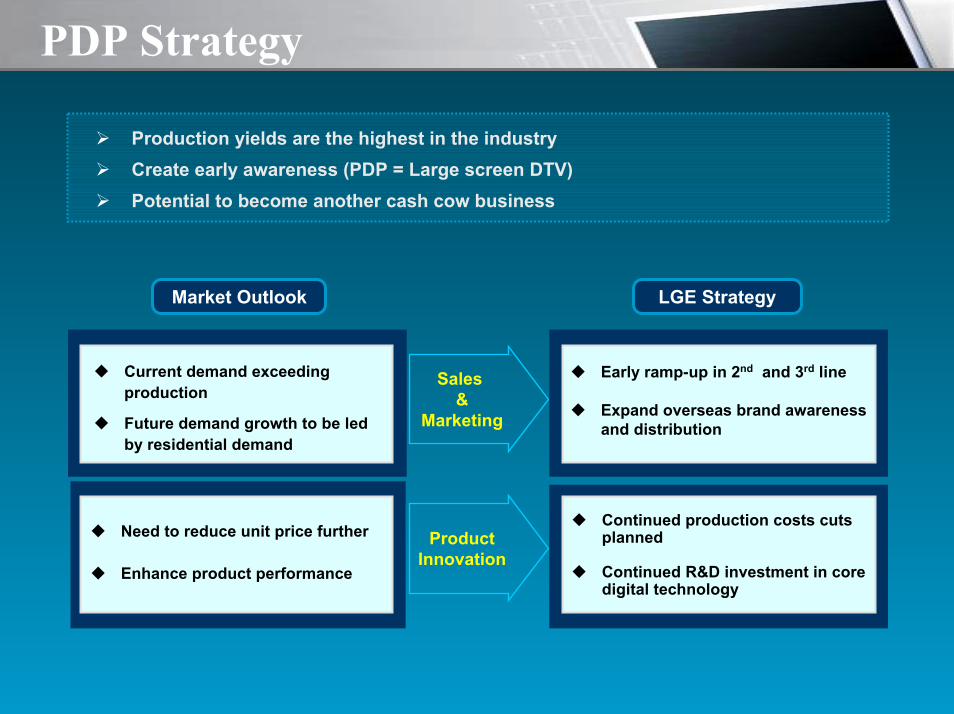
PDP Strategy
Production yields are the highest in the industryCreate early awareness (PDP = Large screen DTV)Potential to become another cash cow business
Market Outlook LGE Strategy
Current demand exceeding production
Future demand growth to be led by residential demand
Early ramp-up in 2nd and 3rd line
Expand overseas brand awareness and distribution
Sales &
Marketing
Need to reduce unit price further
Enhance product performance
Continued production costs cuts planned
Continued R&D investment in core digital technology
ProductInnovation

Growth in China
Our 12 Joint ventures in China growing rapidly 30% of LGE’s total production is done in China
LGESY
LGETA
LGEBJ JV LGEQH
LGECT
LGENT
LGEPN
LGESG JVLGEHZ
LG Tianjing
LGTOPS
LG Langchao
2.0
4.7
2001 2002
Sales
3.1
2003E
(U$ bil)
1999 20021998
12th
5th
20th11%
30%
Brand Recognition
1st : Haier
2nd : Panasonic
3rd : Chang Hong
4th : Sony
5th : LG
6th : SamsungSource: Gallup poll
2001 2002
RevenueUnits 25% 30%
15% 15%
Production Portion
Optical Storage
Microwave oven
CD-Writer
PDP/Projection TV
CDMA handset
LCD monitor
1st
1st
2nd
2nd
3rd
3rd
Market Share

Summary
The Road Ahead
Invest in key growth products for the futureInvesting for the future despite current difficult market conditions
-> PDP 3rd line, LCD, OLED etc
Raising brand awareness in developed overseas markets
Maintain high ROE and EVA
Expand LG brand appliance in North America
Aggressive marketing on handset in Europe
EVA is a key performance measurement
Efficient cost and risk managementTighter control on receivables and inventory
Cash reserve for sufficient liquidity
Reduce overhead cost by 20%

Thank YouThank You
www.lge.com