LG DATA - dpac.tas.gov.au
30
Department of Premier and Cabinet LG DATA Local Government | Data | Analysis | Transparency | Accountability Rates Snapshot 2018-19
Transcript of LG DATA - dpac.tas.gov.au
Department of Premier and Cabinet
LG DATA Local Government | Data | Analysis | Transparency | Accountability
Rates Snapshot
2018-19
LG D A T A | Data | Analysis | Transparency | Accountability
Local Government Division Government of Tasmania
ISBN
Published 2020
Published by the Department of Premier and Cabinet Phone 03 6232 7022
Fax 03 6173 0257 GPO Box 123 HOBART TAS 7001
[email protected] www.dpac.tas.gov.au
20/105098
This work is licensed under a Creative Commons Attribution 3.0 Australia license © Crown in right of the State of Tasmania 2020

LG D A T A | Data | Analysis | Transparency | Accountability
Rates 2018-19 | Local Government Division | Department of Premier and Cabinet 3
Contents
Introduction .........................................................................................................................................................................................4
Council rates explained ............................................................................................................................................................4
How rates are calculated .........................................................................................................................................................5
Council classifications.................................................................................................................................................................5
Comparative table – all councils rates data 2018-19 .......................................................................................................7
Average rate by rateable property: ..........................................................................................................................................8
Key trends: ......................................................................................................................................................................................8
Average rate by rateable properties: all classifications ............................................................................................ 10
Average rate by rateable properties: councils by classification............................................................................ 11
Rate revenue as a percentage of operating revenue: ................................................................................................... 16
Key trends: ................................................................................................................................................................................... 16
Rate revenue as a percentage of operating revenue: all classifications............................................................ 17
Rate revenue as a percentage of operating revenue: councils by classification ........................................... 18
Average operating costs per rateable property:.............................................................................................................. 23
Key trends: ................................................................................................................................................................................... 23
Average operating costs per rateable property: all classifications ...................................................................... 24
Average operating costs per rateable property: councils by classification ..................................................... 25

LG D A T A | Data | Analysis | Transparency | Accountability
Rates 2018-19 | Local Government Division | Department of Premier and Cabinet 4
Rates Snapshot 2018–19 Introduction
This snapshot uses the latest available audited data to compare rates across Tasmania’s 29 Local Government areas. This is the third rates snapshot, following the 2017-18 snapshot published in 2019. The decision to update the rates snapshot and provide more recent analysis is due to the strong level of ongoing
community interest in the subject.
Three performance indicators are used in this snapshot to compare council rates: average rate per rateable
property; rate revenue to operating revenue; and operating costs per rateable property. Data is presented for the following years:
2009-10, chosen as the baseline year for data as it was the first reporting period after council owned water a sewerage assets and corresponding revenues were transferred to the water
corporations;
2014-15, showing change after a five year interval;
2017-18, showing change from the previous 12 months; and
2018-19, showing the latest available data.
All data is sourced from publicly available information, including the Tasmanian Local Government
Consolidated Data Collection, Tasmanian Auditor-General reports and Australian Bureau of Statistics catalogues. Figures in tables may be subject to rounding, which may cause some rounded figures to appear as discrepancies between totals within data tables.
This document describes and summarises key trends from 2009-10 to 2018-19, but does not seek to analyse or explain the changes that have occurred. A number of factors can cause changes within or between councils and influence comparisons. Any queries about individual council performance should be
directed to the council in question.
Council rates explained
Council rates are a property-based tax collected by councils from property owners in their council area.
Rateable properties include residential and business properties.
The money raised through rates goes towards paying for the services and infrastructure provided by
councils. Every council provides different types of infrastructure and services because of differences in community needs and expectations, land area, population size, location, number of properties and industry mix. Councils make budget decisions taking into account the demand for services and the capacity of
ratepayers. Councils are accountable to their communities for these decisions.
Property values are used as the basis for levying rates across the municipality. The Tasmanian Government Valuer-General assesses the value of properties across Tasmania. Approaches to assessing property values
include:
Capital value (CV), which is the total value of the property, including the land, building and other improvements, but excluding plant and machinery; and
Assessed annual value (AAV), which is the estimated rental value of the property in a year. This
cannot be less than 4 per cent of the capital value.
Councils can choose which type of rateable valuation they use to set their rates. Councils can also choose the way they distribute rates across their ratepayers. For example, some councils use a flat rating system
where the same rating formula is used for all ratepayers. Other councils use a differential rating system that

LG D A T A | Data | Analysis | Transparency | Accountability
Rates 2018-19 | Local Government Division | Department of Premier and Cabinet 5
takes into account the diversity in ratepayers’ access to and demand for council services. To find out more about a specific council’s data, including which type of rating valuation or system a council uses, please visit
the council’s website or contact the council directly.
How rates are calculated
To calculate rates, a council prepares a budget and determines how much money is needed to provide the services, and maintain the facilities and infrastructure it intends to provide in the next reporting year. The amount needed is called the council’s ‘total operating revenue’.
The council determines how much money it expects to receive from sources other than rates, such as government grants, fees, rents, fines or investments. This is called ‘other revenue’, which varies between councils and from year to year. Other revenue is typically higher for rural councils.
Other revenue is subtracted from total operating revenue. The amount that is left is what a council needs to collect from its rate payers. This is called a council’s ‘rate revenue’.
Rate revenue is then divided by the total value of all rateable properties in the council area, resulting in a
‘rate in the dollar’. The council applies the rate in the dollar to each rateable property to enable the fair distribution of rates across a council area.
In practice, the calculating of expenditure, revenue, and rates is an iterative process in the development of a
council’s budget, which balances expenditure needs with the community’s capacity to pay.
Council classifications
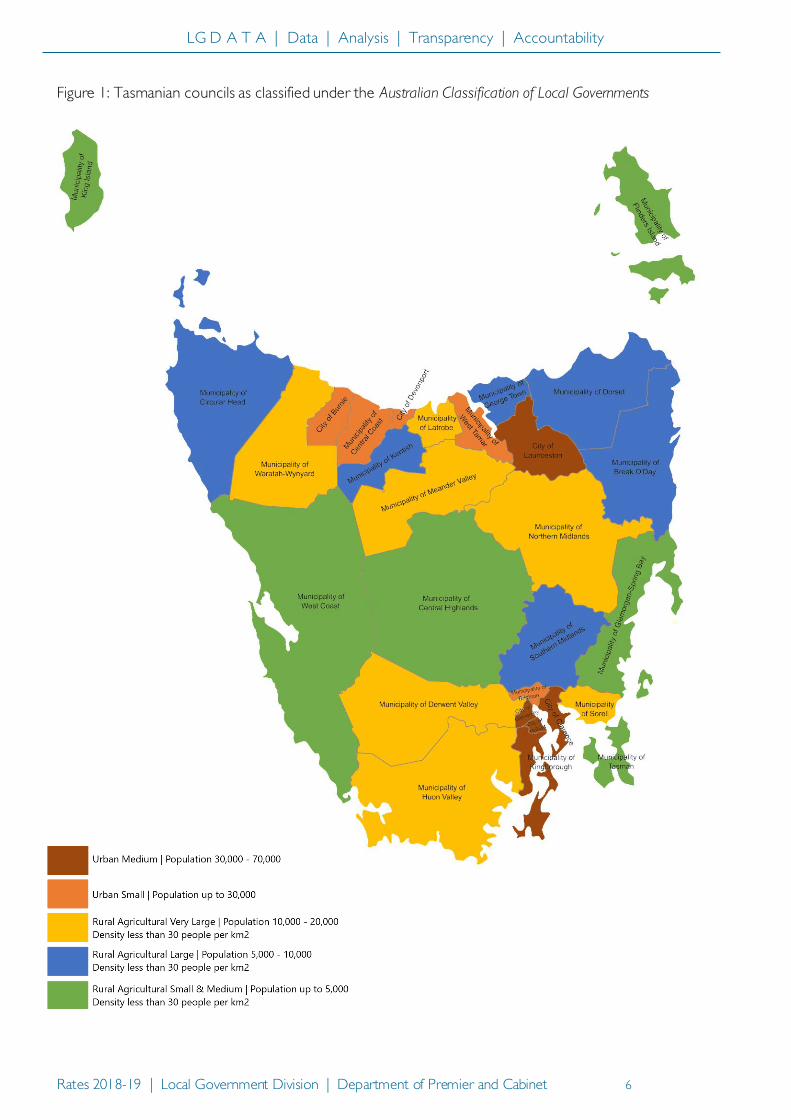
Councils are grouped into five classifications in this snapshot, in line with the Australian Classification of Local Governments, to ensure that accurate comparisons can be made between similar councils. The classi fications take into account population size and density.
In 2018-19, Tasmanian councils fit into the five classifications shown below: Urban medium councils (UM)
Urban small councils (US)
Rural agricultural very large councils (RAVL)
Rural agricultural large councils (RAL)
Rural agricultural, small & medium councils (RASM)
population
30,000 to 70,000
population
20,000 to 30,000, or
up to 20,000 where
density more than 30
people per km2
population
10,000 to 20,000
density less than 30
people per km2
population
5,000 to 10,000
density less than 30
people per km2
population
under 5,000
density less than 30
people per km2
Clarence City
Glenorchy City
Hobart City
Kingborough
Launceston City
Brighton
Burnie
Central Coast
Devonport
West Tamar
*Derwent Valley
Huon Valley
*Latrobe
Meander Valley
Northern Midlands
Sorell
Waratah-Wynyard
Break O’Day
Circular Head
Dorset
George Town
Kentish
Southern Midlands
Central Highlands
Flinders Island
Glamorgan-Spring Bay
King Island
Tasman
*West Coast
* Changes to population figures have resulted in movements between classifications for:
Derwent Valley Council, from RAL to RAVL – population increased to above 10,000 people in 2014;
Latrobe Council, from RAL to RAVL – population increased to above 10,000 people in 2010; and
West Coast Council, from RAL to RASM – population declined to below 5,000 people in 2011.
LG D A T A | Data | Analysis | Transparency | Accountability
Rates 2018-19 | Local Government Division | Department of Premier and Cabinet 6
Figure 1: Tasmanian councils as classified under the Australian Classification of Local Governments

LG D A T A | Data | Analysis | Transparency | Accountability
Rates 2018-19 | Local Government Division | Department of Premier and Cabinet 7
Comparative table – all councils rates data 2018-19
Council Population
Number of
Rateable Valuations
Rate Revenue
Average rate per rateable
property
Average rate per head of
population
Rate revenue
to operating revenue
Operating costs per rateable
valuation
No. No. $'000 $ $ % $
Urban Medium councils (UM)
Clarence 56,945 25,336 49,818 1,966 875 73.4 2,506
Glenorchy 47,636 21,699 39,940 1,841 838 67.5 2,726
Hobart 53,684 24,424 84,780 3,471 1,579 63.1 5,450
Kingborough 37,734 17,332 28,609 1,651 758 69.1 2,420
Launceston 67,449 32,518 67,939 2,089 1,007 61.1 3,356
UM Average 52,690 24,262 54,217 2,204 1,012 66.8 3,292
Urban Small councils (US)
Brighton 17,294 7,715 9,385 1,216 543 62.6 1,957
Burnie 19,348 9,847 22,778 2,313 1,177 67.7 3,547
Central Coast 21,904 10,919 15,687 1,437 716 55.3 2,632
Devonport 25,415 12,771 27,976 2,191 1,101 68.2 3,333
West Tamar 23,769 11,765 18,495 1,572 778 69.5 2,064
US Average 21,546 10,603 18,864 1,746 863 64.7 2,707
Rural Agricultural Very Large councils (RAVL)
Derwent Valley 10,290 5,326 7,587 1,425 737 54.7 2,564
Huon Valley 17,219 10,740 13,227 1,232 768 53.8 2,322
Latrobe 11,329 6,395 7,380 1,154 651 52.9 2,058
Meander Valley 19,713 10,098 12,592 1,247 639 60.7 1,973
Northern Midlands 13,300 7,069 10,883 1,540 818 57.5 2,548
Sorell 15,218 8,940 13,708 1,533 901 70.4 2,042
Waratah-Wynyard 13,800 7,753 11,202 1,445 812 61.0 2,293
RAVL Average 14,410 8,046 10,940 1,368 761 58.7 2,257
Rural Agricultural Large councils (RAL)
Break O'Day 6,232 6,470 9,315 1,440 1,495 65.2 2,053
Circular Head 8,066 5,038 8,207 1,629 1,017 56.5 2,892
Dorset 6,652 5,279 7,299 1,383 1,097 56.5 2,169
George Town 6,931 4,372 8,232 1,883 1,188 72.9 2,491
Kentish 6,324 3,666 5,304 1,447 839 50.8 2,664
Southern Midlands 6,118 3,675 5,415 1,473 885 48.0 3,140
RAL Average 6,721 4,750 7,295 1,542 1,087 58.3 2,568
Rural Agricultural Small & Medium councils (RASM)
Central Highlands 2,144 3,765 3,473 922 1,620 48.6 1,865
Flinders 987 1,245 1,614 1,296 1,635 21.0 8,818 Glamorgan-Spring Bay 4,528 5,763 7,453 1,293 1,646 57.1 2,199
King Island 1,601 1,661 2,454 1,477 1,533 32.3 5,405
Tasman 2,404 3,502 4,782 1,366 1,989 68.9 1,692
West Coast 4,167 4,202 6,865 1,634 1,647 60.5 2,604
RASM Average 2,639 3,356 4,440 1,323 1,683 48.1 3,764
Average all councils 18,214 9,631 17,669 1,606 1,079 58.9 2,889
Source
Population figures derived from Australian Bureau of Statistics (ABS) cat. 3281.0 Regional Population Growth, 28 July 2017 Rates information derived from the Tasmanian Local Government Consolidated Data Collection and Tasmanian Auditor-General Reports

LG D A T A | Data | Analysis | Transparency | Accountability
Rates 2018-19 | Local Government Division | Department of Premier and Cabinet 8
Average rate by rateable property:
This measure shows the average rate of all rateable properties within the council area. It is calculated by taking the total rate revenue of the council and dividing it by the total number of rateable properties:
Average rate by rateable property =Total rate revenue
Total number of rateable properties
Figures 2 - 7 also show the compound annual rate of change, which is a smoothed overall annual rate of change between the baseline year (2009-10) and the latest data (2018-19), removing the effect of year-on-
year volatility. This is calculated using the ‘compound annual growth rate (CAGR) formula:
Compound annual rate of change = (Ending value
Beginning value)
1Number of years
− 1
Key trends:
Rate range by classification o The average rate per rateable property in Tasmania is $1,606 ranging from $3,471 in Hobart
(Figure 3) to $922 in Central Highlands (Figure 7).
o As seen in Figure 2, by classification, the average rate per rateable property consistently
decreases as council classifications get smaller, with the exception of Rural Agricultural Large councils where the average rate is higher than the preceding classification. In 2018-19, Urban Medium and Urban Small council rates per property were above the Tasmanian average,
while all other council categories’ rates per property were below the Tasmanian average.
o Variation in the average rate per rateable property between councils within the same classification is greatest in the Urban Medium classification. The average rate in Hobart is
more than double that of Kingborough. The average rate ranges from $1,651 in Kingborough to $3,437 in Hobart, with an average of $2,204 (Figure 3).
o Rates are most consistent between councils in the Rural Agricultural Very Large classification, ranging from $1,154 in Latrobe to $1,540 in Northern Midlands, with an average of $1,368 (Figure 5).
Percentage change from 2009-10 to 2018-19 o Over the nine year period from 2009-10 to 2018-19 the average rate per rateable property
rose by 43 per cent across all Tasmanian councils. The greatest percentage change occurred
in Glenorchy, where rates rose by 94 per cent, from $947 to $1,841 over this period (Figure 3). The smallest percentage change occurred in Devonport and Latrobe, where rates rose by 24 per cent from $1,766 to $2,191, and $928 to $1,154 respectively (Figures 4
and 5).
o By classification, Urban Medium councils experienced the largest average increase at 51 per
cent. Urban Small councils experienced the smallest average increase, at 32 per cent (Figure 2).
Percentage change over past 12 months o Over the 12 month period from 2017-18 to 2018-19 the average rate per rateable property
increased by 2.6% across all Tasmanian councils. The greatest percentage change occurred in Glenorchy, where rates rose by 10 per cent from $1,674 to $1,841 (Figure 3). The greatest
percentage decrease occurred in Tasman where rates dropped by three per cent across the period (Figure 7).

LG D A T A | Data | Analysis | Transparency | Accountability
Rates 2018-19 | Local Government Division | Department of Premier and Cabinet 9
o By classification, Urban Medium councils experienced the largest average increase at four per cent. Rural Agricultural Small & Medium councils experienced an average decrease, with a
one per cent fall over the 12 month period (Figure 2). This fall is due to Tasman Council and Central Highlands’ 2.7% and one per cent falls respectively, with the remaining councils in this classification either maintaining their rates or with a change of less than one percent.
o Several councils reduced their rates in the twelve months to 2018-19. These councils were Devonport City Council (0.7% reduction), Latrobe Council (1.8% reduction), Kentish
Council (0.9% reduction), Central Highlands Council (one per cent reduction) and Tasman Council (2.7% reduction)

LG D A T A | Data | Analysis | Transparency | Accountability
Rates 2018-19 | Local Government Division | Department of Premier and Cabinet 10
Average rate by rateable properties: all classifications
Figure 2:
Reporting
period
Urban
Medium
Councils
Average
Urban Small
Councils
Average
RAVL
Councils
Average
RAL
Councils
Average
RASM
Councils
Average
All
Tasmanian
Councils
Average
$ $ $ $ $ $
2009-10 1,462 1,327 948 1,100 895 1,122
2014-15 1,908 1,608 1,183 1,338 1,169 1,410
2017-18 2,111 1,708 1,320 1,507 1,338 1,565
2018-19 2,204 1,746 1,368 1,542 1,323 1,606
Overall rate increase as a percentage between 2009-10 and 2018-19
50.8% 31.6% 44.3% 40.3% 47.8% 43.1%
12 month rate increase as a percentage between 2017-18 and 2018-19
4.4% 2.2% 3.6% 2.4% -1.1% 2.6%
Compound annual rate increase as a percentage between 2009-10 and 2018-19
5.3% 3.5% 4.7% 4.3% 5.0% 4.6%
Average rate
Council Classifications
Average rate per rateable property
0
500
1,000
1,500
2,000
2,500
2009-10 2014-15 2017-18 2018-19
Urban Medium Councils Average Urban Small Councils Average
RAVL Councils Average RAL Councils Average
RASM Councils Average All Tasmanian Councils Average

LG D A T A | Data | Analysis | Transparency | Accountability
Rates 2018-19 | Local Government Division | Department of Premier and Cabinet 11
Average rate by rateable properties: councils by classification
Figure 3:
Reporting
period
Clarence
City
Glenorchy
City Hobart City Kingborough
Launceston
City
Urban
Medium
Councils
Average
All
Tasmanian
Councils
Average
$ $ $ $ $ $ $
2009-10 1,447 947 2,339 970 1,605 1,462 1,122
2014-15 1,762 1,453 3,091 1,347 1,890 1,908 1,410
2017-18 1,901 1,674 3,383 1,583 2,012 2,111 1,565
2018-19 1,966 1,841 3,471 1,651 2,089 2,204 1,606
Overall rate increase as a percentage between 2009-10 and 2018-19
35.9% 94.4% 48.4% 70.2% 30.2% 50.8% 43.1%
12 month rate increase as a percentage between 2017-18 and 2018-19
3.4% 10.0% 2.6% 4.3% 3.8% 4.4% 2.6%
Compound annual rate increase as a percentage between 2009-10 and 2018-19
3.9% 8.7% 5.1% 6.9% 3.4% 5.3% 4.6%
Average rate
Urban medium councils
Average rate of all rateable properties
0
500
1,000
1,500
2,000
2,500
3,000
3,500
2009-10 2014-15 2017-18 2018-19
Clarence City Glenorchy City
Hobart City Kingborough
Launceston City Urban Medium Councils Average
All Tasmanian Councils Average
$

LG D A T A | Data | Analysis | Transparency | Accountability
Rates 2018-19 | Local Government Division | Department of Premier and Cabinet 12
Figure 4:
Reporting
period Brighton Burnie City
Central
Coast
Devonport
City
West
Tamar
Urban Small
Councils
Average
All
Tasmanian
Councils
Average
$ $ $ $ $ $ $
2009-10 910 1,822 1,052 1,766 1,082 1,327 1,122
2014-15 1,056 2,202 1,252 2,196 1,332 1,608 1,410
2017-18 1,144 2,303 1,379 2,206 1,509 1,708 1,566
2018-19 1,216 2,313 1,437 2,191 1,572 1,746 1,606
Overall rate increase as a percentage between 2009-10 and 2018-19
33.7% 27.0% 36.5% 24.0% 45.3% 31.6% 43.1%
12 month rate increase as a percentage between 2017-18 and 2018-19
6.3% 0.4% 4.2% -0.7% 4.2% 2.2% 2.5%
Compound annual rate increase as a percentage between 2009-10 and 2018-19
3.7% 3.0% 4.0% 2.7% 4.8% 3.5% 4.6%
Average rate of all rateable properties
Average rate
Urban small councils
0
500
1,000
1,500
2,000
2,500
2009-10 2014-15 2017-18 2018-19
Brighton Burnie City
Central Coast Devonport City
West Tamar Urban Small Councils Average
All Tasmanian Councils Average
$

LG D A T A | Data | Analysis | Transparency | Accountability
Rates 2018-19 | Local Government Division | Department of Premier and Cabinet 13
Figure 5:
Reporting
period
Derwent
Valley Huon Valley Latrobe
Meander
Valley
Northern
Midlands Sorell
Waratah-
Wynyard
RAVL
Councils
Average
All
Tasmanian
Councils
Average
$ $ $ $ $ $ $ $ $
2009-10 967 779 928 927 1,014 1,040 980 948 1,122
2014-15 1,145 1,020 1,085 1,057 1,358 1,281 1,334 1,183 1,410
2017-18 1,383 1,170 1,175 1,182 1,489 1,402 1,436 1,320 1,566
2018-19 1,425 1,232 1,154 1,247 1,540 1,533 1,445 1,368 1,606
Overall rate increase as a percentage between 2009-10 and 2018-19
47.3% 58.1% 24.4% 34.5% 51.8% 47.4% 47.5% 44.3% 43.1%
12 month rate increase as a percentage between 2017-18 and 2018-19
3.0% 5.3% -1.8% 5.5% 3.4% 9.4% 0.6% 3.6% 2.5%
Compound annual rate increase as a percentage between 2009-10 and 2018-19
5.0% 5.9% 2.8% 3.8% 5.4% 5.0% 5.0% 4.7% 4.6%
Average rate of all rateable properties
Average rate
Rural agricultural very large (RAVL) councils
0
200
400
600
800
1,000
1,200
1,400
1,600
1,800
2009-10 2014-15 2017-18 2018-19
Derwent Valley Huon Valley
Latrobe Meander Valley
Northern Midlands Sorell
Waratah-Wynyard RAVL Councils Average
All Tasmanian Councils Average
$

LG D A T A | Data | Analysis | Transparency | Accountability
Rates 2018-19 | Local Government Division | Department of Premier and Cabinet 14
Figure 6:
Reporting
period
Break
O'Day
Circular
Head Dorset
George
Town Kentish
Southern
Midlands
RAL
Councils
Average
All
Tasmanian
Councils
Average
$ $ $ $ $ $ $ $
2009-10 929 1,244 1,052 1,326 1,122 925 1,100 1,122
2014-15 1,151 1,472 1,254 1,637 1,289 1,226 1,338 1,410
2017-18 1,355 1,587 1,364 1,857 1,460 1,419 1,507 1,566
2018-19 1,440 1,629 1,383 1,883 1,447 1,473 1,542 1,606
Overall rate increase as a percentage between 2009-10 and 2018-19
55.0% 31.0% 31.5% 42.0% 29.0% 59.3% 40.3% 43.1%
12 month rate increase as a percentage between 2017-18 and 2018-19
6.3% 2.6% 1.4% 1.4% -0.9% 3.8% 2.4% 2.5%
Compound annual rate increase as a percentage between 2009-10 and 2018-19
5.6% 3.4% 3.5% 4.5% 3.2% 6.0% 4.3% 4.6%
Average rate of all rateable properties
Average rate
Rural agricultural large (RAL) councils
0
200
400
600
800
1,000
1,200
1,400
1,600
1,800
2,000
2009-10 2014-15 2017-18 2018-19
Break O'Day Circular Head
Dorset George Town
Kentish Southern Midlands
RAL Councils Average All Tasmanian Councils Average
$

LG D A T A | Data | Analysis | Transparency | Accountability
Rates 2018-19 | Local Government Division | Department of Premier and Cabinet 15
Figure 7:
Reporting
period
Central
Highlands Flinders
Glamorgan-
Spring Bay King Island Tasman West Coast
RASM
Councils
Average
All
Tasmanian
Councils
Average
$ $ $ $ $ $ $ $
2009-10 666 820 966 1,008 836 1,073 895 1,122
2014-15 848 1,208 1,163 1,188 1,162 1,445 1,169 1,410
2017-18 932 1,289 1,293 1,477 1,404 1,631 1,338 1,565
2018-19 922 1,296 1,293 1,477 1,366 1,634 1,323 1,606
Overall rate increase as a percentage between 2009-10 and 2018-19
38.4% 58.2% 33.8% 46.5% 63.3% 52.2% 47.8% 43.1%
12 month rate increase as a percentage between 2017-18 and 2018-19
-1.0% 0.6% 0.0% 0.0% -2.7% 0.2% -1.1% 2.6%
Compound annual rate increase as a percentage between 2009-10 and 2018-19
4.1% 5.9% 3.7% 4.9% 6.3% 5.4% 5.0% 4.6%
Average rate of all rateable properties
Average rate
Rural agricultural, small and medium (RASM) councils
0
200
400
600
800
1,000
1,200
1,400
1,600
1,800
2009-10 2014-15 2017-18 2018-19
Central Highlands Flinders
Glamorgan-Spring Bay King Island
Tasman West Coast
RASM Councils Average All Tasmanian Councils Average
$
LG D A T A | Data | Analysis | Transparency | Accountability
Rates 2018-19 | Local Government Division | Department of Premier and Cabinet 16
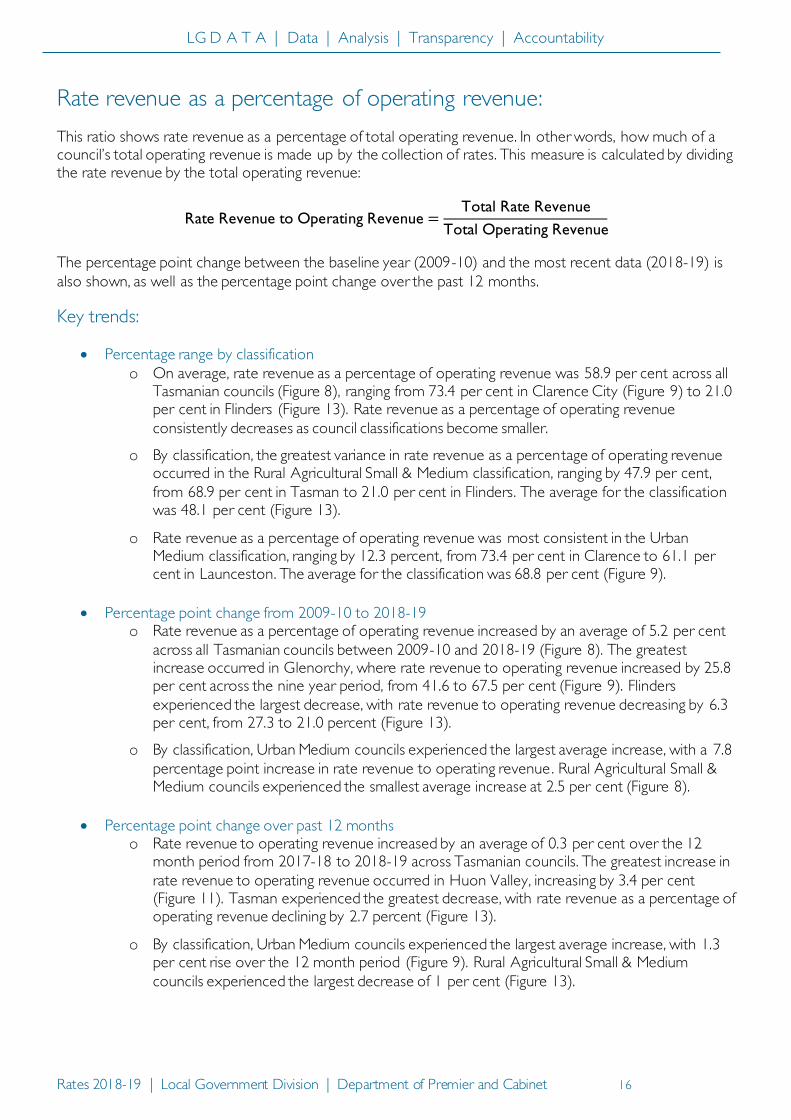
Rate revenue as a percentage of operating revenue:
This ratio shows rate revenue as a percentage of total operating revenue. In other words, how much of a council’s total operating revenue is made up by the collection of rates. This measure is calculated by dividing the rate revenue by the total operating revenue:
Rate Revenue to Operating Revenue =Total Rate Revenue
Total Operating Revenue
The percentage point change between the baseline year (2009-10) and the most recent data (2018-19) is
also shown, as well as the percentage point change over the past 12 months.
Key trends:
Percentage range by classification
o On average, rate revenue as a percentage of operating revenue was 58.9 per cent across all Tasmanian councils (Figure 8), ranging from 73.4 per cent in Clarence City (Figure 9) to 21.0 per cent in Flinders (Figure 13). Rate revenue as a percentage of operating revenue
consistently decreases as council classifications become smaller.
o By classification, the greatest variance in rate revenue as a percentage of operating revenue occurred in the Rural Agricultural Small & Medium classification, ranging by 47.9 per cent,
from 68.9 per cent in Tasman to 21.0 per cent in Flinders. The average for the classification was 48.1 per cent (Figure 13).
o Rate revenue as a percentage of operating revenue was most consistent in the Urban Medium classification, ranging by 12.3 percent, from 73.4 per cent in Clarence to 61.1 per cent in Launceston. The average for the classification was 68.8 per cent (Figure 9).
Percentage point change from 2009-10 to 2018-19 o Rate revenue as a percentage of operating revenue increased by an average of 5.2 per cent
across all Tasmanian councils between 2009-10 and 2018-19 (Figure 8). The greatest increase occurred in Glenorchy, where rate revenue to operating revenue increased by 25.8 per cent across the nine year period, from 41.6 to 67.5 per cent (Figure 9). Flinders
experienced the largest decrease, with rate revenue to operating revenue decreasing by 6.3 per cent, from 27.3 to 21.0 percent (Figure 13).
o By classification, Urban Medium councils experienced the largest average increase, with a 7.8
percentage point increase in rate revenue to operating revenue. Rural Agricultural Small & Medium councils experienced the smallest average increase at 2.5 per cent (Figure 8).
Percentage point change over past 12 months o Rate revenue to operating revenue increased by an average of 0.3 per cent over the 12
month period from 2017-18 to 2018-19 across Tasmanian councils. The greatest increase in
rate revenue to operating revenue occurred in Huon Valley, increasing by 3.4 per cent (Figure 11). Tasman experienced the greatest decrease, with rate revenue as a percentage of operating revenue declining by 2.7 percent (Figure 13).
o By classification, Urban Medium councils experienced the largest average increase, with 1.3 per cent rise over the 12 month period (Figure 9). Rural Agricultural Small & Medium
councils experienced the largest decrease of 1 per cent (Figure 13).

LG D A T A | Data | Analysis | Transparency | Accountability
Rates 2018-19 | Local Government Division | Department of Premier and Cabinet 17
Rate revenue as a percentage of operating revenue: all classifications
Figure 8:
Reporting
period
Urban
Medium
Councils
Average
Urban Small
Councils
Average
RAVL
Councils
Average
RAL
Councils
Average
RASM
Councils
Average
All
Tasmanian
Councils
Average
% % % % % %
2009-10 59.0 57.4 53.2 54.8 45.6 53.7
2014-15 64.7 61.3 55.4 54.2 49.5 56.7
2017-18 65.5 63.8 58.0 58.5 49.1 58.6
2018-19 66.8 64.7 58.7 58.3 48.1 58.9
Overall percentage point change between 2009-10 and 2018-19
7.8 7.3 5.5 3.5 2.5 5.2
12 month percentage point change between 2017-18 and 2018-19
1.3 0.9 0.7 -0.2 -1.0 0.3
-1 -1 -1 -1 -1 -1
Rate revenue to operating revenue
Council Classifications
Rate revenue as a percentage of total operating revenue
0
10
20
30
40
50
60
70
80
2009-10 2014-15 2017-18 2018-19
Urban Medium Councils Average Urban Small Councils Average
RAVL Councils Average RAL Councils Average
RASM Councils Average All Tasmanian Councils Average %
%

LG D A T A | Data | Analysis | Transparency | Accountability
Rates 2018-19 | Local Government Division | Department of Premier and Cabinet 18
Rate revenue as a percentage of operating revenue: councils by classification
Figure 9:
Reporting
period
Clarence
City
Glenorchy
City Hobart City Kingborough
Launceston
City
Urban
Medium
Councils
Average
All
Tasmanian
Councils
Average
% % % % % % %
2009-10 73.5 41.6 61.0 58.1 60.6 59.0 53.7
2014-15 73.2 61.4 62.8 64.6 61.7 64.7 56.7
2017-18 72.9 64.3 63.8 66.4 60.3 65.5 58.6
2018-19 73.4 67.5 63.1 69.1 61.1 66.8 58.9
Percentage point change between 2009-10 and 2018-19
-0.1 25.8 2.1 11.1 0.5 7.8 5.2
12 month percentage point change between 2017-18 and 2018-19
0.5 3.2 -0.7 2.7 0.8 1.3 0.3
Rate revenue to operating revenue
Urban medium councils
Rate revenue as a percentage of total operating revenue
0
10
20
30
40
50
60
70
80
2009-10 2014-15 2017-18 2018-19
Clarence City Glenorchy City
Hobart City Kingborough
Launceston City Urban Medium Councils Average
All Tasmanian Councils Average
%

LG D A T A | Data | Analysis | Transparency | Accountability
Rates 2018-19 | Local Government Division | Department of Premier and Cabinet 19
Figure 10:
Reporting
period Brighton Burnie City
Central
Coast
Devonport
City
West
Tamar
Urban Small
Councils
Average
All
Tasmanian
Councils
Average
% % % % % % %
2009-10 50.3 54.0 54.3 68.7 59.8 57.4 53.7
2014-15 58.0 56.5 54.5 68.2 69.1 61.3 56.7
2017-18 61.5 66.5 54.9 67.4 68.8 63.8 58.6
2018-19 62.6 67.7 55.3 68.2 69.5 64.7 58.9
Percentage point change between 2009-10 and 2018-19
12.3 13.8 1.0 -0.5 9.7 7.3 5.2
12 month percentage point change between 2017-18 and 2018-19
1.1 1.2 0.4 0.8 0.7 0.9 0.3
Rate revenue to operating revenue
Urban small councils
Rate revenue as a percentage of total operating revenue
0
10
20
30
40
50
60
70
80
2009-10 2014-15 2017-18 2018-19
Brighton Burnie City
Central Coast Devonport City
West Tamar Urban Small Councils Average
All Tasmanian Councils Average
%

LG D A T A | Data | Analysis | Transparency | Accountability
Rates 2018-19 | Local Government Division | Department of Premier and Cabinet 20
Figure 11:
Reporting
period
Derwent
Valley Huon Valley Latrobe
Meander
Valley
Northern
Midlands Sorell
Waratah-
Wynyard
RAVL
Councils
Average
All
Tasmanian
Councils
Average
% % % % % % % % %
2009-10 55.1 40.6 53.5 52.9 49.4 64.3 57.1 53.2 53.7
2014-15 50.1 47.4 56.2 54.3 56.1 63.7 60.0 55.4 56.7
2017-18 53.4 50.4 53.5 59.5 58.5 72.6 58.0 58.0 58.6
2018-19 54.7 53.8 52.9 60.7 57.5 70.4 61.0 58.7 58.9
Percentage point change between 2009-10 and 20118-19
-0.4% 13.3% -0.6% 7.9% 8.2% 6.1% 4.0% 5.5% 5.2%
12 month percentage point change between 2017-18 and 2018-19
1.3 3.4 -0.6 1.2 -1.0 -2.2 3.0 0.7 0.3
Rate revenue as a percentage of total operating revenue
Rate revenue to operating revenue
Rural agricultural very large (RAVL) councils
0
10
20
30
40
50
60
70
80
2009-10 2014-15 2017-18 2018-19
Derwent Valley Huon Valley
Latrobe Meander Valley
Northern Midlands Sorell
Waratah-Wynyard RAVL Councils Average
All Tasmanian Councils Average
%

LG D A T A | Data | Analysis | Transparency | Accountability
Rates 2018-19 | Local Government Division | Department of Premier and Cabinet 21
Figure 12:
Reporting
period
Break
O'Day
Circular
Head Dorset
George
Town Kentish
Southern
Midlands
RAL
Councils
Average
All
Tasmanian
Councils
Average
% % % % $ % % %
2009-10 58.4 50.4 50.4 67.4 54.7 47.8 54.8 53.7
2014-15 61.1 48.3 53.0 68.9 50.2 43.8 54.2 56.7
2017-18 63.2 56.0 56.6 74.0 52.1 49.2 58.5 58.6
2018-19 65.2 56.5 56.5 72.9 50.8 48.0 58.3 58.9
Percentage point change between 2009-10 and 2017-18
6.9% 6.2% 6.0% 5.5% -3.9% 0.2% 3.5% 5.2%
12 month percentage point change between 2017-18 and 2018-19
2.0 0.5 -0.1 -1.1 -1.3 -1.2 -0.2 0.3
Rate revenue to operating revenue
Rural agricultural large (RAL) councils
Rate revenue as a percentage of total operating revenue
0
10
20
30
40
50
60
70
80
2009-10 2014-15 2017-18 2018-19
Break O'Day Circular Head
Dorset George Town
Kentish Southern Midlands
RAL Councils Average All Tasmanian Councils Average
%

LG D A T A | Data | Analysis | Transparency | Accountability
Rates 2018-19 | Local Government Division | Department of Premier and Cabinet 22
Figure 13:
Reporting
period
Central
Highlands Flinders
Glamorgan-
Spring Bay King Island Tasman West Coast
RASM
Councils
Average
All
Tasmanian
Councils
Average
% % % $ % % % %
2009-10 45.5 27.3 58.2 29.7 58.1 55.1 45.6 53.7
2014-15 48.3 33.5 55.8 31.3 68.4 59.8 49.5 56.7
2017-18 50.6 20.3 57.6 33.9 71.6 60.4 49.1 58.6
2018-19 48.6 21.0 57.1 32.3 68.9 60.5 48.1 58.9
Percentage point change between 2009-10 and 2017-18
3.1% -6.3% -1.1% 2.6% 10.8% 5.4% 2.5% 5.2%
12 month percentage point change between 2017-18 and 2018-19
-2.0 0.7 -0.5 -1.6 -2.7 0.1 -1.0 0.3
Rate revenue to operating revenue
Rural agricultural, small and medium (RASM) councils
Rate revenue as a percentage of total operating revenue
0
10
20
30
40
50
60
70
80
2009-10 2014-15 2017-18 2018-19
Central Highlands Flinders
Glamorgan-Spring Bay King Island
Tasman West Coast
RASM Councils Average All Tasmanian Councils Average
%

LG D A T A | Data | Analysis | Transparency | Accountability
Rates 2018-19 | Local Government Division | Department of Premier and Cabinet 23
Average operating costs per rateable property:
This measure shows the average amount each council spends per rateable property in its municipality to provide such services and infrastructure to its ratepayers.
Average Operating costs per rateable property =Total operating costs
Total number of rateable properties
Figures 14 - 19 also show the change over time as a percentage between the baseline year (2009-10) and the latest data (2018-19), as well as the change over the past 12 months.
Key trends:
Average rate and range by classification o The average amount of operating costs per ratable property is $2,889 across all Tasmanian
councils (Figure 14), ranging from $8,818 in Flinders (Figure 19) to $1,692 in Tasman (Figure 19).
o Figure 14 shows that for council classifications with a population greater than 10,000,
operating costs per rateable property decrease as councils become smaller. However, for smaller council classifications with a population less than 10,000, operating costs per rateable property increase as councils become smaller and more rural.
o By Classification, the greatest variance in the average amount of operating costs per rateable property occurs in the Rural Agricultural Small & Medium classification, where operating
costs vary by $7,127, from $1,692 per property in Tasman, to $8,818 per property in Flinders (Figure 19).
o The average operating costs per rateable property is most consistent in the Rural Agricultural Very Large classification, varying by $591, from $1,973 in Meander Valley to $2,564 in Derwent Valley (Figure 17).
Percentage point change from 2009-10 to 2018-19 o Operating costs per rateable property increased by an average of 30.2 per cent across all
Tasmanian councils between 2009-10 and 2018-19 (Figure 14). The greatest increase
occurred in Flinders, which experienced a 176.8 per cent increase, from $3,186 to $8,818 (Figure 19). Central Highlands experienced the greatest decrease, with operating costs per rateable property decreasing by 23.3 per cent, from $2,430 to $1,865 (Figure 19).
o By classification, Rural Agricultural Small & Medium councils experienced the largest average increase at 62.3 per cent (Figure 19). Urban Small councils experienced the smallest average
increase, at 15.5 per cent (Figure 16).
Percentage change over past 12 months o The average operating costs per rateable property has increased by 4.1 per cent across all
Tasmanian councils in the 12 month period from 2017-18 to 2018-19 (Figure 14). The
greatest increase occurred in King Island, where operating costs increased by 17.2 per cent per rateable property, from $3,596 to $5,405 (Figure 19). Tasman experienced the greatest
decrease, where operating costs decreased by 10.9 per cent, from $1,899 to $1,692 (Figure 19).
o By classification, Rural Agricultural Small & Medium councils experienced the largest average increase, at 9.3 per cent (Figure 19). Rural Agricultural Very Large councils experienced the largest average decrease, with one per cent decrease over the 12 month period (Figure 19).

LG D A T A | Data | Analysis | Transparency | Accountability
Rates 2018-19 | Local Government Division | Department of Premier and Cabinet 24
Average operating costs per rateable property: all classifications
Figure 14:
Reporting
period
Urban
Medium
Councils
Average
Urban Small
Councils
Average
RAVL
Councils
Average
RAL
Councils
Average
RASM
Councils
Average
All
Tasmanian
Councils
Average
$ $ $ $ $ $
2009-10 2,651 2,343 1,835 2,102 2,319 2,219
2014-15 3,017 2,530 2,045 2,441 2,656 2,506
2017-18 3,129 2,579 2,279 2,558 3,445 2,776
2018-19 3,292 2,707 2,257 2,568 3,764 2,889
Overall change as a percentage between 2009-10 to 2018-19
24.2% 15.5% 23.0% 22.2% 62.3% 30.2%
12 month change as a percentage between 2017-18 and 2018-19
5.2% 5.0% -1.0% 0.4% 9.3% 4.1%
Compound annual increase as a percentage between 2009-10 to 2018-19
2.7% 1.8% 2.6% 2.5% 6.2% 3.4%
Operating costs per property
Council Classifications
The average amount of operating costs per rateable property
0
500
1,000
1,500
2,000
2,500
3,000
3,500
4,000
2009-10 2014-15 2017-18 2018-19
Urban Medium Councils Average Urban Small Councils Average
RAVL Councils Average RAL Councils Average
RASM Councils Average All Tasmanian Councils Average
$
LG D A T A | Data | Analysis | Transparency | Accountability
Rates 2018-19 | Local Government Division | Department of Premier and Cabinet 25
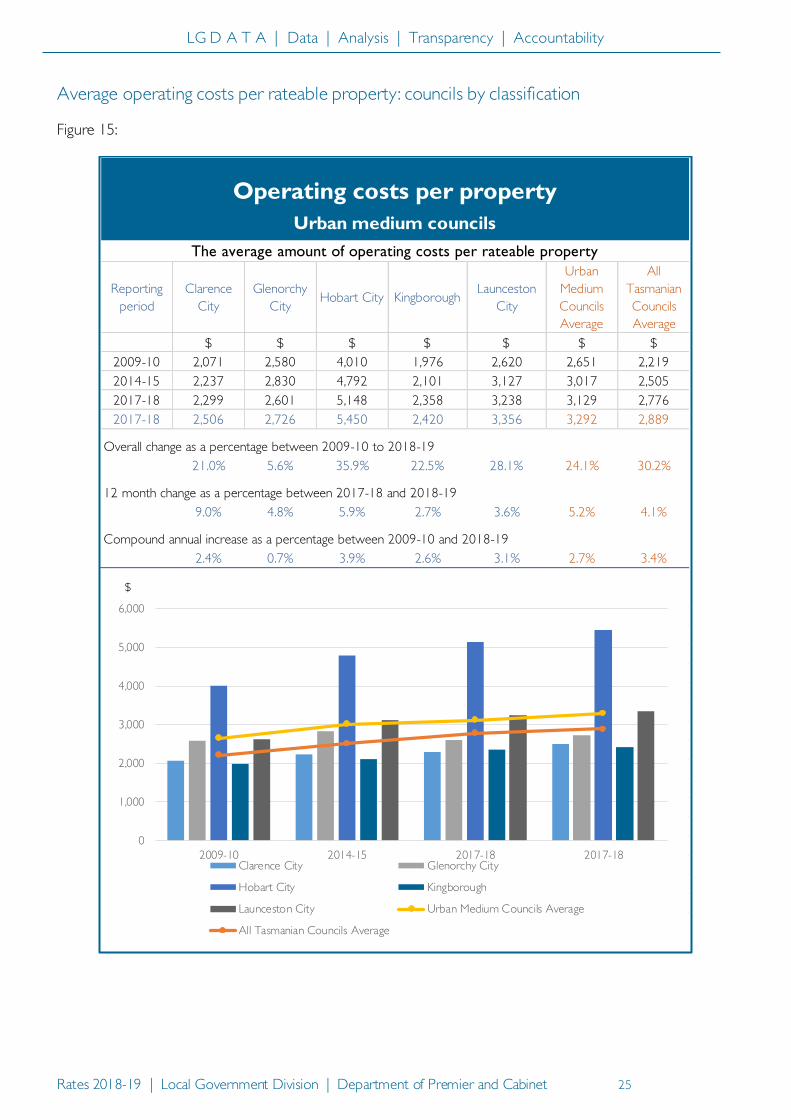
Average operating costs per rateable property: councils by classification
Figure 15:
Reporting
period
Clarence
City
Glenorchy
City Hobart City Kingborough
Launceston
City
Urban
Medium
Councils
Average
All
Tasmanian
Councils
Average
$ $ $ $ $ $ $
2009-10 2,071 2,580 4,010 1,976 2,620 2,651 2,219
2014-15 2,237 2,830 4,792 2,101 3,127 3,017 2,505
2017-18 2,299 2,601 5,148 2,358 3,238 3,129 2,776
2017-18 2,506 2,726 5,450 2,420 3,356 3,292 2,889
Overall change as a percentage between 2009-10 to 2018-19
21.0% 5.6% 35.9% 22.5% 28.1% 24.1% 30.2%
12 month change as a percentage between 2017-18 and 2018-19
9.0% 4.8% 5.9% 2.7% 3.6% 5.2% 4.1%
Compound annual increase as a percentage between 2009-10 and 2018-19
2.4% 0.7% 3.9% 2.6% 3.1% 2.7% 3.4%
Operating costs per property
Urban medium councils
The average amount of operating costs per rateable property
0
1,000
2,000
3,000
4,000
5,000
6,000
2009-10 2014-15 2017-18 2017-18Clarence City Glenorchy City
Hobart City Kingborough
Launceston City Urban Medium Councils Average
All Tasmanian Councils Average
$

LG D A T A | Data | Analysis | Transparency | Accountability
Rates 2018-19 | Local Government Division | Department of Premier and Cabinet 26
Figure 16:
Reporting
period Brighton Burnie City
Central
Coast
Devonport
City
West
Tamar
Urban Small
Councils
Average
All
Tasmanian
Councils
Average
$ $ $ $ $ $ $
2009-10 1,619 3,499 2,091 2,904 1,603 2,343 2,219
2014-15 1,753 3,901 2,178 3,025 1,794 2,530 2,505
2017-18 1,911 3,413 2,423 3,152 1,998 2,579 2,776
2018-19 1,957 3,547 2,632 3,333 2,064 2,707 2,889
Change as a percentage between 2009-10 to 2018-19
20.9% 1.4% 25.8% 14.8% 28.7% 15.5% 30.2%
12 month change as a percentage between 2017-18 and 2018-19
2.4% 3.9% 8.6% 5.7% 3.3% 5.0% 4.1%
Compound annual increase as a percentage between 2009-10 and 2018-19
2.4% 0.2% 2.9% 1.7% 3.2% 1.8% 3.4%
Operating costs per property
Urban small councils
The average amount of operating costs per rateable property
0
500
1,000
1,500
2,000
2,500
3,000
3,500
4,000
4,500
2009-10 2014-15 2017-18 2018-19
Brighton Burnie City
Central Coast Devonport City
West Tamar Urban Small Councils Average
All Tasmanian Councils Average
$

LG D A T A | Data | Analysis | Transparency | Accountability
Rates 2018-19 | Local Government Division | Department of Premier and Cabinet 27
Figure 17:
Reporting
period
Derwent
Valley Huon Valley Latrobe
Meander
Valley
Northern
Midlands Sorell
Waratah-
Wynyard
RAVL
Councils
Average
All
Tasmanian
Councils
Average
$ $ $ $ $ $ $ $ $
2009-10 1,905 1,915 1,665 1,605 2,309 1,543 1,902 1,835 2,219
2014-15 2,214 2,016 1,840 1,821 2,478 1,678 2,271 2,045 2,505
2017-18 2,643 2,179 2,099 1,864 2,537 2,212 2,420 2,279 2,776
2018-19 2,564 2,322 2,058 1,973 2,548 2,042 2,293 2,257 2,889
Overall change as a percentage between 2009-10 to 2017-18
34.6% 21.2% 23.6% 22.9% 10.4% 32.4% 20.5% 23.0% 30.2%
12 month change as a percentage between 2017-18 and 2018-19
-3.0% 6.5% -2.0% 5.9% 0.4% -7.7% -5.2% -1.0% 4.1%
Compound annual increase as a percentage between 2009-10 and 2018-19
3.8% 2.4% 2.7% 2.6% 1.2% 3.6% 2.4% 2.6% 3.4%
Operating costs per property
Rural agricultural very large (RAVL) councils
The average amount of operating costs per rateable property
0
500
1,000
1,500
2,000
2,500
3,000
3,500
2009-10 2014-15 2017-18 2018-19
Derwent Valley Huon Valley
Latrobe Meander Valley
Northern Midlands Sorell
Waratah-Wynyard RAVL Councils Average
All Tasmanian Councils Average
$

LG D A T A | Data | Analysis | Transparency | Accountability
Rates 2018-19 | Local Government Division | Department of Premier and Cabinet 28
Figure 18:
Reporting
period
Break
O'Day
Circular
Head Dorset
George
Town Kentish
Southern
Midlands
RAL
Councils
Average
All
Tasmanian
Councils
Average
$ $ $ $ $ $ $ $
2009-10 1,836 2,449 2,059 2,037 2,037 2,198 2,102 2,219
2014-15 1,953 2,828 2,170 2,286 2,632 2,778 2,441 2,505
2017-18 2,037 2,819 2,229 2,532 2,705 3,023 2,558 2,776
2018-19 2,053 2,892 2,169 2,491 2,664 3,140 2,568 2,889
Overall change as a percentage between 2009-10 to 2017-18
11.8% 18.1% 5.4% 22.3% 30.8% 42.9% 22.2% 30.2%
12 month change as a percentage point between 2017-18 and 2018-19
0.8% 2.6% -2.7% -1.6% -1.5% 3.9% 0.4% 4.1%
Compound annual growth as a percentage between 2009-10 and 2017-18
1.4% 2.1% 0.7% 2.6% 3.4% 4.6% 2.5% 3.4%
Operating costs per property
Rural agricultural large (RAL) councils
The average amount of operating costs per rateable property
0
500
1,000
1,500
2,000
2,500
3,000
3,500
2009-10 2014-15 2017-18 2018-19
Break O'Day Circular Head
Dorset George Town
Kentish Southern Midlands
RAL Councils Average All Tasmanian Councils Average
$

LG D A T A | Data | Analysis | Transparency | Accountability
Rates 2018-19 | Local Government Division | Department of Premier and Cabinet 29
Figure 19:
Reporting
period
Central
Highlands Flinders
Glamorgan-
Spring Bay King Island Tasman West Coast
RASM
Councils
Average
All
Tasmanian
Councils
Average
$ $ $ $ $ $ $ $
2009-10 2,430 3,186 1,556 3,596 1,220 1,927 2,319 2,219
2014-15 1,810 4,148 2,113 3,899 1,488 2,477 2,656 2,505
2017-18 1,819 7,618 2,130 4,612 1,899 2,592 3,445 2,776
2018-19 1,865 8,818 2,199 5,405 1,692 2,604 3,764 2,889
Overall change as a percentage between 2009-10 to 2018-19
-23.3% 176.8% 41.3% 50.3% 38.7% 35.1% 62.3% 30.2%
12 month change as a percentage between 2017-18 and 2018-19
2.5% 15.8% 3.2% 17.2% -10.9% 0.5% 9.3% 4.1%
Compound annual increase as a percentage between 2009-10 and 2018-19
-3.3% 13.6% 4.4% 5.2% 4.2% 3.8% 6.2% 3.4%
Operating costs per property
Rural agricultural, small and medium (RASM) councils
The average amount of operating costs per rateable property
0
1,000
2,000
3,000
4,000
5,000
6,000
7,000
8,000
9,000
2009-10 2014-15 2017-18 2018-19
Central Highlands Flinders
Glamorgan-Spring Bay King Island
Tasman West Coast
RASM Councils Average All Tasmanian Councils Average
$

Department of Premier and Cabinet
15 Murray Street Hobart TAS 7000
P (03) 6232 7022 www.dpac.tas.gov.au