
(LF) Fund of Funds (LF) Fund ofFunds - eurobankam.gr · (LF) Fund of Funds A mutual investment fund...
40
(LF) Fund of Funds A mutual investment fund organised under the laws of the Grand Duchy of Luxembourg Annual Report Audited December 31, 2016 RCS Number: B115125 RCSK Number: K1662 No subscription can be received on the basis of financial reports. Subscriptions are only valid if made on the basis of the current prospectus accompanied by the latest annual report and the most recent semi-annual report, if published thereafter. Past performance is not necessarily an indication of future performance. (LF) Fund of Funds A mutual investment fund organised under the laws of the Grand Duchy of Luxembourg Annual Report Audited December 31, 2016 RCS Number: Bl15125 RCSK Number: K1662 No subscription can be received on the basis of financial reports. Subscriptions are only Valid if made on the basis of the current prospectus accompanied by the latest annual report and the most recent semi—annual report, if published thereafter. Past performance is not necessarily an indication of future performance.
Transcript of (LF) Fund of Funds (LF) Fund ofFunds - eurobankam.gr · (LF) Fund of Funds A mutual investment fund...
(LF) Fund of Funds A mutual investment fund organised under the laws
of the Grand Duchy of Luxembourg
Annual Report Audited
December 31, 2016
RCS Number: B115125 RCSK Number: K1662
No subscription can be received on the basis of financial reports. Subscriptions are only valid if made on the basis of the current prospectus accompanied by the latest annual report and the most recent semi-annual report, if published thereafter. Past performance is not necessarily an indication of future performance.
(LF) Fund of FundsA mutual investment fund organised under the laws
of the Grand Duchy of Luxembourg
Annual ReportAudited
December 31, 2016
RCS Number: Bl15125RCSK Number: K1662
No subscription can be received on the basis of financial reports.Subscriptions are only Valid if made on the basis of the currentprospectus accompanied by the latest annual report and the most recentsemi—annual report, if published thereafter. Past performance is notnecessarily an indication of future performance.
2
Table of Contents Organisation of the Fund 3 Board of Directors of the Management Company 4 Activity Report 5 Audit Report 13 Statement of Net Assets 15 Statement of Operations 17 Statement of Changes in Net Assets 19 Schedule of investments
• (LF) Fund of Funds - Balanced Blend Europe 21 • (LF) Fund of Funds - Equity Blend 22 • (LF) Fund of Funds - Global Emerging Markets 23 • (LF) Fund of Funds - Balanced Blend Global 24 • (LF) Fund of Funds - Real Estate 25 • (LF) Fund of Funds - Dynamic Fixed Income 26 • (LF) Fund of Funds - Global Low 27 • (LF) Fund of Funds - Global Medium 28 • (LF) Fund of Funds - Global High 29 • (LF) Fund of Funds - Balanced Blend US 30 • (LF) Fund of Funds - Tactical Allocation 31
Notes to the financial statements 32 Unaudited information 39
Table of Contents
Organisation of the Fund
Board of Directors of the Management Company
Activity Report
Audit Report
Statement ofNet Assets
Statement of Operations
Statement of Changes in Net Assets
Schedule of investments
(LF) Fund of Funds — Balanced Blend Europe(LF) Fund of Funds — Equity Blend(LF) Fund of Funds — Global Emerging Markets(LF) Fund of Funds — Balanced Blend Global(LF) Fund of Funds — Real Estate(LF) Fund of Funds — Dynamic Fixed Income(LF) Fund of Funds — Global Low(LF) Fund of Funds — Global Medium(LF) Fund of Funds — Global High(LF) Fund of Funds — Balanced Blend US(LF) Fund of Funds — Tactical Allocation
Notes to the financial statements
Unaudited information
13
15
17
19
2122232425262728293031
32
39

3
(LF) Fund of Funds Organisation of the Fund Management Company Eurobank Fund Management Company (Luxembourg) S.A. 5, rue Jean Monnet L-2180 Luxembourg Grand Duchy of Luxembourg
Custodian, Administrative, Registrar, Transfer, Luxembourg Paying and Domiciliation Agent Eurobank Private Bank Luxembourg S.A. 5, rue Jean Monnet L-2180 Luxembourg Grand Duchy of Luxembourg Investment Manager Eurobank Asset Management Mutual Fund Management Company S.A. 10, Stadiou Str., GR 105 64 Athens Greece
Auditor PricewaterhouseCoopers, Société coopérative 2, rue Gerhard Mercator B.P. 1443 L-1014 Luxembourg Grand Duchy of Luxembourg Distributor Eurobank Ergasias S.A. 8, Othonos Street 10557 Athens Greece
(LF) Fund of FundsOrganisation of the Fund
Management CompanyEurobank Fund Management Company (Luxembourg) S.A.5, rue Jean MonnetL—2 1 80 LuxembourgGrand Duchy of Luxembourg
Custodian, Administrative, Registrar, Transfer, Luxembourg Paying andDomiciliation AgentEurobank Private Bank Luxembourg S.A.5, rue Jean MonnetL—2 1 80 LuxembourgGrand Duchy of Luxembourg
Investment ManagerEurobank Asset Management Mutual Fund Management Company S.A.10, Stadiou Str.,GR 105 64 AthensGreece
AuditorPricewaterhouseCoopers, Société coopérative2, rue Gerhard MercatorB.P. 1443L—1014 LuxembourgGrand Duchy of Luxembourg
DistributorEurobank Ergasias S.A.8, Othonos Street10557 AthensGreece

4
(LF) Fund of Funds Board of Directors of the Management Company Mr. Theofanis Mylonas Chairman Chief Executive Officer Chairman of the Board of Directors Eurobank Asset Management Mutual Fund Management Company S.A., Greece Mr. Agamemnon Kotrozos Vice Chairman Chief executive Officer Eurobank Fund Management Company (Luxembourg) S.A., Grand Duchy of Luxembourg Mr. Georgios Vlachakis Director Managing Director Eurobank Fund Management Company (Luxembourg) S.A., Grand Duchy of Luxembourg Mr. Dimosthenis Archontidis Until October 17th
, 2016 Director General Manager Global Markets & Wealth Management Eurobank Ergasias S.A., Greece Mrs. Eleni Koritsa Director Deputy Chief Executive Officer Eurobank Asset Management Mutual Fund Management Company S.A., Greece
(LF) Fund of FundsBoard of Directors of the Management Company
Mr. Theofanis Mylonas ChairmanChief Executive Offi cerChairman of the Board of DirectorsEurobank Asset Management Mutual Fund Management Company S.A.,Greece
Mr. Agamemnon Kotrozos Vice ChairmanChief executive Offi cerEurobank Fund Management Company (Luxembourg) S.A.,Grand Duchy of Luxembourg
Mr. Georgios Vlachakis DirectorManaging DirectorEurobank Fund Management Company (Luxembourg) S.A.,Grand Duchy of Luxembourg
Mr. Dimosthenis ArchontidisUntil October 17“: 2016 DirectorGeneral Manager Global Markets & Wealth ManagementEurobank Ergasias S.A.,Greece
Mrs. Eleni Koritsa DirectorDeputy Chief Executive Offi cerEurobank Asset Management Mutual Fund Management Company S.A.,Greece

5
Activity Report As at December 31, 2016
(LF) Fund of Funds - Balanced Blend Europe
The defining moments of 2016 were the global growth scare in January-February, the subsequent recovery of equities and commodities in spring, the Brexit surprise in June and the surprisingly short market reaction and finally the biggest surprise, the US Presidential elections that triggered an equities rally and a corresponding correction in Government Bonds. The year started with a pronounced correction in equities on fears about earnings, global growth and the limits of monetary policy. Equity markets bottomed in February and then swiftly recovered until May. The Brexit surprise was weathered well at a global level as the short lived correction in European Equities was compensated by the rise of US equities on a more benign rates outlook. The US Presidential elections surprise provided an extra leg to the equities rally as first the US and then the European markets rose on expectations of tax cuts, reflationary infrastructure spending and deregulation. Emerging markets were the surprise outperformer in the equities sphere, helped by the recovery in commodities and the expansionary policy in China. Among the developed markets the US was the clear outperformer, followed by Japan while European equities lagged. Government Bonds in the US and Europe had a strong performance in the first half of the year, however they have gave back their gains in the second half, abruptly so after the US Elections. Investment Grade Bonds feared better than Government Bonds, however the clear outperformer in the Fixed Income sphere were the High Yield Bonds. Commodities experienced a strong recovery in 2016 from the multi-year lows of December, led by rising oil prices. The rise was more evident in the January- April period and then again in November and December helped by the prospect of US reflation and the OPEC deal to control oil production. Real Estate Assets weighed initial fears about rising rates and had yet another positive year. Only the UK Real Estate recorded loses under the combined effects of Brexit and the depreciation of the GBP. The USD was strengthened after the US elections. The (LF) Fund of Funds - Balanced Blend-Europe/Eurobank class returned 0.25% in the year ending 31/12/2016, a lower performance than the composite index used as the fund’s benchmark. The fund was underweight equities throughout the year with the average exposure in equities ranging between 37.0% and 49.2%. The underweight position was reduced in the last quarter. Exposure to Fixed Income was mostly overweight, reaching 56.5% in July, but it was reduced to underweight in the last quarter, falling to 49.2% at the end of the year. We had an underweight position in Government Bonds throughout the year and a consistently overweight position in Non-Government Bonds.
(LF) Fund of Funds - Equity Blend
The year started with a pronounced correction in equities on fears about earnings, Global growth and the limits of monetary policy. Equity markets bottomed in February and then recovered swiftly until May. The Brexit surprise was weathered well at a global level as the short lived correction in European Equities was compensated by the rise of US equities on a more benign rates outlook. The US Presidential elections surprise provided an extra leg to the rally as first the US and then the European Equities rose on expectations of tax cuts, reflationary infrastructure spending and deregulation. Emerging markets were the surprise outperformer in the equities sphere, helped by the recovery in commodities and the expansionary policy in China. Among the developed markets the US was the clear outperformer, followed by Japan while European equities lagged. The (LF) Fund of Funds - Equity Blend/Eurobank class returned 4.55% in the year ending 31/12/2016, a lower performance than the composite index used as the fund’s benchmark (90% MSCI ACWI +10% Eonia). During the year the average exposure was around 90.6% slightly above that of the benchmark. We adopted a cautious approach in the first half of the year on concerns about weak earnings, rising interest rates and slowing EM growth.
Activity ReportAs at December 31, 2016
(LF) Fund of Funds - Balanced Blend Europe
The defining moments of 2016 were the global growth scare in January—February, the subsequentrecovery of equities and commodities in spring, the Brexit surprise in June and the surprisinglyshort market reaction and finally the biggest surprise, the US Presidential elections that triggered anequities rally and a corresponding correction in Government Bonds. The year started with apronounced correction in equities on fears about earnings, global growth and the limits of monetarypolicy. Equity markets bottomed in February and then swiftly recovered until May. The Brexitsurprise was weathered well at a global level as the short lived correction in European Equities wascompensated by the rise of US equities on a more benign rates outlook. The US Presidentialelections surprise provided an extra leg to the equities rally as first the US and then the Europeanmarkets rose on expectations of tax cuts, reflationary infrastructure spending and deregulation.Emerging markets were the surprise outperformer in the equities sphere, helped by the recovery incommodities and the expansionary policy in China. Among the developed markets the US was theclear outperformer, followed by Japan while European equities lagged. Government Bonds in theUS and Europe had a strong performance in the first half of the year, however they have gave backtheir gains in the second half, abruptly so after the US Elections. Investment Grade Bonds fearedbetter than Government Bonds, however the clear outperforrner in the Fixed Income sphere werethe High Yield Bonds. Commodities experienced a strong recovery in 2016 from the multi—yearlows of December, led by rising oil prices. The rise was more evident in the January— April periodand then again in November and December helped by the prospect of US reflation and the OPECdeal to control oil production. Real Estate Assets weighed initial fears about rising rates and had yetanother positive year. Only the UK Real Estate recorded loses under the combined effects of Brexitand the depreciation of the GBP. The USD was strengthened after the US elections.The (LF) Fund of Funds — Balanced Blend—Europe/Eurobank class returned 0.25% in the yearending 31/ 12/2016, a lower performance than the composite index used as the fund’s benchmark.The fund was underweight equities throughout the year with the average exposure in equitiesranging between 37.0% and 49.2%. The underweight position was reduced in the last quarter.Exposure to Fixed Income was mostly overweight, reaching 56.5% in July, but it was reduced tounderweight in the last quarter, falling to 49.2% at the end of the year. We had an underweightposition in Government Bonds throughout the year and a consistently overweight position in Non-Government Bonds.
(LF) Fund of Funds - Equity Blend
The year started with a pronounced correction in equities on fears about earnings, Global growthand the limits of monetary policy. Equity markets bottomed in February and then recovered swiftlyuntil May. The Brexit surprise was weathered well at a global level as the short lived correction inEuropean Equities was compensated by the rise of US equities on a more benign rates outlook. TheUS Presidential elections surprise provided an extra leg to the rally as first the US and then theEuropean Equities rose on expectations of tax cuts, reflationary infrastructure spending andderegulation. Emerging markets were the surprise outperforrner in the equities sphere, helped by therecovery in commodities and the expansionary policy in China. Among the developed markets theUS was the clear outperformer, followed by Japan while European equities lagged.The (LF) Fund of Funds — Equity Blend/Eurobank class returned 4.55% in the year ending31/12/2016, a lower performance than the composite index used as the fund’s benchmark (90%MSCI ACWI +10% Eonia). During the year the average exposure was around 90.6% slightly abovethat of the benchmark. We adopted a cautious approach in the first half of the year on concernsabout weak earnings, rising interest rates and slowing EM growth.

6
Activity Report As at December 31, 2016 (Continued) (LF) Fund of Funds - Equity Blend (continued)
The underweight position in the first half of the year, especially in the first quarter, had a negative impact on the fund’s performance and accounts for the major part of the underperformance. We had a pronounced underweight stance on Emerging Markets and were underweight US equities. We were overweight Europe equities until the Brexit referendum in Britain. We adopted an overweight stance in July and throughout the second half of the year by adopting an overweight position in Emerging Markets, Japan and after the US elections in the US. We were underweight European equities in the second half.
(LF) Fund of Funds - Global Emerging Markets
2016 was a positive year for Emerging Markets. After a weak beginning of the year emerging markets staged an impressive recovery from February to September. Low valuations and the recovery of oil and commodity prices contributed to a sharp recovery of commodity dependent markets. Brazil was the main outperformer helped by rising iron ore prices and market friendly political developments. Russia outperformed as well on better oil prices and signs of stabilization of the economy. Fears about a slowdown of the Chinese economy did not materialize as government spending and credit growth supported the economy. Chinese equities managed to reverse their steep losses of the beginning of the year. India was an underperformer despite the acceleration of the reform process. Mexico underperformed as well as the prospect of deteriorating trading relations with the US weighed on the market and currency. After the US Elections the prospect of higher US rates and the strong USD led to a sharp correction in Emerging Markets. The main exception was Russia, propped up by the prospect of better US-Russia relations and rising oil prices. The (LF) Fund of Funds - Global Emerging Markets/Eurobank class returned 7.89% in the year ending 31/12/2016, a lower performance than the composite index used as the fund’s benchmark (MSCI Emerging Markets Index). On average, the fund had a 92.1% exposure to EM Equities, with a more pronounced underweight position in the first and the last quarters of the year. The main overweight positions during 2016 were Russia and India while the main underweight positions were Brazil and South Africa. The underweight position in Brazil and the relatively low overall market exposure during the first 4 months of the year were the main reasons for the fund’s underperformance.
(LF) Fund of Funds - Balanced Blend Global
The defining moments of 2016 were the global growth scare in January-February, the subsequent recovery of equities and commodities in spring, the Brexit surprise in June and the surprisingly short market reaction and finally the biggest surprise, the US Presidential elections that triggered an equities rally and a corresponding correction in Government Bonds. The year started with a pronounced correction in equities on fears about earnings, global growth and the limits of monetary policy. Equity markets bottomed in February and then swiftly recovered until May. The Brexit surprise was weathered well at a global level as the short lived correction in European Equities was compensated by the rise of US equities on a more benign rates outlook. The US Presidential elections surprise provided an extra leg to the equities rally as first the US and then the European markets rose on expectations of tax cuts, reflationary infrastructure spending and deregulation. Emerging markets were the surprise outperformer in the equities sphere, helped by the recovery in commodities and the expansionary policy in China. Among the developed markets the US was the clear outperformer, followed by Japan while European equities lagged. Government Bonds in the US and Europe had a strong performance in the first half of the year, however they have gave back their gains in the second half, abruptly so after the US Elections.
Activity ReportAs at December 31, 2016 (Continued)
(LF) Fund of Funds - Equity Blend (continued)
The underweight position in the first half of the year, especially in the first quarter, had a negativeimpact on the fund’s performance and accounts for the major part of the underperformance. We hada pronounced underweight stance on Emerging Markets and were underweight US equities. Wewere overweight Europe equities until the Brexit referendum in Britain. We adopted an overweightstance in July and throughout the second half of the year by adopting an overweight position inEmerging Markets, Japan and after the US elections in the US. We were underweight Europeanequities in the second half.
(LF) Fund of Funds - Global Emerging Markets
2016 was a positive year for Emerging Markets. After a weak beginning of the year emergingmarkets staged an impressive recovery from February to September. Low valuations and therecovery of oil and commodity prices contributed to a sharp recovery of commodity dependentmarkets. Brazil was the main outperformer helped by rising iron ore prices and market friendlypolitical developments. Russia outperformed as well on better oil prices and signs of stabilization ofthe economy. Fears about a slowdown of the Chinese economy did not materialize as governmentspending and credit growth supported the economy. Chinese equities managed to reverse their steeplosses of the beginning of the year. India was an underperforrner despite the acceleration of thereform process. Mexico underperformed as well as the prospect of deteriorating trading relationswith the US weighed on the market and currency. After the US Elections the prospect of higher USrates and the strong USD led to a sharp correction in Emerging Markets. The main exception wasRussia, propped up by the prospect ofbetter US—Russia relations and rising oil prices.The (LF) Fund of Funds — Global Emerging Markets/Eurobank class returned 7.89% in the yearending 31/12/2016, a lower performance than the composite index used as the fund’s benchmark(MSCI Emerging Markets Index). On average, the fund had a 92.1% exposure to EM Equities, witha more pronounced underweight position in the first and the last quarters of the year. The mainoverweight positions during 2016 were Russia and India while the main underweight positions wereBrazil and South Africa. The underweight position in Brazil and the relatively low overall marketexposure during the first 4 months of the year were the main reasons for the fund’sunderperformance.
(LF) Fund of Funds - Balanced Blend Global
The defining moments of 2016 were the global growth scare in January—February, the subsequentrecovery of equities and commodities in spring, the Brexit surprise in June and the surprisinglyshort market reaction and finally the biggest surprise, the US Presidential elections that triggered anequities rally and a corresponding correction in Government Bonds. The year started with apronounced correction in equities on fears about earnings, global growth and the limits of monetarypolicy. Equity markets bottomed in February and then swiftly recovered until May. The Brexitsurprise was weathered well at a global level as the short lived correction in European Equities wascompensated by the rise of US equities on a more benign rates outlook. The US Presidentialelections surprise provided an extra leg to the equities rally as first the US and then the Europeanmarkets rose on expectations of tax cuts, reflationary infrastructure spending and deregulation.Emerging markets were the surprise outperformer in the equities sphere, helped by the recovery incommodities and the expansionary policy in China. Among the developed markets the US was theclear outperformer, followed by Japan while European equities lagged. Government Bonds in theUS and Europe had a strong performance in the first half of the year, however they have gave backtheir gains in the second half, abruptly so after the US Elections.

7
Activity Report As at December 31, 2016 (Continued)
(LF) Fund of Funds - Balanced Blend Global (Continued)
Investment Grade Bonds feared better than Government Bonds, however the clear outperformer in the Fixed Income sphere were the High Yield Bonds. Commodities experienced a strong recovery in 2016 from the multi-year lows of December, led by rising oil prices. The rise was more evident in the January- April period and then again in November and December helped by the prospect of US reflation and the OPEC deal to control oil production. Real Estate Assets weighed initial fears about rising rates and had yet another positive year. Only the UK Real Estate recorded loses under the combined effects of Brexit and the depreciation of the GBP. The USD was strengthened after the US elections. (LF) Fund of Funds - Balanced Blend Global/Eurobank class returned 5.28% in the year ending 31/12/2016, a lower performance than the composite index used as the fund’s benchmark (40% MSCI AC WORLD + 45% BofA ML EMU BROAD MARKET INDEX + 10% BLOOMBERG COMMODITY INDEX + 5% FTSE EPRA/NAREIT DEVELOPED INDEX). The fund was underweight equities throughout the year with the average exposure in equities ranging between 34.7% and 40.1%. The underweight position was more pronounced in the first quarter and was gradually reduced during the second half to end the year at neutral levels. The increase in equity exposure resulted mainly from the increase of US equities positions from underweight to overweight in the last quarter, especially after the US elections. Positions in Europe and EM remained underweight throughout the year while exposure to Japan turned overweight in the last quarter. Exposure to Fixed Income was overweight in the first quarter, reaching 49.6% at the end of May and then declined to end the year at an underweight 37.8%. We had a pronounced underweight position in Government Bonds throughout the year mirrored by a consistently overweight position in Non Government Bonds. Exposure to Commodities was underweight up to May and then gradually increased to overweight, reaching 13.6% at the end of the year. Exposure to Real Estate was mostly underweight, ranging from 3.8% to 5.1%.
(LF) Fund of Funds - Real Estate
Real Estate securities had yet another year of positive returns in spite of the weak performance in the first couple of months, the negative reaction of European Assets to the Brexit referendum and the correction triggered by the surprise results of the US presidential Election in November. Expectations that the Fed would proceed cautiously with rates led to a strong performance of US Real Estate from mid-February to the end of July. The relative outperformance of US Assets was compounded by the strong performance of the USD against the Euro. The best returns however were recorded by Australian Real Estate Assets. The main underperformer was the UK, where Real Estate Assets recorder negative returns as the sector was one of the main losers of Brexit. The losses were compounded by the huge depreciation of the GBP. Continental Europe Real Estate performed better, registering small gains for the year. The initial huge gains of Asian Real Estate in the were significantly reduced in the fourth quarter after the Presidential elections. The (LF) Fund of Funds - Real Estate Eurobank class returned 1.63% in the year ending 31/12/2016, a lower performance than the composite index used as the fund’s benchmark (50% FTSE/EPRA NAREIT Developed + 50% FTSE/EPRA NAREIT N. America). On average the fund had a 93.3% exposure to Real Estate equities. We kept relatively low exposure levels in the first quarter as the risk of rising US rates and adverse developments in Emerging markets led us to adopt underweight positions in the North American Real Estate Assets and the Emerging Markets. We had an overweight Europe position at the time of the Brexit referendum.
Activity ReportAs at December 31, 2016 (Continued)
(LF) Fund of Funds - Balanced Blend Global (Continued)
Investment Grade Bonds feared better than Government Bonds, however the clear outperformer inthe Fixed Income sphere were the High Yield Bonds. Commodities experienced a strong recoveryin 2016 from the multi—year lows of December, led by rising oil prices. The rise was more evidentin the January— April period and then again in November and December helped by the prospect ofUS reflation and the OPEC deal to control oil production. Real Estate Assets weighed initial fearsabout rising rates and had yet another positive year. Only the UK Real Estate recorded loses underthe combined effects of Brexit and the depreciation of the GBP. The USD was strengthened afterthe US elections.(LF) Fund of Funds — Balanced Blend Global/Eurobank class returned 5.28% in the year ending31/12/2016, a lower performance than the composite index used as the fund’s benchmark (40%MSCI AC WORLD + 45% BofA ML EMU BROAD MARKET INDEX + 10% BLOOMBERGCOMMODITY INDEX + 5% FTSE EPRA/NAREIT DEVELOPED INDEX). The fund wasunderweight equities throughout the year with the average exposure in equities ranging between34.7% and 40.1%. The underweight position was more pronounced in the first quarter and wasgradually reduced during the second half to end the year at neutral levels. The increase in equityexposure resulted mainly from the increase of US equities positions from underweight tooverweight in the last quarter, especially after the US elections. Positions in Europe and EMremained underweight throughout the year while exposure to Japan turned overweight in the lastquarter. Exposure to Fixed Income was overweight in the first quarter, reaching 49.6% at the end ofMay and then declined to end the year at an underweight 37.8%. We had a pronounced underweightposition in Government Bonds throughout the year mirrored by a consistently overweight positionin Non Government Bonds. Exposure to Commodities was underweight up to May and thengradually increased to overweight, reaching 13.6% at the end of the year. Exposure to Real Estatewas mostly underweight, ranging from 3.8% to 5.1%.
(LF) Fund of Funds - Real Estate
Real Estate securities had yet another year of positive returns in spite of the weak performance inthe first couple of months, the negative reaction of European Assets to the Brexit referendum andthe correction triggered by the surprise results of the US presidential Election in November.Expectations that the Fed would proceed cautiously with rates led to a strong performance of USReal Estate fiom rnid—February to the end of July. The relative outperformance of US Assets wascompounded by the strong performance of the USD against the Euro. The best returns howeverwere recorded by Australian Real Estate Assets. The main underperformer was the UK, where RealEstate Assets recorder negative returns as the sector was one of the main losers of Brexit. Thelosses were compounded by the huge depreciation of the GBP. Continental Europe Real Estateperformed better, registering small gains for the year. The initial huge gains of Asian Real Estate inthe were significantly reduced in the fourth quarter after the Presidential elections.The (LF) Fund of Funds — Real Estate Eurobank class returned 1.63% in the year ending31/12/2016, a lower performance than the composite index used as the fund’s benchmark (50%FTSE/EPRA NAREIT Developed + 50% FTSE/EPRA NAREIT N. America). On average the fundhad a 93.3% exposure to Real Estate equities. We kept relatively low exposure levels in the firstquarter as the risk of rising US rates and adverse developments in Emerging markets led us to adoptunderweight positions in the North American Real Estate Assets and the Emerging Markets. Wehad an overweight Europe position at the time of the Brexit referendum.
8
Activity Report As at December 31, 2016 (Continued)
(LF) Fund of Funds - Real Estate (continued)
In September we increased our positions in Asia-Pacific to overweight while in October we further reduced our positions to North America and reduced our Europe exposure to neutral. In December we reduced our underweight position in North America. The underweight position in the first quarter, the overweight Europe position before Brexit and the strength of the USD accounted for most of the underperformance.
(LF) Fund of Funds - Dynamic Fixed Income
The defining moments of 2016 were the global growth scare in January-February, the subsequent recovery of equities and commodities in spring, the Brexit surprise in June and the surprisingly short market reaction and finally the biggest surprise, the US Presidential elections that triggered an equities rally and a corresponding correction in Government Bonds. The year started with a pronounced correction in equities on fears about earnings, global growth and the limits of monetary policy. Equity markets bottomed in February and then swiftly recovered until May. The Brexit surprise was weathered well at a global level as the short lived correction in European Equities was compensated by the rise of US equities on a more benign rates outlook. The US Presidential elections surprise provided an extra leg to the equities rally as first the US and then the European markets rose on expectations of tax cuts, reflationary infrastructure spending and deregulation. Emerging markets were the surprise outperformer in the equities sphere, helped by the recovery in commodities and the expansionary policy in China. Among the developed markets the US was the clear outperformer, followed by Japan while European equities lagged. Government Bonds in the US and Europe had a strong performance in the first half of the year, however they have gave back their gains in the second half, abruptly so after the US Elections. Investment Grade Bonds feared better than Government Bonds, however the clear outperformer in the Fixed Income sphere were the High Yield Bonds. Commodities experienced a strong recovery in 2016 from the multi-year lows of December, led by rising oil prices. The rise was more evident in the January- April period and then again in November and December helped by the prospect of US reflation and the OPEC deal to control oil production. Real Estate Assets weighed initial fears about rising rates and had yet another positive year. Only the UK Real Estate recorded loses under the combined effects of Brexit and the depreciation of the GBP. The USD was strengthened after the US elections. (LF) Fund of Funds - Dynamic Fixed Income invests in at least 10 of the top ranked fixed income funds according to our selection process and unless required, each of the selected investment carries an equal weight (at rebalancing). Rebalancing takes place at least four times a year, within the 1st month of each calendar quarter, or more often if so is deemed necessary. The sub-fund’s Eurobank I class recorded a 8.86% return during the year ending 31/12/2016, better than the performance of the benchmark index (BOFA ML GLOBAL BROAD MARKET INDEX). Average exposure to bonds increased gradually during the year, starting from 83% in January and reaching 96.6% at the end of December. Funds containing High Yield Bonds were favoured by the selection process in 2016 resulting to an overweight position that contributed to the outperformance of the sub-fund.
Activity ReportAs at December 31, 2016 (Continued)
(LF) Fund of Funds - Real Estate (continued)
Ir1 September we increased our positions in Asia—Pacifi c to overweight while in October we furtherreduced our positions to North America and reduced our Europe exposure to neutral. In Decemberwe reduced our underweight position in North America. The underweight position in the firstquarter, the overweight Europe position before Brexit and the strength of the USD accounted formost of the underperformance.
(LF) Fund of Funds - Dynamic Fixed Income
The defining moments of 2016 were the global growth scare in January—February, the subsequentrecovery of equities and commodities in spring, the Brexit surprise in June and the surprisinglyshort market reaction and finally the biggest surprise, the US Presidential elections that triggered anequities rally and a corresponding correction in Government Bonds. The year started with apronounced correction in equities on fears about earnings, global growth and the limits of monetarypolicy. Equity markets bottomed in February and then swiftly recovered until May. The Brexitsurprise was weathered well at a global level as the short lived correction in European Equities wascompensated by the rise of US equities on a more benign rates outlook. The US Presidentialelections surprise provided an extra leg to the equities rally as first the US and then the Europeanmarkets rose on expectations of tax cuts, reflationary infrastructure spending and deregulation.Emerging markets were the surprise outperformer in the equities sphere, helped by the recovery incommodities and the expansionary policy in China. Among the developed markets the US was theclear outperformer, followed by Japan while European equities lagged. Government Bonds in theUS and Europe had a strong performance in the first half of the year, however they have gave backtheir gains in the second half, abruptly so after the US Elections. Investment Grade Bonds fearedbetter than Government Bonds, however the clear outperformer in the Fixed Income sphere werethe High Yield Bonds. Commodities experienced a strong recovery in 2016 from the multi—yearlows of December, led by rising oil prices. The rise was more evident in the January— April periodand then again in November and December helped by the prospect of US reflation and the OPECdeal to control oil production. Real Estate Assets weighed initial fears about rising rates and had yetanother positive year. Only the UK Real Estate recorded loses under the combined effects of Brexitand the depreciation of the GBP. The USD was strengthened after the US elections.(LF) Fund of Funds — Dynamic Fixed Income invests in at least 10 of the top ranked fixed incomefunds according to our selection process and unless required, each of the selected investment carriesan equal weight (at rebalancing). Rebalancing takes place at least four times a year, within the 1stmonth of each calendar quarter, or more often if so is deemed necessary. The sub—fund’s Eurobank Iclass recorded a 8.86% return during the year ending 31/12/2016, better than the performance of thebenchmark index (BOFA ML GLOBAL BROAD MARKET INDEX). Average exposure to bondsincreased gradually during the year, starting from 83% in January and reaching 96.6% at the end ofDecember. Funds containing High Yield Bonds were favoured by the selection process in 2016resulting to an overweight position that contributed to the outperforrnance of the sub—fund.
9
Activity Report As at December 31, 2016 (Continued) (LF) Fund of Funds - Global Low
The defining moments of 2016 were the global growth scare in January-February, the subsequent recovery of equities and commodities in spring, the Brexit surprise in June and the surprisingly short market reaction and finally the biggest surprise, the US Presidential elections that triggered an equities rally and a corresponding correction in Government Bonds. The year started with a pronounced correction in equities on fears about earnings, global growth and the limits of monetary policy. Equity markets bottomed in February and then swiftly recovered until May. The Brexit surprise was weathered well at a global level as the short lived correction in European Equities was compensated by the rise of US equities on a more benign rates outlook. The US Presidential elections surprise provided an extra leg to the equities rally as first the US and then the European markets rose on expectations of tax cuts, reflationary infrastructure spending and deregulation. Emerging markets were the surprise outperformer in the equities sphere, helped by the recovery in commodities and the expansionary policy in China. Among the developed markets the US was the clear outperformer, followed by Japan while European equities lagged. Government Bonds in the US and Europe had a strong performance in the first half of the year, however they have gave back their gains in the second half, abruptly so after the US Elections. Investment Grade Bonds feared better than Government Bonds, however the clear outperformer in the Fixed Income sphere were the High Yield Bonds. Commodities experienced a strong recovery in 2016 from the multi-year lows of December, led by rising oil prices. The rise was more evident in the January- April period and then again in November and December helped by the prospect of US reflation and the OPEC deal to control oil production. Real Estate Assets weighed initial fears about rising rates and had yet another positive year. Only the UK Real Estate recorded loses under the combined effects of Brexit and the depreciation of the GBP. The USD was strengthened after the US elections.
The (LF) Fund of Funds Global - Low Eurobank class returned 0.86% in the year ending 31/12/2016, a lower performance than the composite index used as the fund’s benchmark (10% MSCI AC WORLD + 25% BofA ML EMU BROAD MARKET INDEX + 65% EONIA TR INDEX). The fund was underweight equities throughout the year as we tried to limit volatility, the average equity exposure ranging between 5.7% and 8.8%. Average exposure to Fixed Income was overweight throughout the year, ranging from 36.5% to 48.6%, but with very low duration, much lower compared to one implied by the benchmark. We had an overweight position in yield enhancing Greek Fixed Income Assets.
(LF) Fund of Funds - Global Medium
The defining moments of 2016 were the global growth scare in January-February, the subsequent recovery of equities and commodities in spring, the Brexit surprise in June and the surprisingly short market reaction and finally the biggest surprise, the US Presidential elections that triggered an equities rally and a corresponding correction in Government Bonds. The year started with a pronounced correction in equities on fears about earnings, global growth and the limits of monetary policy. Equity markets bottomed in February and then swiftly recovered until May. The Brexit surprise was weathered well at a global level as the short lived correction in European Equities was compensated by the rise of US equities on a more benign rates outlook. The US Presidential elections surprise provided an extra leg to the equities rally as first the US and then the European markets rose on expectations of tax cuts, reflationary infrastructure spending and deregulation. Emerging markets were the surprise outperformer in the equities sphere, helped by the recovery in commodities and the expansionary policy in China. Among the developed markets the US was the clear outperformer, followed by Japan while European equities lagged. Government Bonds in the US and Europe had a strong performance in the first half of the year, however they have gave back their gains in the second half, abruptly so after the US Elections.
Activity ReportAs at December 31, 2016 (Continued)
(LF) Fund of Funds - Global Low
The defining moments of 2016 were the global growth scare in January—February, the subsequentrecovery of equities and commodities in spring, the Brexit surprise in June and the surprisinglyshort market reaction and fnally the biggest surprise, the US Presidential elections that triggered anequities rally and a corresponding correction in Government Bonds. The year started with apronounced correction in equities on fears about earnings, global growth and the limits of monetarypolicy. Equity markets bottomed in February and then swiftly recovered until May. The Brexitsurprise was weathered well at a global level as the short lived correction in European Equities wascompensated by the rise of US equities on a more benign rates outlook. The US Presidentialelections surprise provided an extra leg to the equities rally as first the US and then the Europeanmarkets rose on expectations of tax cuts, reflationary infrastructure spending and deregulation.Emerging markets were the surprise outperformer in the equities sphere, helped by the recovery incommodities and the expansionary policy in China. Among the developed markets the US was theclear outperforrner, followed by Japan while European equities lagged. Government Bonds in theUS and Europe had a strong performance in the first half of the year, however they have gave backtheir gains in the second half, abruptly so after the US Elections. Investment Grade Bonds fearedbetter than Government Bonds, however the clear outperforrner in the Fixed Income sphere werethe High Yield Bonds. Commodities experienced a strong recovery in 2016 from the multi—yearlows of December, led by rising oil prices. The rise was more evident in the January— April periodand then again in November and December helped by the prospect of US reflation and the OPECdeal to control oil production. Real Estate Assets weighed initial fears about rising rates and had yetanother positive year. Only the UK Real Estate recorded loses under the combined effects of Brexitand the depreciation of the GBP. The USD was strengthened after the US elections.
The (LF) Fund of Funds Global — Low Eurobank class returned 0.86% in the year ending31/12/2016, a lower performance than the composite index used as the fund’s benchmark (10%MSCI AC WORLD + 25% B0fA ML EMU BROAD MARKET INDEX + 65% EONIA TRINDEX). The fund was underweight equities throughout the year as we tried to limit volatility, theaverage equity exposure ranging between 5.7% and 8.8%. Average exposure to Fixed Income wasoverweight throughout the year, ranging from 36.5% to 48.6%, but with very low duration, muchlower compared to one implied by the benchmark. We had an overweight position in yieldenhancing Greek Fixed Income Assets.
(LF) Fund of Funds - Global Medium
The defining moments of 2016 were the global growth scare in January—February, the subsequentrecovery of equities and commodities in spring, the Brexit surprise in June and the surprisinglyshort market reaction and fnally the biggest surprise, the US Presidential elections that triggered anequities rally and a corresponding correction in Government Bonds. The year started with apronounced correction in equities on fears about earnings, global growth and the limits of monetarypolicy. Equity markets bottomed in February and then swiftly recovered until May. The Brexitsurprise was weathered well at a global level as the short lived correction in European Equities wascompensated by the rise of US equities on a more benign rates outlook. The US Presidentialelections surprise provided an extra leg to the equities rally as first the US and then the Europeanmarkets rose on expectations of tax cuts, reflationary infrastructure spending and deregulation.Emerging markets were the surprise outperformer in the equities sphere, helped by the recovery incommodities and the expansionary policy in China. Among the developed markets the US was theclear outperforrner, followed by Japan while European equities lagged. Government Bonds in theUS and Europe had a strong performance in the first half of the year, however they have gave backtheir gains in the second half, abruptly so after the US Elections.
10
Activity Report As at December 31, 2016 (Continued)
(LF) Fund of Funds - Global Medium (continued)
Investment Grade Bonds feared better than Government Bonds, however the clear outperformer in the Fixed Income sphere were the High Yield Bonds. Commodities experienced a strong recovery in 2016 from the multi-year lows of December, led by rising oil prices. The rise was more evident in the January- April period and then again in November and December helped by the prospect of US reflation and the OPEC deal to control oil production. Real Estate Assets weighed initial fears about rising rates and had yet another positive year. Only the UK Real Estate recorded loses under the combined effects of Brexit and the depreciation of the GBP. The USD was strengthened after the US elections. The sub-fund’s Eurobank class recorded a 2.88% annual return for the year ending December 31, 2016, lower than the composite index used as the sub-fund’s benchmark (30% MSCI AC WORLD + 55% BofA ML EMU BROAD MARKET INDEX + 15% EONIA TR INDEX). The fund was underweight equities throughout the year with the average exposure in equities ranging between 24.6% and 30.0%. The underweight position was more pronounced in the first half of the year and was gradually reduced during the second half to end the year at neutral levels. The increase in equity exposure resulted mainly from the increase of US equities positions from underweight to overweight in the last quarter, especially after the US elections. Positions in Europe and EM remained underweight throughout the year while Exposure in Japan was slightly overweight. The underweight position in equities contributed to the sub-fund’s underperformance. Exposure to Fixed Income was also underweight for most of the year, ranging from 51.3% to 57.4%. We had a pronounced underweight position in Government Bonds throughout the year mirrored by a consistently overweight position in Non Government Bonds.
(LF) Fund of Funds - Global High
The defining moments of 2016 were the global growth scare in January-February, the subsequent recovery of equities and commodities in spring, the Brexit surprise in June and the surprisingly short market reaction and finally the biggest surprise, the US Presidential elections that triggered an equities rally and a corresponding correction in Government Bonds. The year started with a pronounced correction in equities on fears about earnings, global growth and the limits of monetary policy. Equity markets bottomed in February and then swiftly recovered until May. The Brexit surpise was weathered well at a global level as the short lived correction in European Equities was compensated by the rise of US equities on a more benign rates outlook. The US Presidential elections surprise provided an extra leg to the equities rally as first the US and then the European markets rose on expectations of tax cuts, reflationary infrastructure spending and deregulation. Emerging markets were the surprise outperformer in the equities sphere, helped by the recovery in commodities and the expansionary policy in China. Among the developed markets the US was the clear outperformer, followed by Japan while European equities lagged. Government Bonds in the US and Europe had a strong performance in the first half of the year, however they have gave back their gains in the second half, abruptly so after the US Elections. Investment Grade Bonds feared better than Government Bonds, however the clear outperformer in the Fixed Income sphere were the High Yield Bonds. Commodities experienced a strong recovery in 2016 from the multi-year lows of December, led by rising oil prices. The rise was more evident in the January- April period and then again in November and December helped by the prospect of US reflation and the OPEC deal to control oil production. Real Estate Assets weighed initial fears about rising rates and had yet another positive year. Only the UK Real Estate recorded loses under the combined effects of Brexit and the depreciation of the GBP. The USD was strengthened after the US elections.
Activity ReportAs at December 31, 2016 (Continued)
(LF) Fund of Funds - Global Medium (continued)
Investment Grade Bonds feared better than Government Bonds, however the clear outperformer inthe Fixed Income sphere were the High Yield Bonds. Commodities experienced a strong recoveryin 2016 from the multi—year lows of December, led by rising oil prices. The rise was more evidentin the January— April period and then again in November and December helped by the prospect ofUS reflation and the OPEC deal to control oil production. Real Estate Assets weighed initial fearsabout rising rates and had yet another positive year. Only the UK Real Estate recorded loses underthe combined effects of Brexit and the depreciation of the GBP. The USD was strengthened afterthe US elections.The sub—fund’s Eurobank class recorded a 2.88% armual return for the year ending December 31,2016, lower than the composite index used as the sub—fund’s benchmark (30% MSCI AC WORLD+ 55% B0fA ML EMU BROAD MARKET INDEX + 15% EONIA TR INDEX). The fund wasunderweight equities throughout the year with the average exposure in equities ranging between24.6% and 30.0%. The underweight position was more pronounced in the first half of the year andwas gradually reduced during the second half to end the year at neutral levels. The increase inequity exposure resulted mainly from the increase of US equities positions from underweight tooverweight in the last quarter, especially after the US elections. Positions in Europe and EMremained underweight throughout the year while Exposure in Japan was slightly overweight. Theunderweight position in equities contributed to the sub—fund’s underperforrnance. Exposure to FixedIncome was also underweight for most of the year, ranging from 51.3% to 57.4%. We had apronounced underweight position in Government Bonds throughout the year mirrored by aconsistently overweight position in Non Government Bonds.
(LF) Fund of Funds - Global High
The defining moments of 2016 were the global growth scare in January—February, the subsequentrecovery of equities and commodities in spring, the Brexit surprise in June and the surprisinglyshort market reaction and finally the biggest surprise, the US Presidential elections that triggered anequities rally and a corresponding correction in Government Bonds. The year started with apronounced correction in equities on fears about earnings, global growth and the limits of monetarypolicy. Equity markets bottomed in February and then swiftly recovered until May. The Brexitsurpise was weathered well at a global level as the short lived correction in European Equities wascompensated by the rise of US equities on a more benign rates outlook. The US Presidentialelections surprise provided an extra leg to the equities rally as first the US and then the Europeanmarkets rose on expectations of tax cuts, reflationary infrastructure spending and deregulation.Emerging markets were the surprise outperformer in the equities sphere, helped by the recovery incommodities and the expansionary policy in China. Among the developed markets the US was theclear outperformer, followed by Japan while European equities lagged. Government Bonds in theUS and Europe had a strong performance in the first half of the year, however they have gave backtheir gains in the second half, abruptly so after the US Elections. Investment Grade Bonds fearedbetter than Government Bonds, however the clear outperformer in the Fixed Income sphere werethe High Yield Bonds. Commodities experienced a strong recovery in 2016 from the multi—yearlows of December, led by rising oil prices. The rise was more evident in the January— April periodand then again in November and December helped by the prospect of US reflation and the OPECdeal to control oil production. Real Estate Assets weighed initial fears about rising rates and had yetanother positive year. Only the UK Real Estate recorded loses under the combined effects of Brexitand the depreciation of the GBP. The USD was strengthened after the US elections.
10

11
Activity Report As at December 31, 2016 (Continued)
(LF) Fund of Funds - Global High (continued)
The sub-fund’s Eurobank class recorded a 5.07% annual return, for the year ending December 31, 2016, lower than the composite index used as the sub-fund’s benchmark (65% MSCI AC WORLD + 30% BofA ML EMU BROAD MARKET INDEX + 5% EONIA TR INDEX). The fund was underweight equities throughout the year with the average exposure in equities ranging between 55.2% and 63.1%. The underweight position was more pronounced in the first half of the year and was gradually reduced during the second half to end the year at close to neutral levels. The increase in equity exposure resulted mainly from the increase of US equities positions from underweight to overweight in the last quarter, especially after the US elections. Position in Europe remained underweight throughout the year. The underweight position in equities contributed to the sub-fund’s underperformance. Exposure to Fixed Income was also underweight for most of the year, ranging from 29.4% to 31.8%. We had a pronounced underweight position in Government Bonds throughout the year mirrored by a consistently overweight position in Non-Government Bonds.
(LF) Fund of Funds - Balanced Blend US
The defining moments of 2016 were the global growth scare in January-February, the subsequent recovery of equities and commodities in spring, the Brexit surprise in June and the surprisingly short market reaction and finally the biggest surprise, the US Presidential elections that triggered an equities rally and a corresponding correction in Government Bonds. The year started with a pronounced correction in equities on fears about earnings, global growth and the limits of monetary policy. Equity markets bottomed in February and then swiftly recovered until May. The Brexit surprise was weathered well at a global level as the short lived correction in European Equities was compensated by the rise of US equities on a more benign rates outlook. The US Presidential elections surprise provided an extra leg to the equities rally as first the US and then the European markets rose on expectations of tax cuts, reflationary infrastructure spending and deregulation. Emerging markets were the surprise outperformer in the equities sphere, helped by the recovery in commodities and the expansionary policy in China. Among the developed markets the US was the clear outperformer, followed by Japan while European equities lagged. Government Bonds in the US and Europe had a strong performance in the first half of the year, however they have gave back their gains in the second half, abruptly so after the US Elections. Investment Grade Bonds feared better than Government Bonds, however the clear outperformer in the Fixed Income sphere were the High Yield Bonds. Commodities experienced a strong recovery in 2016 from the multi-year lows of December, led by rising oil prices. The rise was more evident in the January- April period and then again in November and December helped by the prospect of US reflation and the OPEC deal to control oil production. Real Estate Assets weighed initial fears about rising rates and had yet another positive year. Only the UK Real Estate recorded loses under the combined effects of Brexit and the depreciation of the GBP. The USD was strengthened after the US elections. (LF) Fund of Funds - Balanced Blend US/Eurobank class recorded a 6.20% annual return in 2016, lagging its composite index used as a benchmark (50% MSCI USA + 50% BofA ML US BROAD MARKET). The fund was underweight equities throughout the year with the average exposure in equities ranging between 44.5% and 49.8%. The underweight position was more pronounced in the first half of the year and was gradually reduced during the second half to end the year to close to neutral level. Exposure to Fixed Income was also underweight for most of the year, ranging on average from 44.3% to 48.4%. We had a n underweight position in Government Bonds throughout the year and a consistently overweight position in Non-Government Bonds.
Activity ReportAs at December 31, 2016 (Continued)
(LF) Fund of Funds - Global High (continued)
The sub—fund’s Eurobank class recorded a 5.07% annual return, for the year ending December 31,2016, lower than the composite index used as the sub—fund’s benchmark (65% MSCI AC WORLD+ 30% BofA ML EMU BROAD MARKET INDEX + 5% EONIA TR INDEX). The fund wasunderweight equities throughout the year with the average exposure in equities ranging between55.2% and 63.1%. The underweight position was more pronounced in the first half of the year andwas gradually reduced during the second half to end the year at close to neutral levels. The increasein equity exposure resulted mainly from the increase of US equities positions from underweight tooverweight in the last quarter, especially after the US elections. Position in Europe remainedunderweight throughout the year. The underweight position in equities contributed to the sub—fund’sunderperforrnance. Exposure to Fixed Income was also underweight for most of the year, rangingfrom 29.4% to 31.8%. We had a pronounced underweight position in Government Bondsthroughout the year mirrored by a consistently overweight position in Non—Government Bonds.
(LF) Fund of Funds - Balanced Blend US
The defining moments of 2016 were the global growth scare in January—February, the subsequentrecovery of equities and commodities in spring, the Brexit surprise in June and the surprisinglyshort market reaction and fnally the biggest surprise, the US Presidential elections that triggered anequities rally and a corresponding correction in Government Bonds. The year started with apronounced correction in equities on fears about earnings, global growth and the limits of monetarypolicy. Equity markets bottomed in February and then swiftly recovered until May. The Brexitsurprise was weathered well at a global level as the short lived correction in European Equities wascompensated by the rise of US equities on a more benign rates outlook. The US Presidentialelections surprise provided an extra leg to the equities rally as first the US and then the Europeanmarkets rose on expectations of tax cuts, reflationary infrastructure spending and deregulation.Emerging markets were the surprise outperformer in the equities sphere, helped by the recovery incommodities and the expansionary policy in China. Among the developed markets the US was theclear outperformer, followed by Japan while European equities lagged. Government Bonds in theUS and Europe had a strong performance in the first half of the year, however they have gave backtheir gains in the second half, abruptly so after the US Elections. Investment Grade Bonds fearedbetter than Government Bonds, however the clear outperformer in the Fixed Income sphere werethe High Yield Bonds. Commodities experienced a strong recovery in 2016 from the multi—yearlows of December, led by rising oil prices. The rise was more evident in the January— April periodand then again in November and December helped by the prospect of US reflation and the OPECdeal to control oil production. Real Estate Assets weighed initial fears about rising rates and had yetanother positive year. Only the UK Real Estate recorded loses under the combined effects of Brexitand the depreciation of the GBP. The USD was strengthened after the US elections.(LF) Fund of Funds — Balanced Blend US/Eurobank class recorded a 6.20% annual return in 2016,lagging its composite index used as a benchmark (50% MSCI USA + 50% BofA ML US BROADMARKET). The fund was underweight equities throughout the year with the average exposure inequities ranging between 44.5% and 49.8%. The underweight position was more pronounced in thefirst half of the year and was gradually reduced during the second half to end the year to close toneutral level. Exposure to Fixed Income was also underweight for most of the year, ranging onaverage from 44.3% to 48.4%. We had a n underweight position in Government Bonds throughoutthe year and a consistently overweight position in Non—Government Bonds.
11
12
Activity Report As at December 31, 2016 (Continued)
(LF) Fund of Funds - Tactical Allocation
The defining moments of 2016 were the global growth scare in January-February, the subsequent recovery of equities and commodities in spring, the Brexit surprise in June and the surprisingly short market reaction and finally the biggest surprise, the US Presidential elections that triggered an equities rally and a corresponding correction in Government Bonds. The year started with a pronounced correction in equities on fears about earnings, global growth and the limits of monetary policy. Equity markets bottomed in February and then swiftly recovered until May. The Brexit surprise was weathered well at a global level as the short lived correction in European Equities was compensated by the rise of US equities on a more benign rates outlook. The US Presidential elections surprise provided an extra leg to the equities rally as first the US and then the European markets rose on expectations of tax cuts, reflationary infrastructure spending and deregulation. Emerging markets were the surprise outperformer in the equities sphere, helped by the recovery in commodities and the expansionary policy in China. Among the developed markets the US was the clear outperformer, followed by Japan while European equities lagged. Government Bonds in the US and Europe had a strong performance in the first half of the year, however they have gave back their gains in the second half, abruptly so after the US Elections. Investment Grade Bonds feared better than Government Bonds, however the clear outperformer in the Fixed Income sphere were the High Yield Bonds. Commodities experienced a strong recovery in 2016 from the multi-year lows of December, led by rising oil prices. The rise was more evident in the January- April period and then again in November and December helped by the prospect of US reflation and the OPEC deal to control oil production. Real Estate Assets weighed initial fears about rising rates and had yet another positive year. Only the UK Real Estate recorded loses under the combined effects of Brexit and the depreciation of the GBP. The USD was strengthened after the US elections. The sub-fund follows a tactical allocation strategy with a maximum VaR limit and is associated with no benchmark. In 2016 average Equity exposure ranged between 16.0% and 40.9% while average Fixed Income exposure between 18.4% and 47.2%. Equity exposure was higher in the second half of the year while Fixed Income exposure was significantly reduced in November and December.
The figures stated in this report are historical and not necessarily indicative of future performance.
Luxembourg, April 18, 2017
Activity ReportAs at December 31, 2016 (Continued)
(LF) Fund of Funds - Tactical Allocation
The defining moments of 2016 were the global growth scare in January—February, the subsequentrecovery of equities and commodities in spring, the Brexit surprise in June and the surprisinglyshort market reaction and finally the biggest surprise, the US Presidential elections that triggered anequities rally and a corresponding correction in Government Bonds. The year started with apronounced correction in equities on fears about earnings, global growth and the limits of monetarypolicy. Equity markets bottomed in February and then swiftly recovered until May. The Brexitsurprise was weathered well at a global level as the short lived correction in European Equities wascompensated by the rise of US equities on a more benign rates outlook. The US Presidentialelections surprise provided an extra leg to the equities rally as first the US and then the Europeanmarkets rose on expectations of tax cuts, reflationary infrastructure spending and deregulation.Emerging markets were the surprise outperformer in the equities sphere, helped by the recovery incommodities and the expansionary policy in China. Among the developed markets the US was theclear outperformer, followed by Japan while European equities lagged. Government Bonds in theUS and Europe had a strong performance in the first half of the year, however they have gave backtheir gains in the second half, abruptly so after the US Elections. Investment Grade Bonds fearedbetter than Government Bonds, however the clear outperformer in the Fixed Income sphere werethe High Yield Bonds. Commodities experienced a strong recovery in 2016 from the multi—yearlows of December, led by rising oil prices. The rise was more evident in the January— April periodand then again in November and December helped by the prospect of US reflation and the OPECdeal to control oil production. Real Estate Assets weighed initial fears about rising rates and had yetanother positive year. Only the UK Real Estate recorded loses under the combined effects of Brexitand the depreciation of the GBP. The USD was strengthened after the US elections.The sub—fund follows a tactical allocation strategy with a maximum VaR limit and is associatedwith no benchmark. In 2016 average Equity exposure ranged between 16.0% and 40.9% whileaverage Fixed Income exposure between 18.4% and 47.2%. Equity exposure was higher in thesecond half of the year while Fixed Income exposure was significantly reduced in November andDecember.
The figures stated in this report are historical and not necessarily indicative of futureperformance.
Luxembourg, April 18, 2017
12

PricewaterhouseCoopers, Société coopérative, 2 rue Gerhard Mercator, B.P. 1443, L-1014 Luxembourg
T: +352 494848 1, F:+352 494848 2900, www.pwc.lu
Cabinet de révision agréé. Expert-comptable (autorisation gouvernementale n°10028256)
R.C.S. Luxembourg B 65 477 - TVA LU25482518 13
Audit report To the Unitholders of (LF) Fund of Funds
We have audited the accompanying financial statements of (LF) Fund of Funds and of each of its sub-funds, which comprise the statement of net assets and the schedule of investments as at December 31, 2016 and the statement of operations and the statement of changes in net assets for the year then ended, and a summary of significant accounting policies and other explanatory notes to the financial statements. Responsibility of the Board of Directors of the Management Company for the financial statements The Board of Directors of the Management Company is responsible for the preparation and fair presentation of these financial statements in accordance with Luxembourg legal and regulatory requirements relating to the preparation of the financial statements and for such internal control as the Board of Directors of the Management Company determines is necessary to enable the preparation of financial statements that are free from material misstatement, whether due to fraud or error. Responsibility of the “Réviseur d’entreprises agréé” Our responsibility is to express an opinion on these financial statements based on our audit. We conducted our audit in accordance with International Standards on Auditing as adopted for Luxembourg by the “Commission de Surveillance du Secteur Financier”. Those standards require that we comply with ethical requirements and plan and perform the audit to obtain reasonable assurance about whether the financial statements are free from material misstatement. An audit involves performing procedures to obtain audit evidence about the amounts and disclosures in the financial statements. The procedures selected depend on the judgment of the “Réviseur d’entreprises agréé”, including the assessment of the risks of material misstatement of the financial statements, whether due to fraud or error. In making those risk assessments, the “Réviseur d’entreprises agréé” considers internal control relevant to the entity’s preparation and fair presentation of the financial statements in order to design audit procedures that are appropriate in the circumstances, but not for the purpose of expressing an opinion on the effectiveness of the entity’s
internal control. An audit also includes evaluating the appropriateness of accounting policies used and the reasonableness of accounting estimates made by the Board of Directors of the Management Company, as well as evaluating the overall presentation of the financial statements.
_Ipwc
Audit report
To the Unitholders of(LF) Fund of Funds
We have audited the accompanying financial statements of (LF) Fund of Funds and of each of its sub-funds, which comprise the statement of net assets and the schedule of investments as at December 31,2016 and the statement of operations and the statement of changes in net assets for the year thenended, and a summary of significant accounting policies and other explanatory notes to the financialstatements.
Responsibility of the Board ofDirectors of the Management Companyfor thefinancial statements
The Board of Directors of the Management Company is responsible for the preparation and fairpresentation of these financial statements in accordance with Luxembourg legal and regulatoryrequirements relating to the preparation of the financial statements and for such internal control asthe Board of Directors of the Management Company determines is necessary to enable the preparationof financial statements that are free from material misstatement, whether due to fraud or error.
Responsibility of the “Réviseur d’entreprises agréé”
Our responsibility is to express an opinion on these financial statements based on our audit. Weconducted our audit in accordance with International Standards on Auditing as adopted forLuxembourg by the “Commission de Surveillance du Secteur Financier”. Those standards require thatwe comply witl1 ethical requirements and plan and perform the audit to obtain reasonable assuranceabout whether the financial statements are free from material misstatement.
An audit involves performing procedures to obtain audit evidence about the amounts and disclosuresin the financial statements. The procedures selected depend on the judgment of the“Réviseur d’entreprises agréé”, including the assessment of the risks of material misstatement of thefinancial statements, whether due to fraud or error. In making those risk assessments, the“Réviseur d’entreprises agréé” considers internal control relevant to the entity’s preparation and fairpresentation of the financial statements in order to design audit procedures that are appropriate in thecircumstances, but not for the purpose of expressing an opinion on the effectiveness of the entity’sinternal control. An audit also includes evaluating the appropriateness of accounting policies used andthe reasonableness of accounting estimates made by the Board of Directors of the ManagementCompany, as well as evaluating the overall presentation of the financial statements.
PricewaterhouseCoopers, Société coopérative, 2 rue Gerhard Mercator, B.P. 1443, L—1 014 LuxembourgT: +352 494848 1, F:+352 494848 2900, www.pwc.lu
Cabinet de révision agréé. Expert—comptable (autorisation gouvernementale n°10o28256)R.C.S. Luxembourg B 65 477 — TVA LU25482518 13

PWC
We believe that the audit evidence we have obtained is sufficient and appropriate to provide a basis forour audit opinion.
Opinion
In our opinion, the financial statements give a true and fair View of the financial position of (LF) Fundof Funds and of each of its sub—funds as of December 31, 2016, and of the results of their operationsand changes in their net assets for the year then ended in accordance with Luxembourg legal andregulatory requirements relating to the preparation of the financial statements.
Other information
The Board of Directors of the Management Company is responsible for the other information. Theother information comprises the information included in the annual report but does not include thefinancial statements and our audit report thereon.
Our opinion on the financial statements does not cover the other information and we do not expressany form of assurance conclusion thereon.
In connection with our audit of the financial statements, our responsibility is to read the otherinformation and, in doing so, consider whether the other information is materially inconsistent withthe financial statements or our knowledge obtained in the audit or otherwise appears to be materiallymisstated. If, based on the work we have performed, we conclude that there is a material misstatementof this other information, we are required to report this fact. We have nothing to report in this regard.
PricewaterhouseCoopers, Société cooperative Luxembourg, April 18, 2017Represented by
/T \j
Claude Jacoby
14

Statement of Net AssetsAs at December 31, 2016
(LF) Fund of Funds (LF) Fund of Funds - Balanced Blend Europe
(LF) Fund of Funds - Equity Blend
(LF) Fund of Funds - Global Emerging
Market
(LF) Fund of Funds - Balanced Blend
Global
(LF) Fund of Funds - Real Estate
Combined
Currency Notes EUR EUR EUR EUR EUR EUR
Assets
Securities portfolio at market value 2 402 789 427.62 11 146 921.22 33 713 155.48 27 935 473.32 96 568 156.65 5 751 125.74 Cash at bank 32 656 544.53 135 965.20 850 439.13 609 519.74 1 019 760.34 146 560.24 Receivable on interest and dividends 2 243 039.13 9.56 277.13 48.09 361.11 5.00 Receivable on securities 2 93 050.00 93 050.00 - - - - Receivable on subscriptions 109 237.45 - - - 25 795.74 - Other assets 24 496.24 633.11 1 822.36 1 346.35 4 922.76 234.36
Total assets 435 915 794.97 11 376 579.09 34 565 694.10 28 546 387.50 97 618 996.60 5 897 925.34
Liabilities
Subscriptions in advance 29 760.46 - - - 5 060.00 - Payable on purchases 1 669.21 - - - - 1 669.21 Redemptions to be paid 754 928.23 40 150.71 41 142.80 12 104.87 89 265.69 4 425.98 Other payable and accrued expenses 592 761.97 16 930.78 69 536.26 51 778.93 143 443.86 10 557.05
Total liabilities 1 379 119.87 57 081.49 110 679.06 63 883.80 237 769.55 16 652.24
Total net assets at the end of the year/period 434 536 675.10 11 319 497.60 34 455 015.04 28 482 503.70 97 381 227.05 5 881 273.10
Information summaryUnits outstanding Eurobank 1 019 040.136 23 051 055.696 11 038 914.203 58 684 440.850 131 857.369 Units outstanding Eurobank USD - 935 500.039 596 746.564 3 541 442.246 57 862.893 Units outstanding Eurobank I 19 994.801 12 739.899 8 133 131.306 2 154 029.294 -Units outstanding Private Banking 16 698.985 290 120.036 10 056.568 1 471 535.791 574.719 Units outstanding Private Banking USD - 3 564.223 - 90 450.529 736.947 Units outstanding Private Banking DIS - - - - -Units outstanding Interamerican - - 12 937 137.162 850 392.742 90 824.837 Units outstanding Postbank - 308 234.133 311 587.339 428 653.688 12 378.272 Units outstanding Postbank BGN - - - - -Units outstanding Postbank USD - - - - 15 610.016 Units outstanding Bancpost RON - - - - -Units outstanding Bancpost - 1 911 394.865 164 942.999 673 369.994 31 303.333 Net asset value per unit : Eurobank EUR 10.7191 EUR 1.3036 EUR 0.8385 EUR 1.4329 EUR 17.2002Net asset value per unit : Eurobank USD - USD 1.3738 USD 0.8836 USD 1.5096 USD 18.1469Net asset value per unit : Eurobank I EUR 10.8685 EUR 1.4274 EUR 0.9211 EUR 1.4994 -Net asset value per unit : Private Banking EUR 10.7189 EUR 1.3036 EUR 0.8388 EUR 1.4328 EUR 17.2011Net asset value per unit : Private Banking USD - USD 1.3741 - USD 1.5098 USD 18.1273Net asset value per unit : Private Banking DIS - - - - -Net asset value per unit : Interamerican - - EUR 0.8385 EUR 1.4328 EUR 17.2701Net asset value per unit : Postbank - EUR 1.2412 EUR 0.7871 EUR 1.3886 EUR 17.3038Net asset value per unit : Postbank BGN - - - - -Net asset value per unit : Postbank USD - - - - USD 18.353Net asset value per unit : Bancpost RON - - - - -Net asset value per unit : Bancpost - EUR 1.2567 EUR 0.8062 EUR 1.3978 EUR 17.2528
Cost of securities portfolio 366 914 939.40 10 955 868.21 24 650 567.01 23 653 339.87 82 227 584.97 4 951 466.35
Total net assets at year/period ended:31/12/2014 277 594 425.36 988 011.58 45 040 087.98 40 174 808.40 82 649 321.93 5 813 104.29 31/12/2015 547 074 008.34 19 316 480.24 50 308 607.70 36 485 094.88 124 350 208.46 7 491 818.38 31/12/2016 434 536 675.10 11 319 497.60 34 455 015.04 28 482 503.70 97 381 227.05 5 881 273.10
N.A.V. per unit at year/period ended "Eurobank" unit :31/12/2014 EUR 10.0749 EUR 1.1339 EUR 0.7894 EUR 1.3158 EUR 15.595331/12/2015 EUR 10.6928 EUR 1.2470 EUR 0.7772 EUR 1.3610 EUR 16.924631/12/2016 EUR 10.7191 EUR 1.3036 EUR 0.8385 EUR 1.4329 EUR 17.2002
N.A.V. per unit at year/period ended "Eurobank USD" unit :31/12/2014 - USD 1.3765 USD 0.9584 USD 1.5971 USD 18.951231/12/2015 - USD 1.3573 USD 0.8458 USD 1.4812 USD 18.440031/12/2016 - USD 1.3738 USD 0.8836 USD 1.5096 USD 18.1469
N.A.V. per unit at year/period ended "Eurobank I" unit :31/12/2014 EUR 10.0853 EUR 1.2151 EUR 0.8498 EUR 1.3593 - 31/12/2015 EUR 10.7728 EUR 1.3508 EUR 0.8452 EUR 1.4151 - 31/12/2016 EUR 10.8685 EUR 1.4274 EUR 0.9211 EUR 1.4994 -
N.A.V. per unit at year/period ended "Private Banking" unit :31/12/2014 EUR 10.0751 EUR 1.1339 EUR 0.7894 EUR 1.3158 EUR 15.595431/12/2015 EUR 10.6925 EUR 1.2470 EUR 0.7772 EUR 1.3609 EUR 16.952931/12/2016 EUR 10.7189 EUR 1.3036 EUR 0.8388 EUR 1.4328 EUR 17.2011
N.A.V. per unit at year/period ended "Private Banking USD" unit :31/12/2014 - - - USD 1.5971 USD 18.933831/12/2015 - USD 1.3575 - USD 1.4813 USD 18.422531/12/2016 - USD 1.3741 - USD 1.5098 USD 18.1273
N.A.V. per unit at year/period ended "Interamerican" unit :31/12/2014 - - EUR 0.7895 - EUR 15.595131/12/2015 - - EUR 0.7773 EUR 1.3610 EUR 16.950231/12/2016 - - EUR 0.8385 EUR 1.4328 EUR 17.2701
N.A.V. per unit at year/period ended "Postbank" unit :31/12/2014 - EUR 1.0851 EUR 0.7486 EUR 1.2816 EUR 15.626731/12/2015 - EUR 1.1903 EUR 0.7333 EUR 1.3223 EUR 16.983831/12/2016 - EUR 1.2412 EUR 0.7871 EUR 1.3886 EUR 17.3038
N.A.V. per unit at year/period ended "Postbank BGN" unit :31/12/2014 - BGN 1.8463 BGN 1.3601 - - 31/12/2015 - - - - - 31/12/2016 - - - - -
N.A.V. per unit at year/period ended "Postbank USD" unit :31/12/2014 - - - - USD 19.080231/12/2015 - - - - USD 18.603631/12/2016 - - - - USD 18.353
N.A.V. per unit at year/period ended "Bancpost" unit :31/12/2014 - EUR 1.0986 EUR 0.7668 EUR 1.2901 EUR 15.581231/12/2015 - EUR 1.2051 EUR 0.7511 EUR 1.3311 EUR 16.934131/12/2016 - EUR 1.2567 EUR 0.8062 EUR 1.3978 EUR 17.2528
The accompanying notes form an integral part of these financial statements.15
Statement of Net AssetsAs at December 31, 2016
currency
Asset:
Securities portfolio at market valueCash at bankReceivable on interest and dividendsReceivable on securitiesReceivable on slxbscliptionsOther assets
Totnl islet:
Lilliilities
Subscriptions in advancePayable on purchasesRedemptions to be paidotlier payable and aeerued expenses
Totnl lilliilities
Total net Inetl at the end oflhe year/period
lntormation summaryUnits outstanding EumbankUnits outstanding Eumbank USDUnits outstanding EumbanklUnits outstanding Private BankingUnits outstanding Private Banking USDUnits outstanding Private Banking DISUnits outstanding Inter-amta-icanUnits outstanding PostbankUnits outstanding Postbank BGNUnits outstanding Postbank USDUnits outstanding Eanepost RONUnits outstanding BancpostNet asset value per unit : EumbankNet asset value per unit : Eumbank USDNetassetvalueperunit : EumbanklNet asset value per unit : Private BankingNet asset value per unit : Private Banking USDNet asset value per unit : Private Banking msNet asset value per unit : Inter-amta-icanNet asset value per unit : PostbankNet asset value per unit : Postbank BGNNet asset value per unit : Postbank USDNet asset value per unit : Eanepost RONNet asset value per unit : Bancpost
cost ofsecllrities portfolio
Total net assets at year/paiod ded:31/12/201431/12/201531/12/2016
N.A.V. per unit at year/paiod ded"ElImbank" unit :31/12/201431/12/201531/12/2016
N.A.V. per unit at year/period ended "Elimbank USD" unit :31/12/201431/12/201531/12/2016
N.A.V. per unit at year/period ended "Elimbank 1" unit :31/12/201431/12/201531/12/2016
N.A.V. per unit at year/period ended "Private 13anking" unit :31/12/201431/12/201531/12/2016
N.A.V. per unit at year/period ended "Private Banking USD" unit :31/12/201431/12/201531/12/2016
N.A.V. per unit at year/period ended "Interamenean" unit :31/12/201431/12/201531/12/2016
N.A.V. per unit at year/period ended "Postba|'lk" unit :31/12/201431/12/201531/12/2016
N.A.V. per unit at year/period ended "Postbank BGN" unit :31/12/201431/12/201531/12/2016
N.A.V. per unit at year/period ended "Postbank USD" unit :31/12/201431/12/201531/12/2016
N.A.V. per unit at year/period ended "Bancpost" unit :31/12/201431/12/201531/12/2016
(Ll7)Fnndu(l?l|n1ls— (1.P)Euud a1'Fl|ndI— (I.F)liindd'Fil1ll— (1.P)Eundot1=uur1a.Balanned Blend Europe Gloltal Emerging Balaanal Bltxll Real Estate
Marlret Gldnl
Notes EUR EUR EUR
11 146 921.22 27 935 473.32 96 568 156.65 5 751 125.74135 965.20 609 519.74 1 019 760.34 146 560.24
9.56 48.09 361.11 5.0093 050.00 . - .
. . 25 795.74 .633.11 1 346.35 4 922.76 234.36
11 376 57 09 28 546 38750 97 610 996.60 5 897 925.34
. 5 060.00 .
. - 1 669.2112 104.87 89 265.69 4 425.9851 778.93 143 443.86 10 557.05
57 081.49 63 883.80 237 769.55 16 65224
23 482 503.70 97 301 227.05 5 s81 273.10
1 019 040.136 11 038 914.203 58 684440.850 131 857.369. 596 746.564 3 541 442246 57 862.893
19 994.801 8133131.306 2 154 029294 .16 698.985 10 056.568 1 471 535.791 574.719
. 90450.529 736.947
12 937 137.162 850 392.742 90 824.837311 587.339 428 653.688 12 378.272
. - 15 610.016
164 942.999 673 369.994 31 303.333EUR 10.7191 EUR 0.8385 EUR 1.4329 EUR 17.2002
. USD 0.8836 U81) 1.5096 USD 18.1469EUR 10.8685 EUR 0.9211 EUR 1.4994 .EUR 10.7189 EUR 0.8388 EUR 1.4328 EUR 17.2011
. U81) 1.5098 USD 18.1273
EUR 0.8385 EUR 1.4328 EUR 17.2701EUR 0.7871 EUR 1.3886 EUR 17.3038
. - USD 18.353
EUR 0.8062 EUR 1.3978 EUR 17.2528
10 955 868.21 23 653 339.87 82 227 584.97 4 951466.35
988 011.58 40174 808.40 82 649 321.93 5 813 104.2919 316 480.24 36 485 094.88 124 350 208.46 7 491 818.3811 319 497.60 28 482 503.70 97 381 227.05 5 881273.10
EUR 10.0749 EUR 0.7894 EUR 1.3158 EUR 15.5953EUR 10.6928 EUR 0.7772 EUR 1.3610 EUR 16.9246EUR 10.7191 EUR 0.8385 EUR 1.4329 EUR 17.2002
USD 0.9584 U81) 1.5971 USD 18.9512USD 0.8458 U81) 1.4812 USD 18.4400USD 0.8836 U81) 1.5096 USD 18.1469
EUR 10.0853 EUR 0.8498 EUR 1.3593 .EUR 10.7728 EUR 0.8452 EUR 1.4151 .EUR 10.8685 EUR 0.9211 EUR 1.4994 .
EUR 10.0751 EUR 0.7894 EUR 1.3158 EUR 15.5954EUR 10.6925 EUR 0.7772 EUR 1.3609 EUR 16.9529EUR 10.7189 EUR 0.8388 EUR 1.4328 EUR 17.2011
. U81) 1.5971 USD 18.9338
. U81) 1.4813 USD 18.4225. U81) 1.5098 USD 18.1273
EUR 0.7895 — EUR 15.5951EUR 0.7773 EUR 1.3610 EUR 16.9502EUR 0.8385 EUR 1.4328 EUR 17.2701
EUR 0.7486 EUR 12816 EUR 15.6267EUR 0.7333 EUR 1.3223 EUR 16.9838EUR 0.7871 EUR 1.3886 EUR 17.3038
BGN 1.3601 — .
. — USD 19.0802
. — USD 18.6036. — USD 18.353
EUR0.7668 EUR 12901 EUR 15.5812EUR 0.7511 EUR 1.3311 EUR 16.9341EUR 0.8062 EUR 1.3978 EUR 17.2528
The accompanying notes fonn an integral part of these financial stateme ue.

Statement of Net AssetsAs at December 31, 2016 (Continued)
(LF) Fund of Funds - Dynamic Fixed Income
(LF) Fund of Funds - Global Low
(LF) Fund of Funds - Global Medium
(LF) Fund of Funds - Global High
(LF) Fund of Funds - Balanced Blend US
(LF) Fund of Funds - Tactical Allocation
Currency Notes EUR EUR EUR EUR EUR EUR
Assets
Securities portfolio at market value 2 1 879 504.47 156 499 903.00 36 246 123.35 7 946 374.09 21 024 815.09 4 077 875.21 Cash at bank 77 161.43 26 847 545.94 1 649 533.28 509 135.21 461 279.68 349 644.34 Receivable on interest and dividends 2 0.38 232 739.60 3 503.92 4 365.02 1 704.10 25.22 Receivable on securities 2 - - - - - - Receivable on subscriptions - - - 81 992.88 1 448.83 - Other assets 99.25 10 689.34 2 339.41 571.14 998.11 840.05
Total assets 1 956 765.53 183 590 877.88 37 901 499.96 8 542 438.34 21 490 245.81 4 428 384.82
Liabilities
Subscriptions in advance - - 13 979.51 7 720.95 3 000.00 - Payable on purchases - - - - - - Redemptions to be paid - 474 572.05 60 413.84 14 819.32 18 032.97 - Other payable and accrued expenses 1 493.26 195 357.64 47 359.98 13 949.37 34 351.71 8 003.13
Total liabilities 1 493.26 669 929.69 121 753.33 36 489.64 55 384.68 8 003.13
Total net assets at the end of the year/period 1 955 272.27 182 920 948.19 37 779 746.63 8 505 948.70 21 434 861.13 4 420 381.69
Information summaryUnits outstanding Eurobank - 15 884 569.741 2 679 606.218 522 186.289 1 073 722.833 -Units outstanding Eurobank USD - - - - 651 112.155 -Units outstanding Eurobank I 153 473.778 - - - 20 357.477 -Units outstanding Private Banking - 1 052 819.294 195 190.137 3 083.932 - -Units outstanding Private Banking USD - - 4 334.483 - 24 870.061 -Units outstanding Private Banking DIS - 15 887.899 - - - -Units outstanding Interamerican - - - - - 451 426.469 Units outstanding Postbank - - - - - -Units outstanding Postbank BGN - 93 917.050 45 338.291 - - -Units outstanding Postbank USD - - - - - -Units outstanding Bancpost RON - 23 575.991 310 774.251 151 534.359 - -Units outstanding Bancpost - - - - - -Net asset value per unit : Eurobank - EUR 10.7155 EUR 11.6777 EUR 12.5653 EUR 12.1079 -Net asset value per unit : Eurobank USD - - - - USD 12.7622 -Net asset value per unit : Eurobank I EUR 12.7401 - - - EUR 12.2827 -Net asset value per unit : Private Banking - EUR 10.7145 EUR 11.677 EUR 12.5655 - -Net asset value per unit : Private Banking USD - - - - USD 12.7616 -Net asset value per unit : Private Banking DIS - EUR 10.7157 EUR 11.6779 - - -Net asset value per unit : Interamerican - - - - - EUR 9.7920Net asset value per unit : Postbank - - - - - -Net asset value per unit : Postbank BGN - BGN 20.9561 BGN 22.8386 - - -Net asset value per unit : Postbank USD - - - - - -Net asset value per unit : Bancpost RON - RON 48.6349 RON 53.0023 RON 57.0843 - -Net asset value per unit : Bancpost - - - - - -
Cost of securities portfolio 1 778 739.64 154 339 565.34 34 684 529.26 7 334 667.35 18 324 163.48 4 014 447.92
Total net assets at year/period ended:31/12/2014 2 552 740.45 68 803 644.11 19 830 392.75 5 477 336.260 6 264 977.610 - 31/12/2015 1 796 235.35 219 524 267.86 45 996 002.08 11 816 818.92 29 828 785.33 159 689.14 31/12/2016 1 955 272.27 182 920 948.19 37 779 746.63 8 505 948.70 21 434 861.13 4 420 381.69
N.A.V. per unit at year/period ended "Eurobank" unit :31/12/2014 - EUR 10.5811 EUR 11.1320 EUR 11.4731 EUR 10.4256 - 31/12/2015 - EUR 10.6241 EUR 11.3507 EUR 11.9589 EUR 11.4014 - 31/12/2016 - EUR 10.7155 EUR 11.6777 EUR 12.5653 EUR 12.1079 -
N.A.V. per unit at year/period ended "Eurobank USD" unit :31/12/2014 - - - - USD 12.6585 - 31/12/2015 - - - - USD 12.4125 - 31/12/2016 - - - - USD 12.7622 -
N.A.V. per unit at year/period ended "Eurobank I" unit :31/12/2014 EUR 11.0639 - - - EUR 10.4416 - 31/12/2015 EUR 11.7039 - - - EUR 11.4922 - 31/12/2016 EUR 12.7401 - - - EUR 12.2827 -
N.A.V. per unit at year/period ended "Private Banking" unit :31/12/2014 - EUR 10.5805 EUR 11.1314 - - - 31/12/2015 - EUR 10.6234 EUR 11.3502 EUR 11.9586 EUR 11.3938 - 31/12/2016 - EUR 10.7145 EUR 11.677 EUR 12.5655 - -
N.A.V. per unit at year/period ended "Private Banking DIS" unit :31/12/2014 - - - - - - 31/12/2015 - EUR 10.6237 EUR 11.3506 - - - 31/12/2016 - EUR 10.7157 EUR 11.6779 - - -
N.A.V. per unit at year/period ended "Private Banking USD" unit :31/12/2014 - - - - - - 31/12/2015 - - - - USD 12.4118 - 31/12/2016 - - - - USD 12.7616 -
N.A.V. per unit at year ended "Postbank BGN" unit :31/12/2014 - - - - - - 31/12/2015 - BGN 20.7775 - - - - 31/12/2016 - BGN 20.9561 BGN 22.8386 - - -
N.A.V. per unit at year ended "Bancpost RON" unit :31/12/2014 - - - - - - 31/12/2015 - RON 48.0623 RON 51.3493 RON 54.1514 - - 31/12/2016 - RON 48.6349 RON 53.0023 RON 57.0843 - -
N.A.V. per unit at year ended "Interamerican" unit :31/12/2014 - - - - - 31/12/2015 - - - - - EUR 9.823431/12/2016 - - - - - EUR 9.7920
The accompanying notes form an integral part of these financial statements.16
Statement of Net AssetsAs at December 31, 2016 (Continued)
cni-neney
Asset:
secniities portfolio at market valueCash at bankReceivable on interest and dividendsReceivable on sscniitiesReceivable on subscriptionsOther assets
Tntat assets
Liabilities
Subscriptions in advanceFayable on purchasesRedemption: Io be paidOther payable and wanted expenses
Total liabilities
Total net assets at ttae end nmae year/period
1n1ni-niatinn snnunaryUnits outstanding EnmbankUnits outstanding Enmbank USDUnits outstanding Enmbank 1Units outstanding Fiivats BankingUnits outstanding Fiivats Banking USDUnits outstanding Fiivats Banking msUnits outstanding lntei-antericanUnits outstanding PostbankUnits outstanding Postbank BGNUnits outstanding Postbank USDUnits outstanding Bancpost RoNUnits outstanding BancpostNet asset ullle pet unit ; EnmbankNet asset ullle pet unit ; Enmbank USDNet asset ullle pet unit ; Enmbank 1Net asset ullle pet unit ; Fiivats BankingNet asset ullle pet unit Fiivats Banking USDNet asset ullle pet unit ; Fiivats Banking msNet asset wine per unit : lntei-unsn-icanNet asset ullle pet unit ; PostbankNet asset ullle pet unit ; Postbank BGNNet asset ullle pet unit ; Postbank USDNet asset ullle pet unit ; Bancpost RoNNet asset wine per unit : Bancpost
Cost ofsecurities portiblio
Total net assets at year/period ended:31/12/201431/12/201531/12/2016
N.A.V. pet unit at year/period ended "Eurobank" unit :31/12/201431/12/201531/12/2016
N.A.V. per unit at year/period ded"Eumbank USD" unit ;31/12/201431/12/201531/12/2016
N.A.V. per unit at year/period ded"Eumbank 1- unit :31/12/201431/12/201531/12/2016
N.A.V. per unit at year/period ded"Private Banking" unit ;31/12/201431/12/201531/12/2016
N.A.V. per unit at year/period ded"Private Banking 1313" nnit :31/12/201431/12/201531/12/2016
N.A.V. per unit at year/period ded"Private Banking USD" unit :31/12/201431/12/201531/12/2016
N.A.V. per unit at year ded"Postbank new unit ;31/12/201431/12/201531/12/2016
N.A.V. per unit at year ded"Bancpost RON" nnit :31/12/201431/12/201531/12/2016
N.A.V. per unit at year ded"InIenme1'ican" unit ;31/12/201431/12/201531/12/2016
(LF) Fund n1Fnnda . (LF) Fnnd uI'FIlnd: . (LF) Fund of]-‘and: .clnbal Lmv Glnbnl High Tnetiul Allontitm
Nntss EUR
156 499 903.00 7 946 374.09 4 077 375.2126 347 545.94 509 135.21 349 644.34
232 739.60 4 365.02 25.22
. 31 992.33 .10 639.34 571.14 340.05
133 590 377.113 3 542 43334 4 423 334.32
. 7 720.95 .
474 572.05 14 319.32 .195 357.64 13 949.37 3 003.13
36 439 4 3 003.13
4 420 331.69
15 334 569.741 522 136.239 .
1 052 319.294 3 033.932 .
15 337.399 .. 451 426.469
93 917.050 .
23 575.991 151 534.359 .
EUR 10.7155 EUR 12.5653 .
EUR 10.7145 EUR 12.5655 .
EUR 10.7157 .. EUR 9.7920
BGN 20.9561 .
RoN 43.6349 RoN 57.0343 .
154 339 565.34 7 334 667.35 4 014 447.92
63 303 644.11 5 477 336.260 .219 524 267.36 11316 313.92 159 639.14132 920 943.19 3 505 943.70 4 420 331.69
EUR 10.5311 EUR 11.4731 .EUR 10.6241 EUR 11.9539 .EUR 10.7155 EUR 12.5653 .
EUR 10.5305 . .EUR 10.6234 EUR 11.95 .EUR 10.7145 EUR 12.56 .
EUR 10.6237 .EUR 10.7157 .
BGN 20.7775 .BGN 20.9561 .
RoN 43.0623 RoN 54.1514 :RoN 43.6349 RoN 57.0343 .
EUR 9.3234EUR 9.7920
The accompanying notes fonn an integral part of these financial statements.
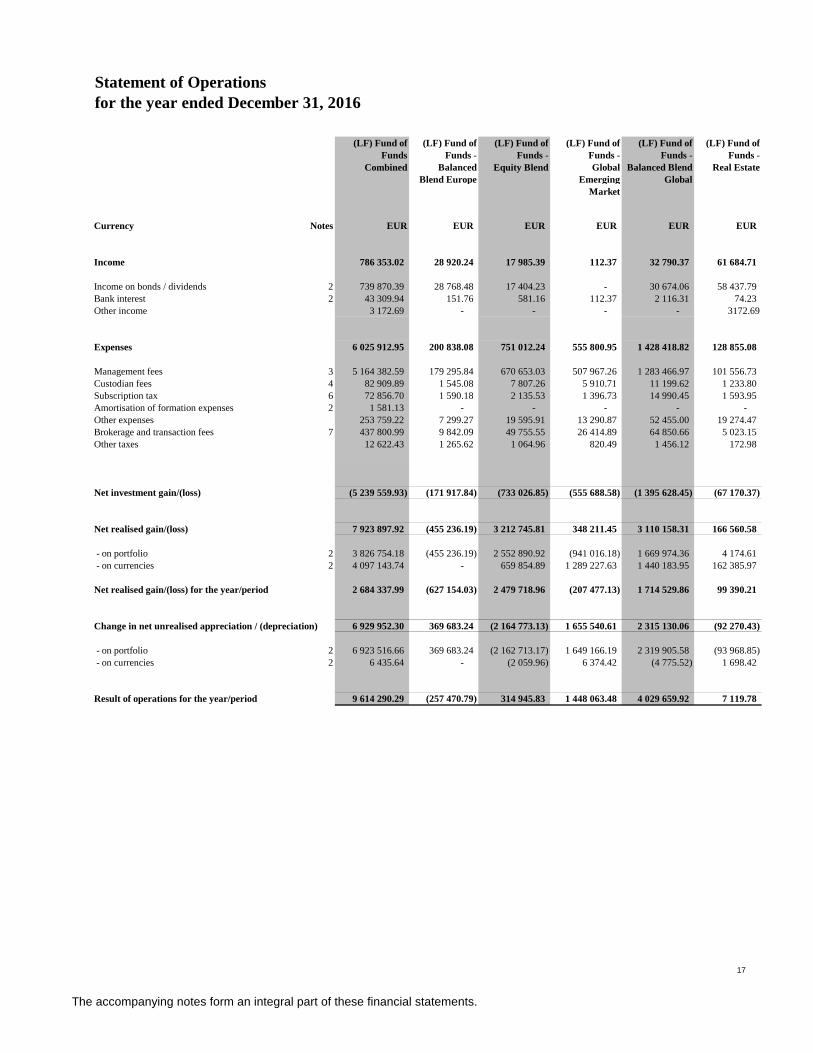
Statement of Operationsfor the year ended December 31, 2016
720 730 740 750
(LF) Fund of Funds
(LF) Fund of Funds -
(LF) Fund of Funds -
(LF) Fund of Funds -
(LF) Fund of Funds -
(LF) Fund of Funds -
Combined Balanced Blend Europe
Equity Blend Global Emerging
Market
Balanced Blend Global
Real Estate
Currency Notes EUR EUR EUR EUR EUR EUR
Income 786 353.02 28 920.24 17 985.39 112.37 32 790.37 61 684.71
Income on bonds / dividends 2 739 870.39 28 768.48 17 404.23 - 30 674.06 58 437.79 Bank interest 2 43 309.94 151.76 581.16 112.37 2 116.31 74.23 Other income 3 172.69 - - - - 3172.69
Expenses 6 025 912.95 200 838.08 751 012.24 555 800.95 1 428 418.82 128 855.08
Management fees 3 5 164 382.59 179 295.84 670 653.03 507 967.26 1 283 466.97 101 556.73 Custodian fees 4 82 909.89 1 545.08 7 807.26 5 910.71 11 199.62 1 233.80 Subscription tax 6 72 856.70 1 590.18 2 135.53 1 396.73 14 990.45 1 593.95 Amortisation of formation expenses 2 1 581.13 - - - - - Other expenses 253 759.22 7 299.27 19 595.91 13 290.87 52 455.00 19 274.47 Brokerage and transaction fees 7 437 800.99 9 842.09 49 755.55 26 414.89 64 850.66 5 023.15 Other taxes 12 622.43 1 265.62 1 064.96 820.49 1 456.12 172.98
Net investment gain/(loss) (5 239 559.93) (171 917.84) (733 026.85) (555 688.58) (1 395 628.45) (67 170.37)
Net realised gain/(loss) 7 923 897.92 (455 236.19) 3 212 745.81 348 211.45 3 110 158.31 166 560.58
- on portfolio 2 3 826 754.18 (455 236.19) 2 552 890.92 (941 016.18) 1 669 974.36 4 174.61 - on currencies 2 4 097 143.74 - 659 854.89 1 289 227.63 1 440 183.95 162 385.97
Net realised gain/(loss) for the year/period 2 684 337.99 (627 154.03) 2 479 718.96 (207 477.13) 1 714 529.86 99 390.21
Change in net unrealised appreciation / (depreciation) 6 929 952.30 369 683.24 (2 164 773.13) 1 655 540.61 2 315 130.06 (92 270.43)
- on portfolio 2 6 923 516.66 369 683.24 (2 162 713.17) 1 649 166.19 2 319 905.58 (93 968.85) - on currencies 2 6 435.64 - (2 059.96) 6 374.42 (4 775.52) 1 698.42
9 614 290.29Result of operations for the year/period 9 614 290.29 (257 470.79) 314 945.83 1 448 063.48 4 029 659.92 7 119.78
The accompanying notes form an integral part of these financial statements.
17
Statement of Operationsfor the year ended December 31, 2016
Currency Notes
Income
Income on bonds / dividends 2Bank interest 2Other income
Expenses
Management feesCustodian feesSubscription taxAmortisation of formation expensesOther expensesBrokerage and transaction fees 7Other taxes
NOH-kw
Net investment gain/(loss)
Net realised gain/(loss)
— on portfolio 2— on currencies 2
Net realised gain/(loss) for the year/period
Change in net unrealised appreciation / (depreciation)
— on portfolio 2— on currencies 2
Result of operations for the year/period
The accompanying notes form an integral part of these financial statements.
(LF) Fund of (LF) Fund of (LF) Fund of (LF) Fund of (LF) Fund of (LF) Fund ofFunds Funds - Funds - Funds - Funds - Funds -
Combined Balanced Equity Blend Global Balanced Blend Real EstateBlend Europe Emerging Global
Market
EUR EUR EUR EUR EUR EUR
786 353.02 28 920.24 17 985.39 112.37 32 790.37 61 684.71
739 870.39 28 768.48 17 404.23 — 30 674.06 58 437.7943 309.94 151.76 581.16 112.37 2 116.31 74.23
3 172.69 — — — — 3172.69
6 025 912.95 200 838.08 751 012.24 555 800.95 1 428 418.82 128 855.08
5 164 382.59 179 295.84 670 653.03 507 967.26 1 283 466.97 101 556.7382 909.89 1 545.08 7 807.26 5 910.71 11 199.62 1 233.8072 856.70 1 590.18 2 135.53 1 396.73 14 990.45 1 593.95
1 581 .13 — — — — —253 759.22 7 299.27 19 595.91 13 290.87 52 455.00 19 274.47437 800.99 9 842.09 49 755.55 26 414.89 64 850.66 5 023.15
12 622.43 1 265.62 1 064.96 820.49 1 456.12 172.98
(5 239 559.93) (171 917.84) (733 026.85) (555 688.58) (1 395 628.45) (67 170.37)
7 923 897.92 (455 236.19) 3 212 745.81 348 211.45 3 110 158.31 166 560.58
3 826 754.18 (455 236.19) 2 552 890.92 (941 016.18) 1 669 974.36 4 174.614 097 143.74 — 659 854.89 1 289 227.63 1 440 183.95 162 385.97
2 684 337.99 (627 154.03) 2 479 718.96 (207 477.13) 1 714 529.86 99 390.21
6 929 952.30 369 683.24 (2 164 773.13) 1 655 540.61 2 315 130.06 (92 270.43)
6 923 516.66 369 683.24 (2 162 713.17) 1 649 166.19 2 319 905.58 (93 968.85)6 435.64 — (2 059.96) 6 374.42 (4 775.52) 1 698.42
9 614 290.29 (257 470.79) 314 945.83 1 448 063.48 4 029 659.92 7 119.78
17

Statement of Operationsfor the year ended December 31, 2016 (Continued)
820 830 840 860 861 862
(LF) Fund of Funds -
(LF) Fund of Funds -
(LF) Fund of Funds -
(LF) Fund of Funds -
(LF) Fund of Funds -
(LF) Fund of Funds -
Dynamic Fixed Income
Global Low Global Medium
Global High Balanced Blend US
Tactical allocation
NotesCurrency EUR EUR EUR EUR EUR EUR
Income 9.02 480 570.54 85 938.76 32 685.46 36 052.00 9 604.16
Income on portfolio / dividends 2 - 441 470.86 85 246.74 32 528.86 35 734.46 9 604.91 Bank interest 2 9.02 39 099.68 692.02 156.60 317.54 (0.75) Other income - - - - - -
Expenses 20 355.06 1 942 504.04 481 003.12 132 667.22 324 869.33 59 589.01
Management fees 3 13 433.24 1 556 659.51 405 569.94 112 613.23 292 856.10 40 310.74 Custodian fees 4 374.38 41 911.26 8 211.64 1 851.91 2 452.71 411.52 Subscription tax 6 84.24 40 022.94 5 986.89 1 926.32 2 698.81 430.66 Amortisation of formation expenses 2 - 1 021.14 395.29 164.70 - - Other expenses 4 809.35 101 604.89 20 141.00 4 126.88 10 588.11 573.47 Brokerage and transaction fees 7 1 601.07 195 472.76 39 562.64 11 732.00 15 944.41 17 601.77 Other taxes 52.78 5 811.54 1 135.72 252.18 329.19 260.85
Net investment gain/(loss) (20 346.04) (1 461 933.50) (395 064.36) (99 981.76) (288 817.33) (49 984.85)
Net realised gain/(loss) 71 944.37 1 223 494.61 208 919.57 (69 278.81) 87 572.84 18 805.38
- on portfolio 2 70 891.56 1 001 972.21 146 874.48 (117 424.68) (114 609.12) 8 262.21 - on currencies 2 1 052.81 221 522.40 62 045.09 48 145.87 202 181.96 10 543.17
Net realised gain/(loss) for the year/period 51 598.33 (238 438.89) (186 144.79) (169 260.57) (201 244.49) (31 179.47)
Change in net unrealised appreciation / (depreciation) 107 438.59 1 979 997.94 1 122 736.44 413 381.02 1 157 262.37 65 825.59
- on portfolio 2 107 012.67 1 979 016.66 1 124 511.34 416 894.63 1 148 071.79 65 936.58 - on currencies 2 425.92 981.28 (1 774.90) (3 513.61) 9 190.58 (110.99)
159 036.92Result of operations for the year/period 159 036.92 1 741 559.05 936 591.65 244 120.45 956 017.88 34 646.12
The accompanying notes form an integral part of these financial statements.
18
Statement of Operationsfor the year ended December 31, 2016 (Continued)
NotesCurrency
Income
Income on portfolio / dividends 2Bank interest 2Other income
Expenses
Management feesCustodian feesSubscription taxAmortisation of formation expensesOther expensesBrokerage and transaction fees 7Other taxes
Ncx-km
Net investment gain/(loss)
Net realised gain/(loss)
— on portfolio 2— on currencies 2
Net realised gain/(loss) for the year/period
Change in net unrealised appreciation / (depreciation)
— on portfolio 2— on currencies 2
Result of operations for the year/period
(LF) Fund of (LF) Fund of (LF) Fund of (LF) Fund of (LF) Fund of (LF) Fund ofFunds - Funds - Funds - Funds - Funds - Funds -
Dynamic Global Low Global Global High Balanced TacticalFixed Income Medium Blend US allocation
EUR EUR EUR EUR EUR EUR
9.02 480 570.54 85 938.76 32 685.46 36 052.00 9 604.16
— 441 470.86 85 246.74 32 528.86 35 734.46 9 604.919.02 39 099.68 692.02 156.60 317.54 (0.75)
20 355.06 1 942 504.04 481 003.12 132 667.22 324 869.33 59 589.01
13 433.24 1 556 659.51 405 569.94 112 613.23 292 856.10 40 310.74374.38 41911.26 8211.64 1851.91 2452.71 411.52
84.24 40 022.94 5 986.89 1 926.32 2 698.81 430.66— 1 021.14 395.29 164.70 — —
4 809.35 101 604.89 20 141.00 4 126.88 10 588.11 573.471 601.07 195 472.76 39 562.64 11 732.00 15 944.41 17 601.77
52.78 5 811.54 1 135.72 252.18 329.19 260.85
(20 346.04) (1 461 933.50) (395 064.36) (99 981.76) (288 817.33) (49 984.85)
71 944.37 1 223 494.61 208 919.57 (69 278.81) 87 572.84 18 805.38
70 891.56 1 001 972.21 146 874.48 (117 424.68) (114 609.12) 8 262.211 052.81 221 522.40 62 045.09 48 145.87 202 181.96 10 543.17
51 598.33 (238 438.89) (186 144.79) (169 260.57) (201 244.49) (31 179.47)
107 438.59 1 979 997.94 1 122 736.44 413 381.02 1 157 262.37 65 825.59
107 012.67 1 979 016.66 1 124 511.34 416 894.63 1 148 071.79 65 936.58425.92 981.28 (1 774.90) (3 513.61) 9 190.58 (110.99)
159 036.92 1 741 559.05 936 591.65 244 120.45 956 017.88 34 646.12
The accompanying notes form an integral part of these financial statements.
18
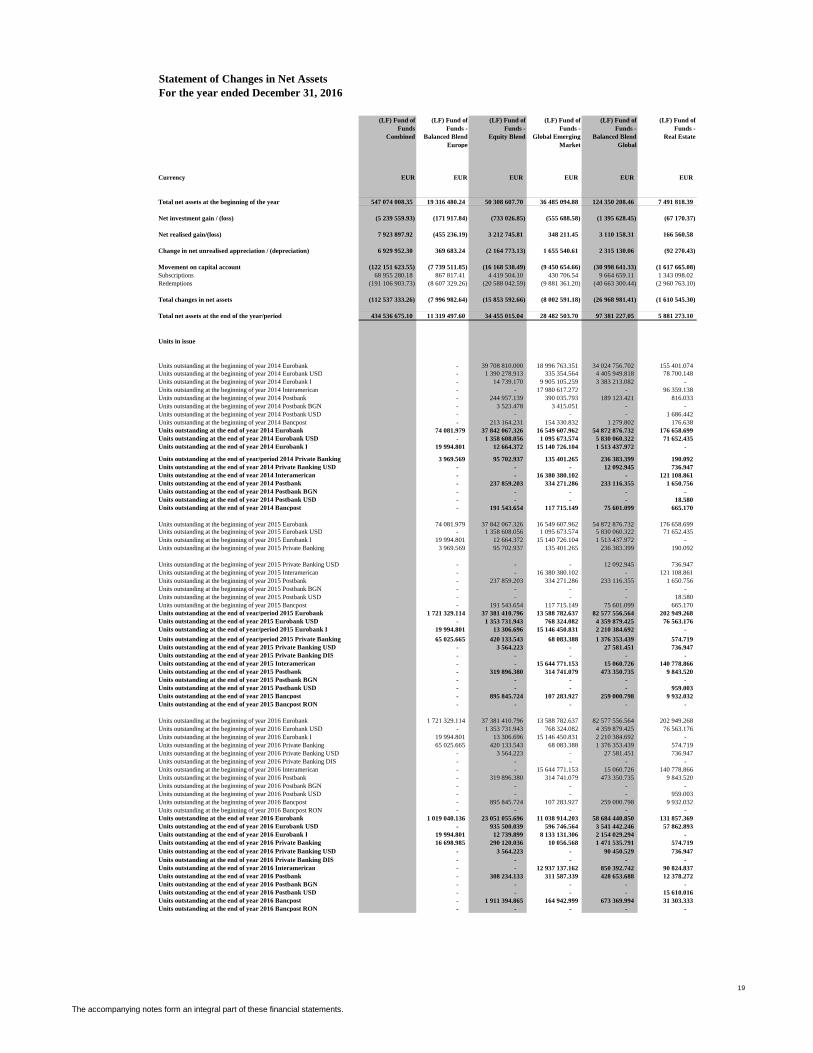
Statement of Changes in Net AssetsFor the year ended December 31, 2016
710 720 730
(LF) Fund of Funds
(LF) Fund of Funds -
(LF) Fund of Funds -
(LF) Fund of Funds -
(LF) Fund of Funds -
(LF) Fund of Funds -
Combined Balanced Blend Europe
Equity Blend Global Emerging Market
Balanced Blend Global
Real Estate
Currency EUR EUR EUR EUR EUR EUR
Total net assets at the beginning of the year 547 074 008.35 19 316 480.24 50 308 607.70 36 485 094.88 124 350 208.46 7 491 818.39
Net investment gain / (loss) (5 239 559.93) (171 917.84) (733 026.85) (555 688.58) (1 395 628.45) (67 170.37)
Net realised gain/(loss) 7 923 897.92 (455 236.19) 3 212 745.81 348 211.45 3 110 158.31 166 560.58
Change in net unrealised appreciation / (depreciation) 6 929 952.30 369 683.24 (2 164 773.13) 1 655 540.61 2 315 130.06 (92 270.43)
Movement on capital account (122 151 623.55) (7 739 511.85) (16 168 538.49) (9 450 654.66) (30 998 641.33) (1 617 665.08) Subscriptions 68 955 280.18 867 817.41 4 419 504.10 430 706.54 9 664 659.11 1 343 098.02 Redemptions (191 106 903.73) (8 607 329.26) (20 588 042.59) (9 881 361.20) (40 663 300.44) (2 960 763.10)
Total changes in net assets (112 537 333.26) (7 996 982.64) (15 853 592.66) (8 002 591.18) (26 968 981.41) (1 610 545.30) 434 536 675.09
Total net assets at the end of the year/period 434 536 675.10 11 319 497.60 34 455 015.04 28 482 503.70 97 381 227.05 5 881 273.10
Units in issue
Units outstanding at the beginning of year 2014 Eurobank - 39 708 810.000 18 996 763.351 34 024 756.702 155 401.074 Units outstanding at the beginning of year 2014 Eurobank USD - 1 390 278.913 335 354.564 4 405 949.818 78 700.148 Units outstanding at the beginning of year 2014 Eurobank I - 14 739.170 9 905 105.259 3 383 213.082 - Units outstanding at the beginning of year 2014 Interamerican - - 17 980 617.272 - 96 359.138 Units outstanding at the beginning of year 2014 Postbank - 244 957.139 390 035.793 189 123.421 816.033 Units outstanding at the beginning of year 2014 Postbank BGN - 3 523.478 3 415.051 - - Units outstanding at the beginning of year 2014 Postbank USD - - - - 1 686.442 Units outstanding at the beginning of year 2014 Bancpost - 213 164.231 154 330.832 1 279.802 176.638 Units outstanding at the end of year 2014 Eurobank 74 081.979 37 842 067.326 16 549 607.962 54 872 876.732 176 658.699 Units outstanding at the end of year 2014 Eurobank USD - 1 358 608.056 1 095 673.574 5 830 060.322 71 652.435 Units outstanding at the end of year 2014 Eurobank I 19 994.801 12 664.372 15 140 726.104 1 513 437.972 -
Units outstanding at the end of year/period 2014 Private Banking 3 969.569 95 702.937 135 401.265 236 383.399 190.092 Units outstanding at the end of year 2014 Private Banking USD - - - 12 092.945 736.947 Units outstanding at the end of year 2014 Interamerican - - 16 380 380.102 - 121 108.861 Units outstanding at the end of year 2014 Postbank - 237 859.203 334 271.286 233 116.355 1 650.756 Units outstanding at the end of year 2014 Postbank BGN - - - - - Units outstanding at the end of year 2014 Postbank USD - - - - 18.580 Units outstanding at the end of year 2014 Bancpost - 191 543.654 117 715.149 75 601.099 665.170
Units outstanding at the beginning of year 2015 Eurobank 74 081.979 37 842 067.326 16 549 607.962 54 872 876.732 176 658.699 Units outstanding at the beginning of year 2015 Eurobank USD - 1 358 608.056 1 095 673.574 5 830 060.322 71 652.435 Units outstanding at the beginning of year 2015 Eurobank I 19 994.801 12 664.372 15 140 726.104 1 513 437.972 - Units outstanding at the beginning of year 2015 Private Banking 3 969.569 95 702.937 135 401.265 236 383.399 190.092
Units outstanding at the beginning of year 2015 Private Banking USD - - - 12 092.945 736.947 Units outstanding at the beginning of year 2015 Interamerican - - 16 380 380.102 - 121 108.861 Units outstanding at the beginning of year 2015 Postbank - 237 859.203 334 271.286 233 116.355 1 650.756 Units outstanding at the beginning of year 2015 Postbank BGN - - - - - Units outstanding at the beginning of year 2015 Postbank USD - - - - 18.580 Units outstanding at the beginning of year 2015 Bancpost - 191 543.654 117 715.149 75 601.099 665.170 Units outstanding at the end of year/period 2015 Eurobank 1 721 329.114 37 381 410.796 13 588 782.637 82 577 556.564 202 949.268 Units outstanding at the end of year 2015 Eurobank USD - 1 353 731.943 768 324.082 4 359 879.425 76 563.176 Units outstanding at the end of year/period 2015 Eurobank I 19 994.801 13 306.696 15 146 450.831 2 210 384.692 -
Units outstanding at the end of year/period 2015 Private Banking 65 025.665 420 133.543 68 083.388 1 376 353.439 574.719 Units outstanding at the end of year 2015 Private Banking USD - 3 564.223 - 27 581.451 736.947 Units outstanding at the end of year 2015 Private Banking DIS - - - - - Units outstanding at the end of year 2015 Interamerican - - 15 644 771.153 15 060.726 140 778.866 Units outstanding at the end of year 2015 Postbank - 319 896.380 314 741.079 473 350.735 9 843.520 Units outstanding at the end of year 2015 Postbank BGN - - - - - Units outstanding at the end of year 2015 Postbank USD - - - - 959.003 Units outstanding at the end of year 2015 Bancpost - 895 845.724 107 283.927 259 000.798 9 932.032 Units outstanding at the end of year 2015 Bancpost RON - - - - -
Units outstanding at the beginning of year 2016 Eurobank 1 721 329.114 37 381 410.796 13 588 782.637 82 577 556.564 202 949.268 Units outstanding at the beginning of year 2016 Eurobank USD - 1 353 731.943 768 324.082 4 359 879.425 76 563.176 Units outstanding at the beginning of year 2016 Eurobank I 19 994.801 13 306.696 15 146 450.831 2 210 384.692 - Units outstanding at the beginning of year 2016 Private Banking 65 025.665 420 133.543 68 083.388 1 376 353.439 574.719 Units outstanding at the beginning of year 2016 Private Banking USD - 3 564.223 - 27 581.451 736.947 Units outstanding at the beginning of year 2016 Private Banking DIS - - - - - Units outstanding at the beginning of year 2016 Interamerican - - 15 644 771.153 15 060.726 140 778.866 Units outstanding at the beginning of year 2016 Postbank - 319 896.380 314 741.079 473 350.735 9 843.520 Units outstanding at the beginning of year 2016 Postbank BGN - - - - - Units outstanding at the beginning of year 2016 Postbank USD - - - - 959.003 Units outstanding at the beginning of year 2016 Bancpost - 895 845.724 107 283.927 259 000.798 9 932.032 Units outstanding at the beginning of year 2016 Bancpost RON - - - - - Units outstanding at the end of year 2016 Eurobank 1 019 040.136 23 051 055.696 11 038 914.203 58 684 440.850 131 857.369 Units outstanding at the end of year 2016 Eurobank USD - 935 500.039 596 746.564 3 541 442.246 57 862.893 Units outstanding at the end of year 2016 Eurobank I 19 994.801 12 739.899 8 133 131.306 2 154 029.294 - Units outstanding at the end of year 2016 Private Banking 16 698.985 290 120.036 10 056.568 1 471 535.791 574.719 Units outstanding at the end of year 2016 Private Banking USD - 3 564.223 - 90 450.529 736.947 Units outstanding at the end of year 2016 Private Banking DIS - - - - - Units outstanding at the end of year 2016 Interamerican - - 12 937 137.162 850 392.742 90 824.837 Units outstanding at the end of year 2016 Postbank - 308 234.133 311 587.339 428 653.688 12 378.272 Units outstanding at the end of year 2016 Postbank BGN - - - - - Units outstanding at the end of year 2016 Postbank USD - - - - 15 610.016 Units outstanding at the end of year 2016 Bancpost - 1 911 394.865 164 942.999 673 369.994 31 303.333 Units outstanding at the end of year 2016 Bancpost RON - - - - -
The accompanying notes form an integral part of these financial statements.
19
Statement of Changes in Net AssetsFor the year ended December 31, 2016
(LF) Fund or (LF) Fund of (LF) Fund or (LF) Fund of (LF) Fund of (LF) Fund ofFunds Funds - Funds — Funds — Funds — Funds —
Combined Balanced Blend Equity Blend Global Emerging Balanced Blend Real EstateEurope Market Global
Currency EUR EUR EUR EUR EUR EUR
Total net assets at the beginning of the year 547 074 00835 19 316 480.24 50 308 607.70 36 485 (194.88 124 350 208.46 7 491 818.39
Net investment gain / (loss) (5 239 559.93) (171 917.94) (733 026.85) (555 688.58) (1 395 628.45) (67 170.37)
Net realised gainI(Ioss) 7 923 897.92 (455 236.19) 3 212 745.81 348 211.45 3 110 158.31 166 560.58
Change in net unrealised appreciation I (depreciation) 6 929 95230 369 683.24 (2 164 773.13) 1 655 540.61 2 315 130.06 (92 270.43)
Movement on capital account (122 151 623.55) (7 739 511.95) (16 168 5311.49) (9 450 654.66) (30 9911 641.33) (1 617 665.08)Subscriptions 68 955 280.18 867 817.41 4 419 504.10 430 706.54 9 664 659.11 1 343 098.02Redemptions (191 106 903.73) (3 607 329.26) (20 533 042.59) (9 881 361.20) (40 663 300.44) (2 960 763.10)
Total changes in net assets (112 537 333.26) (7 996 982.64) (15 1:53 592.66) (3 002 591.18) (26 968 9111.41) (1 610 545.30)
Total net assets at the end ofthe year/period 434 536 675.10 11 319 497.60 34 455 015.04 28 482 503.70 97 381 227.05 5 881 273.10
Units in issue
Units outstanding at the beginning ofyear 2014 Eurobank — 39 708 810.000 18 996 763.351 34 024 756.702 155 401.074Units outstanding at the beginning ofyear 2014 Eurobank USD — 1 390 278.913 335 354.564 4 405 949.818 78 700.148Units outstanding at the beginning ofyear 2014 Eurobankl — 14 739.170 9 905 105.259 3 383 213.082 —
Units outstanding at the beginning ofyear 20141nte1ame|’iCan — . 17 980 617.272 — 96 359.138Units outstanding at the beginning ofyear 2014 Postbank — 244 957.139 390 035.793 189 123.421 816.033Units outstanding at the beginning ofyear 2014 Postbank BGN — 3 523.473 3 415.051 — —Units outstanding at the beginning ofyear 2014 Postbank USD — . — — 1 686.442Units outstanding at the beginning ofyear 2014 Bancpost — 213 164.231 154 330.832 1 279.802 176.638Units outstanding at the end ofyear 2014 Ellrobank 74 081.979 37 842 067.326 16 549 607.962 54 872 876.732 176 658.699Units outstanding at the end ofyear 2014 Eurobank USD — 1 358 608.056 1 (195 673.574 5 830 060322 71 652.435Units outstanding at the end ofyear 2014 Eurobank I 19 994.801 12 664.372 15 140 726.104 1 513 437.972 —
Units outstanding at the end of year/period 2014 Private Banking 3 969.569 95 702.937 135 401.265 236 383399 190.092Units outstanding at the end ofyear 2014 Private Banking USD — — — 12 092.945 736.947Units outstanding at the end of year 2014 Interameriean — — 16 380 380.102 - 121 108.861Units outstanding at the end ofyear 2014 Posthank — 237 859.203 334 271.286 233 116355 1 650.756Units outstanding at the end of year 2014 Posthank BGN — — - - —Units outstanding at the end of year 2014 Posthank USD — — - - 18.580Units outstanding at the end of year 2014 Bancpost — 191 543.654 117 715.149 75 601.099 665.170
Units outstanding at the beginning ofyear 2015 Eurobank 74 081.979 37 842 067.326 16 549 607.962 54 872 876.732 176 658.699Units outstanding at the beginning ofyear 2015 Eurobank USD — 1 358 608.056 1 095 673.574 5 830 060.322 71 652.435Units outstanding at the beginning ofyear 2015 Eurobank I 19 994.801 12 664.372 15 140 726.104 1 513 437.972 —
Units outstanding at the beginning ofyear 2015 Private Banking 3 969.569 95 702.937 135 401.265 236 383.399 190.092
Units outstanding at the beginning ofyear 2015 Private Banking USD — . — 12 092.945 736.947Units outstanding at the beginning ofyear 2015 Interamerican — - 16 380 380.102 — 121 108.861Units outstanding at the beginning ofyear 2015 Postbank — 237 859.203 334 271.286 233 116.355 1 650.756Units outstanding at the beginning ofyear 2015 Postbank BGN — . — . —Units outstanding at the beginning ofyear 2015 Postbank USD — . — — 18.580Units outstanding at the beginning ofyear 2015 Bancpost — 191 543.654 1 17 715.149 75 601.099 665.170Units outstanding at the end ofyearlperiod 2015 Eurobank 1 721 329.114 37 381 410.796 13 588 782.637 82 577 556.564 202 949.268Units outstanding at the end ofyear 2015 Eurobank USD — 1 353 731.943 768 324.082 4 359 879.425 76 563.176Units outstanding at the end of year/period 2015 Eurobank I 19 994.801 13 306.696 15 146 450.831 2 210 384.692 -Units outstanding at the end of year/period 2015 Private Banking 65 025.665 420 133543 68 083388 1 376 353.439 574.719Units outstanding at the end of year 2015 Private Banking USD — 3 564.223 - 27 581.451 736.947Units outstanding at the end of year 2015 Private Banking DIS — — - - -Units outstanding at the end of year 2015 Interamerican — — 15 644 771.153 15 060.726 140 778.866Units outstanding at the end ofyear 2015 Posthank — 319 896.380 314 741.079 473 350.735 9 843.520Units outstanding at the end of year 2015 Posthank BGN — — - - —Units outstanding at the end of year 2015 Posthank USD — 959.003Units outstanding at the end of year 2015 Bancpost — 895 845.724 107 283.927 259 000.798 9 932.032Units outstanding at the end of year 2015 Bancpost RON — — - - -
Units outstanding at the beginning ofyear 2016 Eurobank 1 721 329.114 37 381 410.796 13 588 782.637 82 577 556.564 202 949.268Units outstanding at the beginning ofyear 2016 Eurobank USD — 1 353 731.943 768 324.082 4 359 879.425 76 563.176Units outstanding at the beginning ofyear 2016 Eurobank I 19 994.801 13 306.696 15 146 450.831 2 210 384.692 —Units outstanding at the beginning ofyear 2016 Private Banking 65 025.665 420 133.543 68 083.388 1 376 353.439 574.719Units outstanding at the beginning ofyear 2016 Private Banking USD — 3 564.223 — 27 531.451 736.947Units outstanding at the beginning ofyear 2016 Private Banking DIS — . — . —Units outstanding at the beginning ofyear 2016 Inteiamerican — - 15 644 771.153 15 060.726 140 778.866Units outstanding at the beginning ofyear 2016 Postbank — 319 896.380 314 741.079 473 350.735 9 843.520Units outstanding at the beginning ofyear 2016 Postbank BGN — . — . —Units outstanding at the beginning ofyear 2016 Postbank USD — . — — 959.003Units outstanding at the beginning ofyear 2016 Bancpost — 895 845.724 107 283.927 259 000.798 9 932.032Units outstanding at the beginning ofyear 2016 Banepost RON — . — — —Units outstanding at the end ofyear 2016 Ellrobank 1 019 040.136 23 051 055.696 11 038 914.203 58 684 440.850 131 857.369Units outstanding at the end of year 2016 Eurobank USD — 935 500.039 596 746.564 3 541 442.246 57 862.893Units outstanding at the end ofyear 2016 Eurobank I 19 994.801 12 739.899 8 133 131306 2 154 029.294 —Units outstanding at the end of year 2016 Private Banking 16 698.985 290 120.036 10 056.568 1 471 535.791 574.719Units outstanding at the end of year 2016 Private Banking USD — 3 564.223 - 90 450.529 736.947Units outstanding at the end of year 2016 Private Banking DIS — — - - -Units outstanding at the end of year 2016 Interameriean — — 12 937 137.162 850 392.742 90 824.837Units outstanding at the end of year 2016 Posthank — 308 234.133 311 587339 428 653.688 12 378.272Units outstanding at the end of year 2016 Posthank BGN — — - - —Units outstanding at the end of year 2016 Posthank USD — — - - 15 610.016Units outstanding at the end ofyear 2016 Bancpost — 1 911 394.865 164 942.999 673 369.994 31 303.333Units outstanding at the end of year 2016 Bancpost RON — — - - -
The accompanying notes form an integral part of these financial statements.

Statement of Changes in Net AssetsFor the year ended December 31, 2016 (Continued)
(LF) Fund of Funds - (LF) Fund of Funds - (LF) Fund of Funds - (LF) Fund of Funds - (LF) Fund of Funds - (LF) Fund of Funds -
Dynamic Fixed Income
Global Low Global Medium Global High Balanced Blend US Tactical Allocation
Currency EUR EUR EUR EUR EUR EUR
Total net assets at the beginning of the year 1 796 235.35 219 524 267.86 45 996 002.08 11 816 818.92 29 828 785.33 159 689.14
Net investment gain / (loss) (20 346.04) (1 461 933.50) (395 064.36) (99 981.76) (288 817.33) (49 984.85)
Net realised gain/(loss) 71 944.37 1 223 494.61 208 919.57 (69 278.81) 87 572.84 18 805.38
Change in net unrealised appreciation / (depreciation) 107 438.59 1 979 997.94 1 122 736.44 413 381.02 1 157 262.37 65 825.59
Movement on capital account - (38 344 878.72) (9 152 847.10) (3 554 990.67) (9 349 942.08) 4 226 046.43 Subscriptions - 35 408 781.69 7 328 157.58 3 248 489.69 1 574 094.12 4 669 971.92 Redemptions - (73 753 660.41) (16 481 004.68) (6 803 480.36) (10 924 036.20) (443 925.49)
Total changes in net assets 159 036.92 (36 603 319.67) (8 216 255.45) (3 310 870.22) (8 393 924.20) 4 260 692.55 #REF!Total net assets at the end of the year/period 1 955 272.27 182 920 948.19 37 779 746.63 8 505 948.70 21 434 861.13 4 420 381.69
Units in issue
Units outstanding at the beginning of year 2014 Eurobank - 1 265 303.488 472 590.383 154 791.368 - - Units outstanding at the beginning of year 2014 Eurobank USD - - - - - - Units outstanding at the beginning of year 2014 Eurobank I 181 382.305 - - - - - Units outstanding at the beginning of year 2014 Interamerican - - - - - - Units outstanding at the beginning of year 2014 Postbank - - - - - - Units outstanding at the beginning of year 2014 Postbank BGN - - - - - - Units outstanding at the beginning of year 2014 Postbank USD - - - - - - Units outstanding at the beginning of year 2014 Bancpost - - - - - - Units outstanding at the end of year 2014 Eurobank - 6 371 274.435 1 739 373.693 477 406.317 192 931.679 - Units outstanding at the end of year 2014 Eurobank USD - - - - 387 576.140 - Units outstanding at the end of year 2014 Eurobank I 230 727.494 - - - 20 357.477 -
Units outstanding at the end of year/period 2014 Private Banking - 131 210.570 42 007.969 - - - Units outstanding at the end of year 2014 Private Banking USD - - - - - - Units outstanding at the end of year 2014 Interamerican - - - - - - Units outstanding at the end of year 2014 Postbank - - - - - - Units outstanding at the end of year 2014 Postbank BGN - - - - - - Units outstanding at the end of year 2014 Postbank USD - - - - - - Units outstanding at the end of year 2014 Bancpost - - - - - -
Units outstanding at the beginning of year 2015 Eurobank - 6 371 274.435 1 739 373.693 477 406.317 192 931.679 - Units outstanding at the beginning of year 2015 Eurobank USD - - - - 387 576.140 - Units outstanding at the beginning of year 2015 Eurobank I 230 727.494 - - - 20 357.477 - Units outstanding at the beginning of year 2015 Private Banking
Units outstanding at the beginning of year 2015 Private Banking USDUnits outstanding at the beginning of year 2015 Interamerican - 131 210.570 42 007.969 - - - Units outstanding at the beginning of year 2015 Postbank - - - - - - Units outstanding at the beginning of year 2015 Postbank BGN - - - - - - Units outstanding at the beginning of year 2015 Postbank USD - - - - - - Units outstanding at the beginning of year 2015 Bancpost - - - - - - Units outstanding at the end of year/period 2015 Eurobank - 20 194 034.106 3 777 533.481 901 445.726 1 712 762.122 - Units outstanding at the end of year 2015 Eurobank USD - - - - 876 597.882 - Units outstanding at the end of year/period 2015 Eurobank I 153 473.778 - - - 20 357.477 -
Units outstanding at the end of year/period 2015 Private Banking - 358 211.673 184 523.573 19 108.582 91.677 - Units outstanding at the end of year 2015 Private Banking USD - - - - 6 281.926 - Units outstanding at the end of year 2015 Private Banking DIS - 18 648.714 4 334.483 - - - Units outstanding at the end of year 2015 Interamerican - - - - - 16 256.007 Units outstanding at the end of year 2015 Postbank - - - - - - Units outstanding at the end of year 2015 Postbank BGN - 84 288.679 - - - - Units outstanding at the end of year 2015 Postbank USD - - - - - - Units outstanding at the end of year 2015 Bancpost - - - - - - Units outstanding at the end of year 2015 Bancpost RON - 7 668.501 85 893.599 67 503.054 - -
Units outstanding at the beginning of year 2016 Eurobank - 20 194 034.106 3 777 533.481 901 445.726 1 712 762.122 - Units outstanding at the beginning of year 2016 Eurobank USD - - - - 876 597.882 - Units outstanding at the beginning of year 2016 Eurobank I 153 473.778 - - - 20 357.477 - Units outstanding at the beginning of year 2016 Private Banking - 358 211.673 184 523.573 19 108.582 91.677 - Units outstanding at the beginning of year 2016 Private Banking USD - - - - 6 281.926 - Units outstanding at the beginning of year 2016 Private Banking DIS - 18 648.714 4 334.483 - - - Units outstanding at the beginning of year 2016 Interamerican - - - - - 16 256.007 Units outstanding at the beginning of year 2016 Postbank - - - - - - Units outstanding at the beginning of year 2016 Postbank BGN - 84 288.679 - - - - Units outstanding at the beginning of year 2016 Postbank USD - - - - - - Units outstanding at the beginning of year 2016 Bancpost - - - - - - Units outstanding at the beginning of year 2016 Bancpost RON - 7 668.501 85 893.599 67 503.054 - - Units outstanding at the end of year 2016 Eurobank - 15 884 569.741 2 679 606.218 522 186.289 1 073 722.833 - Units outstanding at the end of year 2016 Eurobank USD - - - - 651 112.155 - Units outstanding at the end of year 2016 Eurobank I 153 473.778 - - - 20 357.477 - Units outstanding at the end of year 2016 Private Banking - 1 052 819.294 195 190.137 3 083.932 - - Units outstanding at the end of year 2016 Private Banking USD - - 4 334.483 - 24 870.061 - Units outstanding at the end of year 2016 Private Banking DIS - 15 887.899 - - - - Units outstanding at the end of year 2016 Interamerican - - - - - 451 426.469 Units outstanding at the end of year 2016 Postbank - - - - - - Units outstanding at the end of period 2016 Postbank BGN - 93 917.050 45 338.291 - - - Units outstanding at the end of year 2016 Postbank USD - - - - - - Units outstanding at the end of year 2016 Bancpost - - - - - - Units outstanding at the end of year 2016 Bancpost RON - 23 575.991 310 774.251 151 534.359 - -
The accompanying notes form an integral part of these financial statements.
20
Statement of Changes in Net AssetsFor the year ended December 31, 2016 (Continued)
(LF) Fund of Funds - (LF) Fund of Funds — (LF) Fund of Funds — (LF) Fund of Funds - (LF) Fund of Funds - (LF) Fund oiFunds —
Dynamic Fixed Global Low Glohal Medium Global High Balanced Blend US TacticalIncome Allocation
Currency EUR EUR EUR EUR EUR EUR
Total net assets at the beginning oithe year 1 796 235.35 219 524 267.86 45 996 002.08 11 816 818.92 29 828 785.33 159 689.14
Net investment gain I (loss) (20 346.04) (1 461 933.50) (395 064.36) (99 981.76) (233 31733) (49 934.35)
Net realised gaill/(loss) 71 944.37 1 223 494.61 208 919.57 (69 278.81) 87 572.84 18 805.38
Change in net unrealised appreciation I (depreciation) 107 438.59 1 979 997.94 1 122 736.44 413 381.02 1 157 262.37 65 825.59
Movement on capital account — (38 344 878.72) (9 152 847.10) (3 554 990.67) (9 349 942.08) 4 226 046.43Subscriptions — 35 408 781.69 7 328 157.58 3 248 489.69 1 574 094.12 4 669 971.92Redemptions — (73 753 660.41) (16 431 004.63) (6 303 430.36) (10 924 036.20) (443 925.49)
Total changes in net assets 159 036.92 (36 603 319.67) (8 216 255.45) (3 310 870.22) (8 393 924.20) 4 260 692.55
Total net assets at the end oithe year/period 1 955 272.27 182 920 948.19 37 779 746.63 8 505 948.70 21 434 861.13 4 420 381.69
Units in issue
Units outstanding at the beginning ofyear 2014 Eurobank — 1 265 303.488 472 590.383 154 791.368 — —Units outstanding at the beginning ofyear 2014 Eurobank USD — . — . — .Units outstanding at the beginning ofyear 2014 Eurobank 1 131 332.305 — — . — —Units outstanding at the beginning ofyear 2014 lnteramerican — . — . — .Units outstanding at the beginning ofyear 2014 Posthank — . — . — .Units outstanding at the beginning ofyear 2014 Posthank BGN — . — . — .Units outstanding at the beginning ofyear 2014 Posthank usn — . — . — .Units outstanding at the beginning ofyear 2014 Bancpost — . — . — .Units outstanding at the end 01 year 2014 Ellrohank — 6 371 274.435 1 739 373.693 477 406.317 192 931.679 —Units outstanding at the end oiyear 2014 Eurohank USD — — — — 387 576.140 —Units outstanding at the end oiyear 2014 Eurohauk l 230 727.494 — - — 20 357.477 -
Units outstanding at the end oiyear/period 2014 Private Banking — 131 210.570 42 007.969 — — —Units outstanding at the end oiyear 2014 Private Banking USD - — - — — -Units outstanding at the end of year 2014 lnteramerican - — - — — -Units outstanding at the end of year 2014 Postbank - — - — — -Units outstanding at the end oiyear 2014 Postbank BGN - — - — — -Units outstanding at the end oiyear 2014 Postbank USD - — - — — -Units outstanding at the end of year 2014 Bancpost - — - — — -
Units outstanding at the beginning ofyear 2015 Eurobank — 6 371 274.435 1 739 373.693 477 406.317 192 931.679 -Units outstanding at the beginning ofyear 2015 Eurobank USD — — — . 337 576.140 —Units outstanding at the beginning ofyear 2015 Eurobank 1 230 727.494 — — . 20 357.477 —Units outstanding at the beginning ofyear 2015 Private BankingUnits outstanding at the beginning ofyear 2015 Private Banking usnUnits outstanding at the beginning ofyear 2015 lnteramerican — 131 210.570 42 007.969 . — .Units outstanding at the beginning ofyear 2015 Posthank — . —Units outstanding at the beginning ofyear 2015 Posthank BGN — . — . — .Units outstanding at the beginning ofyear 2015 Posthank usn — — — — — —Units outstanding at the beginning ofyear 2015 Bancpost — — — — — —Units outstanding at the end oiyear/period 2015 Eurohank - 20 194 034.106 3 777 533.481 901 445.726 1 712 762.122 -Units outstanding at the end oiyear 2015 Eurohank USD — — — — 876 597.882 —Units outstanding at the end oiyear/period 2015 Eurohank l 153 473.778 — - — 20 357.477 -Units outstanding at the end 01 year/period 2015 Private Banking — 358 211.673 184 523.573 19 108.582 91.677 —Units outstanding at the end oiyear 2015 Private Banking USD - — - — 6 281.926 -Units outstanding at the end oiyear 2015 Private Banking DIS — 18 648.714 4 334.483 — — —Units outstanding at the end of year 2015 lnteramerican - — - — — 16 256.007Units outstanding at the end of year 2015 Postbank - — - — — -Units outstanding at the end of year 2015 Postbank BGN - 84 288.679 - — — -Units outstanding at the end oiyear 2015 Postbank USD -Units outstanding at the end of year 2015 Bancpost - — - — — -Units outstanding at the end oiyear 2015 Bancpost RON — 7 668.501 85 893.599 67 503.054 — —
Units outstanding at the beginning ofyear 2016 Eurobank — 20 194 034.106 3 777 533.481 901 445.726 1 712 762.122 -Units outstanding at the beginning ofyear 2016 Eurobank USD — — — . 876 597.332 —Units outstanding at the beginning ofyear 2016 Eurobankl 153 473.773 — — . 20 357.477 —Units outstanding at the beginning ofyear 2016 Private Banking — 358 211.673 184 523.573 19 108.582 91.677 —Units outstanding at the beginning ofyear 2016 Private Banking USD — — — . 6 281.926 —Units outstanding at the beginning ofyear 2016 Private Banking DIS — 13 643.714 4 334.433 . — —Units outstanding at the beginning ofyear 2016 lnteramerican — . —Units outstanding at the beginning ofyear 2016 Posthank — . — . — .Units outstanding at the beginning ofyear 2016 Posthank BGN — 34 233.679 — . — —Units outstanding at the beginning ofyear 2016 Posthank usn — . — . — .Units outstanding at the beginning ofyear 2016 Bancpost — . — . — .Units outstanding at the beginning ofyear 2016 Bancpost RON — 7 668.501 85 893.599 67 503.054 — —Units outstanding at the end oiyear 2016 Eurohank — 15 884 569.741 2 679 606.218 522 186.289 1 073 722.833 —Units outstanding at the end oiyear 2016 Eurohank USD - — - — 651 112.155 -Units outstanding at the end oiyear 2016 Eurohauk l 153 473.778 — - — 20 357.477 -Units outstanding at the end oiyear 2016 Private Banking - 1 052 819.294 195 190.137 3 083.932 — -Units outstanding at the end oiyear 2016 Private Banking USD - — 4 334.483 — 24 870.061 -Units outstanding at the end oiyear 2016 Private Banking DIS - 15 887.899 - — — -Units outstanding at the end of year 2016 lnteramerican - — - — — 451 426.469Units outstanding at the end of year 2016 Postbank - — - — — -Units outstanding at the end of period 2016 Posthank BGN — 93 917.050 45 338.291 - — -Units outstanding at the end oiyear 2016 Postbank USD - — - — — -Units outstanding at the end of year 2016 Bancpost - — - —Units outstanding at the end of year 2016 Bancpost RON - 23 575.991 310 774.251 151 534.359 — -
20
The accompanying notes form an integral part of these financial statements.

(LF) Fund of Funds - Balanced Blend Europe
Schedule of investmentsAs at December 31, 2016(All figures in Euros)
Cost Market % of NetCurrency Units Name Price Price Assets
Transferable securities admitted to an official exchange listing
Investment Funds
EUR 14 978.390 BGF - EUROPEAN VALUE (D€) 1 015 289.06 1 035 605.88 9.15%EUR 250 000.000 BNY MELLON GL-EUROLAND BF (C€-Acc) 509 253.69 502 650.00 4.44%EUR 30 000.000 FF - EURO BOND FUND 466 169.06 472 500.00 4.17%EUR 30 000.000 FIDELITY FD-EUR DYN G-Y ACC 477 095.44 510 900.00 4.51%EUR 40 000.000 GS EUROPE CORE EQUITY PORTFOLIO INSTL AC 579 287.71 622 000.00 5.49%EUR 40 009.830 INVESCO PAN EUR STRUC EQTY - C 744 477.27 742 182.35 6.56%EUR 34 372.820 INVESCO PAN EUROPEAN SMALL CAP EQUITY 800 304.08 823 229.04 7.27%EUR 5 000.000 ISHARES B EURO AGG BOND 617 956.49 614 000.00 5.42%EUR 16 000.000 ISHARES DJ EURO STOXX 50 571 672.38 529 280.00 4.68%EUR 30 000.000 M&G European Corporate Bond (C€-Acc) 572 939.33 583 506.00 5.15%EUR 20 210.614 MORGAN STANLEY-EURO STRAT BOND 803 000.00 824 593.05 7.28%EUR 11 040.227 MS EURO CORPORATE BD FUND (Z€-Acc) 450 209.72 464 683.15 4.11%EUR 15 000.000 MS INVF - EUROPEAN PROPERTY FND (Z€) 658 031.76 631 200.00 5.58%EUR 2 600.000 PARVEST BD EURO GOVERNMENT 537 764.65 546 520.00 4.83%EUR 4 500.000 PIONEER FDS EUR STRATEGIC BOND (I-I€) 466 436.99 492 660.00 4.35%EUR 42 000.000 PIONEER FDS EURO BOND (I-Acc-€) 475 480.58 477 960.00 4.22%EUR 355.581 PIONEER SF- EURO CURVE 1-3 (I-I€) 400 000.00 399 505.92 3.53%EUR 12 770.190 SCHRODER INTL EUROPEAN EQ ALPHA (C-Acc) 810 500.00 873 945.83 7.72%
Total Investments in Investment Funds 10 955 868.21 11 146 921.22 98.48%
Total Investments 10 955 868.21 11 146 921.22 98.48%96.26
Portfolio breakdownAs at December 31, 2016
By countries
Germany 4.75%Ireland 10.02%Luxembourg 80.00%United Kingdom 5.23%
Total 100.00%
By type of investments
Investment Funds 100.00%
Total 100.00%
The accompanying notes form an integral part of these financial statements. 21
(LF) Fund of Funds - Balanced Blend Europe
Schedule of investmentsAs at December 31, 2016(Allfigurex in Euros)
Cost Market % ofNetCurrency Units Name Price Price Assets
Transferable securities admitted to an official exchange listing
Investment Funds
EUR 14 978.390 BGF - EUROPEAN VALUE (D€) 1 015 289.06 1 035 605.88 9.15%EUR 250 000.000 BNY MELLON GL-EUROLAND BF (C€»Acc) 509 253.69 502 650.00 4.44%EUR 30 000.000 FF - EURO BOND FUND 466 169.06 472 500.00 4.17%EUR 30 000.000 FIDELITY FD-EUR DYN G-Y ACC 477 095.44 510 900.00 4.51%EUR 40 000.000 GS EUROPE CORE EQUITY PORTFOLIO INSTL AC 579 287.71 622 000.00 5.49%EUR 40 009.830 INVESCO PAN EUR STRUC EQTY - C 744 477.27 742 182.35 6.56%EUR 34 372.820 INVESCO PAN EUROPEAN SMALL CAP EQUITY 800 304.08 823 229.04 7.27%EUR 5 000.000 ISHARES B EURO AGG BOND 617 956.49 614 000.00 5.42%EUR 16 000.000 ISHARES DJ EURO STOXX 50 571 672.38 529 280.00 4.68%EUR 30 000.000 M&G European Corporate Bond (C€»Acc) 572 939.33 583 506.00 5.15%EUR 20 210.614 MORGAN STANLEY-EURO STRAT BOND 803 000.00 824 593.05 7.28%EUR 11 040.227 MS EURO CORPORATE BD FUND (Z€»Acc) 450 209.72 464 683.15 4.11%EUR 15 000.000 MS INVF - EUROPEAN PROPERTY FND (Z€) 658 031.76 631 200.00 5.58%EUR 2 600.000 PARVEST BD EURO GOVERNMENT 537 764.65 546 520.00 4.83%EUR 4 500.000 PIONEER FDS EUR STRATEGIC BOND (I»I€) 466 436.99 492 660.00 4.35%EUR 42 000.000 PIONEER FDS EURO BOND (I-Acc-€) 475 480.58 477 960.00 4.22%EUR 355.581 PIONEER SF- EURO CURVE 1-3 (I-I€) 400 000.00 399 505.92 3.53%EUR 12 770.190 SCHRODER INTL EUROPEAN EQ ALPHA (C-Acc) 810 500.00 873 945.83 7.72%
Total Investments in Investment Funds 10 955 868.21 11 146 921.22 98.48%
Total Investments 10 955 868.21 11 146 921.22 98.48%
Portfolio breakdownAs at December 31, 2016
By countries
Gennany 4.75%Ireland 10.02%Luxembourg 80.00%United Kingdom 5.23%
Total 100.00%
By type of investments
Investment Funds 100.00%
Total 100.00%
The accompanying notes form an integral part of these financial statements. 21

(LF) Fund of Funds - Equity Blend
Schedule of investmentsAs at December 31, 2016(All figures in Euros)
Cost Market % of NetCurrency Units Name Price Price Assets
Transferable securities admitted to an official exchange listing
Investment Funds
EUR 6 440.104 (LF) EQUITY - MENA FUND (ERB I €) 100 000.00 87 251.82 0.25%EUR 737 000.000 (LF) I EQUITY- GLOBAL EQUTIES FUND 627 965.25 943 433.70 2.74%EUR 702 772.639 (LF)I EQUITY- EMERGING EUROPE FUND 674 127.18 619 142.69 1.80%EUR 102 668.410 FIDELITY FDS-EURO SM-Y ACC€ 1 743 126.65 2 131 396.19 6.19%EUR 383 647.277 PIONEER FDS US PIONEER (I-Acc-€) 2 109 446.77 3 801 944.52 11.03%EUR 49 279.880 SCHRODER INTL EURO EQT(C€-ACC) 1 885 406.83 1 916 992.26 5.56%EUR 25 913.640 SCHRODER INTL EUROPEAN EQ ALPHA (C-Acc) 1 356 573.52 1 773 436.23 5.15%EUR 5 258.040 SCHRODER INTL JPN EQ-C ACC 607 929.05 658 367.08 1.91%EUR 4 666.874 SILK-ROAD FRONTIERS FUND 440 000.00 464 493.97 1.35%EUR 18 291.918 TEMPLETON ASIAN GROWTH FUND (I €) 455 343.20 549 855.06 1.60%
9 999 918.44 12 946 313.52 37.57%
USD 55 668.02 BGF - WORLD FIN. EQTY FUND (D$) 999 818.21 1 211 483.14 3.52%USD 310 107.66 FIDELITY FUNDS-AMERICA-Y ACC 2 406 378.15 5 660 251.76 16.43%USD 152 081.62 FIDELITY-CHINA FOCUS FUND (Y$-Acc) 2 139 124.50 2 273 794.07 6.60%USD 46 384.23 FRANKLIN U.S. OPPORTUNITIES FUND (I$) 1 317 320.40 1 326 269.60 3.85%USD 12 563.71 INVESCO JAPANESE EQUITY CORE(C$H) 2 170 449.17 2 675 315.76 7.76%USD 10 696.07 MORGAN STANLEY INVEST F-INDIAN EQUITY Z$ 369 831.60 398 984.53 1.16%USD 102 100.47 MORGAN STANLEY US EQUITY GROWTH (Z$-Acc) 2 966 519.52 4 829 456.01 14.02%USD 14 116.87 MS INVEST F -GLOBAL OPPORT 589 795.76 657 832.04 1.91%USD 7 759.29 PARVEST EQUITY USA SMALL CAP(I$) 1 691 411.26 1 733 455.05 5.03%
14 650 648.57 20 766 841.96 60.27%
Total Investments in Investment Funds 24 650 567.01 33 713 155.48 97.85%
Total Investments 24 650 567.01 33 713 155.48 97.85%96.26
Portfolio breakdownAs at December 31, 2016
By countries
Ireland 7.94%Luxembourg 92.06%
Total 100.00%
By type of investments
Investment Funds 100.00%
Total 100.00%
The accompanying notes form an integral part of these financial statements. 22
(LF) Fund of Funds - Equity Blend
Schedule of investmentsAs at December 31, 2016(Allfigures in Eums)
Cost Market % ofNetCurrency Units Name Price Price Assets
Transferable securities admitted to an official exchange listing
Investment Funds
EUR 6 440.104 (LF) EQUITY - MENA FUND (ERB I €) 100 000.00 87 251.82 0.25%EUR 737 000.000 (LF) I EQUITY- GLOBAL EQUTIES FUND 627 965.25 943 433.70 2.74%EUR 702 772.639 (LF)I EQUITY- EMERGING EUROPE FUND 674 127.18 619 142.69 1.80%EUR 102 668.410 FIDELITY FDS-EURO SM-Y ACC€ 1 743 126.65 2 131 396.19 6.19%EUR 383 647.277 PIONEER FDS US PIONEER (I-Acc-€) 2 109 446.77 3 801 944.52 11.03%EUR 49 279.880 SCHRODER INTL EURO EQT(C€-ACC) 1 885 406.83 1 916 992.26 5.56%EUR 25 913.640 SCHRODER INTL EUROPEAN EQ ALPI-[A (C-Acc) 1 356 573.52 1 773 436.23 5.15%EUR 5 258.040 SCHRODER INTL JPN EQ-C ACC 607 929.05 658 367.08 1.91%EUR 4 666.874 SILK-ROAD FRONTIERS FUND 440 000.00 464 493.97 1.35%EUR 18 291.918 TEMPLETON ASIAN GROWTH FUND (1 €) 455 343.20 549 855.06 1.60%
9 999 918.44 12 946 313.52 37.57%
USD 55 668.02 BGF - WORLD FIN. EQTY FUND (D$) 999 818.21 1 211 483.14 3.52%USD 310 107.66 FIDELITY FUNDS-AMERICA-Y ACC 2 406 378.15 5 660 251.76 16.43%USD 152 081.62 FIDELITY-CHINA FOCUS FUND (Y$~Acc) 2 139 124.50 2 273 794.07 6.60%USD 46 384.23 FRANKLIN U.S. OPPORTUNITIES FUND (135) 1 317 320.40 1 326 269.60 3.85%USD 12 563.71 INVESCO JAPANESE EQUITY CORE(C$H) 2 170 449.17 2 675 315.76 7.76%USD 10 696.07 MORGAN STANLEY INVEST F-INDIAN EQUITY Z$ 369 831.60 398 984.53 1.16%USD 102 100.47 MORGAN STANLEY US EQUITY GROWTH (Z$—Acc) 2 966 519.52 4 829 456.01 14.02%USD 14 116.87 MS INVEST F -GLOBAL OPPORT 589 795.76 657 832.04 1.91%USD 7 759.29 PARVEST EQUITY USA SMALL CAP(I$) 1 691 411.26 1 733 455.05 5.03%
14 650 648.57 20 766 841.96 60.27%
Total Investments in Investment Funds 24 650 567.01 33 713 155.48 97.85%
Total Investments 24 650 567.01 33 713 155.48 97.85%
Portfolio breakdownAs at December 31, 2016
By countries
Ireland 7.94%Luxembourg 92.06%
Total 100.00%
By type of investments
Investment Funds 100.00%
Total 100.00%
The accompanying notes form an integral part of these financial statements. 22
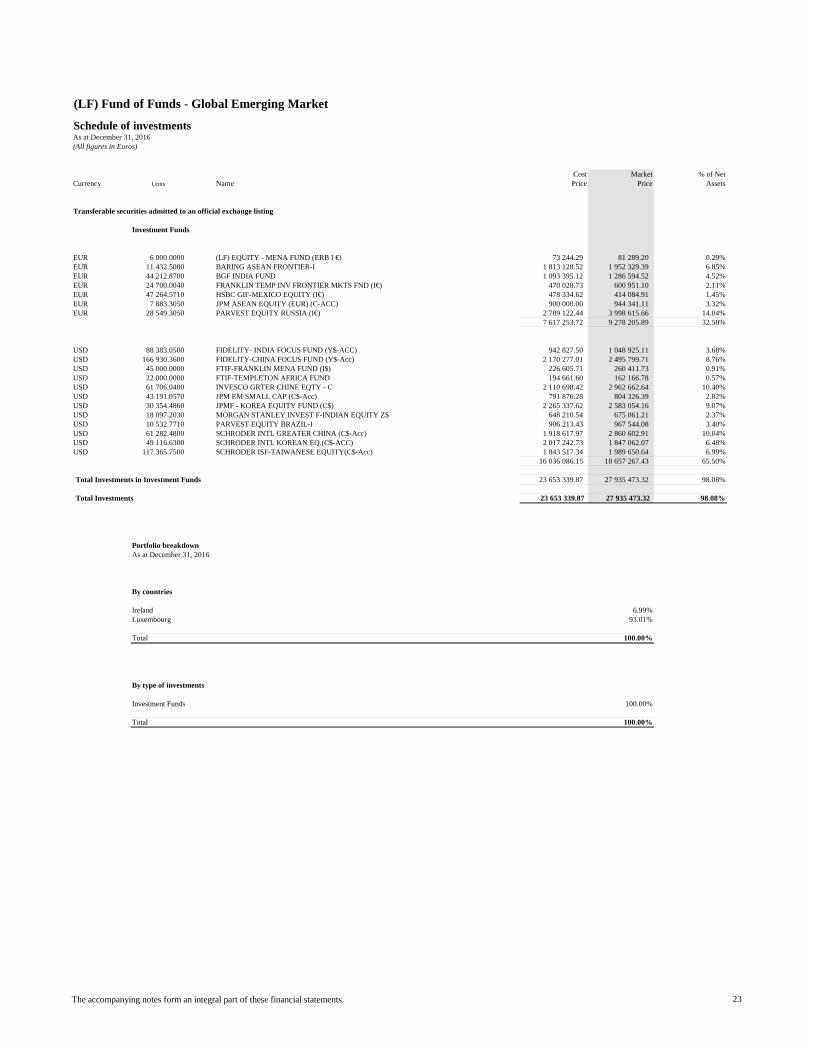
(LF) Fund of Funds - Global Emerging Market
Schedule of investmentsAs at December 31, 2016(All figures in Euros)
Cost Market % of NetCurrency Units Name Price Price Assets
Transferable securities admitted to an official exchange listing
Investment Funds
EUR 6 000.0000 (LF) EQUITY - MENA FUND (ERB I €) 73 244.29 81 289.20 0.29%EUR 11 432.5080 BARING ASEAN FRONTIER-I 1 813 128.52 1 952 329.39 6.85%EUR 44 212.8700 BGF INDIA FUND 1 093 395.12 1 286 594.52 4.52%EUR 24 700.0040 FRANKLIN TEMP INV FRONTIER MKTS FND (I€) 470 028.73 600 951.10 2.11%EUR 47 264.5710 HSBC GIF-MEXICO EQUITY (I€) 478 334.62 414 084.91 1.45%EUR 7 883.3050 JPM ASEAN EQUITY (EUR) (C-ACC) 900 000.00 944 341.11 3.32%EUR 28 549.3050 PARVEST EQUITY RUSSIA (I€) 2 789 122.44 3 998 615.66 14.04%
7 617 253.72 9 278 205.89 32.58%
USD 88 383.0500 FIDELITY- INDIA FOCUS FUND (Y$-ACC) 942 827.50 1 048 925.11 3.68%USD 166 930.3600 FIDELITY-CHINA FOCUS FUND (Y$-Acc) 2 170 277.01 2 495 799.71 8.76%USD 45 000.0000 FTIF-FRANKLIN MENA FUND (I$) 226 605.71 260 411.73 0.91%USD 22 000.0000 FTIF-TEMPLETON AFRICA FUND 194 661.60 162 166.78 0.57%USD 61 706.0400 INVESCO GRTER CHINE EQTY - C 2 110 698.42 2 962 662.64 10.40%USD 43 191.0570 JPM EM SMALL CAP (C$-Acc) 791 876.28 804 326.39 2.82%USD 30 354.4860 JPMF - KOREA EQUITY FUND (C$) 2 265 337.62 2 583 054.16 9.07%USD 18 097.2030 MORGAN STANLEY INVEST F-INDIAN EQUITY Z$ 648 210.54 675 061.21 2.37%USD 10 532.7710 PARVEST EQUITY BRAZIL-I 906 213.43 967 544.08 3.40%USD 61 282.4800 SCHRODER INTL GREATER CHINA (C$-Acc) 1 918 617.97 2 860 602.91 10.04%USD 49 116.6300 SCHRODER INTL KOREAN EQ.(C$-ACC) 2 017 242.73 1 847 062.07 6.48%USD 117 365.7500 SCHRODER ISF-TAIWANESE EQUITY(C$-Acc) 1 843 517.34 1 989 650.64 6.99%
16 036 086.15 18 657 267.43 65.50%
Total Investments in Investment Funds 23 653 339.87 27 935 473.32 98.08%
Total Investments 23 653 339.87 27 935 473.32 98.08%61 006 444.80 98.40
Portfolio breakdownAs at December 31, 2016
By countries
Ireland 6.99%Luxembourg 93.01%
Total 100.00%
By type of investments
Investment Funds 100.00%
Total 100.00%
The accompanying notes form an integral part of these financial statements. 23
(LF) Fund of Funds - Global Emerging Market
Schedule of investmentsAs at December 31, 2016(Allfigures in Euros)
Cost Market % ofNetCurrency Units Name Price Price Assets
Transferable securities admitted to an official exchange listing
Investment Funds
EUR 6 000.0000 (LF) EQUITY - MENA FUND (ERB I€) 73 244.29 81 289.20 0.29%EUR 11 4325080 BARING ASEAN FRONTIER-I I 813 128.52 I 952 329.39 6.85%EUR 44 2128700 BGF INDIA FUND I 093 395.12 I 286 594.52 4.52%EUR 24 700.0040 FRANKLIN TEMP INV FRONTIER MKTS FND (I€) 470 028.73 600 951.10 2.11%EUR 47 2645710 HSBC GIF-MEXICO EQUITY (I€) 478 334.62 414 084.91 1.45%EUR 7 883.3050 JPM ASEAN EQUITY (EUR) (C-ACC) 900 000.00 944 341.11 3.32%EUR 28 5493050 PARVEST EQUITY RUSSIA (IE) 2 789 122.44 3 998 615.66 14.04%
7 617 253.72 9 278 205.89 32.58%
USD 88 3830500 FIDELITY- INDIA FOCUS FUND (Y$-ACC) 942 827.50 I 048 925.11 3.68%USD 166 930.3600 FIDELITY-CHINA FOCUS FUND (Y$-Acc) 2 170 277.01 2 495 799.71 8.76%USD 45 000.0000 FTIF-FRANKLIN MENA FUND (I15) 226 605.71 260 411.73 0.91%USD 22 000.0000 FTIF-TEMPLETON AFRICA FUND 194 661.60 162 166.78 0.57%USD 61 7060400 INVESCO GRTER CHINE EQTY - C 2 110 698.42 2 962 662.64 10.40%USD 43 1910570 JPM EM SMALL CAP (C$-Acc) 791 876.28 804 326.39 2.82%USD 30 3544860 JPMF - KOREA EQUITY FUND (C15) 2 265 337.62 2 583 054.16 9.07%USD 18 0972030 MORGAN STANLEY INVEST F-INDIAN EQUITY Z$ 648 210.54 675 061.21 2.37%USD 10 5327710 PARVEST EQUITY BRAZIL-I 906 213.43 967 544.08 3.40%USD 61 2824800 SCHRODER INTL GREATER CHINA (C$—Acc) I 918 617.97 2 860 602.91 10.04%USD 49 1166300 SCHRODER INTL KOREAN EQ.(C$-ACC) 2 017 242.73 I 847 062.07 6.48%USD 117 365.7500 SCHRODER ISF-TAIWANESE EQUITY(C$-Acc) I 843 517.34 I 989 650.64 6.99%
16 036 086.15 18 657 267.43 65.50%
Total Investments in Investment Funds 23 653 339.87 27 935 473.32 98.08%
Total Investments 23 653 339.87 27 935 473.32 98.08%
Portfolio breakdownAs at December 31, 2016
By countries
Ireland 6.99%Luxembourg 93 .01%
Total 100.00%
By type of investments
Investment Funds 100.00%
Total 100.00%
The accompanying notes form a.n integral part of these financial statements. 23

(LF) Fund of Funds - Balanced Blend Global
Schedule of investmentsAs at December 31, 2016(All figures in Euros)
Cost Market % of NetCurrency Units Name Price Price Assets
Transferable securities admitted to an official exchange listing
Investment Funds
EUR 22 828.50 BGF - EUROPEAN VALUE (D€) 1 436 295.83 1 578 362.49 1.62%EUR 3 000 000.00 BNY MELLON GL-EUROLAND BF (C€-Acc) 5 542 818.48 6 031 800.00 6.19%EUR 59 600.00 EUROBANK I (LF) GREEK GOVMNT BOND 1 169 864.56 1 242 421.60 1.28%EUR 49 500.00 FIDELITY FDS-EURO SM-Y ACC€ 897 362.81 1 027 620.00 1.06%EUR 122 301.76 INVESCO EURO CORPORATE BOND (C-Acc) 1 912 507.80 2 208 415.11 2.27%EUR 93 000.00 INVESCO PAN EUR STRUC EQTY - C 1 338 462.78 1 725 150.00 1.77%EUR 320 000.00 M&G European Corporate Bond (C€-Acc) 5 202 251.77 6 224 064.02 6.39%EUR 549 224.37 M&G GLOBAL CONVERTIBLE (C€-Acc) 7 891 913.42 9 946 837.76 10.21%EUR 36 300.00 PARVEST BD EURO GOVERNMENT 7 484 791.48 7 630 260.00 7.84%EUR 10 000.00 PIONEER FDS EUR STRATEGIC BOND (I-I€) 1 043 640.17 1 094 800.00 1.12%EUR 522 000.00 PIONEER FDS EURO BOND (I-Acc-€) 5 634 547.41 5 940 360.00 6.10%EUR 719 122.01 PIONEER FDS US PIONEER (I-Acc-€) 4 784 780.14 7 126 499.09 7.32%EUR 57 800.00 TEMPLETON ASIAN GROWTH FUND (I €) 1 516 541.12 1 737 468.00 1.78%
45 855 777.77 53 514 058.07 54.95%
USD 103 109.53 BGF - WORLD FIN. EQTY FUND (D$) 1 853 370.26 2 243 935.70 2.30%USD 137 000.00 FIDELITY FNDS-LATIN AM-Y AC$ 1 075 371.18 1 034 680.77 1.06%USD 395 000.00 FIDELITY FUNDS-AMERICA-Y ACC 4 603 144.67 7 209 752.40 7.40%USD 123 009.50 FRANKLIN U.S. OPPORTUNITIES FUND (I$) 2 917 305.46 3 517 224.43 3.61%USD 18 673.17 INVESCO JAPANESE EQUITY CORE(C$H) 3 210 272.87 3 976 263.86 4.08%USD 64 000.00 MORGAN STANLEY GLOBAL PROPERTY (Z$-Acc) 1 609 029.19 2 121 392.66 2.18%USD 32 000.00 MORGAN STANLEY US EQUITY GROWTH (Z$-Acc) 1 255 045.11 1 513 632.48 1.55%USD 392.35 NN L - GLOBAL RE (I$) 1 776 587.65 2 087 934.02 2.14%USD 20 000.40 PARVEST CONVERTIBLE BOND WORLD 2 657 317.70 2 923 500.27 3.00%USD 8 416.45 PARVEST EQUITY USA SMALL CAP(I$) 1 863 238.15 1 880 266.23 1.93%USD 153 404.54 PARVEST WRD COMMODITIES IC 8 131 225.59 8 602 354.90 8.83%USD 742 677.94 PIMCO COMMODITY REAL RET STR (I$) 4 153 985.01 4 636 012.55 4.76%USD 77 669.96 PIMCO GIS GBL INV GRD (I$-Acc) 1 265 914.37 1 307 148.31 1.34%
36 371 807.21 43 054 098.58 44.21%
Total Investments in Investment Funds 82 227 584.97 96 568 156.65 99.17%
Total Investments 82 227 584.97 96 568 156.65 99.17%33 570 973.17 96.80
%
Portfolio breakdownAs at December 31, 2016
By countries
Ireland 16.52%Luxembourg 66.73%United Kingdom 16.75%
Total 100.00%
By type of investments
Investment Funds 100.00%
Total 100.00%
The accompanying notes form an integral part of these financial statements. 24
(LF) Fund of Funds - Balanced Blend Global
Schedule of investmentsAs at December 31, 2016(Allfigures in Euros)
Currency Units Name
Transferable securities admitted to an official exchange listing
Investment Funds
EUR 22 828.50 BGF - EUROPEAN VALUE (D€)EUR 3 000 000.00 BNY MELLON GL-EUROLAND BF (C€-Acc)EUR 59 600.00 EUROBANK I (LF) GREEK GOVMNT BONDEUR 49 500.00 FIDELITY FDS-EURO SM-Y ACC€EUR 122 301.76 INVESCO EURO CORPORATE BOND (C-Acc)EUR 93 000.00 INVESCO PAN EUR STRUC EQTY - CEUR 320 000.00 M&G European Corporate Bond (C6-Acc)EUR 549 224.37 M&G GLOBAL CONVERTIBLE (C€-Acc)EUR 36 300.00 PARVEST BD EURO GOVERNMENTEUR 10 000.00 PIONEER FDS EUR STRATEGIC BOND (I-I€)EUR 522 000.00 PIONEER FDS EURO BOND (I-Acc-€)EUR 719 122.01 PIONEER FDS US PIONEER (I-Acc-€)EUR 57 800.00 TEMPLETON ASIAN GROWTH FUND (1 €)
USD 103 109.53 BGF - WORLD FIN. EQTY FUND (D$)USD 137 000.00 FIDELITY FNDS-LATIN AM-Y AC$USD 395 000.00 FIDELITY FUNDS-AMERICA-Y ACCUSD 123 009.50 FRANKLIN U.S. OPPORTUNITIES FUND (I$)USD 18 673.17 INVESCO JAPANESE EQUITY CORE(C$H)USD 64 000.00 MORGAN STANLEY GLOBAL PROPERTY (Z$-Acc)USD 32 000.00 MORGAN STANLEY US EQUITY GROWTH (Z$-Acc)USD 392.35 NN L - GLOBAL RE (I$)USD 20 000.40 PARVEST CONVERTIBLE BOND WORLDUSD 8 416.45 PARVEST EQUITY USA SMALL CAP(I$)USD 153 404.54 PARVEST WRD COMMODITIES ICUSD 742 677.94 PIMCO COMMODITY REAL RET STR (I$)USD 77 669.96 PIMCO GIS GBL INV GRD (I$—Acc)
Total Investments in Investment Funds
Total Investments
Portfolio breakdownAs at December 31, 2016
By countries
Cost Market % ofNetPrice Price Assets
1 436 295.83 1 578 362.49 1.62%5 542 818.48 6 031 800.00 6.19%1 169 864.56 1 242 421.60 1.28%
897 362.81 1 027 620.00 1.06%1912 507.80 2 208 415.11 2.27%1 338 462.78 1 725 150.00 1.77%5 202 251.77 6 224 064.02 6.39%7 891913.42 9 946 837.76 10.21%7 484 791.48 7 630 260.00 7.84%1 043 640.17 1 094 800.00 1.12%5 634 547.41 5 940 360.00 6.10%4 784 780.14 7 126 499.09 7.32%1 516 541.12 1737 468.00 1.78%
45 855 777.77 53 514 058.07 54.95%
1 853 370.26 2 243 935.70 2.30%1 075 371.18 1 034 680.77 1.06%4 603 144.67 7 209 752.40 7.40%2 917 305.46 3 517 224.43 3.61%3 210 272.87 3 976 263.86 4.08%1 609 029.19 2 121392.66 2.18%1 255 045.11 1 513 632.48 1.55%1 776 587.65 2 087 934.02 2.14%2 657 317.70 2 923 500.27 3.00%1 863 238.15 1 880 266.23 1.93%8 131 225.59 8 602 354.90 8.83%4 153 985.01 4 636 012.55 4.76%1 265 914.37 1 307 148.31 1.34%
36 371 807.21 43 054 098.58 44.21%
82 227 584.97 96 568 156.65 99.17%
82 227 584.97 96 568 156.65 99.17%
Ireland 16.52%Luxembourg 66.73%United Kingdom 16.75%
Total 100.00%
By type of investments
Investment Funds 100.00%
Total 100.00%
The accompanying notes form an integral part of these financial statements.
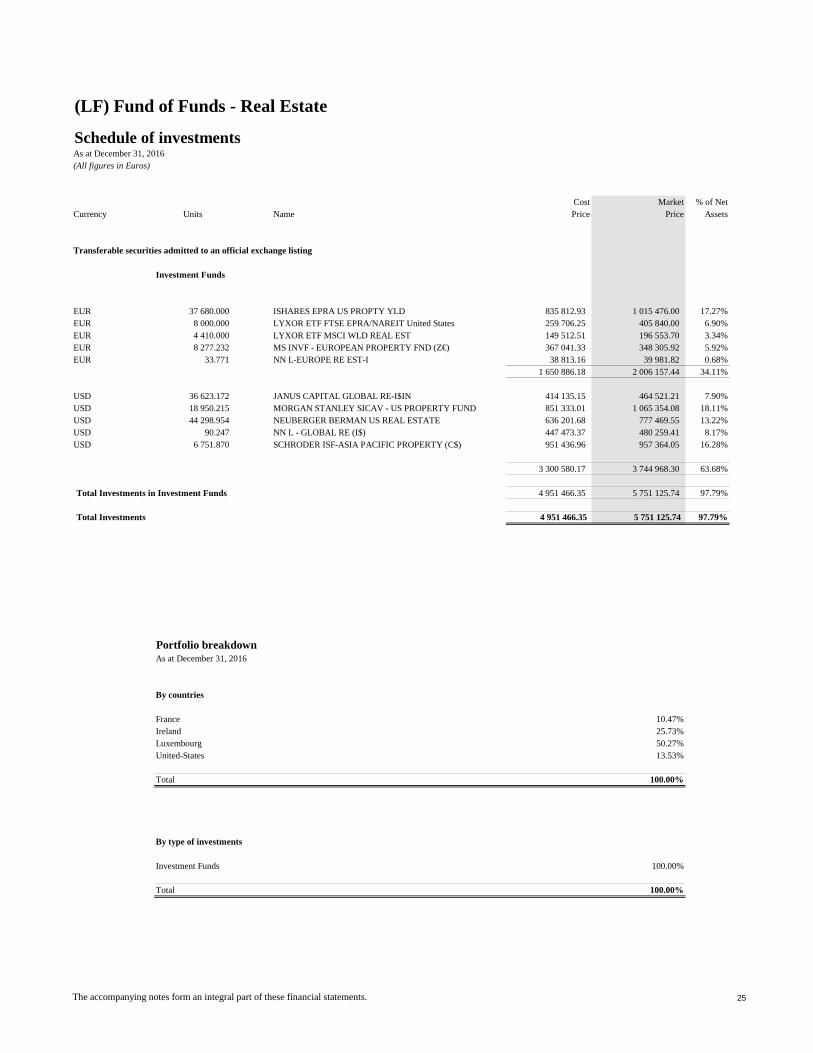
(LF) Fund of Funds - Real Estate
Schedule of investmentsAs at December 31, 2016(All figures in Euros)
Cost Market % of NetCurrency Units Name Price Price Assets
Transferable securities admitted to an official exchange listing
Investment Funds
EUR 37 680.000 ISHARES EPRA US PROPTY YLD 835 812.93 1 015 476.00 17.27%EUR 8 000.000 LYXOR ETF FTSE EPRA/NAREIT United States 259 706.25 405 840.00 6.90%EUR 4 410.000 LYXOR ETF MSCI WLD REAL EST 149 512.51 196 553.70 3.34%EUR 8 277.232 MS INVF - EUROPEAN PROPERTY FND (Z€) 367 041.33 348 305.92 5.92%EUR 33.771 NN L-EUROPE RE EST-I 38 813.16 39 981.82 0.68%
1 650 886.18 2 006 157.44 34.11%
USD 36 623.172 JANUS CAPITAL GLOBAL RE-I$IN 414 135.15 464 521.21 7.90%USD 18 950.215 MORGAN STANLEY SICAV - US PROPERTY FUND 851 333.01 1 065 354.08 18.11%USD 44 298.954 NEUBERGER BERMAN US REAL ESTATE 636 201.68 777 469.55 13.22%USD 90.247 NN L - GLOBAL RE (I$) 447 473.37 480 259.41 8.17%USD 6 751.870 SCHRODER ISF-ASIA PACIFIC PROPERTY (C$) 951 436.96 957 364.05 16.28%
3 300 580.17 3 744 968.30 63.68%
Total Investments in Investment Funds 4 951 466.35 5 751 125.74 97.79%
Total Investments 4 951 466.35 5 751 125.74 97.79%
33.00 4 749 980.92 96.24
Portfolio breakdownAs at December 31, 2016
By countries
France 10.47%Ireland 25.73%Luxembourg 50.27%United-States 13.53%
Total 100.00%
By type of investments
Investment Funds 100.00%
Total 100.00%
The accompanying notes form an integral part of these financial statements. 25
(LF) Fund of Funds — Real Estate
Schedule of investmentsAs at December 31, 2016(Allfigures in Euros)
Cost Market % of NetCurrency Units Name Price Price Assets
Transferable securities admitted to an official exchange listing
Investment Funds
EUR 37 680.000 ISHARES EPRA US PROPTY YLD 835 812.93 1 015 476.00 17.27%EUR 8 000.000 LYXOR ETF FTSE EPRA/NAREIT United States 259 706.25 405 840.00 6.90%EUR 4 410.000 LYXOR ETF MSCI WLD REAL EST 149 512.51 196 553.70 3.34%EUR 8 277.232 MS INVF — EUROPEAN PROPERTY FND (Z€) 367 041.33 348 305.92 5.92%EUR 33.771 NN L—EUROPE RE EST—I 38 813.16 39 981.82 0.68%
1 650 886.18 2 006 157.44 34.11%
USD 36 623.172 JANUS CAPITAL GLOBAL RE—I$IN 414 135.15 464 521.21 7.90%USD 18 950.215 MORGAN STANLEY SICAV — US PROPERTY FUND 851 333.01 1 065 354.08 18.11%USD 44 298.954 NEUBERGER BERMAN US REAL ESTATE 636 201.68 777 469.55 13.22%USD 90.247 NN L — GLOBAL RE (IS) 447 473.37 480 259.41 8.17%USD 6 751.870 SCHRODER ISF—ASIA PACIFIC PROPERTY (C$) 951 436.96 957 364.05 16.28%
3 300 580.17 3 744 968.30 63.68%
Total Investments in Investment Funds 4 951 466.35 5 751 125.74 97.79%
Total Investments 4 951 466.35 5 751 125.74 97.79%
Portfolio breakdownAs at December 31, 2016
By countries
France 10.47%Ireland 25.73%Luxembourg 50.27%United-States 13.53%
Total 100.00%
By type of investments
Investment Funds 100.00%
Total 100.00%
The accompanying notes form an integral part of these financial statements. 25
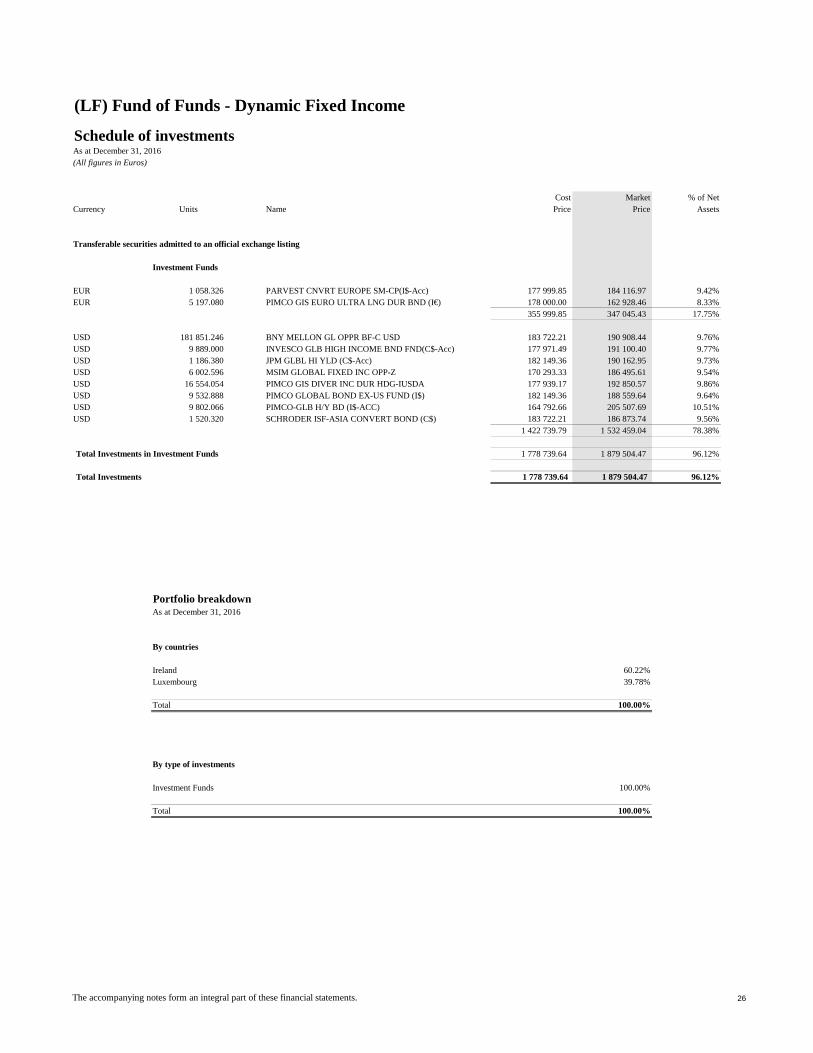
(LF) Fund of Funds - Dynamic Fixed Income
Schedule of investmentsAs at December 31, 2016(All figures in Euros)
Cost Market % of NetCurrency Units Name Price Price Assets
Transferable securities admitted to an official exchange listing
Investment Funds
EUR 1 058.326 PARVEST CNVRT EUROPE SM-CP(I$-Acc) 177 999.85 184 116.97 9.42%EUR 5 197.080 PIMCO GIS EURO ULTRA LNG DUR BND (I€) 178 000.00 162 928.46 8.33%
355 999.85 347 045.43 17.75%
USD 181 851.246 BNY MELLON GL OPPR BF-C USD 183 722.21 190 908.44 9.76%USD 9 889.000 INVESCO GLB HIGH INCOME BND FND(C$-Acc) 177 971.49 191 100.40 9.77%USD 1 186.380 JPM GLBL HI YLD (C$-Acc) 182 149.36 190 162.95 9.73%USD 6 002.596 MSIM GLOBAL FIXED INC OPP-Z 170 293.33 186 495.61 9.54%USD 16 554.054 PIMCO GIS DIVER INC DUR HDG-IUSDA 177 939.17 192 850.57 9.86%USD 9 532.888 PIMCO GLOBAL BOND EX-US FUND (I$) 182 149.36 188 559.64 9.64%USD 9 802.066 PIMCO-GLB H/Y BD (I$-ACC) 164 792.66 205 507.69 10.51%USD 1 520.320 SCHRODER ISF-ASIA CONVERT BOND (C$) 183 722.21 186 873.74 9.56%
1 422 739.79 1 532 459.04 78.38%
Total Investments in Investment Funds 1 778 739.64 1 879 504.47 96.12%
Total Investments 1 778 739.64 1 879 504.47 96.12%
1 246 609.59 1 244 715.46 95.89MORGAN STANLEY INVEST F-INDIAN EQUITY Z$
Portfolio breakdownAs at December 31, 2016
By countries
Ireland 60.22%Luxembourg 39.78%
Total 100.00%
By type of investments
Investment Funds 100.00%
Total 100.00%
The accompanying notes form an integral part of these financial statements. 26
(LF) Fund of Funds - Dynamic Fixed Income
Schedule of investmentsAs at December 31, 2016(Allfigures in Euros)
Cost Market % ofNetCurrency Units Name Price Price Assets
Transferable securities admitted to an oflicial exchange listing
Investment Funds
EUR 1 058.326 PARVEST CNVRT EUROPE SM—CP(I$—Acc) 177 999.85 184 116.97 9.42%EUR 5 197.080 PIMCO GIS EURO ULTRA LNG DUR BND (I€) 178 000.00 162 928.46 8.33%
355 999.85 347 045.43 17.75%
USD 181 851.246 BNY MELLON GL OPPR BF—C USD 183 722.21 190 908.44 9.76%USD 9 889.000 INVESCO GLB HIGH INCOME BND FND(C$—Acc) 177 971.49 191 100.40 9.77%USD 1 186.380 JPM GLBL HI YLD (C$—Acc) 182 149.36 190 162.95 9.73%USD 6 002.596 MSIM GLOBAL FIXED INC OPP—Z 170 293.33 186 495.61 9.54%USD 16 554.054 PIMCO GIS DIVER INC DUR HDG—IUSDA 177 939.17 192 850.57 9.86%USD 9 532.888 PIMCO GLOBAL BOND EX—US FUND (I$) 182 149.36 188 559.64 9.64%USD 9 802.066 PIMCO—GLB H/Y BD (I$—ACC) 164 792.66 205 507.69 10.51%USD 1 520.320 SCHRODER ISF—ASIA CONVERT BOND (C$) 183 722.21 186 873.74 9.56%
1 422 739.79 1 532 459.04 78.38%
Total Investments in Investment Funds 1 778 739.64 1 879 504.47 96.12%
Total Investments 1 778 739.64 1 879 504.47 96.12%
Portfolio breakdownAs at December 31, 2016
By countries
Ireland 60.22%Luxembourg 39.78%
Total 100.00%
By type of investments
Investment Funds 100.00%
Total 100.00%
The accompanying notes form an integral part of these financial statements.
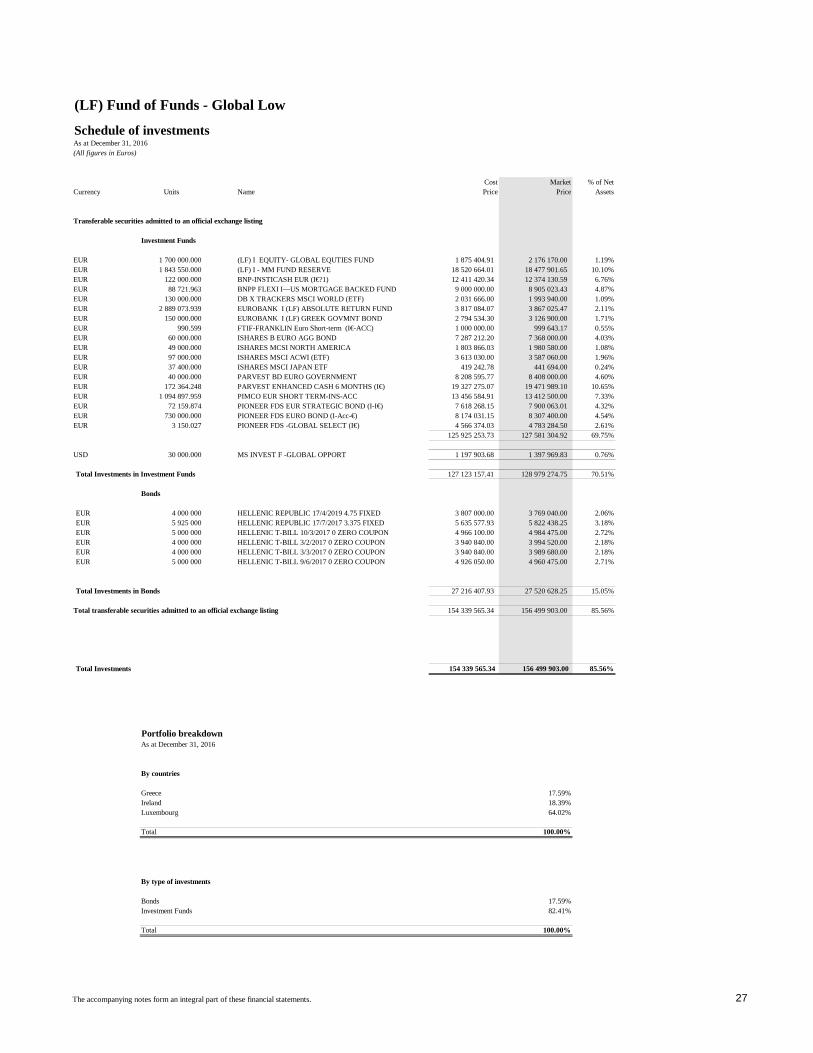
(LF) Fund of Funds - Global Low
Schedule of investmentsAs at December 31, 2016(All figures in Euros)
Cost Market % of NetCurrency Units Name Price Price Assets
Transferable securities admitted to an official exchange listing
Investment Funds
EUR 1 700 000.000 (LF) I EQUITY- GLOBAL EQUTIES FUND 1 875 404.91 2 176 170.00 1.19%EUR 1 843 550.000 (LF) I - MM FUND RESERVE 18 520 664.01 18 477 901.65 10.10%EUR 122 000.000 BNP-INSTICASH EUR (I€?1) 12 411 420.34 12 374 130.59 6.76%EUR 88 721.963 BNPP FLEXI I—US MORTGAGE BACKED FUND 9 000 000.00 8 905 023.43 4.87%EUR 130 000.000 DB X TRACKERS MSCI WORLD (ETF) 2 031 666.00 1 993 940.00 1.09%EUR 2 889 073.939 EUROBANK I (LF) ABSOLUTE RETURN FUND 3 817 084.07 3 867 025.47 2.11%EUR 150 000.000 EUROBANK I (LF) GREEK GOVMNT BOND 2 794 534.30 3 126 900.00 1.71%EUR 990.599 FTIF-FRANKLIN Euro Short-term (I€-ACC) 1 000 000.00 999 643.17 0.55%EUR 60 000.000 ISHARES B EURO AGG BOND 7 287 212.20 7 368 000.00 4.03%EUR 49 000.000 ISHARES MCSI NORTH AMERICA 1 803 866.03 1 980 580.00 1.08%EUR 97 000.000 ISHARES MSCI ACWI (ETF) 3 613 030.00 3 587 060.00 1.96%EUR 37 400.000 ISHARES MSCI JAPAN ETF 419 242.78 441 694.00 0.24%EUR 40 000.000 PARVEST BD EURO GOVERNMENT 8 208 595.77 8 408 000.00 4.60%EUR 172 364.248 PARVEST ENHANCED CASH 6 MONTHS (I€) 19 327 275.07 19 471 989.10 10.65%EUR 1 094 897.959 PIMCO EUR SHORT TERM-INS-ACC 13 456 584.91 13 412 500.00 7.33%EUR 72 159.874 PIONEER FDS EUR STRATEGIC BOND (I-I€) 7 618 268.15 7 900 063.01 4.32%EUR 730 000.000 PIONEER FDS EURO BOND (I-Acc-€) 8 174 031.15 8 307 400.00 4.54%EUR 3 150.027 PIONEER FDS -GLOBAL SELECT (I€) 4 566 374.03 4 783 284.50 2.61%
125 925 253.73 127 581 304.92 69.75%
USD 30 000.000 MS INVEST F -GLOBAL OPPORT 1 197 903.68 1 397 969.83 0.76%
Total Investments in Investment Funds 127 123 157.41 128 979 274.75 70.51%
Bonds
EUR 4 000 000 HELLENIC REPUBLIC 17/4/2019 4.75 FIXED 3 807 000.00 3 769 040.00 2.06%EUR 5 925 000 HELLENIC REPUBLIC 17/7/2017 3.375 FIXED 5 635 577.93 5 822 438.25 3.18%EUR 5 000 000 HELLENIC T-BILL 10/3/2017 0 ZERO COUPON 4 966 100.00 4 984 475.00 2.72%EUR 4 000 000 HELLENIC T-BILL 3/2/2017 0 ZERO COUPON 3 940 840.00 3 994 520.00 2.18%EUR 4 000 000 HELLENIC T-BILL 3/3/2017 0 ZERO COUPON 3 940 840.00 3 989 680.00 2.18%EUR 5 000 000 HELLENIC T-BILL 9/6/2017 0 ZERO COUPON 4 926 050.00 4 960 475.00 2.71%
Total Investments in Bonds 27 216 407.93 27 520 628.25 15.05%
Total transferable securities admitted to an official exchange listing 154 339 565.34 156 499 903.00 85.56%
Total Investments 154 339 565.34 156 499 903.00 85.56%
190 611 655.77
Portfolio breakdownAs at December 31, 2016
By countries
Greece 17.59%Ireland 18.39%Luxembourg 64.02%
Total 100.00%
By type of investments
Bonds 17.59%Investment Funds 82.41%
Total 100.00%
The accompanying notes form an integral part of these financial statements. 27
(LF) Fund of Funds - Global Low
Schedule of investmentsAs at December 31, 2016(A/Ifigures in Euros)
Cost Market % ofNetCurrency Units Name Price Price Assets
Transferable securities admitted to an olficial exchange listing
Investment Funds
EUR 1 700 000.000 (LF) I EQUITY- GLOBAL EQUTIES FUND 1 875 404.91 2 176 170.00 1.19%EUR 1 843 550.000 (LF) I - MM FUND RESERVE 18 520 664.01 18 477 901.65 10.10%EUR 122 000.000 BNP-INSTICASH EUR (I€‘.71) 12 411 420.34 12 374 130.59 6.76%EUR 88 721.963 BNPP FLEXI I—US MORTGAGE BACKED FUND 9 000 000.00 8 905 023.43 4.87%EUR 130 000.000 DB X TRACKERS MSCI WORLD (ETF) 2 031 666.00 1 993 940.00 1.09%EUR 2 889 073.939 EUROBANK I (LF) ABSOLUTE RETURN FUND 3 817 084.07 3 867 025.47 2.11%EUR 150 000.000 EUROBANK I (LF) GREEK GOVMNT BOND 2 794 534.30 3 126 900.00 1.71%EUR 990.599 FTIF-FRANKLIN Euro Short-term (I€-ACC) 1 000 000.00 999 643.17 0.55%EUR 60 000.000 ISHARES B EURO AGG BOND 7 287 212.20 7 368 000.00 4.03%EUR 49 000.000 ISHARES MCSI NORTH AMERICA 1 803 866.03 1 980 580.00 1.08%EUR 97 000.000 ISHARES MSCI ACWI (ETF) 3 613 030.00 3 587 060.00 1.96%EUR 37 400.000 ISHARES MSCI JAPAN ETF 419 242.78 441 694.00 0.24%EUR 40 000.000 PARVEST BD EURO GOVERNMENT 8 208 595.77 8 408 000.00 4.60%EUR 172 364.248 PARVEST ENHANCED CASH 6 MONTHS (I€) 19 327 275.07 19 471 989.10 10.65%EUR 1 094 897.959 PIMCO EUR SHORT TERM-INS-ACC 13 456 584.91 13 412 500.00 7.33%EUR 72 159.874 PIONEER FDS EUR STRATEGIC BOND (I-I€) 7 618 268.15 7 900 063.01 4.32%EUR 730 000.000 PIONEER FDS EURO BOND (I-Ace-€) 8 174 031.15 8 307 400.00 4.54%EUR 3 150.027 PIONEER FDS -GLOBAL SELECT (I€) 4 566 374.03 4 783 284.50 2.61%
125 925 253.73 127 581 304.92 69.75%
USD 30 000.000 MS INVEST F -GLOBAL OPPORT 1 197 903.68 1 397 969.83 0.76%
Total Investments in Investment Funds 127 123 157.41 128 979 274.75 70.51%
Bonds
EUR 4 000 000 HELLENIC REPUBLIC 17/4/2019 4.75 FIXED 3 807 000.00 3 769 040.00 2.06%EUR 5 925 000 HELLENIC REPUBLIC 17/7/2017 3.375 FIXED 5 635 577.93 5 822 438.25 3.18%EUR 5 000 000 HELLENIC T-BILL 10/3/2017 0 ZERO COUPON 4 966 100.00 4 984 475.00 2.72%EUR 4 000 000 HELLENIC T-BILL 3/2/2017 0 ZERO COUPON 3 940 840.00 3 994 520.00 2.18%EUR 4 000 000 HELLENIC T-BILL 3/3/2017 0 ZERO COUPON 3 940 840.00 3 989 680.00 2.18%EUR 5 000 000 HELLENIC T-BILL 9/6/2017 0 ZERO COUPON 4 926 050.00 4 960 475.00 2.71%
Total Investments in Bonds 27 216 407.93 27 520 628.25 15.05%
Total transferable securities admitted to an oflieial exchange listing 154 339 565.34 156 499 903.00 85.56%
Total Investments 154 339 565.34 156 499 903.00 85.56%
Portfolio breakdownAs at December 31, 2016
By countries
Greece 1 7.59%Ireland 1 8.39%Luxembourg 64.02%
Total 100.00%
By type of investments
Bonds 1 7.59%Investment Funds 82.41%
Total 100.00%
The ompanying notes form an integral part of these " ' ' statements. 27

(LF) Fund of Funds - Global Medium
Schedule of investmentsAs at December 31, 2016(All figures in Euros)
Cost Market % of NetCurrency Units Name Price Price Assets
Transferable securities admitted to an official exchange listing
Investment Funds
EUR 912 537.394 (LF) I EQUITY- GLOBAL EQUTIES FUND 1 034 614.93 1 168 139.12 3.09%EUR 72 942.490 (LF) I - MM FUND RESERVE 732 902.42 731 102.58 1.94%EUR 17 957.228 BNP-INSTICASH EUR (I€?1) 1 827 207.95 1 821 353.12 4.82%EUR 1 165 000.030 EUROBANK I (LF) ABSOLUTE RETURN FUND 1 526 815.48 1 559 352.54 4.13%EUR 150 000.000 EUROBANK I (LF) GLOBAL BOND 1 780 487.80 1 913 160.00 5.06%EUR 41 750.000 ISHARES B EURO AGG BOND 5 039 728.16 5 126 900.00 13.57%EUR 24 000.000 ISHARES MCSI NORTH AMERICA 800 765.82 970 080.00 2.57%EUR 95 400.000 ISHARES MSCI ACWI (ETF) 3 082 827.30 3 527 892.00 9.34%EUR 13 000.000 ISHARES MSCI JAPAN ETF 145 722.20 153 530.00 0.41%EUR 18 000.000 PARVEST BD EURO GOVERNMENT 3 627 186.12 3 783 600.00 10.01%EUR 19 711.493 PARVEST ENHANCED CASH 6 MONTHS (I€) 2 209 999.79 2 226 807.36 5.89%EUR 81 168.831 PIMCO EUR SHORT TERM-INS-ACC 1 000 000.00 994 318.18 2.63%EUR 17 750.000 PIONEER FDS EUR STRATEGIC BOND (I-I€) 1 863 075.33 1 943 270.00 5.14%EUR 390 000.000 PIONEER FDS EURO BOND (I-Acc-€) 4 355 700.73 4 438 200.00 11.75%EUR 2 309.171 PIONEER FDS -GLOBAL SELECT (I€) 3 409 337.08 3 506 453.07 9.28%
32 436 371.11 33 864 157.97 86.54%
USD 24 250.000 MS INVEST F -GLOBAL OPPORT 1 026 583.34 1 130 025.61 2.99%USD 5 603.931 PARVEST EQUITY USA SMALL CAP(I$) 1 221 574.81 1 251 939.77 3.31%
2 248 158.15 2 381 965.38 6.30%
Total Investments in Investment Funds 34 684 529.26 36 246 123.35 92.85%
Total Investments 34 684 529.26 36 246 123.35 92.85%
1 246 609.59 1 244 715.46 95.89
Portfolio breakdownAs at December 31, 2016
By countries
Luxembourg 69.29%Ireland 30.71%
Total 100.00%
By type of investments
Investment Funds 100.00%
Total 100.00%
The accompanying notes form an integral part of these financial statements. 28
(LF) Fund of Funds - Global Medium
Schedule of investmentsAs at December 31, 2016(Allfigures in Euros)
Cost Market % ofNetCurrency Units Name Price Price Assets
Transferable securities admitted to an ofticial exchange listing
Investment Funds
EUR 912 537.394 (LF) I EQUITY— GLOBAL EQUTIES FUND 1 034 614.93 1 168 139.12 3.09%EUR 72 942.490 (LF) I — MM FUND RESERVE 732 902.42 731 102.58 1.94%EUR 17 957.228 BNP—INSTICASH EUR (I€?1) 1 827 207.95 1 821 353.12 4.82%EUR 1 165 000.030 EUROBANK I (LF) ABSOLUTE RETURN FUND 1 526 815.48 1 559 352.54 4.13%EUR 150 000.000 EUROBANKI (LF) GLOBAL BOND 1 780 487.80 1 913 160.00 5.06%EUR 41 750.000 ISHARES B EURO AGG BOND 5 039 728.16 5 126 900.00 13.57%EUR 24 000.000 ISHARES MCSI NORTH AMERICA 800 765.82 970 080.00 2.57%EUR 95 400.000 ISHARES MSCI ACWI (ETF) 3 082 827.30 3 527 892.00 9.34%EUR 13 000.000 ISHARES MSCI JAPAN ETF 145 722.20 153 530.00 0.41%EUR 18 000.000 PARVEST BD EURO GOVERNMENT 3 627 186.12 3 783 600.00 10.01%EUR 19 711.493 PARVEST ENHANCED CASH 6 MONTHS (I€) 2 209 999.79 2 226 807.36 5.89%EUR 81 168.831 PIMCO EUR SHORT TERM—INS—ACC 1 000 000.00 994 318.18 2.63%EUR 17 750.000 PIONEER FDS EUR STRATEGIC BOND (I—I€) 1 863 075.33 1 943 270.00 5.14%EUR 390 000.000 PIONEER FDS EURO BOND (I—Acc—€) 4 355 700.73 4 438 200.00 11.75%EUR 2 309.171 PIONEER FDS —GLOBAL SELECT (I€) 3 409 337.08 3 506 453.07 9.28%
32 436 371.11 33 864157.97 86.54%
USD 24 250.000 MS INVEST F —GLOBAL OPPORT 1 026 583.34 1 130 025.61 2.99%USD 5 603.931 PARVEST EQUITY USA SMALL CAP(I$) 1 221 574.81 1 251 939.77 3.31%
2 248 158.15 2 381965.38 6.30%
Total Investments in Investment Funds 34 684 529.26 36 246 123.35 92.85%
Total Investments 34 684 529.26 36 246 123.35 92.85%
Portfolio breakdownAs at December 31, 2016
By countries
Luxembourg 69.29%Irela.nd 30.71%
Total 100.00%
By type of investments
Investment Funds 100.00%
Total 100.00%
The accompanying notes form an integral part of these financial statements. 28

(LF) Fund of Funds - Global High
Schedule of investmentsAs at December 31, 2016(All figures in Euros)
Cost Market % of NetCurrency Units Name Price Price Assets
Transferable securities admitted to an official exchange listing
Investment Funds
EUR 3 400.000 (LF) EQUITY - MENA FUND (ERB I €) 45 734.60 46 063.88 0.54%EUR 200 000.000 (LF) I EQUITY- GLOBAL EQUTIES FUND 211 259.20 256 020.00 3.01%EUR 455 869.617 (LF)I EQUITY- EMERGING EUROPE FUND 378 839.65 401 621.13 4.72%EUR 0.000 BNP-INSTICASH EUR (I€?1) 0.04 0.04 0.00%EUR 200 000.000 EUROBANK I (LF) ABSOLUTE RETURN FUND 262 721.43 267 700.00 3.15%EUR 8 000.000 ISHARES B EURO AGG BOND 977 920.08 982 400.00 11.55%EUR 2 500.000 ISHARES DJ EURO STOXX 50 82 175.00 82 700.00 0.97%EUR 30 000.000 ISHARES MCSI NORTH AMERICA 983 831.96 1 212 600.00 14.26%EUR 34 500.000 ISHARES MSCI ACWI (ETF) 1 128 819.31 1 275 810.00 15.00%EUR 12 000.000 ISHARES MSCI JAPAN ETF 134 511.60 141 720.00 1.67%EUR 4 000.060 PIONEER FDS EUR STRATEGIC BOND (I-I€) 415 128.97 437 926.57 5.15%EUR 63 597.029 PIONEER FDS EURO BOND (I-Acc-€) 707 504.05 723 734.19 8.51%EUR 864.948 PIONEER FDS -GLOBAL SELECT (I€) 1 248 521.07 1 313 414.89 15.44%
6 576 966.96 7 141 710.70 83.96%
USD 8 371.387 MS INVEST F -GLOBAL OPPORT 351 957.82 390 098.22 4.59%USD 1 855.676 PARVEST EQUITY USA SMALL CAP(I$) 405 742.57 414 565.17 4.87%
757 700.39 804 663.39 9.46%
Total Investments in Investment Funds 7 334 667.35 7 946 374.09 93.42%
Total Investments 7 334 667.35 7 946 374.09 93.42%
1 246 609.59 1 244 715.46 95.89
Portfolio breakdownAs at December 31, 2016
By countries
Luxembourg 53.50%Germany 1.04%Ireland 45.46%
Total 100.00%
By type of investments
Investment Funds 100.00%
Total 100.00%
The accompanying notes form an integral part of these financial statements. 29
(LF) Fund of Funds - Global High
Schedule of investmentsAs at December 31, 2016(Allfigures in Euros)
Cost Market % ofNetCurrency Units Name Price Price Assets
Transferable securities admitted to an ofticial exchange listing
Investment Funds
EUR 3 400.000 (LF) EQUITY — MENA FUND (ERB I€) 45 734.60 46 063.88 0.54%EUR 200 000.000 (LF) I EQUITY— GLOBAL EQUTIES FUND 211 259.20 256 020.00 3.01%EUR 455 869.617 (LF)I EQUITY— EMERGING EUROPE FUND 378 839.65 401 621.13 4.72%EUR 0.000 BNP—INSTICASH EUR (I€?1) 0.04 0.04 0.00%EUR 200 000.000 EUROBANK I (LF) ABSOLUTE RETURN FUND 262 721.43 267 700.00 3.15%EUR 8 000.000 ISHARES B EURO AGG BOND 977 920.08 982 400.00 11.55%EUR 2 500.000 ISHARES DJ EURO STOXX 50 82 175.00 82 700.00 0.97%EUR 30 000.000 ISHARES MCSI NORTH AMERICA 983 831.96 1 212 600.00 14.26%EUR 34 500.000 ISHARES MSCI ACWI (ETF) 1 128 819.31 1 275 810.00 15.00%EUR 12 000.000 ISHARES MSCI JAPAN ETF 134 511.60 141 720.00 1.67%EUR 4 000.060 PIONEER FDS EUR STRATEGIC BOND (I—I€) 415 128.97 437 926.57 5.15%EUR 63 597.029 PIONEER FDS EURO BOND (I—Acc—€) 707 504.05 723 734.19 8.51%EUR 864.948 PIONEER FDS —GLOBAL SELECT (I€) 1 248 521.07 1 313 414.89 15.44%
6 576 966.96 7 141 710.70 83.96%
USD 8 371.387 MS INVEST F —GLOBAL OPPORT 351 957.82 390 098.22 4.59%USD 1 855.676 PARVEST EQUITY USA SMALL CAP(I$) 405 742.57 414 565.17 4.87%
757 700.39 804 663.39 9.46%
Total Investments in Investment Funds 7 334 667.35 7 946 374.09 93.42%
Total Investments 7 334 667.35 7 946 374.09 93.42%
Portfolio breakdownAs at December 31, 2016
By countries
Luxembourg 53.50%Germany 1.04%Ire1a.nd 45.46%
Total 100.00%
By type of investments
Investment Funds 100.00%
Total 100.00%
The accompanying notes form an integral part of these financial statements. 29
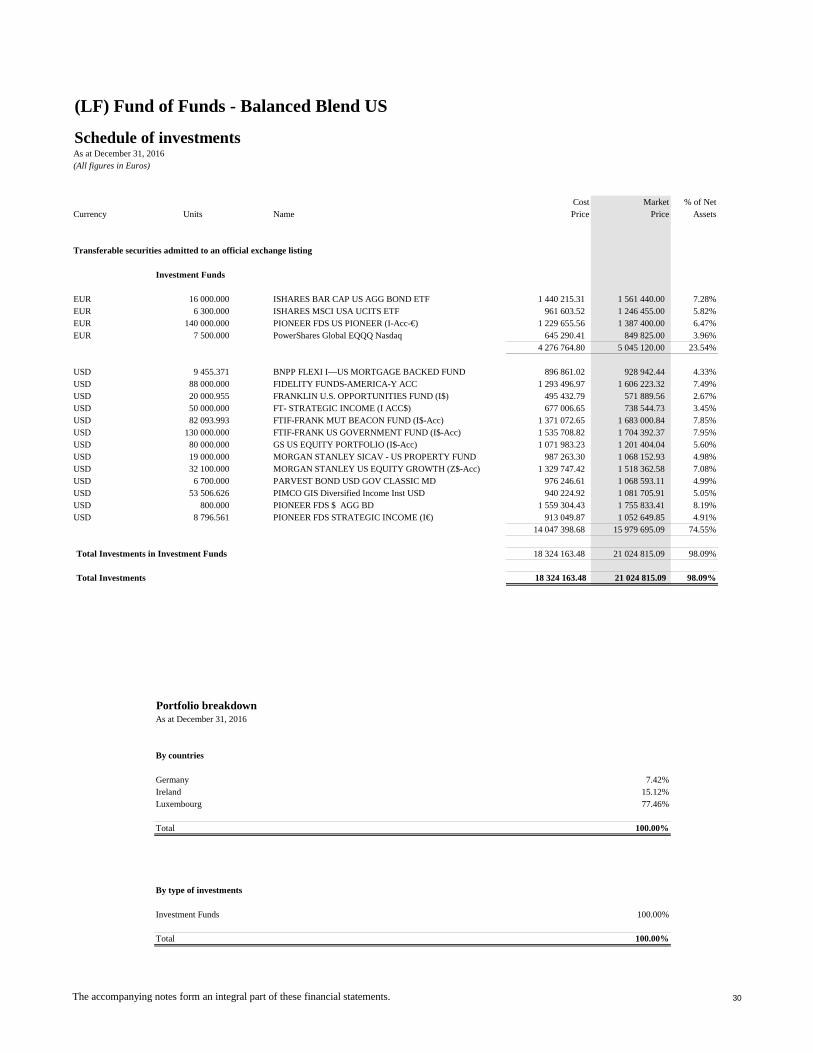
(LF) Fund of Funds - Balanced Blend US
Schedule of investmentsAs at December 31, 2016(All figures in Euros)
Cost Market % of NetCurrency Units Name Price Price Assets
Transferable securities admitted to an official exchange listing
Investment Funds
EUR 16 000.000 ISHARES BAR CAP US AGG BOND ETF 1 440 215.31 1 561 440.00 7.28%EUR 6 300.000 ISHARES MSCI USA UCITS ETF 961 603.52 1 246 455.00 5.82%EUR 140 000.000 PIONEER FDS US PIONEER (I-Acc-€) 1 229 655.56 1 387 400.00 6.47%EUR 7 500.000 PowerShares Global EQQQ Nasdaq 645 290.41 849 825.00 3.96%
4 276 764.80 5 045 120.00 23.54%
USD 9 455.371 BNPP FLEXI I—US MORTGAGE BACKED FUND 896 861.02 928 942.44 4.33%USD 88 000.000 FIDELITY FUNDS-AMERICA-Y ACC 1 293 496.97 1 606 223.32 7.49%USD 20 000.955 FRANKLIN U.S. OPPORTUNITIES FUND (I$) 495 432.79 571 889.56 2.67%USD 50 000.000 FT- STRATEGIC INCOME (I ACC$) 677 006.65 738 544.73 3.45%USD 82 093.993 FTIF-FRANK MUT BEACON FUND (I$-Acc) 1 371 072.65 1 683 000.84 7.85%USD 130 000.000 FTIF-FRANK US GOVERNMENT FUND (I$-Acc) 1 535 708.82 1 704 392.37 7.95%USD 80 000.000 GS US EQUITY PORTFOLIO (I$-Acc) 1 071 983.23 1 201 404.04 5.60%USD 19 000.000 MORGAN STANLEY SICAV - US PROPERTY FUND 987 263.30 1 068 152.93 4.98%USD 32 100.000 MORGAN STANLEY US EQUITY GROWTH (Z$-Acc) 1 329 747.42 1 518 362.58 7.08%USD 6 700.000 PARVEST BOND USD GOV CLASSIC MD 976 246.61 1 068 593.11 4.99%USD 53 506.626 PIMCO GIS Diversified Income Inst USD 940 224.92 1 081 705.91 5.05%USD 800.000 PIONEER FDS $ AGG BD 1 559 304.43 1 755 833.41 8.19%USD 8 796.561 PIONEER FDS STRATEGIC INCOME (I€) 913 049.87 1 052 649.85 4.91%
14 047 398.68 15 979 695.09 74.55%
Total Investments in Investment Funds 18 324 163.48 21 024 815.09 98.09%
Total Investments 18 324 163.48 21 024 815.09 98.09%
1 246 609.59 1 244 715.46 95.89%
Portfolio breakdownAs at December 31, 2016
By countries
Germany 7.42%Ireland 15.12%Luxembourg 77.46%
Total 100.00%
By type of investments
Investment Funds 100.00%
Total 100.00%
The accompanying notes form an integral part of these financial statements. 30
(LF) Fund of Funds — Balanced Blend US
Schedule of investmentsAs at December 31, 2016(Allfigures in Euros)
Currency Units Name
Transferable securities admitted to an official exchange listing
Investment Funds
EUR 16 000.000 ISHARES BAR CAP US AGG BOND ETFEUR 6 300.000 ISHARES MSCI USA UCITS ETFEUR 140 000.000 PIONEER FDS US PIONEER (I—Acc—€)EUR 7 500.000 PowerShares Global EQQQ Nasdaq
USD 9 455.371 BNPP FLEXI I—US MORTGAGE BACKED FUNDUSD 88 000.000 FIDELITY FUNDS—AMERICA—Y ACCUSD 20 000.955 FRANKLIN U.S. OPPORTUNITIES FUND (I$)USD 50 000.000 FT— STRATEGIC INCOME (I ACC$)USD 82 093.993 FTIF—FRANK MUT BEACON FUND (I$—Acc)USD 130 000.000 FTIF—FRANK US GOVERNMENT FUND (I$—Acc)USD 80 000.000 GS US EQUITY PORTFOLIO (I$—Acc)USD 19 000.000 MORGAN STANLEY SICAV — US PROPERTY FUNDUSD 32 100.000 MORGAN STANLEY US EQUITY GROWTH (Z$—Acc)USD 6 700.000 PARVEST BOND USD GOV CLASSIC MDUSD 53 506.626 PIMCO GIS Diversifi edIncome Inst USDUSD 800.000 PIONEER FDS $ AGG BDUSD 8 796.561 PIONEER FDS STRATEGIC INCOME (I€)
Total Investments in Investment Funds
Total Investments
Portfolio breakdownAs at December 31, 2016
By countries
Cost Market % of NetPrice Price Assets
1440 215.31 1 561 440.00 7.28%961 603.52 1 246 455.00 5.82%
1 229 655.56 1 387 400.00 6.47%645 290.41 849 825.00 3.96%
4 276 764.80 5 045 120.00 23.54%
896 861.02 928 942.44 4.33%1 293 496.97 1 606 223.32 7.49%
495 432.79 571 889.56 2.67%677 006.65 738 544.73 3.45%
1 371 072.65 1 683 000.84 7.85%1 535 708.82 1 704 392.37 7.95%1 071 983.23 1 201 404.04 5.60%
987 263.30 1 068 152.93 4.98%1 329 747.42 1 518 362.58 7.08%
976 246.61 1 068 593.11 4.99%940 224.92 1 081 705.91 5.05%
1 559 304.43 1 755 833.41 8.19%913 049.87 1 052 649.85 4.91%
14 047 398.68 15 979 695.09 74.55%
18 324 163.48 21 024 815.09 98.09%
18 324 163.48 21 024 815.09 98.09%
Germany 7.42%Ireland 15.12%Luxembourg 77.46%
Total 100.00%
By type of investments
Investment Funds 100.00%
Total 100.00%
The accompanying notes form an integral part of these financial statements. 30

(LF) Fund of Funds - Tactical Allocation
Schedule of investmentsAs at December 31, 2016(All figures in Euros)
Cost Market % of NetCurrency Units Name Price Price Assets
Transferable securities admitted to an official exchange listing
Investment Funds
EUR 40 417.332 (LF) I - MM FUND RESERVE 405 487.07 405 102.92 9.16%EUR 258 560.447 (LF) I EQUITY FLEXI STYLE FUND 222 000.00 225 206.15 5.09%EUR 12 165.450 BGF- EMERGING MARKETS BOND (ED2€) 200 000.00 207 785.89 4.70%EUR 79 999.996 EUROBANK NTT MONEY MARKET FUND 244 291.41 245 999.99 5.57%EUR 13 953.488 FTIF TEMPLETON EASTERN EUROPE(I€) 222 000.00 223 255.81 5.05%EUR 10 442.145 FTIF TEMPLETON GLOBAL FUND (I€) 222 000.00 219 180.62 4.96%EUR 128.000 FTIF-FRANKLIN Euro Short-term (I€-ACC) 129 359.99 129 168.64 2.92%EUR 30 000.005 INTERAMERICAN MONEY MARKET DOM FUND 295 605.01 297 114.05 6.72%EUR 18 223.906 JPM GLB NAT RESOURCES ( C-ACC) 216 500.00 220 691.50 4.99%EUR 1 910.868 PIONEER FDS EUR STRATEGIC BOND (I-I€) 207 700.00 209 201.83 4.73%EUR 110.431 PIONEER FDS EURO HIGH YLD-I€ 209 500.00 212 035.25 4.80%EUR 105.613 PIONEER GLB HIGH YIELD (I€) 200 000.00 208 963.77 4.73%EUR 1 470.510 SCHRODER INTL FRONTIER MKT EQTY (C€) 200 000.00 210 469.10 4.76%EUR 2 661.280 SCHRODER ISF-EURO DIV MAX ( C€) 310 500.00 311 564.83 7.05%EUR 3 307.978 TEMPLETON ASIAN GROWTH FUND (I €) 85 898.33 99 437.82 2.25%
3 370 841.81 3 425 178.17 77.49%
USD 117.000 PIONEER USD SHORT TERM (I$-Acc) 208 760.10 209 265.84 4.73%USD 1 603.810 SCHRODER GLB CONVERT BOND (C$) 222 137.11 220 319.31 4.98%USD 14 492.999 SCHRODER INTL JAPANESE OPP ( C-$H) 212 708.90 223 111.89 5.05%
643 606.11 652 697.04 14.77%
Total Investments in Investment Funds 4 014 447.92 4 077 875.21 92.25%
Total Investments 4 014 447.92 4 077 875.21 92.25%
1 246 609.59 1 244 715.46 95.89%
Portfolio breakdownAs at December 31, 2016
By countries
Greece 13.32%Luxembourg 86.68%
Total 100.00%
By type of investments
Investment Funds 100.00%
Total 100.00%
The accompanying notes form an integral part of these financial statements. 31
(LF) Fund of Funds — Tactical Allocation
Schedule of investmentsAs at December 31, 2016(Allfigures in Euros)
Cost Market % of NetCurrency Units Name Price Price Assets
Transferable securities admitted to an official exchange listing
Investment Funds
EUR 40 417.332 (LF) I — MM FUND RESERVE 405 487.07 405 102.92 9.16%EUR 258 560.447 (LF) I EQUITY FLEXI STYLE FUND 222 000.00 225 206.15 5.09%EUR 12 165.450 BGF— EMERGING MARKETS BOND (ED2€) 200 000.00 207 785.89 4.70%EUR 79 999.996 EUROBANK NTT MONEY MARKET FUND 244 291.41 245 999.99 5.57%EUR 13 953.488 FTIF TEMPLETON EASTERN EUROPE(I€) 222 000.00 223 255.81 5.05%EUR 10 442.145 FTIF TEMPLETON GLOBAL FUND (I€) 222 000.00 219 180.62 4.96%EUR 128.000 FTIF—FRANKLIN Euro Short—term (I€—ACC) 129 359.99 129 168.64 2.92%EUR 30 000.005 INTERAMERICAN MONEY MARKET DOM FUND 295 605.01 297 114.05 6.72%EUR 18 223.906 JPM GLB NAT RESOURCES ( C—ACC) 216 500.00 220 691.50 4.99%EUR 1 910.868 PIONEER FDS EUR STRATEGIC BOND (I—I€) 207 700.00 209 201.83 4.73%EUR 110.431 PIONEER FDS EURO HIGH YLD—I€ 209 500.00 212 035.25 4.80%EUR 105.613 PIONEER GLB HIGH YIELD (I€) 200 000.00 208 963.77 4.73%EUR 1 470.510 SCHRODER INTL FRONTIER MKT EQTY (C€) 200 000.00 210 469.10 4.76%EUR 2 661.280 SCHRODER ISF—EURO DIV MAX ( C€) 310 500.00 311 564.83 7.05%EUR 3 307.978 TEMPLETON ASIAN GROWTH FUND (1 €) 85 898.33 99 437.82 2.25%
3 370 841.81 3 425 178.17 77.49%
USD 117.000 PIONEER USD SHORT TERM (I$—Acc) 208 760.10 209 265.84 4.73%USD 1 603.810 SCHRODER GLB CONVERT BOND (C58) 222 137.11 220 319.31 4.98%USD 14 492.999 SCHRODER INTL JAPANESE OPP ( C—$H) 212 708.90 223 111.89 5.05%
643 606.11 652 697.04 14.77%
Total Investments in Investment Funds 4 014 447.92 4 077 875.21 92.25%
Total Investments 4 014 447.92 4 077 875.21 92.25%
Portfolio breakdownAs at December 31, 2016
By countries
Greece 13.32%Luxembourg 86.68%
Total 100.00%
By type of investments
Investment Funds 100.00%
Total 100.00%
The accompanying notes form an integral part of these financial statements. 31
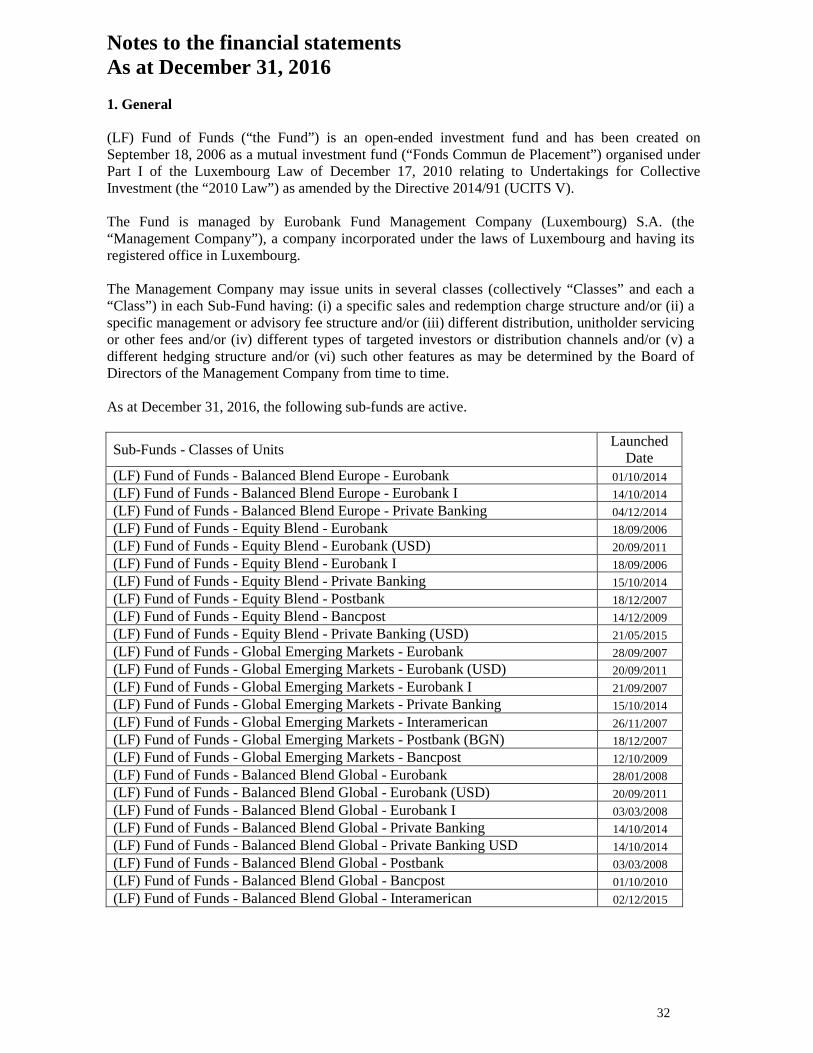
32
Notes to the financial statements As at December 31, 2016
1. General (LF) Fund of Funds (“the Fund”) is an open-ended investment fund and has been created on September 18, 2006 as a mutual investment fund (“Fonds Commun de Placement”) organised under Part I of the Luxembourg Law of December 17, 2010 relating to Undertakings for Collective Investment (the “2010 Law”) as amended by the Directive 2014/91 (UCITS V). The Fund is managed by Eurobank Fund Management Company (Luxembourg) S.A. (the “Management Company”), a company incorporated under the laws of Luxembourg and having its registered office in Luxembourg. The Management Company may issue units in several classes (collectively “Classes” and each a “Class”) in each Sub-Fund having: (i) a specific sales and redemption charge structure and/or (ii) a specific management or advisory fee structure and/or (iii) different distribution, unitholder servicing or other fees and/or (iv) different types of targeted investors or distribution channels and/or (v) a different hedging structure and/or (vi) such other features as may be determined by the Board of Directors of the Management Company from time to time. As at December 31, 2016, the following sub-funds are active.
Sub-Funds - Classes of Units Launched
Date (LF) Fund of Funds - Balanced Blend Europe - Eurobank 01/10/2014
(LF) Fund of Funds - Balanced Blend Europe - Eurobank I 14/10/2014
(LF) Fund of Funds - Balanced Blend Europe - Private Banking 04/12/2014
(LF) Fund of Funds - Equity Blend - Eurobank 18/09/2006
(LF) Fund of Funds - Equity Blend - Eurobank (USD) 20/09/2011
(LF) Fund of Funds - Equity Blend - Eurobank I 18/09/2006
(LF) Fund of Funds - Equity Blend - Private Banking 15/10/2014
(LF) Fund of Funds - Equity Blend - Postbank 18/12/2007
(LF) Fund of Funds - Equity Blend - Bancpost 14/12/2009
(LF) Fund of Funds - Equity Blend - Private Banking (USD) 21/05/2015
(LF) Fund of Funds - Global Emerging Markets - Eurobank 28/09/2007
(LF) Fund of Funds - Global Emerging Markets - Eurobank (USD) 20/09/2011
(LF) Fund of Funds - Global Emerging Markets - Eurobank I 21/09/2007
(LF) Fund of Funds - Global Emerging Markets - Private Banking 15/10/2014
(LF) Fund of Funds - Global Emerging Markets - Interamerican 26/11/2007
(LF) Fund of Funds - Global Emerging Markets - Postbank (BGN) 18/12/2007
(LF) Fund of Funds - Global Emerging Markets - Bancpost 12/10/2009
(LF) Fund of Funds - Balanced Blend Global - Eurobank 28/01/2008
(LF) Fund of Funds - Balanced Blend Global - Eurobank (USD) 20/09/2011
(LF) Fund of Funds - Balanced Blend Global - Eurobank I 03/03/2008
(LF) Fund of Funds - Balanced Blend Global - Private Banking 14/10/2014
(LF) Fund of Funds - Balanced Blend Global - Private Banking USD 14/10/2014
(LF) Fund of Funds - Balanced Blend Global - Postbank 03/03/2008
(LF) Fund of Funds - Balanced Blend Global - Bancpost 01/10/2010
(LF) Fund of Funds - Balanced Blend Global - Interamerican 02/12/2015
Notes to the financial statementsAs at December 31, 2016
1. General
(LF) Fund of Funds (“the Fund”) is an open—ended investment fund and has been created onSeptember 18, 2006 as a mutual investment fund (“Fonds Commun de Placement”) organised underPart I of the Luxembourg Law of December 17, 2010 relating to Undertakings for CollectiveInvestment (the “2010 Law”) as amended by the Directive 2014/91 (UCITS V).
The Fund is managed by Eurobank Fund Management Company (Luxembourg) S.A. (the“Management Company”), a company incorporated under the laws of Luxembourg and having itsregistered office in Luxembourg.
The Management Company may issue units in several classes (collectively “Classes” and each a“Class”) in each Sub—Fund having: (i) a specific sales and redemption charge structure and/or (ii) aspecific management or advisory fee structure and/or (iii) different distribution, unitholder servicingor other fees and/or (iv) different types of targeted investors or distribution channels and/or (v) adifferent hedging structure and/or (vi) such other features as may be determined by the Board ofDirectors of the Management Company from time to time.
As at December 31, 2016, the following sub—funds are active.
Sub—Funds — Classes of Units Lagnchedate(LF) Fund of Funds — Balanced Blend Europe — Eurobank 01/10/2014(LF) Fund of Funds — Balanced Blend Europe — Eurobank I 14/10/2014(LF) Fund of Funds — Balanced Blend Europe — Private Banking 04/12/2014(LF) Fund of Funds — Equity Blend — Eurobank 18/09/2006(LF) Fund of Funds — Equity Blend — Eurobank (USD) 20/09/2011(LF) Fund of Funds — Equity Blend — Eurobank I 18/09/2006(LF) Fund of Funds — Equity Blend — Private Banking 15/10/2014(LF) Fund of Funds — Equity Blend — Postbank 18/12/2007(LF) Fund of Funds — Equity Blend — Bancpost 14/12/2009(LF) Fund of Funds — Equity Blend — Private Banking (USD) 21/05/2015(LF) Fund of Funds — Global Emerging Markets — Eurobank 28/09/2007(LF) Fund of Funds — Global Emerging Markets — Eurobank (USD) 20/09/2011(LF) Fund of Funds — Global Emerging Markets — Eurobankl 21/09/2007(LF) Fund of Funds — Global Emerging Markets — Private Banking 15/10/2014(LF) Fund of Funds — Global Emerging Markets — Interamerican 26/11/2007(LF) Fund of Funds — Global Emerging Markets — Postbank (BGN) 18/12/2007(LF) Fund of Funds — Global Emerging Markets — Bancpost 12/10/2009(LF) Fund of Funds — Balanced Blend Global — Eurobank 28/01/2008(LF) Fund of Funds — Balanced Blend Global — Eurobank (USD) 20/09/2011(LF) Fund of Funds — Balanced Blend Global — Eurobankl 03/03/2008(LF) Fund of Funds — Balanced Blend Global — Private Banking 14/10/2014(LF) Fund of Funds — Balanced Blend Global — Private Banking USD 14/10/2014(LF) Fund of Funds — Balanced Blend Global — Postbank 03/03/2008(LF) Fund of Funds — Balanced Blend Global — Bancpost 01/10/2010(LF) Fund of Funds — Balanced Blend Global — Interamerican 02/12/2015
32
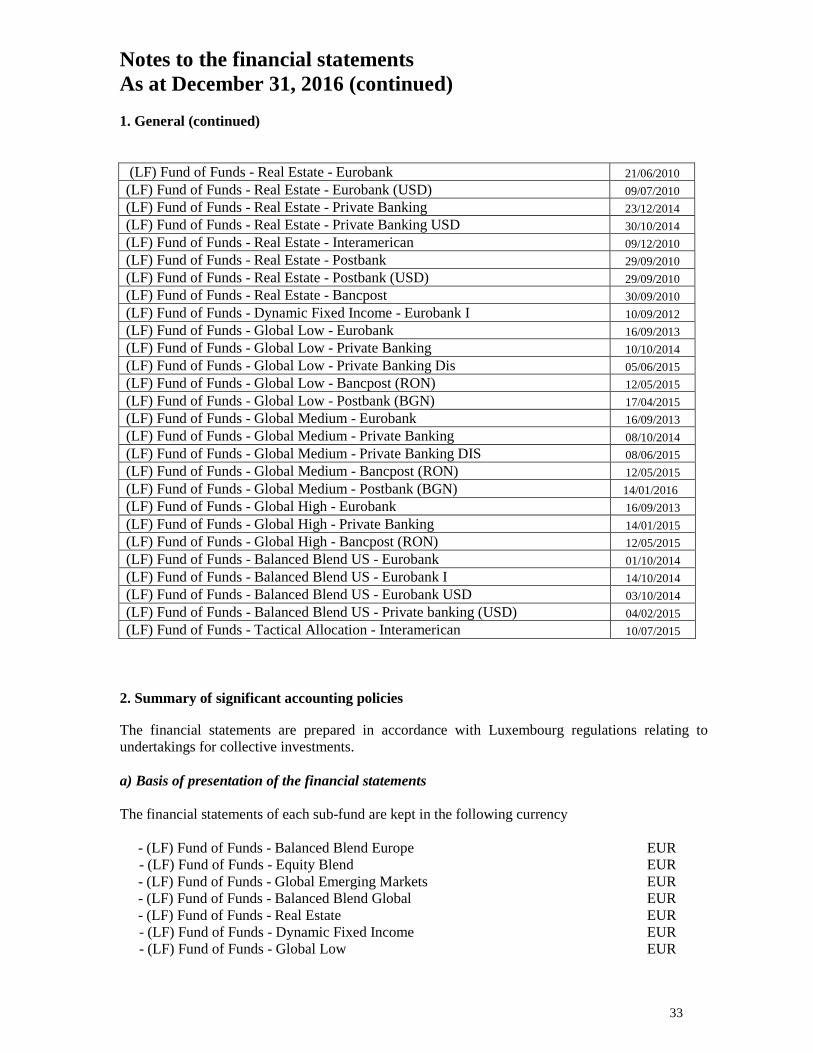
33
Notes to the financial statements As at December 31, 2016 (continued) 1. General (continued) (LF) Fund of Funds - Real Estate - Eurobank 21/06/2010
(LF) Fund of Funds - Real Estate - Eurobank (USD) 09/07/2010
(LF) Fund of Funds - Real Estate - Private Banking 23/12/2014
(LF) Fund of Funds - Real Estate - Private Banking USD 30/10/2014
(LF) Fund of Funds - Real Estate - Interamerican 09/12/2010
(LF) Fund of Funds - Real Estate - Postbank 29/09/2010
(LF) Fund of Funds - Real Estate - Postbank (USD) 29/09/2010
(LF) Fund of Funds - Real Estate - Bancpost 30/09/2010
(LF) Fund of Funds - Dynamic Fixed Income - Eurobank I 10/09/2012
(LF) Fund of Funds - Global Low - Eurobank 16/09/2013
(LF) Fund of Funds - Global Low - Private Banking 10/10/2014
(LF) Fund of Funds - Global Low - Private Banking Dis 05/06/2015
(LF) Fund of Funds - Global Low - Bancpost (RON) 12/05/2015
(LF) Fund of Funds - Global Low - Postbank (BGN) 17/04/2015
(LF) Fund of Funds - Global Medium - Eurobank 16/09/2013
(LF) Fund of Funds - Global Medium - Private Banking 08/10/2014
(LF) Fund of Funds - Global Medium - Private Banking DIS 08/06/2015
(LF) Fund of Funds - Global Medium - Bancpost (RON) 12/05/2015
(LF) Fund of Funds - Global Medium - Postbank (BGN) 14/01/2016
(LF) Fund of Funds - Global High - Eurobank 16/09/2013
(LF) Fund of Funds - Global High - Private Banking 14/01/2015
(LF) Fund of Funds - Global High - Bancpost (RON) 12/05/2015
(LF) Fund of Funds - Balanced Blend US - Eurobank 01/10/2014
(LF) Fund of Funds - Balanced Blend US - Eurobank I 14/10/2014
(LF) Fund of Funds - Balanced Blend US - Eurobank USD 03/10/2014
(LF) Fund of Funds - Balanced Blend US - Private banking (USD) 04/02/2015
(LF) Fund of Funds - Tactical Allocation - Interamerican 10/07/2015
2. Summary of significant accounting policies The financial statements are prepared in accordance with Luxembourg regulations relating to undertakings for collective investments. a) Basis of presentation of the financial statements The financial statements of each sub-fund are kept in the following currency
- (LF) Fund of Funds - Balanced Blend Europe EUR - (LF) Fund of Funds - Equity Blend EUR - (LF) Fund of Funds - Global Emerging Markets EUR - (LF) Fund of Funds - Balanced Blend Global EUR - (LF) Fund of Funds - Real Estate EUR - (LF) Fund of Funds - Dynamic Fixed Income EUR - (LF) Fund of Funds - Global Low EUR
Notes to the financial statementsAs at December 31, 2016 (continued)
1. General (continued)
(LF) Fund of Funds — Real Estate — Eurobank 21/06/2010(LF) Fund of Funds — Real Estate — Eurobank (USD) 09/07/2010(LF) Fund of Funds — Real Estate — Private Banking 23/12/2014(LF) Fund of Funds — Real Estate — Private Banking USD 30/10/2014(LF) Fund of Funds — Real Estate — Interamerican 09/12/2010(LF) Fund of Funds — Real Estate — Postbank 29/09/2010(LF) Fund of Funds — Real Estate — Postbank (USD) 29/09/2010(LF) Fund of Funds — Real Estate — Bancpost 30/09/2010(LF) Fund of Funds — Dynamic Fixed Income — Eurobank I 10/09/2012(LF) Fund of Funds — Global Low — Eurobank 16/09/2013(LF) Fund of Funds — Global Low — Private Banking 10/10/2014(LF) Fund of Funds — Global Low — Private Banking Dis 05/06/2015(LF) Fund of Funds — Global Low — Bancpost (RON) 12/05/2015(LF) Fund of Funds — Global Low — Postbank (BGN) 17/04/2015(LF) Fund of Funds — Global Medium — Eurobank 16/09/2013(LF) Fund of Funds — Global Medium — Private Banking 08/10/2014(LF) Fund of Funds — Global Medium — Private Banking DIS 08/06/2015(LF) Fund of Funds — Global Medium — Bancpost (RON) 12/05/2015(LF) Fund of Funds — Global Medium — Postbank (BGN) 14/01/2016(LF) Fund of Funds — Global High — Eurobank 16/09/2013(LF) Fund of Funds — Global High — Private Banking 14/01/2015(LF) Fund of Funds — Global High — Bancpost (RON) 12/05/2015(LF) Fund of Funds — Balanced Blend US — Eurobank 01/10/2014(LF) Fund of Funds — Balanced Blend US — Eurobank I 14/10/2014(LF) Fund of Funds — Balanced Blend US — Eurobank USD 03/10/2014(LF) Fund of Funds — Balanced Blend US — Private banking (USD) 04/02/2015(LF) Fund of Funds — Tactical Allocation — Interamerican 10/07/2015
2. Summary of significant accounting policies
The financial statements are prepared in accordance with Luxembourg regulations relating toundertakings for collective investments.
a) Basis ofpresentation ofthefinancial statements
The financial statements of each sub—fund are kept in the following currency
— (LF) Fund of Funds — Balanced Blend Europe EUR— (LF) Fund of Funds — Equity Blend EUR— (LF) Fund of Funds — Global Emerging Markets EUR— (LF) Fund of Funds — Balanced Blend Global EUR— (LF) Fund of Funds — Real Estate EUR— (LF) Fund of Funds — Dynamic Fixed Income EUR— (LF) Fund of Funds — Global Low EUR
33

34
Notes to the financial statements As at December 31, 2016 (continued) 2. Summary of significant accounting policies (Continued) a) Basis of presentation of the financial statements (continued) - (LF) Fund of Funds - Global Medium EUR - (LF) Fund of Funds - Global High EUR - (LF) Fund of Funds - Balanced Blend US EUR - (LF) Fund of Funds - Tactical Allocation EUR The combined financial statements of the Fund reflecting the assets and liabilities of all portfolios are expressed in Euro. b) Security Valuation Securities quoted or dealt in on any stock exchange or another regulated market are valued at the latest available price. When such prices are not representative of the fair value of the relevant securities and in the case of unquoted securities, the valuation is based on the respective reasonable foreseeable sales price as determined prudently and in good faith by the Board of Directors of the Management Company of the Fund. Cash equivalent or money market instruments with a remaining maturity of 60 days or less are stated at amortized cost, which approximates market value.
Investments in open-ended UCIs are valued on the basis of the last available NAV of the units or shares of such UCIs. c) Realised gains and losses on sales of investments in securities Investments in securities are accounted for on a trade date basis. Realised gains and losses on sales of investments in securities are based on the average cost basis. d) Foreign currency translation The cost of investments and the transactions during the year, expressed in foreign currencies, are converted into the reporting currency of each Sub-Fund at the rate of exchange ruling at the time of the purchase or transaction. The market value of investments and other assets and other liabilities, expressed in foreign currencies, are translated into the reporting currency of each Sub-Fund at end of period exchange rates. The consolidated statement is calculated at end of period exchange rates.
Notes to the financial statementsAs at December 31, 2016 (continued)
2. Summary of significant accounting policies (Continued)
a) Basis ofpresentation ofthefinancial statements (continued)
— (LF) Fund of Funds — Global Medium EUR— (LF) Fund of Funds — Global High EUR— (LF) Fund of Funds — Balanced Blend US EUR— (LF) Fund of Funds — Tactical Allocation EUR
The combined financial statements of the Fund reflecting the assets and liabilities of all portfoliosare expressed in Euro.
b) Security Valuation
Securities quoted or dealt in on any stock exchange or another regulated market are valued at thelatest available price.
When such prices are not representative of the fair value of the relevant securities and in the case ofunquoted securities, the valuation is based on the respective reasonable foreseeable sales price asdetermined prudently and in good faith by the Board of Directors of the Management Company ofthe Fund.
Cash equivalent or money market instruments with a remaining maturity of 60 days or less arestated at amortized cost, which approximates market value.
Investments in open—ended UCIs are valued on the basis of the last available NAV of the units orshares of such UCIs.
c) Realised gains and losses on sales ofinvestments in securities
Investments in securities are accounted for on a trade date basis. Realised gains and losses on salesof investments in securities are based on the average cost basis.
d) Foreign currency translation
The cost of investments and the transactions during the year, expressed in foreign currencies, areconverted into the reporting currency of each Sub—Fund at the rate of exchange ruling at the time ofthe purchase or transaction.
The market value of investments and other assets and other liabilities, expressed in foreigncurrencies, are translated into the reporting currency of each Sub—Fund at end of period exchangerates. The consolidated statement is calculated at end ofperiod exchange rates.
34

35
Notes to the financial statements
As at December 31, 2016 (continued) d) Foreign currency translation (continued) Closing exchange rates as at December 31, 2016 relating to EUR are: 1 USD = 0.9487 EUR 1 BGN = 0.5113 EUR 1 RON = 0.2203 EUR 1 PLN = 0.2267 EUR e) Interest and Dividend income Interest income is recognized on an accrual basis, net of any irrecoverable withholding tax. Dividends are recorded on an ex-dividend basis and net of any irrecoverable withholding tax. f) Formation expenses Formation expenses are amortised over a period of 5 years and are allocated to the relevant Sub-Funds or are allocated to the different Sub-Funds in proportion to their respective weight in the total net assets at the end of their related subscription period. 3. Management fees Management fees are due by each Sub-Fund to the Management Company and are calculated daily based on the net assets of each class of Units during the month and are payable monthly. As at December 31, 2016 the following effective rates are applicable per annum: (LF) Fund of Funds - Balanced Blend Europe - Eurobank 1.25%
(LF) Fund of Funds - Balanced Blend Europe - Eurobank I 0.63%
(LF) Fund of Funds - Balanced Blend Europe - Private Banking 1.25%
(LF) Fund of Funds - Equity Blend - Eurobank 1.75%
(LF) Fund of Funds - Equity Blend - Eurobank (USD) 1.75%
(LF) Fund of Funds - Equity Blend - Eurobank I 0.70%
(LF) Fund of Funds - Equity Blend - Private Banking 1.75%
(LF) Fund of Funds - Equity Blend - Postbank 2.00%
(LF) Fund of Funds - Equity Blend - Bancpost 2.00%
(LF) Fund of Funds - Equity Blend - Private Banking (USD) 1.75%
(LF) Fund of Funds - Global Emerging Markets - Eurobank 2.00%
(LF) Fund of Funds - Global Emerging Markets - Eurobank (USD) 2.00%
(LF) Fund of Funds - Global Emerging Markets - Eurobank I 1.00%
(LF) Fund of Funds - Global Emerging Markets - Interamerican 2.00%
(LF) Fund of Funds - Global Emerging Markets - Private Banking 2.00%
(LF) Fund of Funds - Global Emerging Markets - Postbank 2.50%
(LF) Fund of Funds - Global Emerging Markets - Bancpost 2.50%
(LF) Fund of Funds - Balanced Blend Global - Eurobank 1.25%
(LF) Fund of Funds - Balanced Blend Global - Eurobank (USD) 1.25%
(LF) Fund of Funds - Balanced Blend Global - Eurobank I 0.63%
(LF) Fund of Funds - Balanced Blend Global - Interamerican 1.25%
(LF) Fund of Funds - Balanced Blend Global - Private Banking 1.25%
(LF) Fund of Funds - Balanced Blend Global - Private Banking USD 1.25%
Notes to the financial statementsAs at December 31, 2016 (continued)
d) Foreign currency translation (continued)
Closing exchange rates as at December 31, 2016 relating to EUR are:
1 USD = 0.9487 EURIBGN = 0.5113 EUR1 RON = 0.2203 EUR1 PLN = 0.2267 EUR
e) Interest and Dividend income
Interest income is recognized on an accrual basis, net of any irrecoverable withholding tax.Dividends are recorded on an ex—dividend basis and net of any irrecoverable withholding tax.
)9 Formation expenses
Formation expenses are amortised over a period of 5 years and are allocated to the relevant Sub-Funds or are allocated to the different Sub—Funds in proportion to their respective weight in the totalnet assets at the end of their related subscription period.
3. Management fees
Management fees are due by each Sub—Fund to the Management Company and are calculated dailybased on the net assets of each class of Units during the month and are payable monthly.
As at December 31, 2016 the following effective rates are applicable per annum:
(LF) Fund of Funds — Balanced Blend Europe — Eurobank 1.25%(LF) Fund of Funds — Balanced Blend Europe — Eurobank I 0.63%(LF) Fund of Funds — Balanced Blend Europe — Private Banking 1.25%(LF) Fund of Funds — Equity Blend — Eurobank 1.75%(LF) Fund of Funds — Equity Blend — Eurobank (USD) 1.75%(LF) Fund of Funds — Equity Blend — Eurobankl 0.70%(LF) Fund of Funds — Equity Blend — Private Banking 1.75%(LF) Fund of Funds — Equity Blend — Postbank 2.00%(LF) Fund of Funds — Equity Blend — Bancpost 2.00%(LF) Fund of Funds — Equity Blend — Private Banking (USD) 1.75%(LF) Fund of Funds — Global Emerging Markets — Eurobank 2.00%(LF) Fund of Funds — Global Emerging Markets — Eurobank (USD) 2.00%(LF) Fund of Funds — Global Emerging Markets — Eurobankl 1.00%(LF) Fund of Funds — Global Emerging Markets — Interamerican 2.00%(LF) Fund of Funds — Global Emerging Markets — Private Banking 2.00%(LF) Fund of Funds — Global Emerging Markets — Postbank 2.50%(LF) Fund of Funds — Global Emerging Markets — Bancpost 2.50%(LF) Fund of Funds — Balanced Blend Global — Eurobank 1.25%(LF) Fund of Funds — Balanced Blend Global — Eurobank (USD) 1.25%(LF) Fund of Funds — Balanced Blend Global — Eurobank I 0.63%(LF) Fund of Funds — Balanced Blend Global — Interamerican 1.25%(LF) Fund of Funds — Balanced Blend Global — Private Banking 1.25%(LF) Fund of Funds — Balanced Blend Global — Private Banking USD 1.25%
35

36
Notes to the financial statements As at December 31, 2016 (continued) 3. Management fees (continued)
(LF) Fund of Funds - Balanced Blend Global – Postbank 1.50%
(LF) Fund of Funds - Balanced Blend Global – Bancpost 1.50%
(LF) Fund of Funds - Real Estate – Eurobank 1.75%
(LF) Fund of Funds - Real Estate - Eurobank (USD) 1.75%
(LF) Fund of Funds - Real Estate - Private Banking 1.75%
(LF) Fund of Funds - Real Estate - Private Banking USD 1.75%
(LF) Fund of Funds - Real Estate - Interamerican 1.50%
(LF) Fund of Funds - Real Estate - Postbank 1.50%
(LF) Fund of Funds - Real Estate - Postbank (USD) 1.50%
(LF) Fund of Funds - Real Estate - Bancpost 1.50%
(LF) Fund of Funds - Dynamic Fixed Income - Eurobank I 0.60% (A)
(LF) Fund of Funds - Global Low - Eurobank 0.75%
(LF) Fund of Funds - Global Low - Private Banking 0.75%
(LF) Fund of Funds - Global Low - Private banking DIS 0.75%
(LF) Fund of Funds - Global Low - Bancpost (RON) 0.75%
(LF) Fund of Funds - Global Low - Postbank (BGN) 0.75%
(LF) Fund of Funds - Global Medium - Eurobank 1.00%
(LF) Fund of Funds - Global Medium - Private Banking 1.00%
(LF) Fund of Funds - Global medium - Private Banking DIS 1.00%
(LF) Fund of Funds - Global Medium - Bancpost (RON) 1.00%
(LF) Fund of Funds - Global Medium - Postbank (BGN) 1.00%
(LF) Fund of Funds - Global High - Eurobank 1.25%
(LF) Fund of Funds - Global High - Private Banking 1.25%
(LF) Fund of Funds - Global High - Bancpost (RON) 1.25%
(LF) Fund of Funds - Balanced Blend US - Eurobank 1.25%
(LF) Fund of Funds - Balanced Blend US - Eurobank I 0.63%
(LF) Fund of Funds - Balanced Blend US - Eurobank USD 1.25%
(LF) Fund of Funds - Balanced Blend US - Private Banking (USD) 1.25%
(LF) Fund of Funds - Tactical Allocation - Interamerican 2.00% (B) (A): 0.75% until 16/10/16 (B): 0% until 29/03/16
Notes to the financial statementsAs at December 31, 2016 (continued)3. Management fees (continued)
(LF) Fund of Funds — Balanced Blend Global — Postbank 1.50%(LF) Fund of Funds — Balanced Blend Global — Bancpost 1.50%(LF) Fund of Funds — Real Estate — Eurobank 1.75%(LF) Fund of Funds — Real Estate — Eurobank (USD) 1.75%(LF) Fund of Funds — Real Estate — Private Banking 1.75%(LF) Fund of Funds — Real Estate — Private Banking USD 1.75%(LF) Fund of Funds — Real Estate — Interamerican 1.50%(LF) Fund of Funds — Real Estate — Postbank 1.50%(LF) Fund of Funds — Real Estate — Postbank (USD) 1.50%(LF) Fund of Funds — Real Estate — Bancpost 1.50%(LF) Fund of Funds — Dynamic Fixed Income — Eurobank I 0.60% (A)(LF) Fund of Funds — Global Low — Eurobank 0.75%(LF) Fund of Funds — Global Low — Private Banking 0.75%(LF) Fund of Funds — Global Low — Private banking DIS 0.75%(LF) Fund of Funds — Global Low — Bancpost (RON) 0.75%(LF) Fund of Funds — Global Low — Postbank (BGN) 0.75%(LF) Fund of Funds — Global Medium — Eurobank 1.00%(LF) Fund of Funds — Global Medium — Private Banking 1.00%(LF) Fund of Funds — Global medium — Private Banking DIS 1.00%(LF) Fund of Funds — Global Medium — Bancpost (RON) 1.00%(LF) Fund of Funds — Global Medium — Postbank (BGN) 1.00%(LF) Fund of Funds — Global High — Eurobank 1.25%(LF) Fund of Funds — Global High — Private Banking 1.25%(LF) Fund of Funds — Global High — Bancpost (RON) 1.25%(LF) Fund of Funds — Balanced Blend US — Eurobank 1.25%(LF) Fund of Funds — Balanced Blend US — Eurobank I 0.63%(LF) Fund of Funds — Balanced Blend US — Eurobank USD 1.25%(LF) Fund of Funds — Balanced Blend US — Private Banking (USD) 1.25%(LF) Fund of Funds — Tactical Allocation — Interamerican 2.00% (B)
(A): 0.75% until 16/10/16(B): 0% until 29/03/16
36
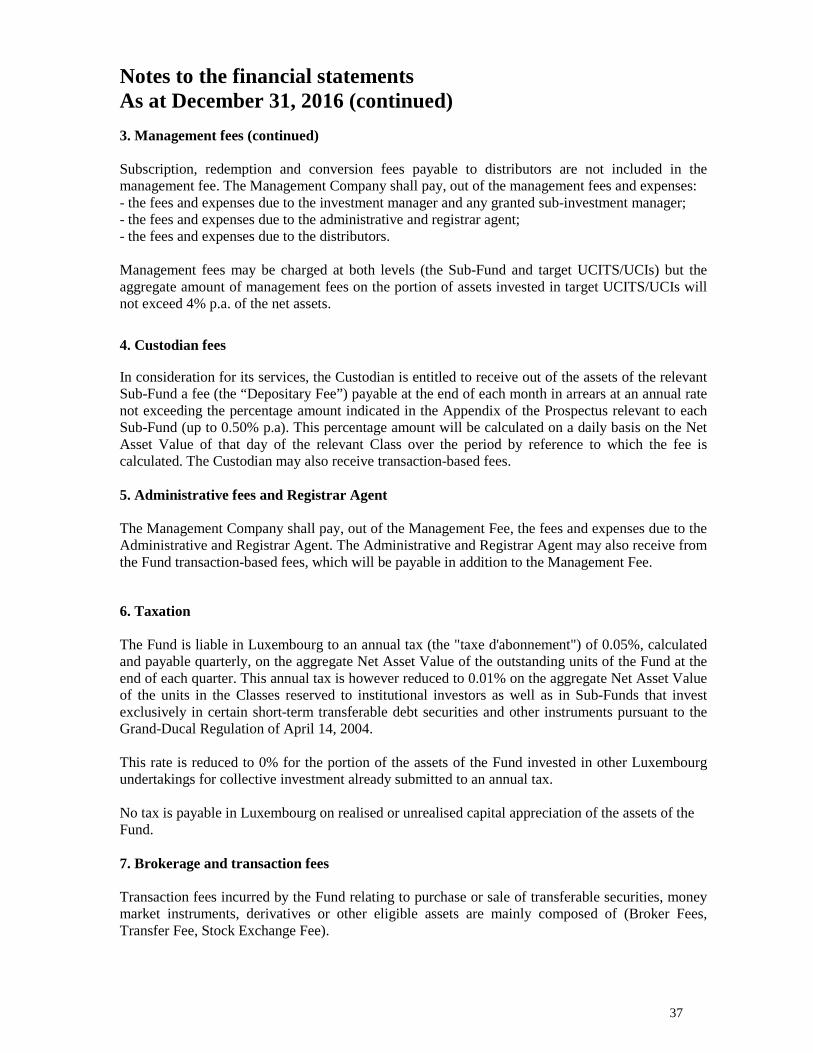
37
Notes to the financial statements As at December 31, 2016 (continued) 3. Management fees (continued) Subscription, redemption and conversion fees payable to distributors are not included in the management fee. The Management Company shall pay, out of the management fees and expenses: - the fees and expenses due to the investment manager and any granted sub-investment manager; - the fees and expenses due to the administrative and registrar agent; - the fees and expenses due to the distributors. Management fees may be charged at both levels (the Sub-Fund and target UCITS/UCIs) but the aggregate amount of management fees on the portion of assets invested in target UCITS/UCIs will not exceed 4% p.a. of the net assets.
4. Custodian fees In consideration for its services, the Custodian is entitled to receive out of the assets of the relevant Sub-Fund a fee (the “Depositary Fee”) payable at the end of each month in arrears at an annual rate not exceeding the percentage amount indicated in the Appendix of the Prospectus relevant to each Sub-Fund (up to 0.50% p.a). This percentage amount will be calculated on a daily basis on the Net Asset Value of that day of the relevant Class over the period by reference to which the fee is calculated. The Custodian may also receive transaction-based fees. 5. Administrative fees and Registrar Agent The Management Company shall pay, out of the Management Fee, the fees and expenses due to the Administrative and Registrar Agent. The Administrative and Registrar Agent may also receive from the Fund transaction-based fees, which will be payable in addition to the Management Fee. 6. Taxation The Fund is liable in Luxembourg to an annual tax (the "taxe d'abonnement") of 0.05%, calculated and payable quarterly, on the aggregate Net Asset Value of the outstanding units of the Fund at the end of each quarter. This annual tax is however reduced to 0.01% on the aggregate Net Asset Value of the units in the Classes reserved to institutional investors as well as in Sub-Funds that invest exclusively in certain short-term transferable debt securities and other instruments pursuant to the Grand-Ducal Regulation of April 14, 2004. This rate is reduced to 0% for the portion of the assets of the Fund invested in other Luxembourg undertakings for collective investment already submitted to an annual tax. No tax is payable in Luxembourg on realised or unrealised capital appreciation of the assets of the Fund. 7. Brokerage and transaction fees Transaction fees incurred by the Fund relating to purchase or sale of transferable securities, money market instruments, derivatives or other eligible assets are mainly composed of (Broker Fees, Transfer Fee, Stock Exchange Fee).
Notes to the financial statementsAs at December 31, 2016 (continued)3. Management fees (continued)
Subscription, redemption and conversion fees payable to distributors are not included in themanagement fee. The Management Company shall pay, out of the management fees and expenses:— the fees and expenses due to the investment manager and any granted sub—investrnent manager;— the fees and expenses due to the administrative and registrar agent;— the fees and expenses due to the distributors.
Management fees may be charged at both levels (the Sub—Fund and target UCITS/UCIs) but theaggregate amount of management fees on the portion of assets invested in target UCITS/UCIs willnot exceed 4% p.a. of the net assets.
4. Custodian fees
In consideration for its services, the Custodian is entitled to receive out of the assets of the relevantSub—Fund a fee (the “Depositary Fee”) payable at the end of each month in arrears at an annual ratenot exceeding the percentage amount indicated in the Appendix of the Prospectus relevant to eachSub—Fund (up to 0.50% p.a). This percentage amount will be calculated on a daily basis on the NetAsset Value of that day of the relevant Class over the period by reference to which the fee iscalculated. The Custodian may also receive transaction—based fees.
5. Administrative fees and Registrar Agent
The Management Company shall pay, out of the Management Fee, the fees and expenses due to theAdministrative and Registrar Agent. The Administrative and Registrar Agent may also receive fromthe Fund transaction—based fees, which will be payable in addition to the Management Fee.
6. Taxation
The Fund is liable in Luxembourg to an annual tax (the "taxe d'abonnement") of 0.05%, calculatedand payable quarterly, on the aggregate Net Asset Value of the outstanding units of the Fund at theend of each quarter. This annual tax is however reduced to 0.01% on the aggregate Net Asset Valueof the units in the Classes reserved to institutional investors as well as in Sub—Funds that investexclusively in certain short—term transferable debt securities and other instruments pursuant to theGrand—Ducal Regulation ofApril 14, 2004.
This rate is reduced to 0% for the portion of the assets of the Fund invested in other Luxembourgundertakings for collective investment already submitted to an annual tax.
No tax is payable in Luxembourg on realised or unrealised capital appreciation of the assets of theFund.
7. Brokerage and transaction fees
Transaction fees incurred by the Fund relating to purchase or sale of transferable securities, moneymarket instruments, derivatives or other eligible assets are mainly composed of (Broker Fees,Transfer Fee, Stock Exchange Fee).
37

38
Notes to the financial statements As at December 31, 2016 (continued) 8. Statement of changes in investments A list, for each Sub-Fund, specifying for each investment the total purchases and sales which occurred during the period under review, may be obtained free of charge, upon request, at the Registered Office of the Management Company. 9. Subsequent event The Board of Directors of the Management Company has decided to launch two new sub-funds with effective date as of May 2ND, 2017:
- (LF) Fund of Fund - Life cycle 2032 - (LF) Fund of Fund - Life cycle 2047
Notes to the financial statementsAs at December 31, 2016 (continued)
8. Statement of changes in investments
A list, for each Sub—Fund, specifying for each investment the total purchases and sales whichoccurred during the period under review, may be obtained free of charge, upon request, at theRegistered Offi ceof the Management Company.
9. Subsequent event
The Board of Directors of the Management Company has decided to launch two new sub—fundswith effective date as of May 2ND, 2017:
— (LF) Fund of Fund — Life cycle 2032— (LF) Fund of Fund — Life cycle 2047
38

39
Unaudited information
1. Remuneration policy UCITS V The Fund is managed by Eurobank Fund Management Company (Luxembourg) S.A. (Eurobank FMC-LUX in short), a public limited company ("société anonyme") belonging to Eurobank Ergasias S.A. group and organized under chapter 15 of the 2010 Law. Its initial share capital amounts to EUR 1 200 000. The assets of the Fund are segregated from those of the Management Company. The Management Company was incorporated on March 22nd, 2006 for an unlimited period of time with the purpose of managing UCITS. The Management Company currently manages (LF) and (LF) Fund of Funds. Its Articles of Incorporation were published in the Mémorial C of April 10th, 2006 and amendments thereto were published in the Mémorial C of August 19th, 2006 and of October 23rd , 2012. The Management Company or its appointed agents may carry out administrative, management and marketing functions on behalf of the Fund and the Unitholders, including the purchase, sale and exchange of securities, and it may exercise all rights directly or indirectly related to the Fund's assets. The remuneration policy of the Management Company is consistent with and promotes sound and effective risk management and does not encourage risk-taking which is inconsistent with the risk profile, rules or instruments of incorporation of the funds managed. The remuneration policy reflects the Management Company’s objectives for good corporate governance as well as sustained and long-term value creation for the Unitholders. The remuneration policy has been designed and implemented to:
- Support actively the achievement of the Management Company’s strategy and objectives;
- Support the competitiveness of the Management Company in the markets it operates;
- Be able to attract, develop and retain high-performing and motivated employees; and
- Address any situations of conflicts of interest. For that purpose, the Management Company has implemented and maintains an adequate management of conflicts of interest policy.
Employees of the Management Company are offered a competitive and market-aligned remuneration package making fixed salaries a significant component of their total package. Moreover, the assessment of performance is set in a multi-year framework appropriate to the holding period recommended to the investors of the Fund in order to ensure that the assessment process is based on the longer-term performance of the Fund and its investment risks and that the actual payment of performance-based components of remuneration is spread over the same period. The principles of the remuneration policy are reviewed on a regular basis and adapted to the evolving regulatory framework. The remuneration policy has been approved by the Board of Directors of the Management Company. The details of the remuneration policy can be found on the website of the Management Company (www.eurobankfmc.lu). A paper copy of the remuneration policy will be made available free of charge upon request.
Unaudited information
1. Remuneration policy UCITS V
The Fund is managed by Eurobank Fund Management Company (Luxembourg) S.A. (EurobankFMC—LUX in short), a public limited company ("société anonyme") belonging to EurobankErgasias S.A. group and organized under chapter 15 of the 2010 Law. Its initial share capitalamounts to EUR 1 200 000. The assets of the Fund are segregated from those of the ManagementCompany.
The Management Company was incorporated on March 22nd, 2006 for an unlimited period of timewith the purpose of managing UCITS. The Management Company currently manages (LF) and(LF) Fund of Funds. Its Articles of Incorporation were published in the Mémorial C of April 10”‘,2006 and amendments thereto were published in the Mémorial C of August 19”‘, 2006 and ofOctober 23”‘ , 2012.
The Management Company or its appointed agents may carry out administrative, management andmarketing functions on behalf of the Fund and the Unitholders, including the purchase, sale andexchange of securities, and it may exercise all rights directly or indirectly related to the Fund'sassets.
The remuneration policy of the Management Company is consistent with and promotes sound andeffective risk management and does not encourage risk—taking which is inconsistent with the riskprofile, rules or instruments of incorporation of the funds managed.
The remuneration policy reflects the Management Company’s objectives for good corporategovernance as well as sustained and long—term value creation for the Unitholders. The remunerationpolicy has been designed and implemented to:
— Support actively the achievement of the Management Company’s strategy andobjectives;
— Support the competitiveness of the Management Company in the markets itoperates;
— Be able to attract, develop and retain high—perforrning and motivated employees;and
— Address any situations of conflicts of interest. For that purpose, the ManagementCompany has implemented and maintains an adequate management of conflicts ofinterest policy.
Employees of the Management Company are offered a competitive and market—alignedremuneration package making fixed salaries a significant component of their total package.Moreover, the assessment of performance is set in a multi—year framework appropriate to theholding period recommended to the investors of the Fund in order to ensure that the assessmentprocess is based on the longer—terrn performance of the Fund and its investment risks and that theactual payment of performance—based components of remuneration is spread over the same period.
The principles of the remuneration policy are reviewed on a regular basis and adapted to theevolving regulatory framework. The remuneration policy has been approved by the Board ofDirectors of the Management Company.
The details of the remuneration policy can be found on the website of the Management Company(www.eurobankfmc.lu). A paper copy of the remuneration policy will be made available free ofcharge upon request.
39
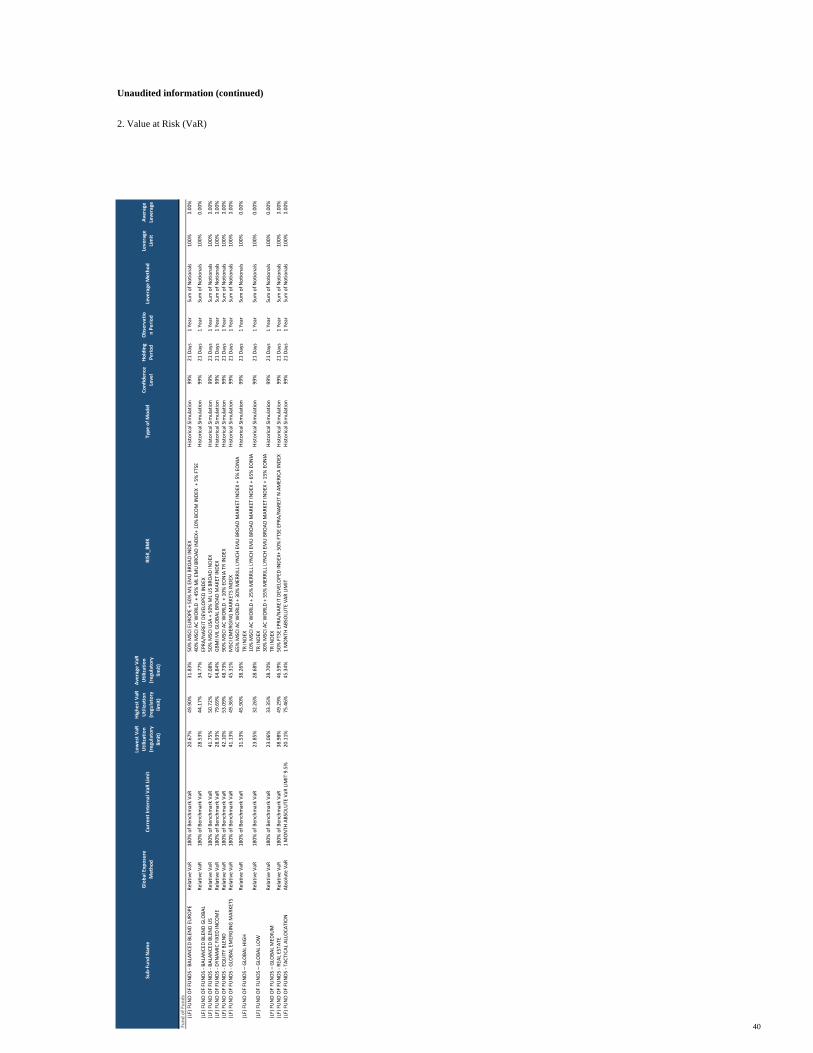
Su
b-F
un
d N
am
eG
lob
al
Ex
po
sure
Me
tho
dC
urr
en
t In
tern
al
Va
R L
imit
Low
est
Va
R
Uti
liza
tio
n
(re
gu
lato
ry
lim
it)
Hig
he
st V
aR
Uti
liza
tio
n
(re
gu
lato
ry
lim
it)
Av
era
ge
Va
R
Uti
liza
tio
n
(re
gu
lato
ry
lim
it)
RIS
K_
BM
KT
yp
e o
f M
od
el
Co
nfi
de
nce
Lev
el
Ho
ldin
g
Pe
rio
d
Ob
serv
ati
o
n P
eri
od
Lev
era
ge
Me
tho
dLe
ve
rag
e
Lim
it
Av
era
ge
Lev
era
ge
Fu
nd
of
Fu
nd
s
(LF
) F
UN
D O
F F
UN
DS
- B
ALA
NC
ED
BLE
ND
EU
RO
PE
Re
lati
ve
Va
R1
80
% o
f B
en
chm
ark
Va
R2
0.6
7%
49
.90
%3
1.8
3%
50
% M
SC
I E
UR
OP
E +
50
% M
L E
MU
BR
OA
D I
ND
EX
His
tori
cal
Sim
ula
tio
n9
9%
21
Da
ys
1 Y
ea
rS
um
of
No
tio
na
ls1
00
%0
.00
%
(LF
) F
UN
D O
F F
UN
DS
- B
ALA
NC
ED
BLE
ND
GLO
BA
LR
ela
tiv
e V
aR
18
0%
of
Be
nch
ma
rk V
aR
28
.53
%4
4.1
7%
34
.77
%4
0%
MS
CI
AC
WO
RLD
+
45
% M
L E
MU
BR
OA
D I
ND
EX
+ 1
0%
BC
OM
IN
DE
X
+ 5
% F
TS
E
EP
RA
/NA
RE
IT D
EV
ELO
PE
D I
ND
EX
His
tori
cal
Sim
ula
tio
n9
9%
21
Da
ys
1 Y
ea
rS
um
of
No
tio
na
ls1
00
%0
.00
%
(LF
) F
UN
D O
F F
UN
DS
- B
ALA
NC
ED
BLE
ND
US
Re
lati
ve
Va
R1
80
% o
f B
en
chm
ark
Va
R4
1.7
5%
50
.72
%4
7.0
8%
50
% M
SC
I U
SA
+ 5
0%
ML
US
BR
OA
D I
ND
EX
His
tori
cal
Sim
ula
tio
n9
9%
21
Da
ys
1 Y
ea
rS
um
of
No
tio
na
ls1
00
%0
.00
%
(LF
) F
UN
D O
F F
UN
DS
- D
YN
AM
IC F
IXE
D I
NC
OM
ER
ela
tiv
e V
aR
18
0%
of
Be
nch
ma
rk V
aR
28
.93
%7
9.6
9%
64
.84
%G
BM
I M
L G
LOB
AL
BR
OA
D M
AK
ET
IN
DE
XH
isto
rica
l S
imu
lati
on
99
%2
1 D
ay
s1
Ye
ar
Su
m o
f N
oti
on
als
10
0%
0.0
0%
(LF
) F
UN
D O
F F
UN
DS
- E
QU
ITY
BLE
ND
Re
lati
ve
Va
R1
80
% o
f B
en
chm
ark
Va
R4
2.1
0%
53
.09
%4
8.7
3%
90
% M
SC
I A
C W
OR
LD
+ 1
0%
EO
NIA
TR
IN
DE
XH
isto
rica
l S
imu
lati
on
99
%2
1 D
ay
s1
Ye
ar
Su
m o
f N
oti
on
als
10
0%
0.0
0%
(LF
) F
UN
D O
F F
UN
DS
- G
LOB
AL
EM
ER
GIN
G M
AR
KE
TS
Re
lati
ve
Va
R1
80
% o
f B
en
chm
ark
Va
R4
1.1
3%
49
.36
%4
5.3
1%
MS
CI
EM
ER
GIN
G M
AR
KE
TS
IN
DE
XH
isto
rica
l S
imu
lati
on
99
%2
1 D
ay
s1
Ye
ar
Su
m o
f N
oti
on
als
10
0%
0.0
0%
(LF
) F
UN
D O
F F
UN
DS
– G
LOB
AL
HIG
HR
ela
tiv
e V
aR
18
0%
of
Be
nch
ma
rk V
aR
31
.53
%4
5.9
0%
38
.26
%6
5%
MS
CI
AC
WO
RLD
+ 3
0%
ME
RR
ILL
LYN
CH
EM
U B
RO
AD
MA
RK
ET
IN
DE
X +
5%
EO
NIA
TR
IN
DE
XH
isto
rica
l S
imu
lati
on
99
%2
1 D
ay
s1
Ye
ar
Su
m o
f N
oti
on
als
10
0%
0.0
0%
(LF
) F
UN
D O
F F
UN
DS
– G
LOB
AL
LOW
Re
lati
ve
Va
R1
80
% o
f B
en
chm
ark
Va
R2
3.8
5%
32
.26
%2
8.6
8%
10
% M
SC
I A
C W
OR
LD +
25
% M
ER
RIL
L LY
NC
H E
MU
BR
OA
D M
AR
KE
T I
ND
EX
+ 6
5%
EO
NIA
TR
IN
DE
XH
isto
rica
l S
imu
lati
on
99
%2
1 D
ay
s1
Ye
ar
Su
m o
f N
oti
on
als
10
0%
0.0
0%
(LF
) F
UN
D O
F F
UN
DS
– G
LOB
AL
ME
DIU
MR
ela
tiv
e V
aR
18
0%
of
Be
nch
ma
rk V
aR
23
.06
%3
3.3
5%
28
.70
%3
0%
MS
CI
AC
WO
RLD
+ 5
5%
ME
RR
ILL
LYN
CH
EM
U B
RO
AD
MA
RK
ET
IN
DE
X +
15
% E
ON
IA
TR
IN
DE
XH
isto
rica
l S
imu
lati
on
99
%2
1 D
ay
s1
Ye
ar
Su
m o
f N
oti
on
als
10
0%
0.0
0%
(LF
) F
UN
D O
F F
UN
DS
- R
EA
L E
ST
AT
ER
ela
tiv
e V
aR
18
0%
of
Be
nch
ma
rk V
aR
38
.98
%4
9.2
9%
46
.59
%5
0%
FT
SE
EP
RA
/NA
RE
IT D
EV
ELO
PE
D I
ND
EX
+ 5
0%
FT
SE
EP
RA
/NA
RE
IT N
AM
ER
ICA
IN
DE
XH
isto
rica
l S
imu
lati
on
99
%2
1 D
ay
s1
Ye
ar
Su
m o
f N
oti
on
als
10
0%
0.0
0%
(LF
) F
UN
D O
F F
UN
DS
- T
AC
TIC
AL
ALL
OC
AT
ION
Ab
solu
te V
aR
1 M
ON
TH
AB
SO
LUT
E V
aR
LIM
IT 9
.5%
20
.11
%7
5.4
6%
45
.34
%1
MO
NT
H A
BS
OLU
TE
VA
R L
IMIT
His
tori
cal
Sim
ula
tio
n9
9%
21
Da
ys
1 Y
ea
rS
um
of
No
tio
na
ls1
00
%0
.00
%
40
Unaudited information (continued)
2. Value at Risk (VaR)
Unaudited information (continued)
2. Value at Risk (VaR)
40
$00.0
$00H
m_..:._:.zwe
5%
._mu>H
1,5Hw
$mm
§_s_=E_m
_mu_._efi_I
:2...
z<>
mS._omm<
IHZOS.H
$vm.mv
§...E
$HH.0~
$m.m
:2...
zm>
mS._omm<
IHZOS.H
zm>
uu:_em_.._<
zo:<uo._._<
._<u:b<».
322no
Q23“.
E...
$00.0
$00.."
m_m.s_:.zwe
5%
in)H
min2
$00
xmn_z_
5.3522
:m~_<z>::m
mm:
$0m
+xmnz_
Bn_o._m>mn_
:m~_<z\<Em
mm:
$0m
$3.3
$3.3
$wm.wm
xm>
émefifi mwe
$03"
%>m>
23.
N25
.25..
32:“.no
023“.
E...
xmn_z::
_2D_n_m_2
._<mo._u:mez_.:
u_oaz_.::.__
.
>
.
.
.
$000
$00H
m_m:e_uezwe
5%
._mu>H
mEHw
$mm
.:__s_=E_m_3_._u:_x
<_zom
$mH+xmn_z:mvE<_2
n_<ozm
_.:2m
Iuz>._
._.__zzm_2$mm+n_._zo>>
u<_um_2
$0m
:2_:
$mmmm
$m0mu
zm>
v_._mE:u:umwe
$0mH
zm>u>_un_uz
xmn_z_H:
26..
._<mo._uI
822no
Q23“.
E...
.
>
.
.
.
$000
$00H
m_m:e_uezwe
5%
._mu>H
mEHw
$mm
.:__s_=E_m
_mu_._efi_I
<_zOm
$mm+
xmn_z_
EvE<_2
n_<O¢m
3.2m
Iuz>._
._.__¢¢m_2
$m~+
n_._¢O>>u<
_um_2
$0H
$mm_:
$m~um
$mmmu
zm>
v_._mE:u:umwe
$0mH
zm>
u>_un_uz
xmn_z_E
10.1
._<mo._uI
322no
Q23“.
E...
.
>
.
.
.
$000
$00H
m_m:e_uezwe
5%
._mu>H
mEHw
$mm
.:__s_=E_m_3_._u:_x
<_zOm
$m+xmn_z_
EvE<_2
n_<O¢m
3.2m
Iuz>._
._.__¢¢m_2$0m
+n_._¢O>>
u<_um_2
$mm
$m~an
$0mma
$mmHm
zm>
v_._mE:u:umwe
$0mH
zm>u>_un_uz
$00.0
$00H
m_..:._:.zwe
=:_m
Eu)H
1,5Ha
$mm
§_s_=E_m
_mu_._eum_I
xmaz_
mEv:_<_2
oz_o$_2m
_um_2
$Hm.mv
Emma
$mH.Hv
¢m>
V_._m:Eu:umwe
$0mH
¢m>
u>_um_u¢
mEv_¢<_2
oz_ofi_2m
._<mO._0.
322to
az_.:
E4.
$00.0
$00H
m_m:e
ozwe
5%
in)H
“inHa
$mm
xmn_z_E
<_z8
$0H.9
n_4ED>>u<
ans.
$0m
$2.3
$m0.mm
$0H.~w
mm)
V_;Efi ._mmwe
$0mH
K5m>
23.
nzmi
>:3dm.
32:“.no
D23“.
$4:
$000
$00H
m_..:._:.zwe
=:_m
Eu)H
1,5Ha
$mm
§_s_=E_m
_mu_._eum_I
xmaz_
Ev_<_2
393
._<mO._0
.__2
__2m0
:§.E
$32
$2.3
¢m>
V_._mE:u:umwe
$0mH
¢m>
3.3.3.
m_2ouz_
aux:
u__2<z>a.
322to
az_.:
E4.
$00.0
$00H
m_m.3_5zwe
5%
Em)H
minHm
$mm
.3
m_::.__m
efi_I
xmn_z_
n_<oES
4:2
$0m
«<3
ans.
$0m
$3.2
$2.8
$mn.Hw
mm)
V_;E._u5mwe
$0mH
:5m>
23.
S
nzflm
SuzS<m.
32:“."6
D23“.
E1:
xmn_z_
n_Eom>mn_
Ex<z\<Em
._<mo._o
azm._m
Suz<._<m.
322to
Q23;
E4.
.
>
.
.
.
$000
$00H
m_£=__szwu
.55
._mu>H
m3Ha
$mm
.:__s_=E_m_3_._u:_:
mm.E
$m+
xmaz_
_2Oum
$0H
+xmaz_a<O¢m
3_2m.__2$mv+
a._¢O>>
u<_um_2
$0v
:Ran
$nH3..
$mmmu
¢m>
V_._mE:u:umwe
$0mH
¢m>u>_un_u¢
$00.0
$00H
m_m.:._:.zwe
=:_m
Eu)H
:3Ha
xmm
.5_.m_=E_m
_mu_._e«m_I
xmaz_
96$
asm.__2
$0m
fiaozam
Ems.
$0m
:3:
$8.3
:32
¢m>
V_aEfi .amwe
:2:
¢m>
u>_«m_u¢
Eoxam
azm._m
amuz<._<m.
322no
az_.:
E...22:;we
u.=£
unE.§.:
..4
1a..5:
3?:
uu..:E4nn:>:
tBn_:n.:.
tBn_:n.:.
tBn_:n.:.
uEt.._>_
_.:a_>_we
2:»
v__>_mJ_mE
._
xa>
_E:.:=_
53:6
«En:
u=:+E_m
muEm><
muEm>m._
a:E.z5o
u.__.._az
3.z=_.._3
5:3.5
.5:E_5
5:3.5
m.:wnnxw_aan_m
KH>n.MHwn.>4\
%>:.:.n:
xn>.€s3