Levy Economics Institute of Bard College Strategic … · Levy Economics Institute of Bard College...
16
Levy Economics Institute of Bard College Strategic Analysis May 2015 Greece CONDITIONS AND STRATEGIES FOR ECONOMIC RECOVERY . , , and Summary The Greek economy has the potential to recover, and in this report we argue that access to alter- native financing sources could provide the impetus and liquidity needed to grow the economy and create jobs. For this to happen, existing government debt must be rolled over and austerity policies put aside, restoring confidence in Greece’s economic future and creating the conditions for sustainable income growth, which will eventually enable the country to repay its debt. Conversely, we show that failure to achieve an agreement with the other members of the Brussels Group implies a further decline in output and income. Introduction Members of Greece’s newly elected government have been at the negotiation table with the European elite since taking office in late January of this year. The process has been slow, and at the time of this writing no agreement has been reached. Both sides have dug in their heels by insisting that some issues are nonnegotiable, including the level of the primary budget surplus (more austerity is needed to achieve it), additional labor market flexibility, and restructuring the public pension system—the “red lines” that the government promised, preelection, it would not cross. The focus now is on crafting creative language in an agreement that satisfies both sides by ending austerity while enabling Greece to achieve the fiscal discipline required to service its pub- lic debt and to make its economy even more competitive. The Levy Institute’s Macro-Modeling Team consists of President . , and Research Scholars , , and . All questions and correspondence should be directed to Professor Papadimitriou at 845-758-7700 or [email protected]. Copyright © 2015 Levy Economics Institute of Bard College. of Bard College Levy Economics Institute
Transcript of Levy Economics Institute of Bard College Strategic … · Levy Economics Institute of Bard College...

Levy Economics Institute of Bard College
Strategic AnalysisMay 2015
Greece
CONDITIONS AND STRATEGIES FORECONOMIC RECOVERY
. , , and
Summary
The Greek economy has the potential to recover, and in this report we argue that access to alter-
native financing sources could provide the impetus and liquidity needed to grow the economy
and create jobs. For this to happen, existing government debt must be rolled over and austerity
policies put aside, restoring confidence in Greece’s economic future and creating the conditions
for sustainable income growth, which will eventually enable the country to repay its debt.
Conversely, we show that failure to achieve an agreement with the other members of the Brussels
Group implies a further decline in output and income.
Introduction
Members of Greece’s newly elected government have been at the negotiation table with the
European elite since taking office in late January of this year. The process has been slow, and at
the time of this writing no agreement has been reached. Both sides have dug in their heels by
insisting that some issues are nonnegotiable, including the level of the primary budget surplus
(more austerity is needed to achieve it), additional labor market flexibility, and restructuring the
public pension system—the “red lines” that the government promised, preelection, it would not
cross. The focus now is on crafting creative language in an agreement that satisfies both sides by
ending austerity while enabling Greece to achieve the fiscal discipline required to service its pub-
lic debt and to make its economy even more competitive.
The Levy Institute’s Macro-Modeling Team consists of President . , and Research Scholars ,
, and . All questions and correspondence should be directed to Professor Papadimitriou at
845-758-7700 or [email protected]. Copyright © 2015 Levy Economics Institute of Bard College.
of Bard College
Levy EconomicsInstitute

Notwithstanding the economic ruin of the past six years,
the dogma of expansionary austerity lives on. Sooner or later,
an agreement will be struck—the longer it takes, of course, the
more difficult to achieve the goals of output growth and pri-
mary fiscal surplus. Greece has practically run out of money,
while its banking system, with a steady deposit outflow and an
increasing number of nonperforming loans, is teetering on
the verge of collapse. How long this negotiation process will
take is anybody’s guess, although June 30 has been assumed to
be the drop-dead date. In the meantime, as we will show, con-
ditions have not improved as yet, and all bets are on increased
tourism activity. The current year, therefore, will most likely
end in either a negative or a very small increase in GDP. Last
year’s small primary surplus might be difficult to repeat this
year, and in all likelihood employment growth is stuck in neu-
tral. In what follows, we first review many aspects of the Greek
economy’s performance using the latest data available, and
then run simulations of various alternative scenarios for the
next three years, including a “pessimistic” scenario should
“the institutions” (the new name for “the troika”) manage to
succeed in getting their way. But let us begin at the beginning.
Estimates of real output for the Greek economy, pub-
lished by the Hellenic Statistical Authority (ElStat), showed
some signs of recovery up to 2014Q3, after six long years of
uninterrupted fall in output, even though the fourth quarter
of 2014 and preliminary estimates for the first quarter of this
2 Strategic Analysis, May 2015
year show a reversal that, if it continues in the second quarter,
will indicate the economy has slipped back into recession
(Figure 1).
Real output, at the end of 2014, was below its 2000 level,
marking a more than 26 percent drop from its peak in 2007,
while an even larger fall—30 percent—in employment has
been recorded. More than one million workers have lost their
jobs relative to the previous peak in 2008, with an increase of
800,000 unemployed—the total now stands above 1.2 mil-
lion—while the active population is shrinking, as workers
leave the country in search of better opportunities abroad.
Can the positive signs of 2014 be sustained, putting the
economy, finally, on the road to recovery? Can the new gov-
ernment expect markets to create jobs at a sufficient pace and
tax revenues to increase? As we will show, unless an appropri-
ate plan to rescue the Greek economy is quickly implemented,
the answer is no.
Real and Nominal Output
While a recession ends when real GDP increases, it is hard to
believe that the Greek economy is indeed recovering, even
after three consecutive quarters of increased output.1 Indeed,
as Figure 2 documents, despite some growth in the tourism
sector, total real output has fallen again, in both the last quar-
ter of 2014 and the first quarter of 2015.
Figure 1 Greece: GDP
Source: ElStat
Bill
ion
s of
Eu
ros
(an
nu
aliz
ed)
Chain-linked Volumes (2010)
At Current Prices
2010 201220092007 2008 2011170
180
190
200
210
220
230
260
240
250
20142013
Figure 2 Greece: Real GDP Growth
Source: ElStat
Perc
ent
Ch
ange
(qu
arte
r-ov
er-q
uar
ter)
-5
-4
-2
0
2
3
-3
-1
1
2010 201220092007 2008 2011 20142013

Levy Economics Institute of Bard College 3
One reason for our disbelief is the prolonged fall in nom-
inal output, which in the last quarter of 2014 was still 0.8 per-
cent below its level in the same quarter of the previous year,
and the fall in the first quarter of 2015 was even larger in com-
parison to the same quarter in 2014. The difference between
the positive growth in real output and the negative growth in
nominal output is due to falling prices, as measured by the
GDP deflator and its determinants.
In Figure 3, we report the details of nominal value added
in the main sectors of the Greek economy. It can be clearly
seen that the only recovering sector is the one related to
tourism:2 from its low of €38.8 billion in 2013, value added
increased to €41.7 billion in 2014Q4. In real terms, value
added in this sector increased by 6 percent in 2014. Other sec-
tors continued to fall, with construction registering the largest
drop in real terms (negative 16 percent!), and manufacturing
down by 2 percent at the end of the year.
Deflation and Competitiveness
The “structural labor reforms” so violently imposed by the
country’s international lenders have been effective in reducing
the cost of labor. The most recent measure—the index of
wages published by ElStat—documents a fall of 22 percent at
the end of 2014 from the peak in 2010. In Figure 4, we report
the OECD (Organisation for Economic Co-operation and
Development) measure of unit labor costs and an index of
labor compensation. The former was down by almost 20 per-
cent at the end of 2014 relative to its peak in 2010, while the
latter was down by 17.8 percent.
These declines are not uniform, and for some sectors
labor compensation has decreased even more. For instance, in
the “Accommodation and food service activities” category,
which includes tourism-related activities, the index of wages in
the third quarter of 2014 was 40 percent below its 2008 level.
The fall in wages can also be assessed in relation to other
eurozone countries. This is shown in Table 1 using OECD
data on average annual wages.3 The data in Table 1 illustrate
that Greece was the country that—starting from the second-
lowest wage level in 2000—had the best performance leading
up to the 2007 crisis, with an increase of 24 percent.
Notwithstanding the positive impact of this on living standards,
even at their peak, wages were only 66 percent of comparable
Figure 3 Greece: Value Added by Main Sectors
Bill
ion
s of
Eu
ros
(an
nu
aliz
ed)
0
10
20
30
40
50
60
Trade; Tourism
Public Administration; Education
Manufacturing
Real Estate Activities
Construction
Source: ElStat
2010 201220092007 2008 2011 201420132006
Figure 4 Greece: Labor Cost Indices (2006=100)
Source: OECD
90
95
100
105
110
115
120
Unit Labor Costs
Labor Compensation
2010 201220092007 2008 2011 201420132006
2000 2007 2013 Euros Percent Euros Percent Euros Percent
France 31,383 91.9 34,004 98.7 35,574 99.0Germany 34,134 100.0 34,465 100.0 35,943 100.0Greece 18,291 53.6 22,760 66.0 18,495 51.5Italy 29,046 85.1 29,505 85.6 28,919 80.5Portugal 15,900 46.6 16,082 46.7 16,517 46.0Spain 26,015 76.2 25,899 75.1 26,770 74.5
Table 1 Selected Eurozone Countries: Average AnnualWages (in 2013 euros, and relative to Germany)
Source: OECD
wages in Germany. These gains were subsequently completely
erased by the crisis, pushing Greece’s economy relative to
Germany’s back to the pre-euro-adoption days.
If high unit labor costs resulting from high wages were
one of the major problems contributing to the noncompeti-
tiveness of the Greek economy, this problem has certainly
been “cured” by austerity. The fallacious theory behind this
approach implies that a country should, in a relatively short
time, restore its competitiveness and enjoy the benefits of
lower production costs, which would significantly improve its
trade performance.
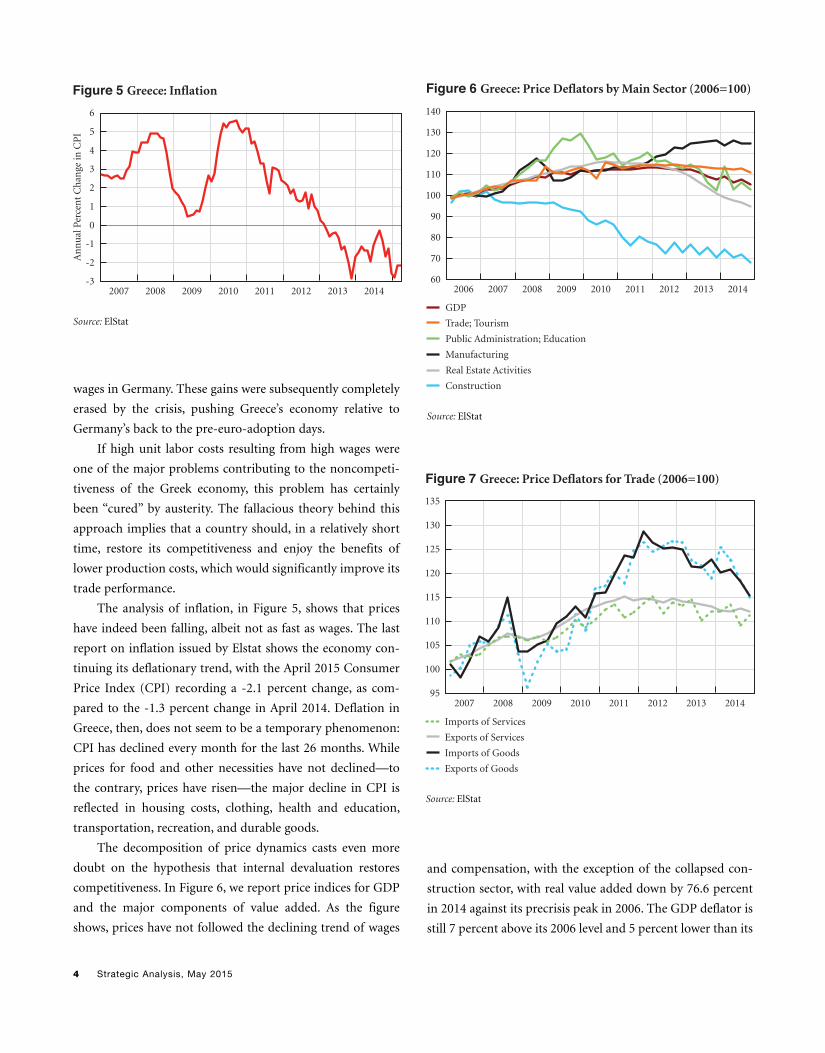
The analysis of inflation, in Figure 5, shows that prices
have indeed been falling, albeit not as fast as wages. The last
report on inflation issued by Elstat shows the economy con-
tinuing its deflationary trend, with the April 2015 Consumer
Price Index (CPI) recording a -2.1 percent change, as com-
pared to the -1.3 percent change in April 2014. Deflation in
Greece, then, does not seem to be a temporary phenomenon:
CPI has declined every month for the last 26 months. While
prices for food and other necessities have not declined—to
the contrary, prices have risen—the major decline in CPI is
reflected in housing costs, clothing, health and education,
transportation, recreation, and durable goods.
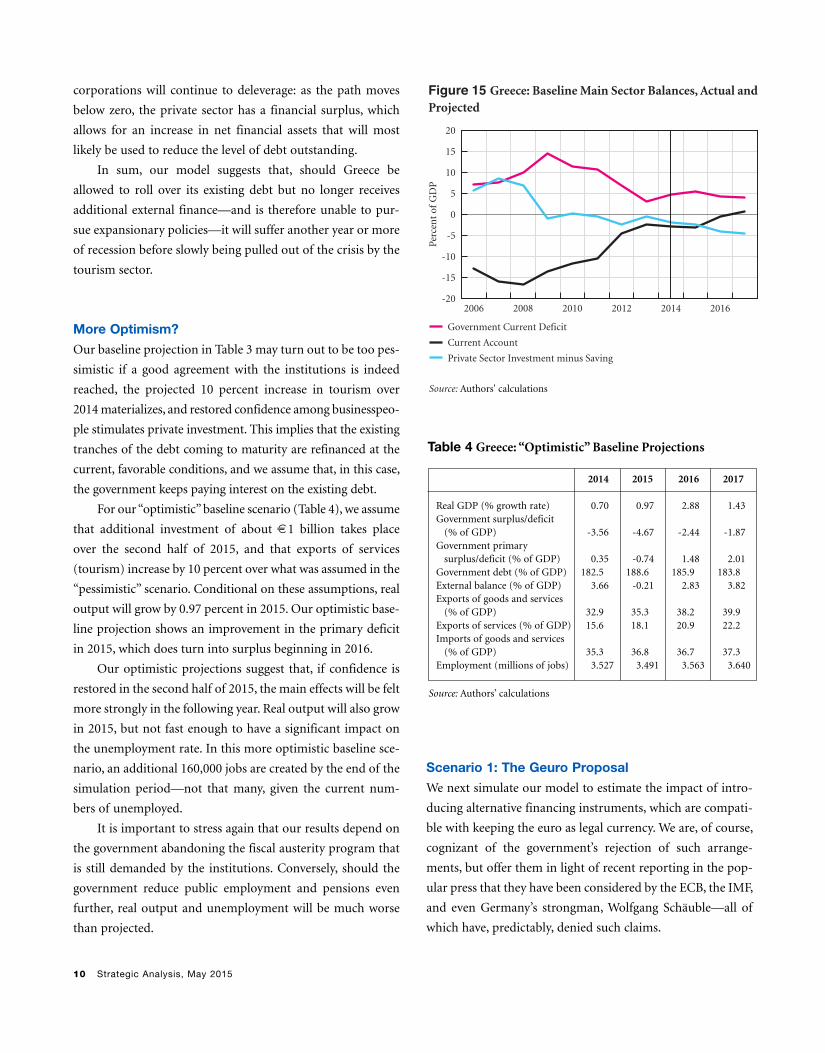
The decomposition of price dynamics casts even more
doubt on the hypothesis that internal devaluation restores
competitiveness. In Figure 6, we report price indices for GDP
and the major components of value added. As the figure
shows, prices have not followed the declining trend of wages
4 Strategic Analysis, May 2015
and compensation, with the exception of the collapsed con-
struction sector, with real value added down by 76.6 percent
in 2014 against its precrisis peak in 2006. The GDP deflator is
still 7 percent above its 2006 level and 5 percent lower than its
Figure 5 Greece: Inflation
Source: ElStat
An
nu
al P
erce
nt
Ch
ange
in C
PI
-3
-2
-1
0
2
4
5
6
2010 201220092007 2008 2011 20142013
3
1
Figure 6 Greece: Price Deflators by Main Sector (2006=100)
60
80
90
100
110
120
130
140
70
Source: ElStat
2010 201220092007 2008 2011 201420132006
GDP
Trade; Tourism
Public Administration; Education
Manufacturing
Real Estate Activities
Construction
95
100
105
110
115
120
125
130
Imports of Services
Exports of Services
Imports of Goods
Exports of Goods
Source: ElStat
2010 201220092007 2008 2011 20142013
Figure 7 Greece: Price Deflators for Trade (2006=100)
135

Levy Economics Institute of Bard College 5
peak at the beginning of 2012, while the deflator for the rela-
tively small manufacturing sector4 has trended upward, mark-
ing a 24 percent increase in 2014 against 2006.
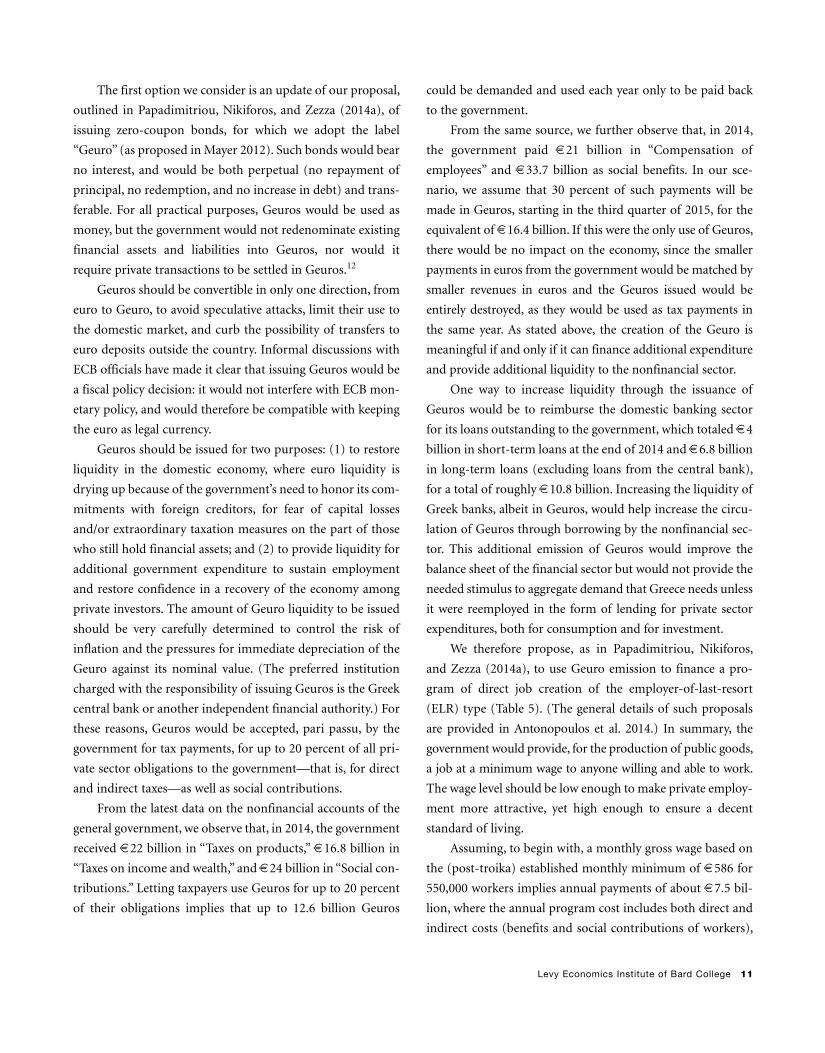
Similarly, in Figure 7 we report the price deflator indices of
the components of trade. Relative to their peak in 2012, the
prices of exported goods have fallen by 9 percent but are still
16.7 percent above their 2007 level.5 The price deflator index
for services peaked in the third quarter of 2011 and has since
fallen by only 2.8 percent, a drop not large enough to support
an increase in exports through increased price competitiveness.
We contrast these price indices with those of selected
eurozone partners in Figures 8 and 9. According to these indi-
cators, price competitiveness for Greece, in the goods markets,
continued to deteriorate until 2012, and the fall in prices has
not been sufficient to bring the index in line with those of
Greece’s partners.
Exports of services—which include tourism—had the
worst price performance until 2012, but that performance has
now somewhat recovered, albeit not to a sufficient extent to
improve exports quickly through price elasticity effects.
One pillar of the troika strategy was to address Greek
external imbalance through “internal devaluation”; that is, a
reduction in wages and unit labor costs that would increase
price competitiveness. Even though this strategy has been very
effective in reducing nominal and real wages (as documented
above in Figure 4 and Table 1), it has thus far failed to generate
a fall in prices that would sufficiently address the country’s
trade imbalance. Domestic prices have been prevented from
falling due to the increases in indirect taxes: the ex-post indi-
rect tax rate has gone up by 2 percentage points since the last
quarter of 2013.
Recent dynamics in exports and imports seem to confirm
what we have documented in our previous reports: income
elasticity is more relevant for trade than price elasticity, and
most of the improvement in the current account balance
stems from the dramatic fall in imports from declining
incomes, while the improvement in exports of goods is mainly
due to changing specialization (increased activities related to
oil products) and/or changing trading partners (increased
trade to noneurozone countries). The increase in tourism is
partly explained by the instability in countries like Egypt,
Turkey, and others in the wider Middle East region that com-
pete directly with Greece for tourism income.
And if improvement in price competitiveness has had an
effect on Greek trade, it has, so far, been minor.
0.96
1.00
1.04
1.08
1.12
1.20
1.24
1.28
Figure 8 Eurozone Countries: Price Deflators for Exports ofGoods (2006=100)
1.16
Source: OECD
2010 201220092007 2008 2011 201420132006
Germany
Spain
France
Greece
Italy
0.96
1.00
1.04
1.08
1.12
1.16
Source: OECD
2010 201220092007 2008 2011 201420132006
Germany
Spain
France
Greece
Italy
1.20
Figure 9 Eurozone Countries: Price Deflators for Exports ofServices (2006=100)

6 Strategic Analysis, May 2015
When wages fall faster than prices, profits should rise. In
Figure 10, we report two measures: the gross operating sur-
plus of nonfinancial corporations, and their net lending rela-
tive to GDP. Greece’s gross operating surplus had recovered to
its precrisis level by the end of 2013 but fell again in 2014,
likely because of increased taxation. The increase in firms’
operating surplus has not translated into higher investment,
which instead continues to fall. Firms may have used retained
profits for deleveraging, as is shown by the strong increase in
net lending in Figure 10.6 Again, if the purpose of internal
devaluation was to increase profitability in order for invest-
ment to recover, the strategy has succeeded only in sustaining
profits in the face of falling output and sales—and only up to
2013—without any consequence for investment, as shown by
the collapse of gross capital formation.
Our final word on the internal devaluation and deflation
is that the biggest contributors to the drop in prices are the
construction and real estate activities sectors (Figure 6), which
caused rental income in 2013 to be down 27 percent com-
pared to 2006.7 Deflation in Greece is, therefore, taking the
form of a free fall in wages, with prices following suit less rap-
idly, generating a substantial drop in real income that has led
to the collapse of domestic demand.
Financial Assets and Liabilities
The second pillar of the troika plan was the reduction in gov-
ernment debt as a share of GDP. This target has not yet been
achieved, and the overall stock of debt, after the haircut, has
returned almost to its precrisis (2009) level in nominal terms
(Figure 11). Since GDP has been falling, the debt-to-GDP
ratio has increased considerably, at market value, from a low
of 106 percent of GDP at the end of 2011 (after the haircut)
to 178.5 percent of GDP at the end of 2014.
Why has gross debt increased during the posthaircut aus-
terity period? The data from the nonfinancial accounts of the
government show cumulative net government borrowing of
€42 billion over the 2012–14 period, the largest part of which
(€33 billion) is made up of capital transfers to the banking sec-
tor. If we take capital transfers out of the equation, the cumula-
tive government deficit over the same period was €21.5 billion,
while interest payments amounted to €22 billion. In other
words, the increase in government debt over this period was due
entirely to payments to the financial sector.
How have the successive Greek governments used the
international loans? The loans obviously helped to finance the
overall deficit, but a reconstruction of how international loans
changed the government’s net asset position, and how much
funds remained in the end to help Greece recover, is of interest.
Using the data available from the flow of funds published
by the Bank of Greece and the sectoral accounts published by
ElStat, we have the following:
Source: ElStat
Perc
ent
of G
DP
2
4
6
8
10
12
14
16
Operating Surplus (right scale)
Gross Capital Formation (left scale)
Net Lending (left scale)
Figure 10 Greece: Profits and Investment in NonfinancialCorporations (Four-quarter Moving Averages)
2010 201220092007 2008 2011 201417.2
17.6
18.0
18.4
18.8
19.2
19.6
20.0
Perc
ent
of G
DP
2013
100
150
200
250
300
350
400
Figure 11 Greece: Government Debt
Source: Bank of Greece
2010 201220092007 2008 2011 2014
Gross Liabilities
Treaties Debt Measure
Net Liabilities
2013
Bill
ion
s of
Eu
ros

Levy Economics Institute of Bard College 7
We start by estimating the funds received, using the table
on “Financial liabilities broken down by holding sector” and
focusing on the line “Long-term loans received from abroad.”
The majority of these funds have been used to reduce the
existing stock of debt held abroad: line 2 in Table 2 is obtained
by the change in government long-term debt securities held
abroad, which has been negative since 2010. A negative
change in liabilities amounts to repurchasing the existing
stock of debt.8 Another significant portion of these funds has
been transferred to the domestic financial sector, either by
purchasing equities (line 3 in Table 2, obtained from the data
on flows of financial assets purchased by the government and
issued by the domestic financial sector) or through capital
transfers (line 4 in Table 2, which reports total capital trans-
fers of the government).
If we add the total government expenditure on interest
payments (line 5), we observe that, overall, the international
loans have not been sufficient to meet these expenses.
It could be argued, then, that had the Greek government
not recapitalized Greek banks, a major banking crisis would
have had even harsher consequences for the citizens of Greece.
On the other hand, these funds have not reached the Greek cit-
izenry in any way. All debtors (households with mortgages;
nonfinancial firms with loans) who have experienced a severe
drop in income (for households) or sales (for firms) are now
unable to meet their financial obligations, thus implying a new
and possibly large fall in the value of the assets of the Greek
financial sector, requiring more government intervention.
Private sector debt is still very large relative to income.
Figure 12 documents the amount of long-term loans9 out-
standing for both households and nonfinancial corporations.
It is feared that up to 50 percent of this debt—which totals
€176 billion—may not be repaid, generating another collapse
in the asset side of the balance sheet of the already shaky
Greek financial sector.
In our report last summer (Papadimitriou, Nikiforos,
and Zezza 2014b), we pointed out that the nonperforming
loans (NPLs) of the Greek banks are one of the biggest prob-
lems facing the Greek economy and a major symptom of the
debt-deflation trap the economy finds itself in today. Data
from the Bank of Greece and the European Central Bank
(ECB) showed a staggering increase in NPLs during the crisis
until the end of 2013—the latest period for which data were
then available. One year later, new data show that this trend of
increasing NPLs has continued.
Data from the ECB on the gross total doubtful and non-
performing loans as a percentage of total debt instruments,
2010 2011 2012 2013 2014 Total
Sources of funds1 Long-term loans from abroad 24.3 30.0 110.0 30.8 5.6 200.8Uses of funds2 Purchases of securities held abroad 19.9 24.4 44.3 8.0 7.8 104.53 Purchases of financial sector equities 0.2 0.9 0.0 19.0 0.0 20.24 Capital transfers 3.7 3.8 8.6 23.4 1.9 41.45 Interest payments 13.2 15.1 9.7 7.3 7.0 52.3 6 Residual = 1 – (2+3+4+5) -12.7 -14.2 47.3 -26.9 -11.1 -17.7
Table 2 Greece: International Loans and Government Payments (billions of euros)
Sources: ElStat; Bank of Greece
50
70
80
90
100
110
120
Figure 12 Greece: Long-Term Loans Outstanding
Source: Bank of Greece
2010 201220092007 2008 2011 2014
Households
Nonfinancial Corporations
2013
Bill
ion
s of
Eu
ros
60

8 Strategic Analysis, May 2015
loans, and advances are shown in Figure 13,10 which indicates
that NPLs increased from 3 percent in 2008 to 27 percent in
the first half of 2014. In absolute terms, this means gross total
doubtful and nonperforming loans increased from €9.7 bil-
lion in 2008 to €78 billion in the second half of 2014.
Figure 13 also includes data from the International
Monetary Fund’s (IMF) Global Financial Stability Reports that
cover the period 2007–14. The picture that emerges is similar to
that of the ECB estimate: NPLs as a percentage of total loans
continued to increase during 2014, albeit at a slower pace.
Meanwhile, fear of potential bank losses has generated a
dramatic fall in household deposits in Greek banks, which—
although still high at €118 billion in March 2015—dropped
by more than €16 billion in the first three months of 2015
(Figure 14).
Will Greece Recover?
Projections of the possible paths an economy may take are
always conditional on a number of assumptions that may fail
to hold. The current situation in Greece is even more prob-
lematic for running projections, since the Brussels Group’s
failure to achieve an agreement quickly has put the economy
in a state of fundamental uncertainty.11
Uncertainty is manifested, for instance, in the rapid fall of
household deposits, as illustrated in Figure 14. The fear of
extraordinary measures to obtain liquidity to fulfill payment
obligations and/or fear of redenomination of euro financial
assets into a new national currency led to households with-
drawing in excess of €16 billion—more than 12 percent—
from their bank deposits in the first three months of 2015.
Unconfirmed reports show that deposit withdrawals had
reached €30 billion by the end of April.
Almost all of Greece’s public debt is held by the IMF, the
ECB, and eurozone partners (through the European Stability
Mechanism), which are unwilling to roll over maturing debt
as it becomes due. The last payments to the IMF in April and
May on maturing debt and interest due forced the govern-
ment to drain liquidity wherever it was available, with rumors
of insufficient liquidity to meet ordinary government
expenses. There are also rumors of lower-than-anticipated tax
revenues since January 2015 contributing to the liquidity
shortage. And, more probable and even more important, the
ECB is warning of a deeper haircut of the government debt
used as collateral for providing liquidity from its Emergency
Liquidity Assistance facility.
If no agreement is reached and “the institutions” insist on
debt repayment, it is inevitable that Greece will default within
Figure 13 Greece: Nonperforming Loans
Sources: ECB; IMF
Perc
ent
0
5
10
15
20
25
30
35
Gross Loans (IMF)
Debt Instruments, Loans, and Advances (ECB)
2010 201220092007 2008 2011 20142013
Source: Bank of Greece
Bill
ion
s of
Eu
ros
110
120
130
140
150
160
190
200
Nonfinancial Corporations (right scale)
Households (left scale)
Figure 14 Greece: Nonfinancial Sector Deposits Outstanding
2010 201220092007 2008 2011 201420135
10
15
20
25
30
35
40
Bill
ion
s of
Eu
ros170
180
45
50

10 Strategic Analysis, May 2015
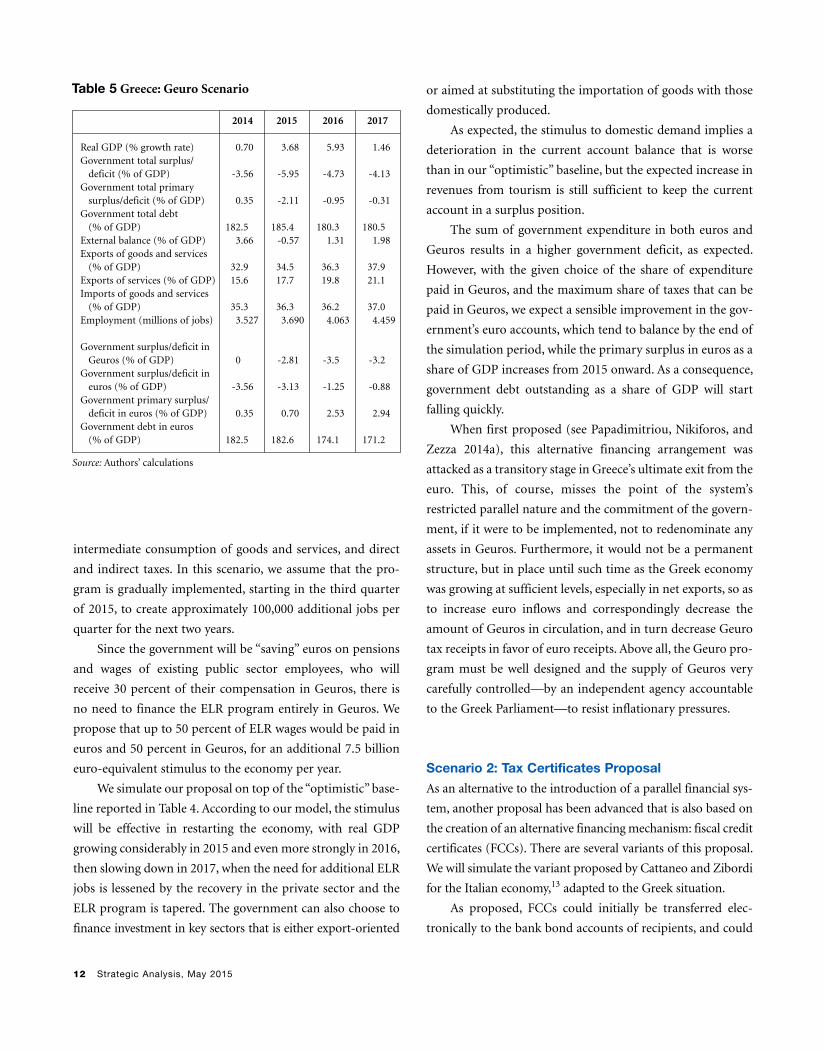
corporations will continue to deleverage: as the path moves
below zero, the private sector has a financial surplus, which
allows for an increase in net financial assets that will most
likely be used to reduce the level of debt outstanding.
In sum, our model suggests that, should Greece be
allowed to roll over its existing debt but no longer receives
additional external finance—and is therefore unable to pur-
sue expansionary policies—it will suffer another year or more
of recession before slowly being pulled out of the crisis by the
tourism sector.
More Optimism?
Our baseline projection in Table 3 may turn out to be too pes-
simistic if a good agreement with the institutions is indeed
reached, the projected 10 percent increase in tourism over
2014 materializes, and restored confidence among businesspeo-
ple stimulates private investment. This implies that the existing
tranches of the debt coming to maturity are refinanced at the
current, favorable conditions, and we assume that, in this case,
the government keeps paying interest on the existing debt.
For our “optimistic” baseline scenario (Table 4), we assume
that additional investment of about €1 billion takes place
over the second half of 2015, and that exports of services
(tourism) increase by 10 percent over what was assumed in the
“pessimistic” scenario. Conditional on these assumptions, real
output will grow by 0.97 percent in 2015. Our optimistic base-
line projection shows an improvement in the primary deficit
in 2015, which does turn into surplus beginning in 2016.
Our optimistic projections suggest that, if confidence is
restored in the second half of 2015, the main effects will be felt
more strongly in the following year. Real output will also grow
in 2015, but not fast enough to have a significant impact on
the unemployment rate. In this more optimistic baseline sce-
nario, an additional 160,000 jobs are created by the end of the
simulation period—not that many, given the current num-
bers of unemployed.
It is important to stress again that our results depend on
the government abandoning the fiscal austerity program that
is still demanded by the institutions. Conversely, should the
government reduce public employment and pensions even
further, real output and unemployment will be much worse
than projected.
Scenario 1: The Geuro Proposal
We next simulate our model to estimate the impact of intro-
ducing alternative financing instruments, which are compati-
ble with keeping the euro as legal currency. We are, of course,
cognizant of the government’s rejection of such arrange-
ments, but offer them in light of recent reporting in the pop-
ular press that they have been considered by the ECB, the IMF,
and even Germany’s strongman, Wolfgang Schäuble—all of
which have, predictably, denied such claims.
Figure 15 Greece: Baseline Main Sector Balances, Actual andProjected
Source: Authors' calculations
Perc
ent
of G
DP
-20
-10
-5
0
5
10
15
20
Government Current Deficit
Current Account
Private Sector Investment minus Saving
2010 2012 20162008 20142006
-15
2014 2015 2016 2017
Real GDP (% growth rate) 0.70 0.97 2.88 1.43Government surplus/deficit(% of GDP) -3.56 -4.67 -2.44 -1.87
Government primary surplus/deficit (% of GDP) 0.35 -0.74 1.48 2.01
Government debt (% of GDP) 182.5 188.6 185.9 183.8External balance (% of GDP) 3.66 -0.21 2.83 3.82Exports of goods and services(% of GDP) 32.9 35.3 38.2 39.9
Exports of services (% of GDP) 15.6 18.1 20.9 22.2Imports of goods and services(% of GDP) 35.3 36.8 36.7 37.3
Employment (millions of jobs) 3.527 3.491 3.563 3.640
Table 4 Greece: “Optimistic” Baseline Projections
Source: Authors’ calculations
Levy Economics Institute of Bard College 11
The first option we consider is an update of our proposal,
outlined in Papadimitriou, Nikiforos, and Zezza (2014a), of
issuing zero-coupon bonds, for which we adopt the label
“Geuro” (as proposed in Mayer 2012). Such bonds would bear
no interest, and would be both perpetual (no repayment of
principal, no redemption, and no increase in debt) and trans-
ferable. For all practical purposes, Geuros would be used as
money, but the government would not redenominate existing
financial assets and liabilities into Geuros, nor would it
require private transactions to be settled in Geuros.12
Geuros should be convertible in only one direction, from
euro to Geuro, to avoid speculative attacks, limit their use to
the domestic market, and curb the possibility of transfers to
euro deposits outside the country. Informal discussions with
ECB officials have made it clear that issuing Geuros would be
a fiscal policy decision: it would not interfere with ECB mon-
etary policy, and would therefore be compatible with keeping
the euro as legal currency.
Geuros should be issued for two purposes: (1) to restore
liquidity in the domestic economy, where euro liquidity is
drying up because of the government’s need to honor its com-
mitments with foreign creditors, for fear of capital losses
and/or extraordinary taxation measures on the part of those
who still hold financial assets; and (2) to provide liquidity for
additional government expenditure to sustain employment
and restore confidence in a recovery of the economy among
private investors. The amount of Geuro liquidity to be issued
should be very carefully determined to control the risk of
inflation and the pressures for immediate depreciation of the
Geuro against its nominal value. (The preferred institution
charged with the responsibility of issuing Geuros is the Greek
central bank or another independent financial authority.) For
these reasons, Geuros would be accepted, pari passu, by the
government for tax payments, for up to 20 percent of all pri-
vate sector obligations to the government—that is, for direct
and indirect taxes—as well as social contributions.
From the latest data on the nonfinancial accounts of the
general government, we observe that, in 2014, the government
received €22 billion in “Taxes on products,” €16.8 billion in
“Taxes on income and wealth,” and €24 billion in “Social con-
tributions.” Letting taxpayers use Geuros for up to 20 percent
of their obligations implies that up to 12.6 billion Geuros
could be demanded and used each year only to be paid back
to the government.
From the same source, we further observe that, in 2014,
the government paid €21 billion in “Compensation of
employees” and €33.7 billion as social benefits. In our sce-
nario, we assume that 30 percent of such payments will be
made in Geuros, starting in the third quarter of 2015, for the
equivalent of €16.4 billion. If this were the only use of Geuros,
there would be no impact on the economy, since the smaller
payments in euros from the government would be matched by
smaller revenues in euros and the Geuros issued would be
entirely destroyed, as they would be used as tax payments in
the same year. As stated above, the creation of the Geuro is
meaningful if and only if it can finance additional expenditure
and provide additional liquidity to the nonfinancial sector.
One way to increase liquidity through the issuance of
Geuros would be to reimburse the domestic banking sector
for its loans outstanding to the government, which totaled €4
billion in short-term loans at the end of 2014 and €6.8 billion
in long-term loans (excluding loans from the central bank),
for a total of roughly €10.8 billion. Increasing the liquidity of
Greek banks, albeit in Geuros, would help increase the circu-
lation of Geuros through borrowing by the nonfinancial sec-
tor. This additional emission of Geuros would improve the
balance sheet of the financial sector but would not provide the
needed stimulus to aggregate demand that Greece needs unless
it were reemployed in the form of lending for private sector
expenditures, both for consumption and for investment.
We therefore propose, as in Papadimitriou, Nikiforos,
and Zezza (2014a), to use Geuro emission to finance a pro-
gram of direct job creation of the employer-of-last-resort
(ELR) type (Table 5). (The general details of such proposals
are provided in Antonopoulos et al. 2014.) In summary, the
government would provide, for the production of public goods,
a job at a minimum wage to anyone willing and able to work.
The wage level should be low enough to make private employ-
ment more attractive, yet high enough to ensure a decent
standard of living.
Assuming, to begin with, a monthly gross wage based on
the (post-troika) established monthly minimum of €586 for
550,000 workers implies annual payments of about €7.5 bil-
lion, where the annual program cost includes both direct and
indirect costs (benefits and social contributions of workers),
12 Strategic Analysis, May 2015
intermediate consumption of goods and services, and direct
and indirect taxes. In this scenario, we assume that the pro-
gram is gradually implemented, starting in the third quarter
of 2015, to create approximately 100,000 additional jobs per
quarter for the next two years.
Since the government will be “saving” euros on pensions
and wages of existing public sector employees, who will
receive 30 percent of their compensation in Geuros, there is
no need to finance the ELR program entirely in Geuros. We
propose that up to 50 percent of ELR wages would be paid in
euros and 50 percent in Geuros, for an additional 7.5 billion
euro-equivalent stimulus to the economy per year.
We simulate our proposal on top of the “optimistic” base-
line reported in Table 4. According to our model, the stimulus
will be effective in restarting the economy, with real GDP
growing considerably in 2015 and even more strongly in 2016,
then slowing down in 2017, when the need for additional ELR
jobs is lessened by the recovery in the private sector and the
ELR program is tapered. The government can also choose to
finance investment in key sectors that is either export-oriented
or aimed at substituting the importation of goods with those
domestically produced.
As expected, the stimulus to domestic demand implies a
deterioration in the current account balance that is worse
than in our “optimistic” baseline, but the expected increase in
revenues from tourism is still sufficient to keep the current
account in a surplus position.
The sum of government expenditure in both euros and
Geuros results in a higher government deficit, as expected.
However, with the given choice of the share of expenditure
paid in Geuros, and the maximum share of taxes that can be
paid in Geuros, we expect a sensible improvement in the gov-
ernment’s euro accounts, which tend to balance by the end of
the simulation period, while the primary surplus in euros as a
share of GDP increases from 2015 onward. As a consequence,
government debt outstanding as a share of GDP will start
falling quickly.
When first proposed (see Papadimitriou, Nikiforos, and
Zezza 2014a), this alternative financing arrangement was
attacked as a transitory stage in Greece’s ultimate exit from the
euro. This, of course, misses the point of the system’s
restricted parallel nature and the commitment of the govern-
ment, if it were to be implemented, not to redenominate any
assets in Geuros. Furthermore, it would not be a permanent
structure, but in place until such time as the Greek economy
was growing at sufficient levels, especially in net exports, so as
to increase euro inflows and correspondingly decrease the
amount of Geuros in circulation, and in turn decrease Geuro
tax receipts in favor of euro receipts. Above all, the Geuro pro-
gram must be well designed and the supply of Geuros very
carefully controlled—by an independent agency accountable
to the Greek Parliament—to resist inflationary pressures.
Scenario 2: Tax Certificates Proposal
As an alternative to the introduction of a parallel financial sys-
tem, another proposal has been advanced that is also based on
the creation of an alternative financing mechanism: fiscal credit
certificates (FCCs). There are several variants of this proposal.
We will simulate the variant proposed by Cattaneo and Zibordi
for the Italian economy,13 adapted to the Greek situation.
As proposed, FCCs could initially be transferred elec-
tronically to the bank bond accounts of recipients, and could
2014 2015 2016 2017
Real GDP (% growth rate) 0.70 3.68 5.93 1.46Government total surplus/deficit (% of GDP) -3.56 -5.95 -4.73 -4.13
Government total primary surplus/deficit (% of GDP) 0.35 -2.11 -0.95 -0.31
Government total debt (% of GDP) 182.5 185.4 180.3 180.5
External balance (% of GDP) 3.66 -0.57 1.31 1.98Exports of goods and services (% of GDP) 32.9 34.5 36.3 37.9
Exports of services (% of GDP) 15.6 17.7 19.8 21.1Imports of goods and services (% of GDP) 35.3 36.3 36.2 37.0
Employment (millions of jobs) 3.527 3.690 4.063 4.459 Government surplus/deficit in Geuros (% of GDP) 0 -2.81 -3.5 -3.2
Government surplus/deficit in euros (% of GDP) -3.56 -3.13 -1.25 -0.88
Government primary surplus/deficit in euros (% of GDP) 0.35 0.70 2.53 2.94
Government debt in euros (% of GDP) 182.5 182.6 174.1 171.2
Table 5 Greece: Geuro Scenario
Source: Authors’ calculations

Levy Economics Institute of Bard College 13
later also be issued in paper form. The certificates could be
used to pay direct, indirect, and property taxes, including
social contributions, after a holding period of 24 months for
their nominal value (say, €100). It could also be established
that, should they be used later than 24 months, the nominal
value would increase by a given interest rate.
It is expected that the recipients of FCCs, which would
need liquidity in euros to increase their expenditure immedi-
ately, would sell FCCs to whoever needed to pay taxes in the
future and had liquidity in euros. FCCs would obviously be sold
at a predetermined discount against their nominal value, where
the discount would tend to zero as they approached maturity.
The main differences between FCCs and the Geuro are:
(1) FCCs would not immediately be used as a parallel cur-
rency, although nothing would prevent private payments in
FCCs, with mutual consent; and (2) Geuros could be used
immediately for tax payments, while FCCs could only be used
to pay taxes at maturity. The reason for delaying the immedi-
ate use of FCCs would be to let the economy grow with the fis-
cal stimulus for some time, generating larger tax revenues in
euros to offset the drop in euro revenues that would arise
when the FCCs came to maturity.
FCCs have been designed with properties that will make
them more palatable to the eurozone institutions, as well as to
citizens who might be unnerved by the introduction of a par-
allel financial system—acting as new currency—for its possi-
ble implications for inflation and/or the devaluation of
existing financial assets.
Since FCCs cannot be used immediately for private sector
payments or tax payments, introducing them as part of the
compensation of existing public sector employees or for pen-
sion payments—as in the Geuro proposal—would amount to
a cut in such sources of income, since the recipients would
need to sell FCCs at a discount in exchange for liquidity in
euros. We therefore assume that FCCs are issued mainly to
increase public expenditure, financing 50 percent of the ELR
program described above, with the remaining 50 percent
funded in euros. This implies FCC emissions of about €1,875
million per quarter, starting in the third quarter of 2015. We
assume the euro-equivalent value of this program to be the
same as in the Geuro scenario, but that FCCs will be sold at a
predetermined discount of, say, 25 percent when the program
starts, 10 percent in 2016, and 5 percent in 2017 as their matu-
rity nears.
Results of model simulations for this proposal are
reported in Table 6. Again, we keep the same assumptions as
in our “optimistic” baseline (Table 4) and add in the FCC
stimulus. We expect FCCs to be issued for the whole of the
simulation period, and, as stated, those issued in 2015 will be
used for tax payments in 2017, thereby reducing euro rev-
enues for the government in that year.
An additional proposal from the Italian proponents of
FCCs is that they are transferred to exporting firms, and as
this would be equivalent to a reduction in tax payments, the
impact on competitiveness should be similar to that of a
decrease in labor costs and should therefore help boost
exports and improve the current account balance. We believe
the proposal to be of interest but preferred not to evaluate it,
as its realistic impact on goods exports is difficult to establish
for the Greek economy, where such exports are small relative
to exports of services.
2014 2015 2016 2017
Real GDP (% growth rate) 0.70 3.00 6.01 1.75Government total surplus/deficit (% of GDP) -3.56 -5.63 -4.53 -4.03
Government total primary surplus/deficit (% of GDP) 0.35 -1.78 -0.74 -0.21
Government total debt, including FCCs (% of GDP) 182.5 186.2 180.7 180.3
External balance (% of GDP) 3.66 -0.48 1.52 2.12Exports of goods and services (% of GDP) 32.9 34.7 36.5 38.0
Exports of services (% of GDP) 15.6 17.8 19.9 21.2Imports of goods and services (% of GDP) 35.3 36.4 36.2 37.0
Employment (millions of jobs) 3.527 3.600 4.023 4.571 Government surplus/deficit in euros (% of GDP) -3.56 -3.55 -0.60 -2.11
Government primary surplus/deficit in euros (% of GDP) 0.35 0.30 3.19 1.70
Government debt in euros (% of GDP) 182.5 184.1 174.8 172.6
Table 6 Greece: Fiscal Credit Certificates Scenario
Source: Authors’ calculations

14 Strategic Analysis, May 2015
Can Greece Use a Parallel Currency to Pay Back
Existing Government Debt?
The major concern of the Greek government in the past weeks
has been how to repay debt as it becomes due, with no access
to further external funding.
In Figure 16, we report the tranches of government debt
coming to maturity in the remaining months of 2015 (€2.153
billion, still in the chart, were repaid to the European
Investment bank and to holders of Greek treasury bills in May).
More than €25 billion in debt will reach maturity in 2015, and
in our estimate of the impact of introducing the Geuro, the
immediate improvement in government accounts denomi-
nated in euros will not be sufficient for this purpose. Moreover,
should the government use additional euro liquidity to extin-
guish foreign debt, with no access to additional external
finance, it is hard to believe that confidence will be restored—
the assumed precondition for our scenarios—and that enough
liquidity will be available for generating an economic recovery.
Should the government be forced to meet its existing
obligations, one possibility would be to introduce an extraor-
dinary tax on deposits, as the Italian government did in 1992,
applying a tax of 0.6 percent on average bank balances. This
tax was reimbursed to deposit holders when the government
liquidity crisis was over.
Using the same percentage, the Greek government would
obtain less than €1 billion—not enough to finance debt
repayment in 2015. Italy’s extraordinary tax was highly
unpopular, and applying a similar policy in Greece with a
higher tax rate may prove politically unsustainable.
The only alternative to the government defaulting on its
forthcoming debt payments lies in refinancing, and—as we
have tried to show—under these conditions the government
would slowly achieve an overall surplus in euros, which could
be used after 2017 to begin repaying its debt. But, more
important, the Greek economy would at last see GDP and
income growing.
Conclusions
In this report we have argued that Greece may be on the road
to recovery, provided some conditions are met. However,
the most important problem, which needs to be addressed
immediately, is the state of fundamental uncertainty about
the near- and medium-term future. This depends on the out-
come of the negotiations between the new SYRIZA govern-
ment, the IMF, and Greece’s eurozone partners. If the
institutional members of the Brussels Group are indeed push-
ing Greece toward defaulting on its debt and keeping to a path
of austerity for fiscal policy and the labor market—as De
Grauwe (2015) argues—then Greece will experience a further
recessionary period, as private investors will remain reluctant
to start new businesses in a country where the prospects for
profitability are low and very volatile. In addition, households
and business are still deleveraging on their existing debt, and
the recent surge in tourism-related activities will not, according
to our model, be sufficient to jump-start a recovery in 2015.
If, on the other hand, the Greek government gains access
to refinancing its existing debt at the existing, very low interest
rates, and uncertainty is at least partially lifted, we argue that
investment will come back, generating sufficient growth in the
second half of 2015 to more than offset the turbulent first
months of the new government. In this case, government debt
as a percentage of GDP will fall from 2016 onward. In this
“optimistic” baseline scenario we assume that the government
will meet all of its financial obligations against its creditors.
Figure 16 Greece: Debt Payments Due in 2015 (millions ofeuros)
Source: Financial Times
December
November
October
September
August
July
June
May
T-Bill Holders
EIB
IMF
ECB
4,000 6,0003,0001,000 2,000 5,000 7,0000

Levy Economics Institute of Bard College 15
However, our simulation shows that, without further policies,
recovery will be slow, in the face of the humanitarian crisis
and the high level of unemployment Greece is currently
enduring.
We have therefore discussed two proposals to fund a pro-
gram of direct job creation; neither proposal requires access to
liquidity in euros, and both are compatible with the EU
treaties and the current rules regulating monetary authorities.
The first proposal, which updates Papadimitriou, Nikiforos,
and Zezza (2014a), focuses on the issuance of a nonconvert-
ible parallel currency—the Geuro—that the government
would accept, pari passu, in fulfillment of tax obligations.
Introducing the Geuro would allow the government to finance
much-needed job creation, and by restoring liquidity should
help stabilize expectation and foster private investment.
Our model simulation shows that such a program would
allow Greece to achieve a higher growth rate more quickly,
and create a substantial number of new jobs—albeit at a mini-
mum wage—while the level of debt relative to GDP would fall
faster. The government deficit denominated in euros would fall
while a deficit in Geuros would arise, but the potential infla-
tionary impact of this additional liquidity would be negligible.
A fiscal impulse may also be provided through the emis-
sion of fiscal credit certificates, non-interest-bearing bonds
that are accepted for tax payment at maturity, which is
assumed to be two years. In this case, FCCs would not be used
as currency, but rather sold at a discount to obtain liquidity.
Our simulation shows that, again, an expansionary fiscal pol-
icy financed through FCC emission would be effective in sus-
taining growth and job creation, while keeping government
accounts in euros in line with the requests of the institutions.
It is important to stress that our model shows that the
expected improvement in revenues from tourism would be
sufficient to finance the increase in imports arising from an
expansion in domestic demand. To strengthen this result,
export-oriented policies would also be necessary, to reduce
the vulnerability of a country dependent mainly on tourism
for balancing its external account.
In this report we have not discussed the possibility of
Greece exiting the euro system as a result of failing to achieve
a reasonable agreement with Brussels. As discussed in our
previous report (Papadimitriou, Nikiforos, and Zezza 2014a),
we broadly agree with Rachman (2015): a Grexit would generate
further short-term costs for the country, possibly for up to 24
months after exit. It would imply that the government had
defaulted on its debt and required new external funding to
finance needed imports until a new, devalued currency
increased export revenues enough to bring the current account
into balance. But, on the other hand, it would restore the abil-
ity of the government to pursue policies aimed at the well-
being of its citizens rather than its international creditors.
Notes
1. Real GDP, measured as chain-linked volumes with refer-
ence year 2010, increased by 0.3, 1.5, and 1.3 percent in
the last three quarters of 2014 (ElStat GDP Table 13.1)
2. The sector includes “Wholesale and retail trade; repair of
motor vehicles and motorcycles; transportation and stor-
age; accommodation and food service activities.” The sea-
sonally adjusted data in Figure 3 are computed from
ElStat GDP Table 10.1.
3. Accessed on April 11, 2015.
4. The sector is defined as “Mining and quarrying; manu-
facturing; electricity, gas, steam and air conditioning sup-
ply; water supply; sewerage, waste management and
remediation activities.”
5. A comparison to 2006 is not possible yet, since ElStat has
reconstructed GDP series only back to 2007.
6. A precise measure of net lending is controversial. The
nonfinancial accounts show net lending—defined as sav-
ing less investment—has increased substantially, from a
low of 4.5 percent of GDP in 2009 to more than 12 per-
cent of GDP at the end of 2014. The financial accounts
published by the Bank of Greece—which measures net
lending as the net change in financial assets—report an
average negative value for the net lending of nonfinancial
corporations. From the flows in financial accounts, it
emerges that nonfinancial corporations managed to
lower their liabilities (other than equities) by about €6
billion between the end of 2011 and the third quarter of
2014, while the market value of their nonequity liabilities
dropped from a high of 83 percent of GDP at the end of
2013 to 70 percent of GDP in 2014Q3, but this is mainly
due to movement in the market price of the underlying
financial assets.
16 Strategic Analysis, May 2015
7. Source: ElStat, Annual Non-financial Sector Accounts:
Households, Resources.
8. A negative figure for the change in government liabilities
held abroad also arises if these securities are sold to a dif-
ferent domestic sector; that is, Greek banks.
9. Households carried an additional €15.8 billion in short-
term debt at the end of 2014; nonfinancial firms, an addi-
tional €32.5 billion.
10. The data for 2014 refer to the first half of the year.
11. For a good reconstruction of the current situation, see
Watt (2015).
12. A similar proposal, for electronic Tax Anticipation Notes,
is put forward in Andresen and Parenteau (2015).
13. Cattaneo and Zibordi (2014); in Italian. For details in
English, see Cattaneo (2013). See also Pilkington and
Mosler (2012) for an earlier proposal for tax-backed bonds.
References
Andresen, T., and R. W. Parenteau. 2015. “A Detailed
Program Proposal for Creating a Parallel Currency in
Greece.” Available at rwer.wordpress.com/2015/03/28/
a-detailed-program-proposal-for-creating-a-parallel-
currency-in-greece/.
Antonopoulos, R., S. Adam., K. Kim, T. Masterson, and D. B.
Papadimitriou. 2014. Responding to the Unemployment
Challenge: A Job Guarantee Proposal for Greece. Research
Project Report. Annandale-on-Hudson, N.Y.: Levy
Economics Institute of Bard College. June.
Cattaneo, M. 2013. “Tax Credit Certificates.” Available at
bastaconleurocrisi.blogspot.it/2013/09/tax-credit-
certificates-certificati-di.html.
Cattaneo, M., and G. Zibordi. 2014. La soluzione per l’euro
(The solution for the euro). Milan: Hoepli.
De Grauwe, P. 2015. “Are Creditors Pushing Greece
Deliberately Into Default?” Social Europe, April 28.
Available at www.socialeurope.eu/2015/04/
are-creditors-pushing-greece- deliberately-into-default/.
Mayer, T. 2012. “Der Geuro: Eine Parallelwährung für
Griechenland?” (The Geuro: A parallel currency for
Greece?). Deutsche Bank Research. Briefing on
European Integration, Frankfurt am Main, May 23.
Papadimitriou, D. B., M. Nikiforos, and G. Zezza. 2014a.
Prospects and Policies for the Greek Economy. Strategic
Analysis. Annandale-on-Hudson, N.Y.: Levy Economics
Institute of Bard College. February.
———. 2014b. Will Tourism Save Greece? Strategic Analysis.
Annandale-on-Hudson, N.Y.: Levy Economics Institute
of Bard College. August.
Pilkington, P., and W. Mosler. 2012. Tax-backed Bonds—
A National Solution to the European Debt Crisis. Policy
Note 2012/4. Annandale-on-Hudson, N.Y.: Levy
Economics Institute of Bard College. March.
Rachman, G. 2015. “Grexit May Be the Best End for a Bad
Marriage.” Financial Times, May 4.
Watt, A. 2015. “The Greek Stand-Off: A Proper Sense of
Perspective Is Urgently Needed.” Social Europe, April 16.
Data Sources
Bank of Greece. www.bankofgreece.gr. Last accessed May 2015.
ElStat (Hellenic Statistical Authority). www.statistic.gr. Last
accessed May 2015.
IMF (International Monetary Fund). World Economic
Outlook Database. Last accessed April 2015.
OECD (Organisation for Economic Co-Operation and
Development). stats.oecd.org. Last accessed April 2014.