
Leveraging Signal Infrastructure for Non-Motorized Counts in a Statewide Program: A Pilot Study
38
Leveraging Signal Infrastructure for Non- Motorized Counts in a Statewide Program: A Pilot Study Paper #15-5168 Presenter: Bryan Blanc Graduate Research Assistant Department of Civil and Environmental Engineering Portland State University 94 th Transportation Research Board Annual Meeting January 14 th , 2015 1
-
Upload
trec-at-psu -
Category
Documents
-
view
90 -
download
1
Transcript of Leveraging Signal Infrastructure for Non-Motorized Counts in a Statewide Program: A Pilot Study

Leveraging Signal Infrastructure for Non-Motorized Counts in a Statewide Program: A Pilot Study
Paper #15-5168
Presenter: Bryan BlancGraduate Research AssistantDepartment of Civil and Environmental EngineeringPortland State University
94th Transportation Research Board Annual MeetingJanuary 14th, 2015
1

Leveraging Signal Infrastructure for Non-Motorized Counts in a Statewide Program: A Pilot Study
Paper #15-5168
Research Team: Miguel Figliozzi
Christopher Monsere
Krista Nordback
Pam Johnson
Bryan Blanc
2

Research project goals
Pilot study
Pedestrian results
Bicycle results
Overall Performance of 2070 controllers and inductive loops
Lessons learned and recommendations
Presentation Outline
3

Research Project Goals
• SPR # 754: Design and Implementation of Pedestrian and Bicycle Specific Data Collection Methods in Oregon
Review best practices regarding statewide non-motorized data collection programs and data collection technologies
Provide guidelines regarding location and data collection procedures
Perform a pilot study
Agenda – Findings – Discussion – Next Steps 4

Pilot Study
Evaluate 2070 traffic signal controllers and inductive loops as methods for pedestrian and bicycle counting on a typical ODOT facility
Apply factors to estimate bicycle and pedestrian Average Annual Daily Traffic (AADT)
5

Site Selection Criteria
Adequate volume of pedestrians and bicyclists
On ODOT facilities
2070 signal controller
Pedestrian push-button to request a pedestrian phase (for counting pedestrians)
Bicycle lane inductive loops (for counting bicycles)
Staff support/recommendation
6

Pilot Study Site
OR-99W & Hall Boulevard, Tigard
99W AADT ≈ 41,000
Hall AADT ≈ 16,000
7

Pedestrian Data
8

• PSU Data Collection
Preliminary Site Prep
• Counting Cars Video Recorder
• 3 cameras
• 24 hours
• 8/29 9 AM – 8/30 9 AM, 2013
9

Pedestrian volumes – video counts
0
10
20
30
40
50
60
9:00 AM 12:00 PM 3:00 PM 6:00 PM 9:00 PM 12:00 AM 3:00 AM 6:00 AM
Ped
estr
ian
Vo
lum
e
9AM August 29 - 9AM August 30, 2013
10

Pedestrian volumes – video counts
Peak hours: 12 PM to 6 PM43% of all volume
11
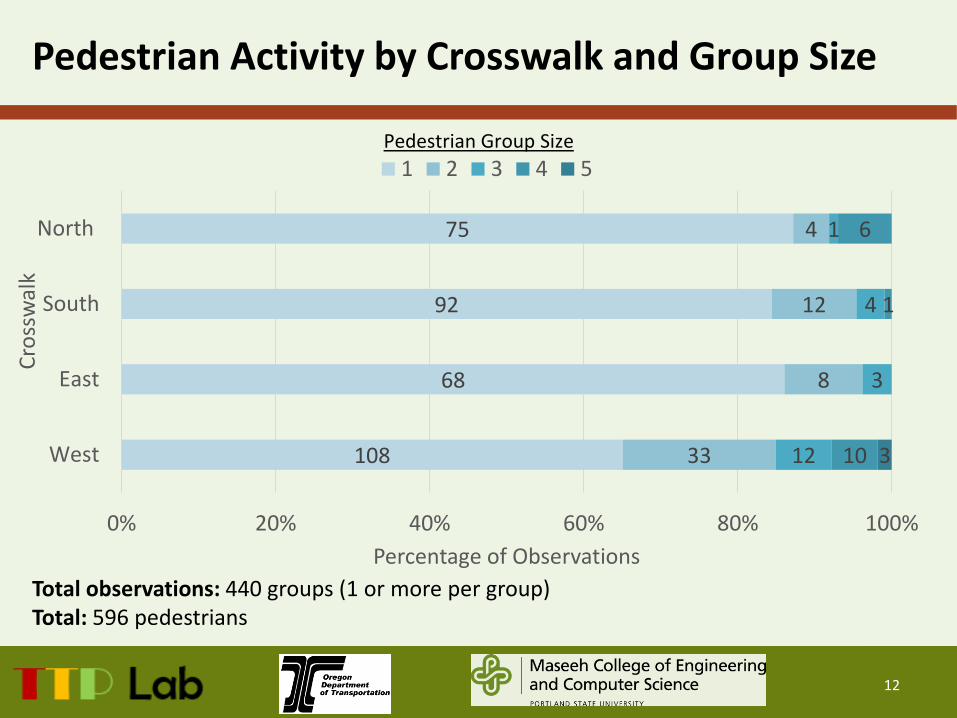
75
92
68
108
4
12
8
33
1
4
3
12
6
1
10 3
0% 20% 40% 60% 80% 100%
North
South
East
West
Percentage of Observations
Cro
ssw
alk
1 2 3 4 5Pedestrian Group Size
Pedestrian Activity by Crosswalk and Group Size
Total observations: 440 groups (1 or more per group)Total: 596 pedestrians
12

R² = 0.75
0
5
10
15
0 5 10 15
VID
EO C
OU
NTS
LOGGED PEDESTRIAN PHASES
R² = 0.70
0
10
20
30
0 10 20 30
VID
EO C
OU
NTS
LOGGED PEDESTRIAN PHASES
R² = 0.87
0
5
10
15
0 5 10 15
VID
EO C
OU
NTS
LOGGED PEDESTRIAN PHASES
Actual vs. Logged Volumes by Crosswalk
R² = 0.74
0
5
10
15
0 5 10 15
VID
EO C
OU
NTS
LOGGED PEDESTRIAN PHASES
North Crosswalk South Crosswalk
West CrosswalkEast Crosswalk
North Crosswalk South Crosswalk
West CrosswalkEast Crosswalk
13

Potential sources of error
Pedestrian groups: phases vs. actual number of pedestrians
Some pedestrians push buttons in both directions
Confusion/error
Pedestrians have a long wait time
14

Potential sources of error
Some pedestrian phases are called by bicyclists (6%)
Bicycles on the sidewalk
Perceived safety
Confusion or lack of understanding
Long wait time
15

Overall Accuracy
482 pedestrian phases vs. 440 groups
91% accuracy (for groups of pedestrians)
482 Pedestrian phases vs. 596 people using the intersection
81% accuracy (for pedestrians)
Factor: 1.24 people per pedestrian phase
Strong correlations (R2>0.70) when broken down by crosswalk and hour
16

Overall Analysis: Pedestrians
Importance of video analysis
Demographic info and bike/pedestrian behavior
Counting pedestrian phases is a promising and
cost-effective method for AADT estimation!
…but it is necessary to increase the number of
sites/analyses before generalizing results
Different sites, land use, traffic impacts, etc.
17

Bicycle Data
18

• PSU Data Collection
Preliminary Site Prep
• Counting Cars Video Recorder
• 3 cameras
• 24 hours
• 8/29 9 AM – 8/30 9 AM, 2013
19

Bicycle Volumes: video data
0
5
10
15
20
25
9:00 AM 12:00 PM 3:00 PM 6:00 PM 9:00 PM 12:00 AM 3:00 AM 6:00 AM
Bic
ycle
Vo
lum
e
August 29, 9AM - August 30 9AM, 2013
20

Bicycle Volumes: 51% in bike line
21
0
5
10
15
20
25
9:00 AM 12:00 PM 3:00 PM 6:00 PM 9:00 PM 12:00 AM 3:00 AM 6:00 AM
Bic
ycle
Vo
lum
e
August 29, 9AM - August 30 9AM, 2013
Sidewalk Bike Volume Bike Lane Volume

Total bicycle volume: 190
Bicycles in bike lane: 97 (51%)
Bicyclists using pedestrian push buttons: 30 (16%)
Video Data Summary
22

Bike Loop Locations
23

Southbound Hall Boulevard to Tigard Library
Pilot Study
≈50 ft.
• Loop at stop bar
• Second loop approximately 50 feet from stop bar
• Loops in series, counted twice in 2070 data
• Note worn bike lane stripe !!!
24

Eastbound- 99W to Portland
Pilot Study
• Right turn pocket
• Single Loop before turn pocket
25

Loop Accuracy: Overcounting
%Error =#𝑙𝑜𝑜𝑝 − #𝑣𝑖𝑑𝑒𝑜
#𝑣𝑖𝑑𝑒𝑜
NB to Beaverton : 1474 %SB to Tigard: 1169 %EB to Portland: 5413 %WB to Sherwood: 2180 %
Eastbound- 99W to Portland
26

• Getting the right inductive loop sensitivity is important to obtain accurate counts
• Sensitivity was subsequently lowered: only switches 2 and 8 set to ON (1 and 4 off)
• We recorded another 24 hour video session from 9 AM 10/24 to 9 AM 10/25
Analysis- Bicycle Loops
27

Loop Accuracy % Error =#𝑙𝑜𝑜𝑝 − #𝑣𝑖𝑑𝑒𝑜
#𝑣𝑖𝑑𝑒𝑜
7 % * 89% *2430 %61 %
Before
NB to Beaverton : 1474 %SB to Tigard: 1169 %EB to Portland: 5413 %WB to Sherwood: 2180 %
After
Accuracy did improve, but there may be a high correlation between vehicle traffic and bicycle detections– especially with high right turning volumes
* Based on 32 and 66 detections (see previous slide, the sum of two loops), the actual number of vehicles or bicycles that were detected at each bicycle loop on Hall is not known
28
Sensitivity Change:

• Optimizing sensitivity is important to obtain accurate counts. Testing is necessary.
• The location of loops in relation to right turn movements is very important (EB to Portland very inaccurate)
• Right turn volume higher for Hall NB approach (less accuracy in counting bikes than Hall SB approach)
• Loops wired in series added difficulties in determining whether a bicycle was detected
Summary: Bicycle Loops
29

Overall Analysis: Bicycles
Importance of video analysis
Demographic/purpose info and bicycle behavior
Overall low accuracy in this study
Test other loop configurations
Analyze other intersections with better loop location
30

Overall Conclusions
Promising results: pedestrian counts utilizing pedestrian phases and simple factors
Not so good: counting bicycles utilizing inductive loops (many problems as explained)
Many more pedestrians than expected!
More research is needed to generalize the results
Another ODOT sponsored project is underway
31
Acknowledgements
• Technical Advisory Committee• Tiffany Slauter, ODOT Region 1 Signal Manager• ODOT TMS
• Don Crownover• Steve Chance, ODOT Traffic Data Analyst• Jacob Carringer (video setup)• Raymond Herrera (tubes installation)
• PSU Graduate Students• Sam Thompson• Adam Moore
• Bruce Moody : video documenting and interviewing
32

Questions?
33
https://pbs.twimg.com/media/BVGwDQLCEAAASMl.jpg

Pilot Study Land Use
34
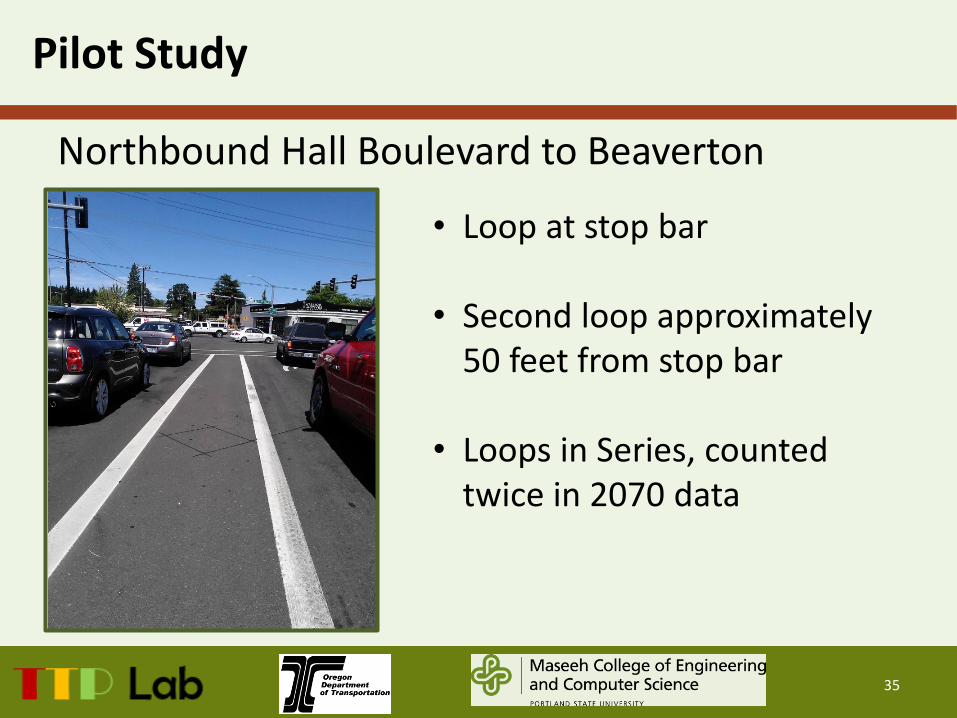
Northbound Hall Boulevard to Beaverton
Pilot Study
• Loop at stop bar
• Second loop approximately 50 feet from stop bar
• Loops in Series, counted twice in 2070 data
35

Westbound - 99W to Sherwood
Pilot Study
• Single Bicycle Loop
36

Loop Accuracy
32*66*
25345
Video Counts
NB to Beaverton : 30SB to Tigard: 35EB to Portland: 10WB to Sherwood: 28
Loop Detections
10 hours with highest volumes: 6 AM to 11 AM and 2 PM to 7 PM
*32 and 66 are the sum of two loops; the actual number of vehicles or bicycles that were detected at each loop on Hall is not known
37

Acknowledgements
Technical Advisory Committee• Lyn Cornell, ODOT Research Coordinator• Sheila Lyons, ODOT Bicycle & Pedestrian Specialist • Sue Geniesse, ODOT TGM Sr Planner • Gary Obery, ODOT Alt Mode Traffic Engineer • Julie Yip, ODOT Safety Div• Steve Lindland, ODOT Roadway Engineer Manager • Bruce Moody, FHWA
38