Leveraging Regulations to Amplify your Impact in Low ...
22
Low Income Designation: Leveraging Regulations to Amplify your Impact in Low Income Markets
Transcript of Leveraging Regulations to Amplify your Impact in Low ...

Low Income Designation: Leveraging Regulations to Amplify your
Impact in Low Income Markets

System Challenges
• Supplemental Capital: significant pressure to comply with net worth minimum requirements and/or limited their ability to generate positive earnings to sustain future growth.
• Member Business Loans: An increasingly larger number of credit unions are engaged in business lending or considering to enter into that space.
• FOM Expansion: CUs' ability to expand is limited now to multiple SEG charters. With over 70 million unbanked or underbanked consumers, this is a hugely under tapped market with tremendous growth potential for the future and relevance of credit unions.
NCUA LID Criteria
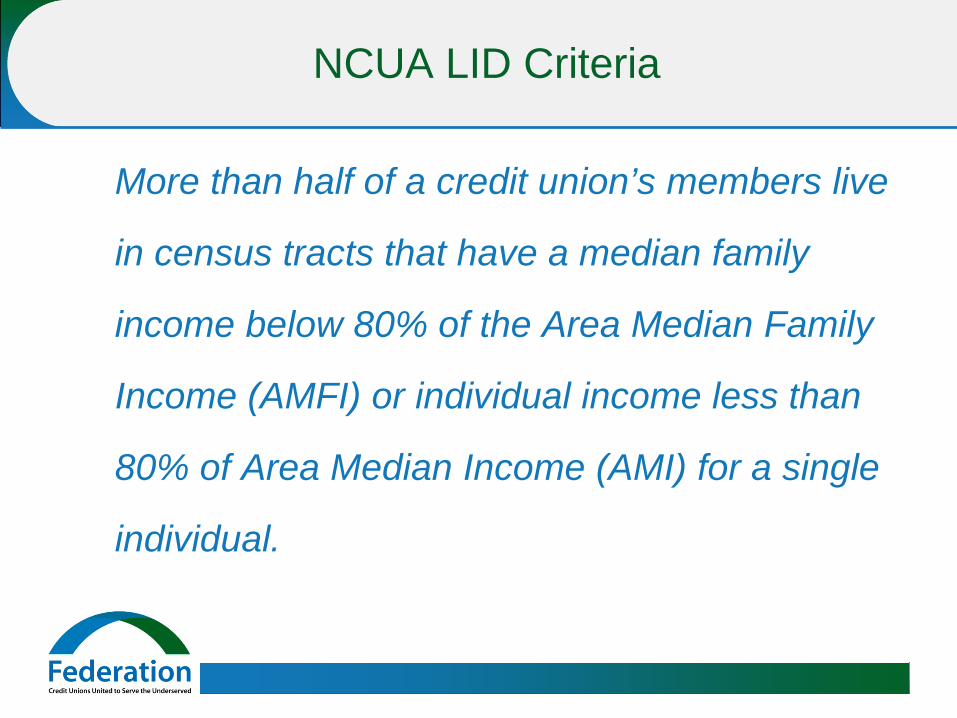
More than half of a credit union’s members live
in census tracts that have a median family
income below 80% of the Area Median Family
Income (AMFI) or individual income less than
80% of Area Median Income (AMI) for a single
individual.

Low-Income Designated CUs
• 2,134 LICUs as of December 31 2014 • $238 billion in combined assets • Serving 26 million consumers • 430 have assets above $100 million. • 53 have assets exceeding $1 billion.
• Currently one third of the CU system is LID! • LID good for 5 years. Critical to measure
benchmark on a yearly basis

0
500
1000
1500
2000
2500
1990 1995 2000 2005 2010
Growth of LID CUs 1990 - 2014
2012: Automated Notification
2011: 1,117 2014: 2,134

Evolving Profile of LICUs
$37,372.1 $42,249.4 $47,365.5
$132,436.99
$177,976.63
$238,174.27
$-
$50,000.00
$100,000.00
$150,000.00
$200,000.00
$250,000.00
$300,000.00
2009 2010 2011 2012 2013 2014
Low-Income Designated Credit Unions: Total Assets (In Millions of $)
2009-2014
Less than $5MM $5MM-$10MM $10MM-$50MM$50MM-$100MM $100MM-$500MM Greater than $500MM
More and larger low-income designated credit unions

Growing market share of LICUs
1,086 14%
1,112 15%
1,120 15%
1,897 27%
1,992 30%
2,134 33%
7,710 7,491 7,240 6,960 6,687 6,402
2009 2010 2011 2012 2013 2014
Low-Income Designated Credit Unions/ All Credit Unions 2009-2014
Low-Income Designated Credit Unions All Credit Unions
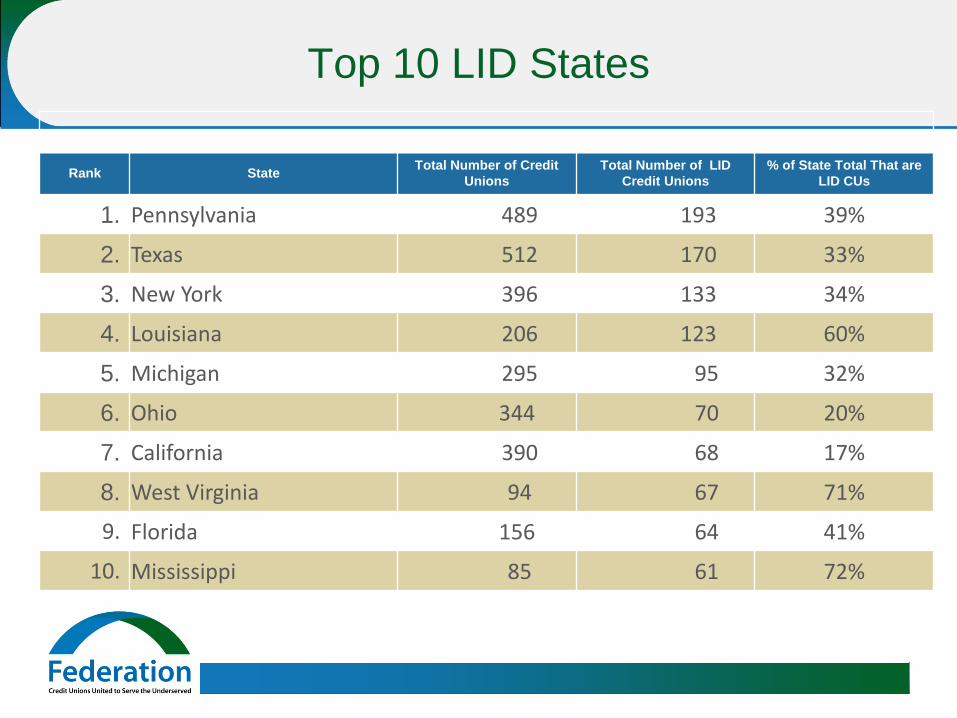
Top 10 LID States
Rank State Total Number of Credit Unions
Total Number of LID Credit Unions
% of State Total That are LID CUs
1. Pennsylvania 489 193 39%
2. Texas 512 170 33%
3. New York 396 133 34%
4. Louisiana 206 123 60%
5. Michigan 295 95 32%
6. Ohio 344 70 20%
7. California 390 68 17%
8. West Virginia 94 67 71%
9. Florida 156 64 41%
10. Mississippi 85 61 72%

Benefits of LID
• Exemption from the cap limiting member business loans to 12.25% of your portfolio
• The power to raise secondary capital loans • The ability to raise insured non-member deposits from
any individual or institution • Access to the NCUA Community Development
Revolving Loan Fund and grant program – Deposits – TA grants
• Access to NCUA Economic Development Specialists

Additional Benefits
• Ability to provide limited transactional services to non-members
• Ability to amend FOM to include associational groups formed for the sole purpose of making CU service available to LI persons (option only for multiple common bond CUs)
• Additional latitude in serving persons who are affiliated with the community. Those who participate in programs to alleviate poverty or distress, or who participate in associations headquartered in the community.
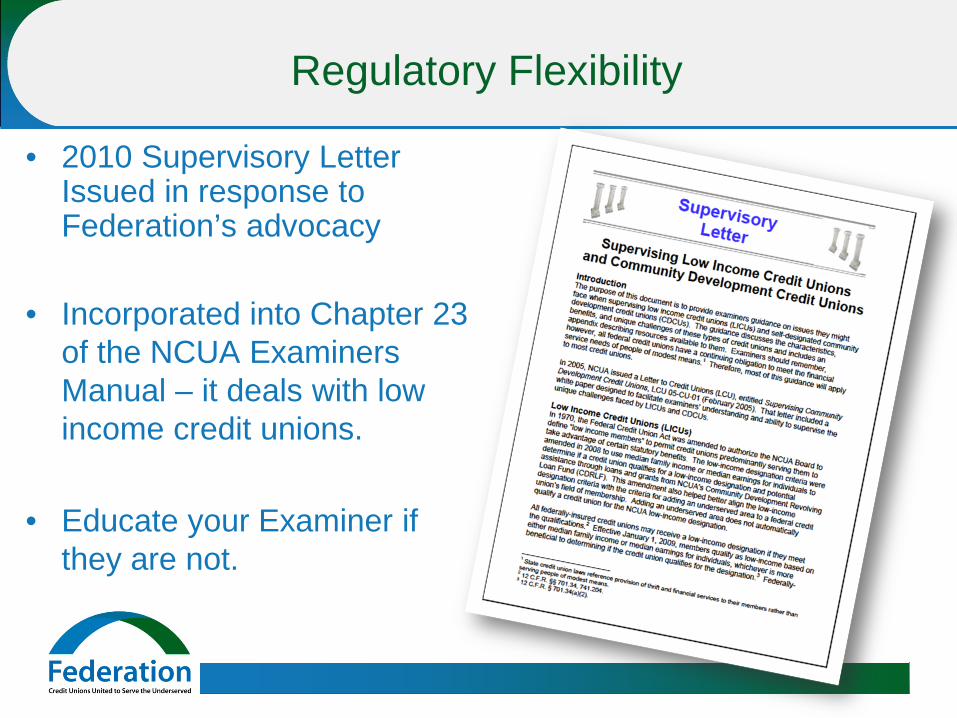
Regulatory Flexibility
• 2010 Supervisory Letter Issued in response to Federation’s advocacy
• Incorporated into Chapter 23
of the NCUA Examiners Manual – it deals with low income credit unions.
• Educate your Examiner if
they are not.

LID CUs: Leading the Way
• LICUs, CDFI CUs, CDCUs v/s Regular CUs – Growing at faster pace than CUs with more
traditional FOMs – Have more flexibility to make up decreased income
from loans and investments with fee income – Have access to non-operating income (CDFI Fund
and other funding sources) and alternative capital sources

Capital Structure of CUs
• CUs must meet basic capitalization requirements. Net worth must ≥ 7% to be considered well-capitalized (without substantial regulatory intervention)
• Net worth is defined as the credit unions equity divided by total assets.
• Historically equity was defined as the sum of a credit union’s total regular + other reserves and retained earnings. Growth occurs incrementally through earnings.

Secondary Capital Loans
• In 1997, through the Federation’s advocacy secondary capital was approved as a tool to grow net worth for low-income designated credit unions.
• Secondary capital is a subordinated loan that counts towards
a credit union’s net worth. These loans must be at least 5 years and typically interest only with a balloon repayment at maturity. However, the portion counted towards equity declines during the final five years of the loan.

Secondary Capital Loans
0%
10%
20%
30%
40%
50%
60%
70%
80%
90%
100%
1 2 3 4 5 6 7% S
ECO
ND
ARY
CAP
ITAL
CO
UN
TED
TO
WAR
DS
NET
W
OR
TH
YEAR OF INVESTMENT
SECONDARY CAPITAL ACCOUNTING
NOTES PAYABLE SECONDARY CAPITAL COUNTED TOWARDS NET WORTH

Impact of Secondary Capital
Preliminary findings:
• Low-income designated credit unions with secondary capital investments outperformed those without secondary capital investments in terms of asset, membership, and loan growth
• Low-income designated credit unions with secondary capital increased their primary capital
• Low-income designated credit unions with secondary capital increased efficiencies and earnings

Impact of Secondary Capital
0.48%
0.38% 0.42%
0.90%
0.67%
0.57%
ALL CUS LIDS LIDS W/SC
RETURN ON AVERAGE ASSETS (AGGREGATED, 2010-2012)
2010 2012
13%
5% 7%
12%
3%
5%
18%
6%
11%
ASSETS MEMBERS LOANS
COMPARATIVE CREDIT UNION GROWTH RATES
(AGGREGATED, 2010-2012)
ALL CUS ALL LIDS LIDS W/SC

Secondary Capital: Historic Perspective
$18 $28 $31
$79
$156
$249 $245 $230 $218
25 46 46 41 74 81 81 78 77
$0
$50
$100
$150
$200
$250
$300
1997 2006 2007 2009 2010 2011 2012 2013 2014
U.S. Credit Union Industry: Outstanding Secondary Capital Loans 1997-2014
(in Millions)
Total Secondary Capital Invested in Credit Unions #CUs with SC

Secondary Capital: A new Chapter
Amortizing Secondary Capital:
• Federation advocacy resulted in 2015 shift in regulatory interpretation of secondary capital rules
• Updates to Processing and Structure of Secondary Capital Loans, providing systematic review of amortizing capital requests
• Shift from balloon repayment to regular repayment of principal will reduce risk to investors and increase circulation of capital to promote community lending
• Federation establishes new secondary capital loan product and broadens investor partnerships, securing initial $10 million investment and $500,000 equity capital from large, national bank

Secondary Capital: A new Chapter
• Federation advocacy resulted in 2015 shift in regulatory interpretation of secondary capital rules
• Updates to Processing and Structure of Secondary Capital Loans, providing systematic review of amortizing capital requests
• Shift from balloon repayment to regular repayment of principal will reduce risk to investors and increase circulation of capital to promote community lending
• Federation establishes new secondary capital loan product and broadens investor partnerships, securing initial $10 million investment and $500,000 equity capital from large, national bank
• Change to prime market product • Focused on high performing and growth credit unions serving majority low-
income communities

Leveraging Building Blocks
• Low Income Designation – Regulatory flexibility to serve LMI markets – Secondary Capital Grants – FOM expansion opportunities – TAG grants
• CDFI Certification – Access to external resources – Partnerships – Impact tracking and reporting
• CDCU – Capital: Access secondary capital, risk sharing deposits and low cost non-
member deposits – Knowledge: Innovative LMI approaches and products; best practices;
knowledge sharing; specialized consulting services (resource development). – Impact: regulatory (NCUA’s LID); external resources (CDFI Fund; US Treasury
Department; SBA); national partnerships.

Pablo DeFilippi Vice President of Membership
[email protected] 212.809.1850 ext 304
For more information
National Federation of Community Development CUs 39 Broadway Suite 2140
New York, NY 10006-3003 www.cdcu.coop