Leveraging Overview for Scalable Genomic Alignment ...
44
Sequence Surveyor Leveraging Overview for Scalable Genomic Alignment Visualization Danielle Albers, Colin Dewey, and Michael Gleicher University of Wisconsin-Madison Department of Computer Sciences IEEE VisWeek 2011
Transcript of Leveraging Overview for Scalable Genomic Alignment ...

Sequence Surveyor
Leveraging Overview for Scalable
Genomic Alignment Visualization
Danielle Albers, Colin Dewey, and Michael Gleicher
University of Wisconsin-Madison
Department of Computer Sciences
IEEE VisWeek 2011


Viewing Genome Alignments
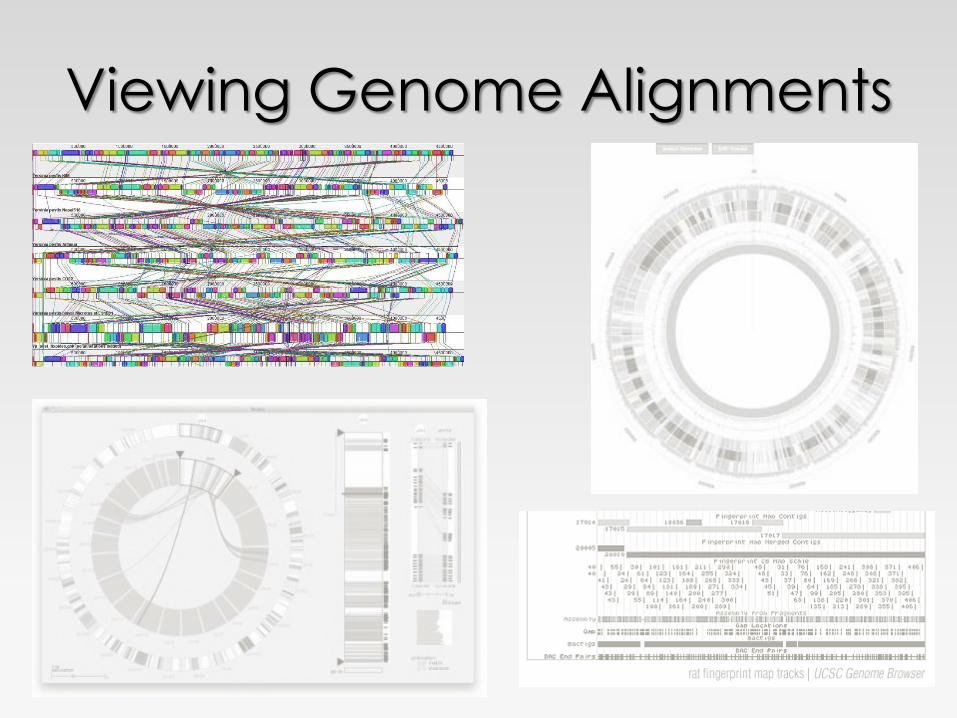
Viewing Genome Alignments


Perception
Aggregation Mapping
Scalable Design
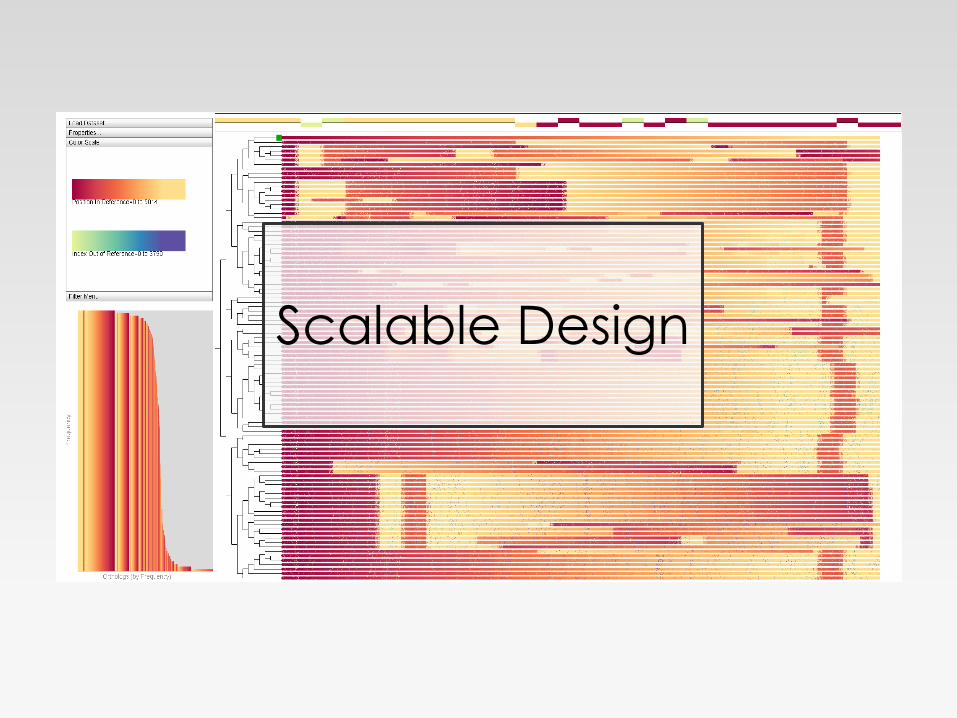
Scalable Design
Outline
The Data Domain
Sequence Surveyor
Design in Theory
- Perception
- Mapping
- Aggregation
Design in Practice

Whole Genome Alignment
Identify related groups of genes
appearing in a set of organisms

Defining Scale Number of Genomes Length of Genomes Types of Inquiry
Outline
The Data Domain
Sequence Surveyor
Design in Theory
- Perception
- Mapping
- Aggregation
Design in Practice

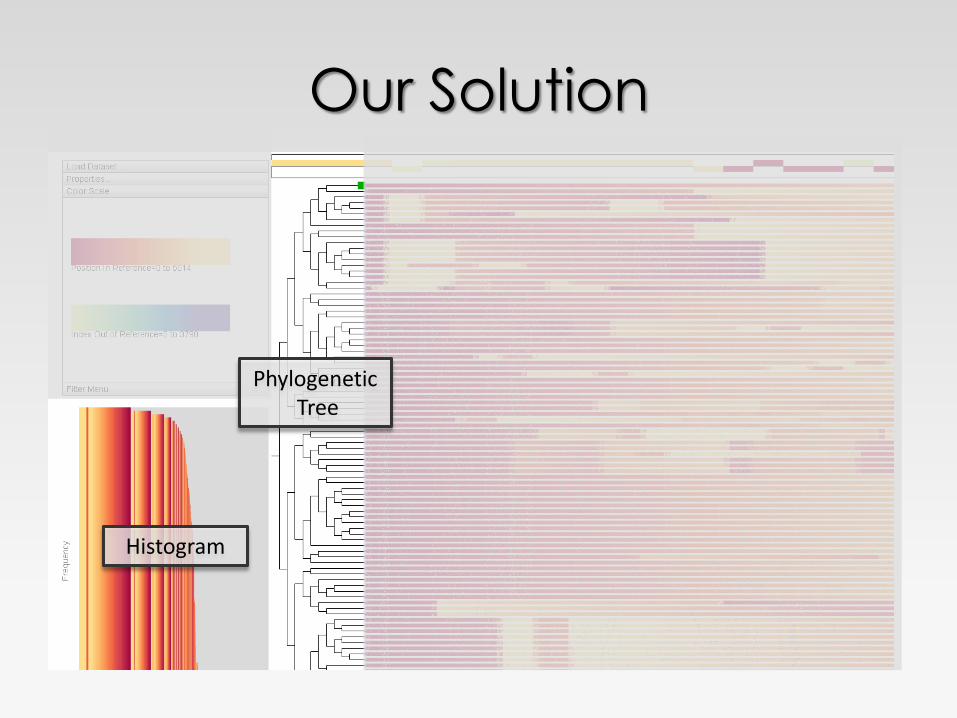
Our Solution
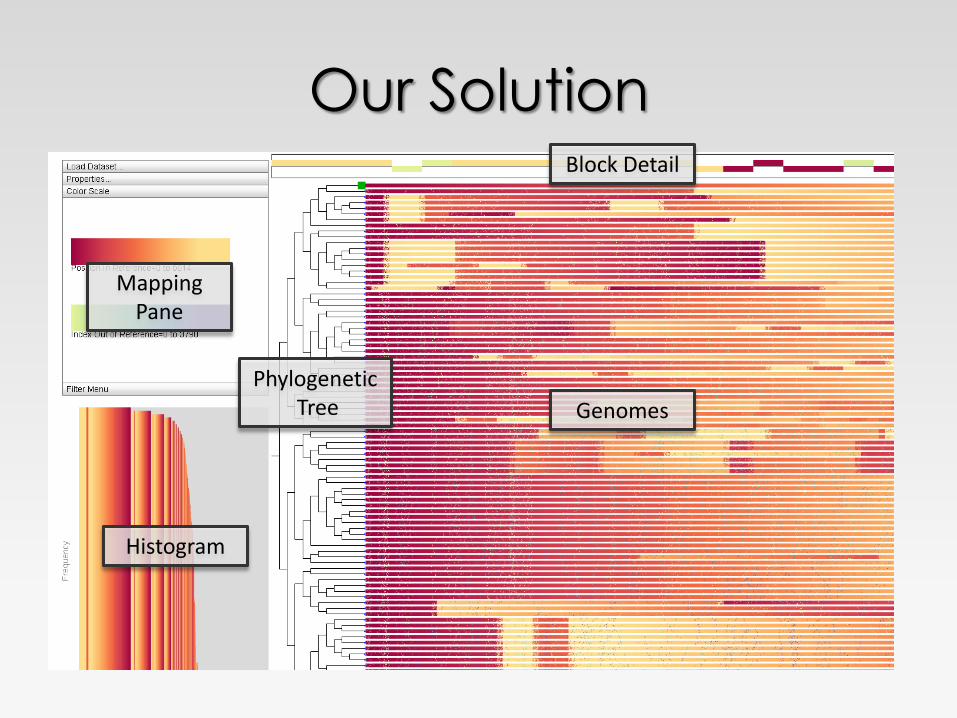
Our Solution
Phylogenetic Tree
Mapping Pane
Block Detail
Genomes
Histogram
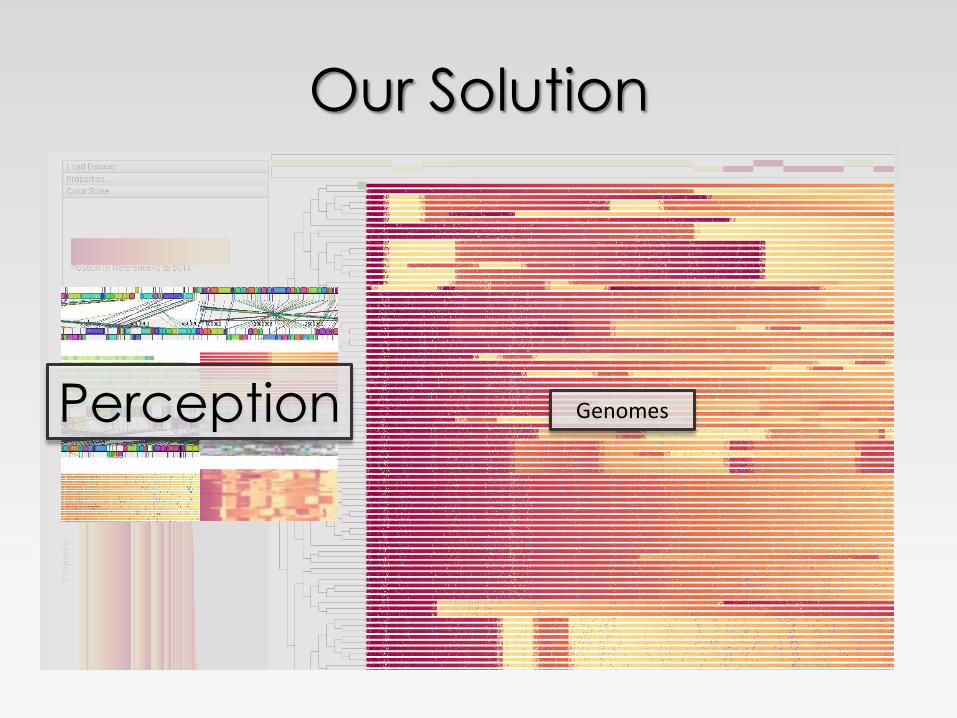
Our Solution
Genomes Perception
Our Solution Block Detail
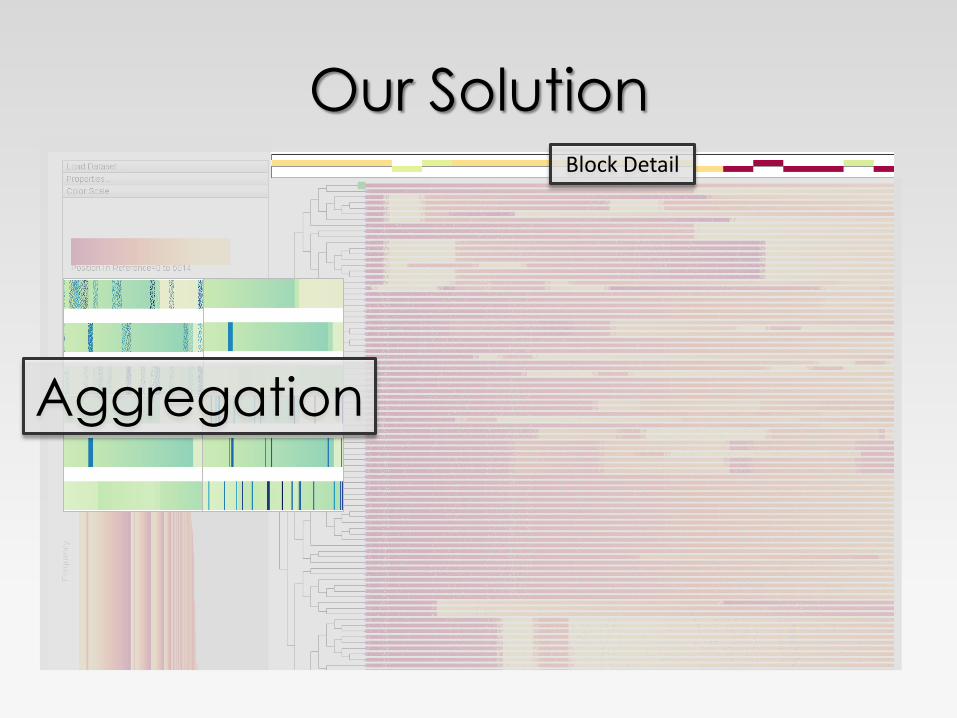
Aggregation
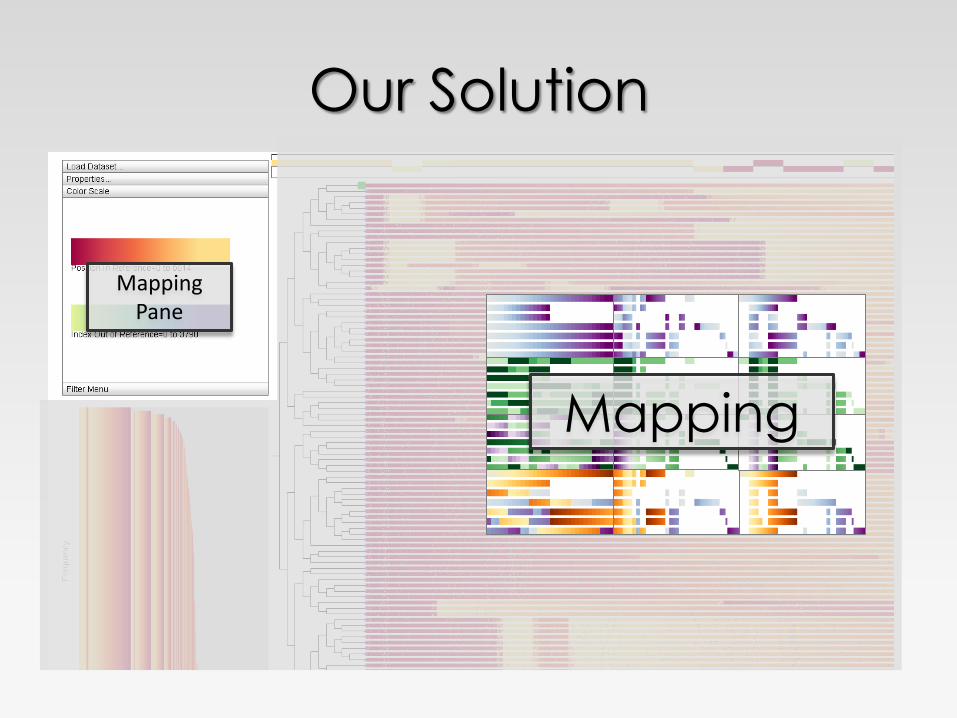
Our Solution
Mapping Pane
Mapping
Our Solution
Histogram
Phylogenetic Tree
Outline
The Data Domain
Sequence Surveyor
Design in Theory
- Perception
- Mapping
- Aggregation
Design in Practice

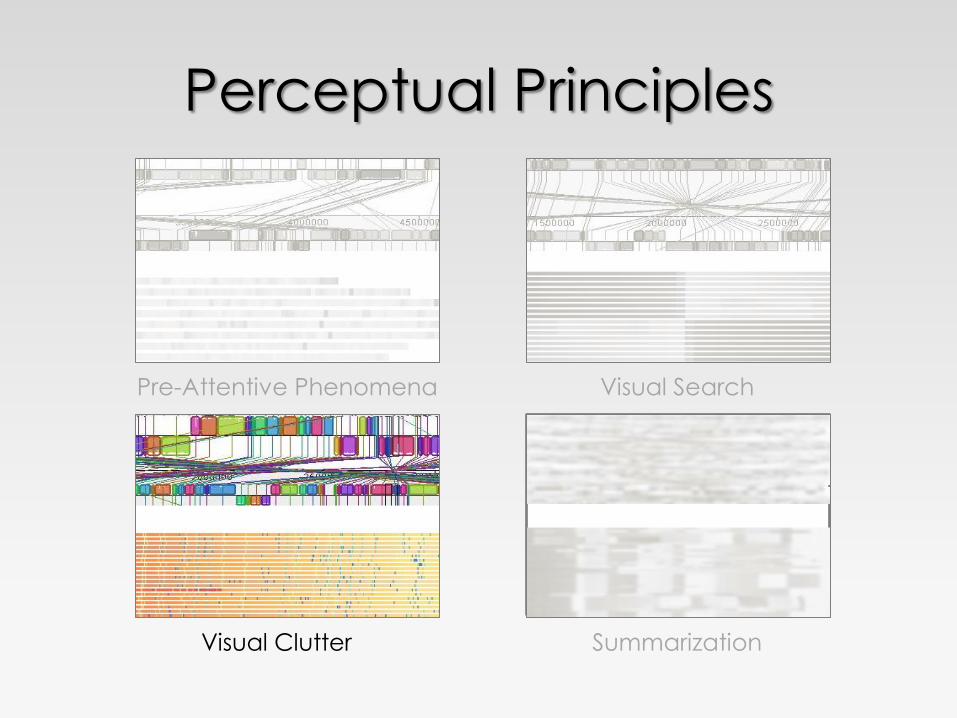
Perception
How the user processes dense data
Inform scalable design
- Limitations of current designs
- Insight into future designs
Four principles

Perceptual Principles
Visual Search
Visual Clutter Summarization
Pre-Attentive Phenomena

Perceptual Principles
Visual Search
Visual Clutter Summarization
Pre-Attentive Phenomena

Perceptual Principles
Visual Search
Visual Clutter Summarization
Pre-Attentive Phenomena
Perceptual Principles
Visual Search
Visual Clutter Summarization
Pre-Attentive Phenomena

Perceptual Principles
Visual Search
Visual Clutter Summarization
Pre-Attentive Phenomena

Perception
Overview - Sacrifice detail for high-level
comparison
Colorfield - Emphasize visual structure
Mappings – Emphasize key details
Aggregation – Do not overwhelm viewers

Mapping Color Mapping Color Schemes Position Mapping
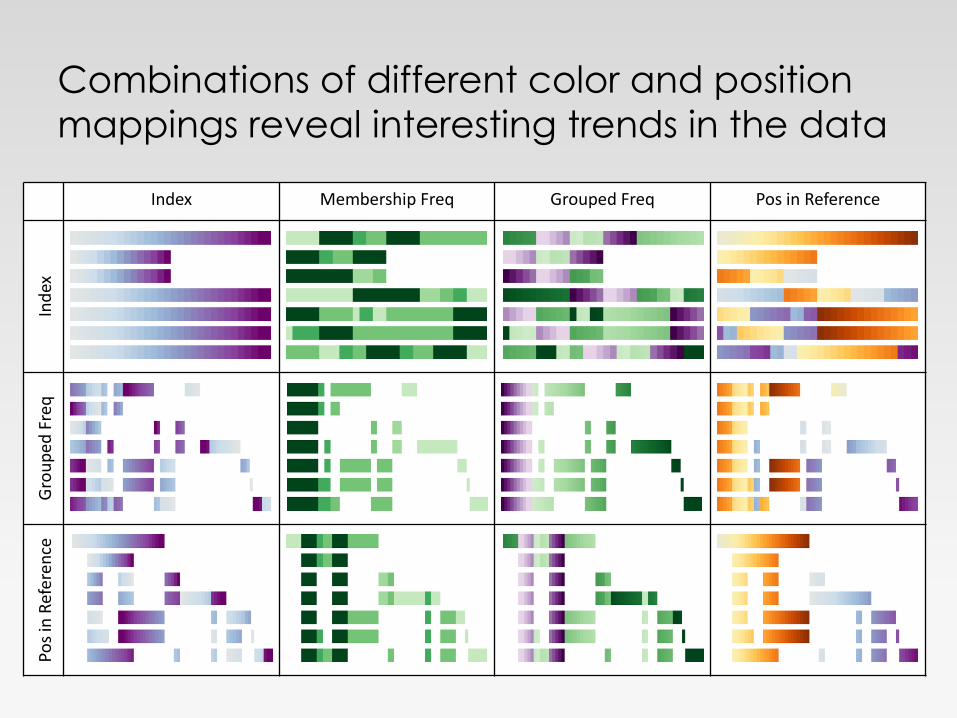
Index Membership Freq Grouped Freq Pos in Reference
Ind
ex
Gro
up
ed F
req
Po
s in
Ref
eren
ce
Combinations of different color and position
mappings reveal interesting trends in the data

Aggregation
Cannot show all the data at once
- Limited screen real estate
- Clutter
Blocking preserves local control
- Display gene neighborhoods as glyphs
Four block encodings

Blocking
Group (relatively) continuous sets of
neighboring genes into a single unit
rof
tilS
yaeQ
phnA
tadG

Aggregate Encodings
Average

Aggregate Encodings
Average Robust Average
Color Weaving Event Striping

Interaction
Block Brushing: Highlight locations of block contents in overview, phylogeny, and histogram on mouse-over
Block Linking: Link locations of block contents in overview on click
Detail Notes: Details of genes in a block and matching genes of the set are presented in a separate window
Non-locality Zoom: Explore the contents of an aggregate block in the Block Detail Window on mouse-over
Zoom Lock: Fix the contents of a block in the zoom window to explore the distributions of specific genes
Zoomed Gene Brushing: Highlight locations of genes in overview, phylogeny, and histogram
Zoomed Gene Linking: Link locations of a set of matching genes in the overview
Manual Rearrangement: Drag-and-drop
rearrangement of sequences and indicate
branch crossings by opacity
Filtering: Highlight genes matching a set of names, id
numbers, frequencies, genomes, or chromosomes
Load Filter: Load a filter set from a CSV
Save Filter: Save the current filter set to a CSV
Histogram Brushing: Highlight the locations of genes in
a region of the frequency distribution in the
overview and phylogenetic tree by mouse-over
Load Tree: Load different trees and arrangements from
a tree file
Save Tree: Save the current tree structure and
sequence arrangement to a tree file

Outline
The Data Domain
Sequence Surveyor
Design in Theory
- Perception
- Mapping
- Aggregation
Design in Practice

Use Cases 100 Bacteria 6,000 genes
50 Bacteria 5,000 genes
35 Fungi 17,000 genes
14 Pathogens 4,000 genes
8 partial E. coli sequences 300 genes

Parallels
Can use Sequence Surveyor to obtain
information presented in existing tools
at scale.
Mauve: Color by position in reference (arrow), order by start position

Anecdotes: Buchnera
Buchnera
family of
genomes and
the ancestral
core
Color by position in reference (arrow), order by set of genomes containing each gene
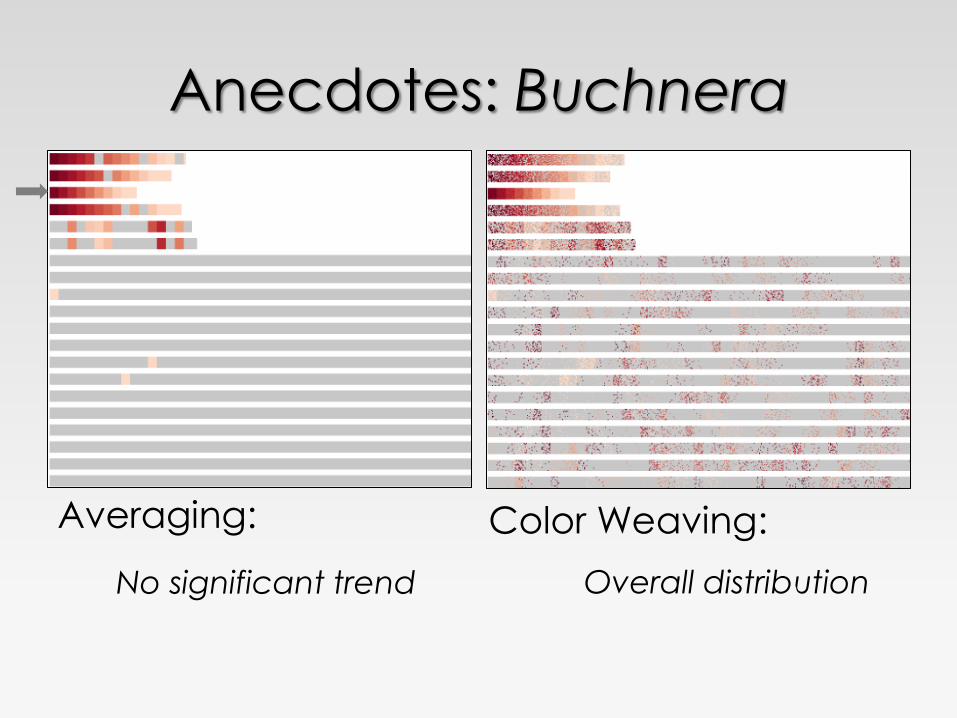
Anecdotes: Buchnera
Averaging:
No significant trend
Color Weaving:
Overall distribution

Anecdotes: E. Coli
Conservation relationships between different families of genomes
Color by position in reference (arrow), order by relative ordering
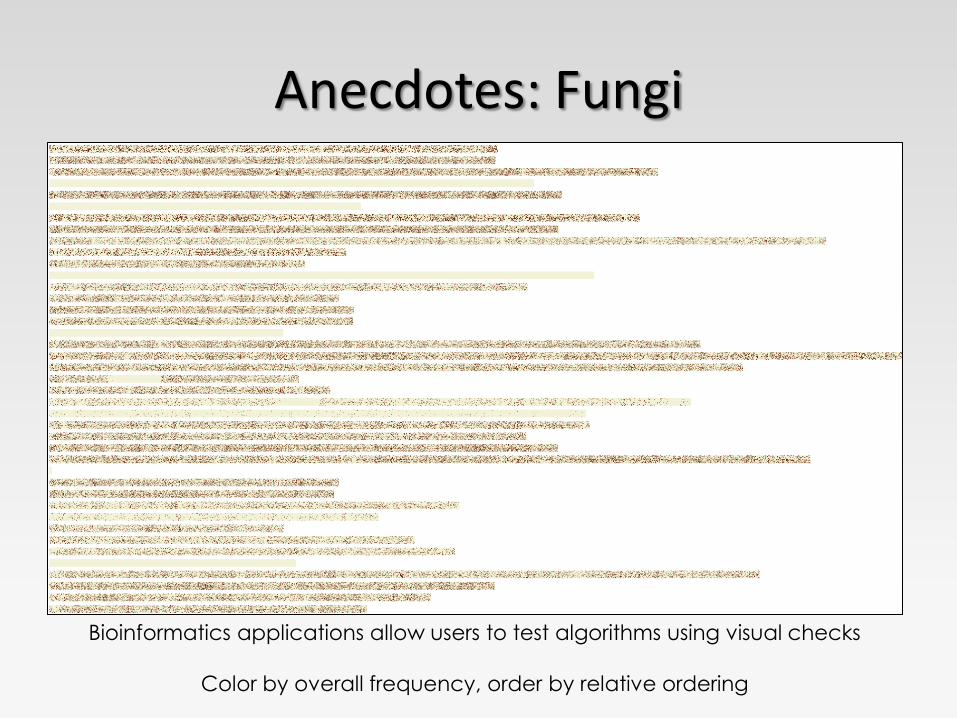
Anecdotes: Fungi
Bioinformatics applications allow users to test algorithms using visual checks
Color by overall frequency, order by relative ordering

Anecdotes: Fungi
Bioinformatics applications allow users to test algorithms using visual checks
Color by position in a reference, order by relative ordering

Extensions
Proteins and
nucleotide MSA
Any data with an
orthology and
ordered sets
Google N-Grams
Top 5,000 most popular words since 1660
Distribution of a word set in 2000 across time

Summary
Scalable whole genome alignment overview
Perception informs design
User-controlled mapping scales across queries
Aggregation filters data
Extends beyond the immediate biology

Acknowledgements University of Wisconsin – Madison
Department of Computer Sciences Graphics & Vision Lab
University of Wisconsin – Madison
BACTER Institute for Computational Biology
University of Wisconsin – Madison
Genome Center Genome Evolution Laboratory Dr. David Baumler
Dr. Eric Neeno-Eckwall
Dr. Jeremy Glasner
Dr. Nicole Perna
Funding by NSF awards IIS-0946598, CMMI-0941013 and DEB-0936214 and
DoE Genomics: GTL and SciDAC Programs (DE-FG02-04ER25627)

Availability Prototype and sample data package (coming soon):
http://graphics.cs.wisc.edu/Vis/SequenceSurveyor/