Level and Type of Use on Bald Eagle State Forest: Report ... · Level and Type of Use on Bald Eagle...
96
Level and Type of Use on Bald Eagle State Forest: Report on a 1999-2000 Visitor Survey Submitted to: The Pennsylvania Department of Conservation & Natural Resources Bureau of Forestry Submitted by: Harry Zinn Deborah Kerstetter Alan Graefe Chieh-Lu Li Brijesh Thapa & Laurlyn Harmon The Pennsylvania State University Recreation & Park Management Program January 29, 2002
Transcript of Level and Type of Use on Bald Eagle State Forest: Report ... · Level and Type of Use on Bald Eagle...

Level and Type of Use on Bald Eagle State Forest:
Report on a 1999-2000 Visitor Survey
Submitted to:
The Pennsylvania Department of Conservation & Natural Resources
Bureau of Forestry
Submitted by:
Harry Zinn
Deborah Kerstetter
Alan Graefe
Chieh-Lu Li
Brijesh Thapa
& Laurlyn Harmon
The Pennsylvania State University
Recreation & Park Management Program
January 29, 2002

ii
Table of Contents
Executive Summary ................................................................................................................. iv
Introduction ............................................................................................................................... 1
Study Objectives ....................................................................................................................... 1
Methods..................................................................................................................................... 2
Study Population and Sample ............................................................................................... 2
Study Instrument ................................................................................................................... 3
Results ....................................................................................................................................... 4
Estimated Use Levels ............................................................................................................ 4
Visitor Profile........................................................................................................................ 6
Visitation Patterns ................................................................................................................. 6
Activity Participation and Location ...................................................................................... 8
Attachment to Specific Locations in BESF ........................................................................ 10
Importance of and Satisfaction with Forest Recreation Characteristics ............................. 13
General Forest Management Issues .................................................................................... 14
Trends in Visitor Characteristics, Behavior, and Preferences ............................................ 15
Discussion of Results .............................................................................................................. 21
Annual and Seasonal Visitation Levels .............................................................................. 21
Visitor Characteristics, Behavior, and Preferences............................................................. 22
Trends in Visitor Characteristics, Behavior, and Preferences ............................................ 23
Recommendations for Future Survey Methods ...................................................................... 26
Literature Cited ....................................................................................................................... 29
Appendix A: On-site and Follow-up Questionnaires............................................................. 30
Appendix B: Sampling Strategy ............................................................................................ 41
Appendix C: Results Tables................................................................................................... 43
Table 1. Sampling dates and locations by season and method .............................. 44
Table 2. Number of interviews completed by sampling zone and season ............. 48
Table 3. Profile of respondents .............................................................................. 49
Table 4. Visitation patterns by season ................................................................... 50
Table 5. Primary activity on day of interview, by season ...................................... 51
Table 6. Activity participation rates on day of interview, by season ..................... 52

iii
Table 7. Anticipated location of activity participation by season .......................... 53
Table 8. Location of favorite place in Bald Eagle State Forest ............................. 54
Table 9. What makes this place more special to you than other places that might be
similar to it? ............................................................................................................ 65
Table 10. If you could ask managers to keep one thing the same about this favorite
place, what would that be? ..................................................................................... 77
Table 11. If you could ask managers to change one thing about the way they
manage this favorite place, what would that be? .................................................... 85
Table 12. Characteristics of Forest: Mean importance and satisfaction by season 94
Table 13. Characteristics of Forest: Importance and satisfaction categories ......... 95
Table 14. Mean scores of responses to management issues on Forest by season .. 96
Table 15. Year of first visit to Bald Eagle State Forest and newcomer/veteran
categories ................................................................................................................ 96
Table 16. Background characteristics of newcomer, intermediate, and veteran
visitors ..................................................................................................................... 97
Table 17. Day trips, overnight trips and overnight quarters of newcomer,
intermediate, and veteran visitors ........................................................................... 97
Table 18. Season of most visits to Forest, newcomer, intermediate, and veteran
visitors ..................................................................................................................... 98
Table 19. Activity participation at BESF during 12 months prior to being
surveyed, newcomer, intermediate, and veteran visitors ........................................ 98
Table 20. Satisfaction with Forest characteristics, newcomer, intermediate, and
veteran visitors ........................................................................................................ 99
Table 21. Responses to Forest management issues, newcomer, intermediate, and
veteran visitors ........................................................................................................ 99

iv
Executive Summary
Level and Type of Use on Bald Eagle State Forest:
Report on a 1999-2000 Visitor Survey
Submitted by
The Pennsylvania State University
Recreation & Park Management Program
To estimate overall recreational use of Bald Eagle State Forest (BESF), profile visitor
characteristics, and identify recreational use patterns, a year-long survey of visitors was
conducted from June 1999 through May 2000. For the survey, the Forest was divided into
eight zones, and random sampling was conducted in each zone. A multiple sampling
approach was used, including traffic counts, on-site interviews, and mail-back questionnaires.
Use estimates. During summer, early fall, and spring, 593 on-site interviews were
conducted. During late fall and winter, an additional 502 questionnaires were distributed by
placing survey packets on the windshields of parked vehicles. Data from the four seasons
were treated as a stratified random sample to calculate an overall annual use estimate of
143,428 recreation visits 35,916 (margin of error = 5%, confidence level = 95%). Another
overall annual use estimate, 122,321 visitors, was calculated from rangers‟ patrol logs. The
estimate based on rangers‟ records should be considered less reliable than the survey-based
estimate. However, the similarity of the results tends to validate both estimates. Forest
visitation was heaviest in the spring and fall.
Visitor characteristics and behavior. Nearly nine out of ten participants were white
males 31 years old or older who lived in rural areas or small towns. More than one-third
began visiting the Forest before 1971, and fewer than one in ten were first-time visitors.
Approximately two-thirds indicated that they traveled 50 miles or less to visit the Forest.
Most were on day trips of three or more hours. Nearly half visited the Forest with members
of their family; one in five visited the Forest alone.
The largest number of participants identified fishing as their primary activity, followed
by hunting, viewing scenery, camping, snowmobiling, walking/day hiking, wildlife
watching, and picnicking. As expected, primary activities varied by season, with fishing
being most common during spring and summer and hunting most common during fall and
winter. Visitors often participated in multiple activities, so overall participation rates differed
from participation in primary activities. The highest overall participation rate was for
viewing scenery, which was followed by fishing, walking/day hiking, wildlife watching,
hunting, camping, picnicking, snowmobiling, driving through the Forest en route to another
destination, and swimming/tubing.
When asked where they expected to participate in their primary activity, nearly one third
of all participants named Penn‟s Creek or nearby areas (e.g., Poe Paddy, Cherry Run) and
one quarter named the White Deer Creek/McCall Dam area. Other areas named often
included Green‟s Valley, Hickernell North, Hairy John‟s, and R.B. Winter.

v
A total of 447 participants identified “favorite” places on the Forest. The largest single
category was places mentioned by one individual. For example, many identified a leased
cabin site. Others identified the Forest as a whole without specifying one place. Specific
places mentioned most often included Penn‟s Creek, Poe Valley, R.B. Winter, White Deer
Creek/McCall Dam, Hairy John‟s, and Tall Timbers. Favorite places tended to be located in
valleys along roads, not in remote areas. Participants reported that favorite places were
special to them because of conduciveness to a particular recreation activity, privacy, past
connections and memories associated with the place, attractive natural qualities, and
convenient location. Characteristics of favorite places that participants wanted protected
included wild or natural qualities, current maintenance practices, and current use levels.
Participants rated the importance of and their satisfaction with six characteristics of the
Forest, including (a) appearance and maintenance of areas visited; (b) opportunities to visit
without feeling crowded; (c) access to places the participant likes to visit; (d) adequacy of
signs; (e) availability of parking; and (f) the ability to obtain information about the Forest.
Ratings indicated that participants considered all six characteristics moderately to very
important and that they were moderately to very satisfied with the way these characteristics
are managed. Although differences in importance and satisfaction ratings were small,
satisfaction ratings were slightly lower than importance ratings for appearance and
maintenance, as well as opportunities to visit without feeling crowded. In contrast,
satisfaction ratings were slightly higher than importance ratings for access, availability of
parking, and ability to obtain information. Importance and satisfaction ratings for signage
did not differ, indicating participants‟ expectations matched the conditions they found.
Participants were also asked if they agreed or disagreed with four general resource
management statements including: (a) “It is more important to protect habitat for plants and
animals than provide opportunities for recreation,” (b) “The Forest should encourage more
timber harvesting,” (c) “More fish should be stocked in streams and lakes to provide
increased sport-fishing opportunities,” and (d) “More public lands such as Bald Eagle State
Forest should be set aside as wild or natural areas.” Participants agreed most strongly that
protecting habitat is more important than providing for recreation and more public lands
should be set aside as wild or natural areas. They also agreed that more fish should be
stocked in streams but disagreed with increased timber harvesting on State Forest land.
Trends. Veterans (first visited Forest 1927-1990), Intermediates (first visited Forest
1971-1990), and Newcomers (first visited Forest 1991-2000) had similar socio-demographic
characteristics, but differed in other ways. Newcomers were most likely to live more than 30
miles from the Forest, indicating that the market area and stakeholder group for the Forest
may be expanding. Newcomers were also most likely to make day-trips to the Forest and
most likely to visit in summer and winter, suggesting that traffic patterns, demand for day-
use areas, and seasonal need for ranger patrols may change over time. Newcomers were least
likely to participate in hunting or fishing, suggesting that these activities may become less
common. In contrast, Newcomers were most likely to participate in snowmobiling and
horseback riding, suggesting future growth in these activities. All three groups reported high
levels of satisfaction with Forest characteristics, suggesting that visitors will continue to look
favorably on current management practices.
vi
Management implications. Overall visitation exceeds 143,000 annually. Because the
Forest has multiple access points and an extensive road system and the survey had limited
logistic and financial resources, this is likely to be a conservative estimate.
The Forest has a strong core of loyal visitors. They have been visiting for many years
and tend to visit often, typically with family and/or friends. First-time visitors are currently a
small group, but they may influence the way the Forest is managed in the future.
Fishing and hunting were the most commonly reported primary activities, and visitation
was heaviest during spring and late fall, the prime fishing and hunting seasons. Relatively
heavy visitation during early fall may have corresponded with the prime period for fall color.
winter visitation nearly equally the summer level, perhaps because the Forest held adequate
snow cover for snowmobiling for the first time in several years.
Two-thirds of Forest visitors limited their stays to a single day. If managers want to
increase or extend visitation to the Forest, educating current and potential visitors about
dispersed camping opportunities on the Forest as well as lodging and camping opportunities
near the Forest could be effective.
Although satisfaction with Forest characteristics was generally high, satisfaction with
levels of crowding was an issue. Providing visitor information about alternative locations for
recreation, high-use versus low-use areas of the Forest, and high-use versus low-use time
periods may be helpful.
Few children visit the Forest, perhaps because opportunities that typically attract families
with young children, (e.g., beaches, playgrounds, etc.) are not provided in State Forests. It
may be desirable to promote more use of the Forest by families and young people. Those
who learn early in life to enjoy the opportunities available on the Forest, may also learn to
support State Forests and their mission throughout their lives. If promoting family use of the
Forest is important, managers should publicize the Forest‟s opportunities for “family
friendly” recreation in undeveloped settings.
Survey participants enjoyed favorite places within the Forest because of natural settings,
privacy, and memories about past experiences, suggesting many visitors place high value on
the Forest and/or sites within it. Sharing this information could help elected representatives,
appointed officials, and the general public of the Commonwealth appreciate the powerful
positive impact State Forests have on people who visit them.
Recommendations for future survey methods. This survey was designed, in part, to test
data collection methods for use in future visitor surveys of other State Forests. Stratifying
the Forest into data collection zones was effective. The two data collection methods used
each had advantages and disadvantages. On-site interviews and mail-back questionnaires
yielded a high response rate (60%) but the logistical demands of this approach were costly.
Placing survey packets on windshields was simpler and less expensive. However, because of
low response rates (20%), this approach raises questions about the representativeness of the

vii
sample. In winter, neither approach could be used on unplowed roads, but it was possible to
place survey packets on the windshields of vehicles parked at Forest access points along
plowed roads.
Before conducting other State Forest visitor surveys, managers should evaluate the
advantages and disadvantages of each survey approach, as well as other alternatives.
Advantages of simple methods include low logistical and monetary costs. Disadvantages of
simple methods include the high probability of obtaining biased estimates and the inability to
calculate meaningful margins of error. In contrast, complex methods (like that used in the
current survey) are costly, but they are likely to produce unbiased estimates and meaningful
margins of error.
During this study, vehicle and trail counters were tested unsuccessfully. Making secure
installations and maintaining counters proved to be prohibitive, particularly during cold
weather. Furthermore, trail counters were unreliable during high winds. In another study, it
is unlikely that counters can be used successfully unless they can be maintained and read by
personnel who do not need to travel long distances.
Ultimately, any decision about survey methods in other Pennsylvania State Forests
should be based on each Forest‟s physical characteristics, seasonal differences in
accessibility, traveling distances for data collection, and long-term availability of data
collection personnel. All of Pennsylvania‟s State Forests share some important
characteristics and management issues, but other important characteristics and issues may
vary between Forests. For example, a sampling method might be highly successful in one
Forest but less successful in another because of differences in road and trail networks or use
patterns.

1
Introduction
The Pennsylvania Department of Conservation and Natural Resources (DCNR) manages
over two million acres of State Forest land across the Commonwealth, all of which abuts or
surrounds other public (e.g., State Parks, State Game Lands) or private lands. State Forests
can be entered via state, county, municipal, and forest roads; informal and formal trails; and
waterways. Hence, it is difficult to obtain accurate estimates of current recreational use
levels and patterns.
Estimates of current use on State Forest lands are imperative to the DCNR and the
agencies with whom it works because:
1) activities and areas with high potential for conflict can be identified and managed;
2) plans for access, resource protection, visitor services, enforcement and maintenance
can be created;
3) marketing efforts can be focused to develop awareness of opportunities for
consumers;
4) communication can be improved with specific constituent groups; and,
5) visitation patterns can be linked to management plans and operating and capital
budgets.
Given the importance of documenting and understanding current users, a visitor use study
was conducted at Bald Eagle State Forest (BESF) from June, 1999, through June, 2000. The
study was implemented to document levels and type of use occurring on BESF and the
characteristics of forest visitors, including their activity choices, demographics, attitudes and
travel behavior. The study was designed to test methods that could be used to measure use at
other District Forests across the Commonwealth.
Study Objectives
In order to address the overall purpose of this study, the following objectives were
developed:
Estimate overall recreational use of BESF; and,
Develop a profile of visitors, including their demographic characteristics, activity
participation patterns (on the Forest and elsewhere), length-of-stay, party size and
composition, and place of residence.

2
Methods
Study Population and Sample
The study population targeted in this study was visitors to BESF. Because they can
access the Forest through multiple points on roads, trails and waterways and engage in
diverse activities (e.g., hunting, fishing, hiking) across the year, a multiple sampling
approach was utilized. This multiple sampling approach included traffic counts and
monitoring as well as on-site interviews at key access points. In addition, to verify use
estimates, they were compared to visitor data collected by Forest rangers.
To achieve the study‟s first objective of estimating overall recreational use levels on the
BESF, the Forest was divided into eight separate zones:
1. Rainsares
2. South Eastville (including Mile Run, White Deer Creek & McCall Dam)
3. Hickernell North (including Jones Mountain, Stoney Run & Winklebleck Road)
4. Hickernell South (including Woodward, Bear Run & Cherry Run)
5. New Lancaster Valley (including Poe Paddy, Sand Mountain, & Bear Gap)
6. Troxelville (including Tall Timbers, Snyder-Middleswarth, & Wiekert Run )
7. Shade Mountain
8. Green‟s Valley
Each zone contains distinct natural and man-made features and offers somewhat different
recreational opportunities. Visitors were sampled at multiple access points in each of the
eight zones. Sampling locations within each zone were chosen based on criteria including
traffic patterns and primary use areas within the zone, as well as the safety of field personnel.
BESF staff was consulted on all issues tied to sampling. In addition, every effort was made
to sample throughout the Forest each week, when appropriate.
The second study objective, profiling visitors, was addressed with on-site and follow-up
questionnaires. Interviewers approached visitors, and each visitor who agreed to participate
was asked a minimum of seven questions. At the end of the interview visitors were asked if
they would participate in a longer, more in-depth survey. Those who agreed were given a
packet, which included a cover letter, questionnaire and postage-paid return envelope.
The sampling procedure was changed during the late fall and winter seasons (late
October to early April) when on-site interviewing was nearly impossible due to inclement
weather, patterns of use, and/or the safety of interviewers. During this time, the on-site and

3
follow-up questionnaires were combined into a single document. Interviewers drove
throughout the Forest looking for users and their vehicles. When a vehicle was spotted, the
interviewer placed a packet (cover letter, questionnaire and postage-paid return envelope),
covered by a plastic bag, on the windshield of the visitor‟s vehicle.
A total of 698 on-site interviews were conducted. An additional 397 questionnaires were
distributed via the windshield method (Table 1). (For a complete record of sampling
methods, dates, and locations, see Appendix C, Table 1.)
Table 1. Number of survey responses by season
Season
Method Summer Fall Winter Spring Total
On-site interview 466 127 0 105 698
Windshield 0 92 305 0 397
Total 466 219 305 105 1,095
Study Instrument
The on-site questionnaire included seven primary questions (Appendix A). The first was
used to gauge whether visitors were visiting the Forest for the day or overnight. If visiting
for the day, they were asked how many hours they intended to spend in the Forest. If staying
overnight, they were asked how many nights they planned to be in the Forest and where they
planned to stay (e.g., designated campsite vs. leased cabin site). In addition, visitors were
asked what activities they planned to participate in while visiting the Forest, where they were
going to participate in the activity, whether or not they had been to the Forest previously and,
if applicable, questions about the composition of their visitor group. To determine the
distance traveled by visitors, they were also asked how far they live from the Forest.
The questions on the follow-up questionnaire were much more detailed and fell into five
separate sections (see Appendix A). The first section, which focused on visitors‟ experience
at BESF, included four questions. The first question dealt with visitors‟ satisfaction with
their most recent visit to the Forest. It was followed by a question that addressed their
perception of the overall quality of their experience. The last two questions were open-ended
and requested that individuals indicate what they liked most and least about their most recent
visit to the Forest.

4
The second section allowed visitors to describe their favorite place or area in BESF.
They did so through answering eight open-ended questions. The ninth question gave
respondents an opportunity to indicate their feelings about a favorite place within Bald Eagle
Forest. The final two questions offered respondents an opportunity to describe what should
or should not be changed about their special place by the staff of the Forest.
To profile visitors‟ recreational behavior, they were asked to indicate how many days in
the last 12 months they had participated in a series of recreational activities in BESF and
other locations. They were also asked to describe which activities are most important to
them, the number of years they‟ve been involved in them, and their level of skill and
involvement with the activities. The last question in the third section focused on the
importance individuals attach to six separate characteristics of the Forest.
Generally, it is expected that individuals who participate in outdoor activities will have
respect for the environment and exhibit behaviors that reflect their respect. Thus, the fourth
section of the questionnaire included a question that addressed respondents‟ opinions on a
wide range of environmental issues and a question that focused on the degree to which
individuals engaged in environmentally responsible behavior. A third question requested
information about conservation or environmental groups with which individuals are
involved.
The final section included questions designed to profile respondents. They focused on
respondents‟ gender, age, ethnic origin or background, childhood and current residence, level
of education, household composition, level of income and political outlook.
Results
Estimated Use Levels
As noted earlier, data collection began in the summer with on-site interviews. Hence,
summer and spring use estimates are based entirely on this method. However, beginning part
way through the fall season and lasting through the winter season, a modified data
“windshield survey” method was used to collect data. Because of this change, two fall use
estimates were computed, one for early fall using on-site interview data, and one for late fall
using windshield survey data. A single winter estimate is based entirely on windshield data.

5
Data from each season were treated as a simple random sample. Using formulae proposed by
Scheaffer, Mendenhall and Ott (1990), seasonal data were treated as a stratified random
sample to calculate an overall annual use estimate of 143,428 visits 35,916 (margin of error
= 5%, confidence level = 95%, see Table 2). Note that a margin of error and confidence
interval were calculated only for the overall annual estimate. These values are useful
because they are based on the aggregate sample size of the year-long survey. In contrast,
margin of error and confidence interval values were not calculated for the seasonal estimates.
The small sample size for any one season and the normal variation in recreation use between
sample periods make it impossible to calculate meaningful margins of error for the seasonal
estimates. In some cases, the margin of error would be nearly as large as the estimated
seasonal use level. (For a more detailed description of sampling strategy, see Appendix B.)
Table 2. Overall annual use estimate and underlying seasonal estimates
Period
Use
estimate
Margin
of error a
Confidence
interval a
Overall annual use 143,428 35,916 107,512 – 179,343
Summer season (6/1/99-9/6/99, 98 days) 28,230 NA NA
Early fall season (9/7/99-10/1/99, 25 days) 22,720 NA NA
Late fall season (10/2/99-12/17/99, 77 days) 34,454 NA NA
Winter season (12/18/00-3/31/00, 105 days) 27,245 NA NA
Spring season (4/1/00-5/31/00, 61 days) 30,781 NA NA
a For the overall annual use estimate, the confidence interval was computed using a 5%
margin of error and a 95% confidence level.
In an effort to “triangulate” data sources, a second overall annual use estimate was
calculated from visitor estimates recorded by Forest rangers on their daily patrols. To
account for different daily routes used by rangers, this estimate used only data from 59 patrol
logs recorded on days during which rangers spent all or nearly all of their time inside one of
the Forest‟s eight sampling zones. Data from these sheets were treated as a random sample
stratified by zone. The overall annual use estimate calculated from the patrol sheets was
122,321 visitors. Two important limitations apply to this estimate. First, no sampling was
done during the winter when rangers did not patrol. Second, useable patrol sheets were
available from only five of the eight Forest zones because rangers were never able to spend
all or nearly all of a single patrol inside the isolated Rainsares, Green Valley, or Shade
Mountain areas. Because of these limitations, this estimate should be considered less reliable

6
than the survey-based estimate. However, the similarity of the results obtained by the two
methods tends to validate the use estimates.
Visitor Profile
Overall, nearly all survey participants were white (99%) males (86%) living in rural areas
or small towns (81%). (For a detailed summary of socio-demographic characteristics of
participants by season, see Appendix C, Table 3.) The majority was between the ages of 31
and 50 (51%) or older (37%), and fewer than one percent were 18 or younger. More than
one-half (58%) reported having no children living in their household. Half of all participants
had completed senior high school or less, and just over half (55%) reported an annual
household income of less than $50,000.
Visitation Patterns
Survey participants tended to be regular, long-time visitors who lived near BESF. Fewer
than one in ten (7%) were first-time visitors. (For a detailed summary of visitation patterns
by season, see Appendix C, Table 4.) Among repeat visitors, 41% had visited the Forest 5
times or less during the preceding 12-month period. In contrast, 26% had visited the Forest
more than 20 times (Figure 1).
Figure 1. Number of visits in past 12 months
5 or fewer 6 - 10
11 - 20 21 or more

7
Nearly three-fourths (72%) of the respondents visit the Forest in the summer or fall The
largest proportion of participants (44%) visited the Forest with members of their family. Of
interest, however, is that 19% of the respondents indicated that they visited the Forest alone
When asked how far they had traveled to visit the Forest, two-thirds indicated 50 miles or
less (Figure 2). Only 19% had traveled over 100 miles to visit the Forest. Given that the
majority of respondents indicated they had traveled a short distance to the Forest, it is not
surprising that they were most likely to be on a day trip (67%) and to spend three or more
hours at the Forest (59%). (For a detailed summary, see Appendix C, Table 4).
A majority of visitors (67%) were day-users. Among those who visited the Forest for
more than one day (33%), two thirds indicated that they would be in the area for two to five
nights. Just over one-half (53%) reported that they would spend their nights inside the
Forest, most often at a leased cabin site or a designated Forest campsite (Figure 3). Those
who were staying outside the Forest (47%) were most likely to spend the night in a state
park, a private campground, or in a private cabin. (For a detailed summary, see Appendix C,
Table 4).
Figure 2. Miles traveled to Forest
Under 25 25-50 51-100 Over 100

8
Activity Participation and Location
Survey participants were asked to list all activities they would participate in during their
visit to the Forest. They were then asked to indicate which of these activities they considered
to be their primary activity. The largest percentage of participants (Figure 4) identified
fishing as the primary activity. Other primary activities identified by at least five percent of
participants (in descending order of frequency) were hunting, viewing scenery, camping,
snowmobiling, walking/day hiking, wildlife watching, and picnicking. As expected, these
primary activities varied substantially by season. Fishing, for example, was most common
during spring and summer, while hunting was most common during fall and winter. (For a
detailed summary of primary activities by season, see Appendix C, Table 5).
Figure 3. Location of overnight stays
0 10 20 30 40
Leased cab in
Designated campsite
Backcountry site
State park
Private campground
Private cab in
Bed and Breakfast
Percent
Forest site Outside forest
Figure 4. Primary activities of visitors
0 5 10 15 20 25
Picn icking
W ild life watch ing
W alking/dayhiking
Snowmobiling
Camping
Viewing scenery
Hunting
Fish ing
Percent
9
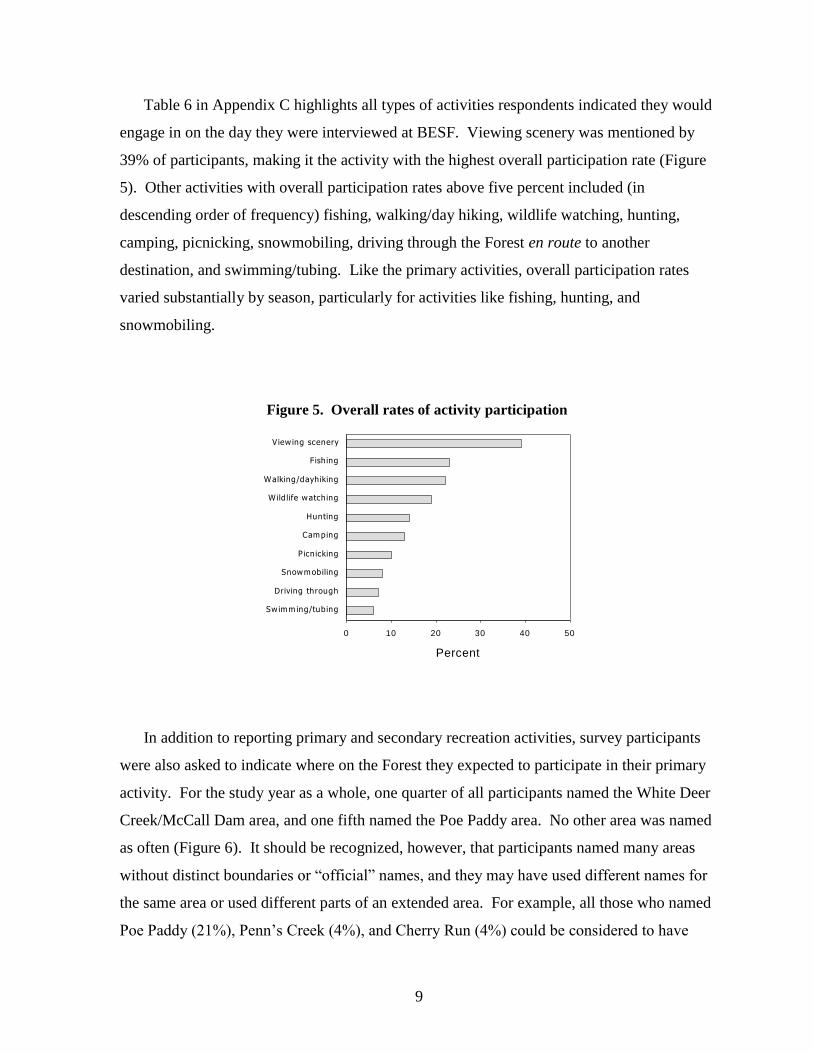
Table 6 in Appendix C highlights all types of activities respondents indicated they would
engage in on the day they were interviewed at BESF. Viewing scenery was mentioned by
39% of participants, making it the activity with the highest overall participation rate (Figure
5). Other activities with overall participation rates above five percent included (in
descending order of frequency) fishing, walking/day hiking, wildlife watching, hunting,
camping, picnicking, snowmobiling, driving through the Forest en route to another
destination, and swimming/tubing. Like the primary activities, overall participation rates
varied substantially by season, particularly for activities like fishing, hunting, and
snowmobiling.
In addition to reporting primary and secondary recreation activities, survey participants
were also asked to indicate where on the Forest they expected to participate in their primary
activity. For the study year as a whole, one quarter of all participants named the White Deer
Creek/McCall Dam area, and one fifth named the Poe Paddy area. No other area was named
as often (Figure 6). It should be recognized, however, that participants named many areas
without distinct boundaries or “official” names, and they may have used different names for
the same area or used different parts of an extended area. For example, all those who named
Poe Paddy (21%), Penn‟s Creek (4%), and Cherry Run (4%) could be considered to have
Figure 5. Overall rates of activity participation
0 10 20 30 40 50
Sw imm ing/tubing
Driving through
Snowmobiling
Picnicking
Camping
Hunting
W ild life watching
Walking/dayhiking
Fishing
View ing scenery
Percent

10
been visiting the extended Penn‟s Creek area. (For a detailed summary of anticipated
location of activities by season, see Appendix C, Table 7.)
Attachment to Specific Locations in BESF
To develop a better understanding of attachment to specific places in the Forest, the mail-
back survey included a series of open-ended questions about “favorite” places. A total of
441 participants identified specific places, 96 (22%) of which were unique, i.e., identified by
only one participant (Figure 7). Nearly ten percent of the participants identified a leased
cabin site, and nearly nine percent identified the Forest as a whole without specifying one
place. Among specific areas identified, Penn‟s Creek (including Poe Paddy, the tunnel, and
Cherry Run) was mentioned most often. Poe Valley, R.B. Winter, White Deer Creek/McCall
Dam, Hairy John‟s, and Tall Timbers were also mentioned by at least two percent of the
participants. In general, the favorite places mentioned by participants tended to be located in
readily accessible parts of the Forest, in valleys and along higher standard roads, rather than
hike-in sites in remote areas. (For a complete, categorized list of verbatim responses about
favorite places, see Appendix C, Table 8.)
Figure 6. Anticipated location of activities
0 5 10 15 20 25 30
Mid-State Tra il
Treaster Valley
Sand Mounta in
Bear Gap
Jones Mt Road
Cherry Run
Penns Creek
R B W inter
Hairy John Picnic
Hickernell N.
Greens Valley
Poe Paddy
W hite Deer
Percent

11
Participants reported a variety of reasons why favorite places were special to them
(Figure 8). A location‟s conduciveness to a particular recreation activity, such as hunting,
fishing, or wildlife watching, was mentioned by more participants (21%) than any other
characteristic. Other characteristics of favorite places that were mentioned by at least five
percent of participants included privacy and quiet (19%), past connections, memories, or
traditions associated with the place (14%), natural qualities (13%), proximity or convenient
location for the individual participant (11%), and views or scenery (5%). (For a complete,
categorized list of verbatim responses about why favorite places were special, see Appendix
C, Table 9.)
Figure 8. What makes favorite place special?
0 5 10 15 20 25
Views, scenery
Proximity, convenience
Natural qualities
Past connection
Privacy, quiet
Conducive to recreation
Percent
Figure 7. Location of favorite place in the Forest
0 5 10 15 20 25
Ta ll Timbers
Ha iry John's
W hite Deer/McCa ll
R .B. W inte r
Poe Va lley
Penns Creek
Fores t in genera l
Leased cabin s ite
Unique responses
Percent

12
Participants were also asked what characteristics of favorite places were most important
to keep the same and to change. Characteristics of favorite places that were most important
to keep the same (Figure 9) included natural qualities, mentioned by 22% of the participants,
as well as “everything” and current use level, each of which was mentioned by 18% of
participants. Current maintenance practices were mentioned by 17% of participants, and five
percent or fewer mentioned access or current rules and regulations. (For a complete,
categorized list of verbatim responses about what characteristics of favorite places were most
important to protect, see Appendix C, Table 10.)
Changes that participants wanted at their favorite places (Figure 10) included improvements
to facilities (mentioned by 25% of the participants), nothing (21%), modifications to visitor
use patterns (16%), modifications to resource management (12%), enforcement of rules and
regulations (9%), and road improvements (8%). (For a complete, categorized list of verbatim
responses about what characteristics of favorite places were most important to change, see
Appendix C, Table 11.)
Figure 9. Characteristics of favorite place
to keep the same
0 5 10 15 20 25
Rules & regs.
Access
Maint. practices
Use level
Everything
Natural qualities
Percent

13
Importance of and Satisfaction with Forest Recreation Characteristics
To help managers assess visitor responses to Forest recreation characteristics, survey
participants were asked to rate the importance of and then report their satisfaction level with
six characteristics of the Forest. The recreation characteristics included: (a) appearance and
maintenance of areas visited, (b) opportunities to visit without feeling crowded, (c) access to
places the participant likes to visit, (d) adequacy of signs, (e) availability of parking, and (f)
the ability to obtain information about the Forest. Participants rated both importance and
satisfaction on five-point scales (1 = Not at all important / Not at all satisfied; 5 = Extremely
important / Extremely satisfied). Mean importance ratings indicated that participants
considered all six characteristics moderately to very important (Figure 11). (For a detailed
summary of importance and satisfaction ratings by mean scores and by category, see
Appendix C, Tables 12 & 13.)
Mean satisfaction ratings indicated that participants were also moderately to very
satisfied with the manner in which these Forest characteristics are managed. Differences in
mean importance and satisfaction ratings were small, indicating that there was little
discrepancy between what participants wanted and what they found on the Forest. Although
small, five of the differences were statistically significant. For two characteristics (i.e.,
appearance and maintenance, opportunities to visit without feeling crowded), satisfaction
ratings were slightly lower than importance ratings, indicating that participants preferred
Figure 10. Characteristics of favorite
place to change
0 5 10 15 20 25 30
Improve roads
Enforce regs.
Modify res. mgmt.
Modify use patterns
Nothing
Improve facilities
Percent

14
somewhat better conditions than they found in each area. For three characteristics (i.e.,
access, availability of parking, ability to obtain information), satisfaction ratings were
slightly higher than importance ratings, indicating that, in these areas, participants‟
preferences were somewhat exceeded by the conditions they found on the Forest.
Importance and satisfaction ratings for signage were not significantly different, indicating a
close match between participants‟ expectations and the actual conditions they found.
General Forest Management Issues
In addition to rating recreation characteristics of the Forest, survey participants were also
asked to respond to four general management issues. Participants were asked if they agreed
or disagreed that: (a) “It is more important to protect habitat for plants and animals than
provide opportunities for recreation,” (b) “The Forest should encourage more timber
harvesting,” (c) “More fish should be stocked in streams and lakes to provide increased
sport-fishing opportunities,” and (d) “More public lands such as Bald Eagle State Forest
should be set aside as wild or natural areas.” Responses to each statement were based on a
five-point scale (-2 = Strongly disagree; +2 = Strongly agree). On average, participants
agreed most strongly that protecting habitat is more important than providing for recreation
and more public lands should be set aside as wild or natural areas (Figure 12). Participants
Figure 11. Importance of & satisfaction with
Forest recreation characteristics
1 2 3 4 5
Adequacy o f signs
Appearance & maintenance*
Ability to obtain info rmation*
Absence o f crowding*
Availability o f parking*
Access to places I like*
Importance Satisfaction
*Importance & satisfaction differed significantly.
Scale: 1 = Not at all; 2 = Extremely

15
also agreed that more fish should be stocked in streams for sport-fishing, but disagreed with
more timber harvesting on State Forest land. (For a detailed summary of responses to
questions about management issues, see Appendix C, Table 14.)
Trends in Visitor Characteristics, Behavior, and Preferences
To better understand visitation trends in BESF, survey participants were grouped by year
of first visit to the Forest, so characteristics and use patterns of these subgroups could be
compared. Over 74% of the participants reported that they had first visited the Forest in
1990 or before. These long-time visitors were divided almost equally between those who
first visited the Forest in 1970 or before and those who first visited the Forest between 1971
and 1990 (Figure 13). Only 25% of the participants reported that they first visited the Forest
between 1991 and 2000. For convenience in describing the characteristics and use patterns
of these three subgroups, they have been named Veterans, Intermediates, and Newcomers,
respectively. (For a detailed summary of year of first visit to the Forest and subgroup
categories, see Appendix C, Table 15.)
Figure 12. Responses to general management issues
-2 -1 0 1 2
Should set aside
more wild areas
Should stock
more fish
Should harvest
more timber
Habitat more
important
*Issue ratings did not differ significantly.
*
*
Strongly
disagree
Strongly
agreeNeutral

16
Background characteristics of Newcomers, Intermediates, and Veterans. Analysis of
variance and chi-square tests of independence were used to compare 10 background
characteristics of Newcomers, Intermediates, and Veterans. (For detailed results of these
statistical tests of background characteristics, see Appendix C, Table 16.) The three
subgroups did not differ significantly with respect to:
Gender (86% male),
Ethnic background (99% Caucasian);
Annual income (57% reported household incomes ranging from $30,000 to $79,999);
Current residence (77% reported living in a rural area or a town with a population
smaller than 10,000);
Political orientation (57% considered themselves moderately or very conservative); or
Environmental orientation (average score = 3.5 on a 15-item scale ranging from 1
[strong beliefs that environmental problems are not serious and can be managed
easily by humans] to 5 [strong beliefs that environmental problems are serious and
cannot be managed easily by humans]).
Four characteristics of Newcomers, Intermediates, and Veterans did differ significantly.
First, Veterans were significantly older (52.8 years) than both Intermediates (42.9 years) and
Figure 13. Year of first visit to Forest
37%
25%
38%
Veterans 1927-1970 Intermediates 1971-1990
Newcomers 1991-2000

17
Newcomers (43.5 years). Second, although the difference was small, Veterans (13.3 years)
had significantly fewer years of formal education than Newcomers (13.9 years). Third,
Veterans (56%) and Intermediates (55%) were more likely than Newcomers (37%) to live
within 30 miles of BESF. Fourth, Veterans (83%) were more likely than Intermediates
(79%) or Newcomers (69%) to have grown up in a rural area or small town. However, a
large majority of each subgroup grew up in rural areas or small towns.
Forest use patterns of Newcomers, Intermediates, and Veterans. The results of the
statistical test for differences among the subgroups in day trips, overnight trips, and overnight
lodging approached significance (p = .061). Although these results should be interpreted
cautiously, they suggest that Newcomers were somewhat more likely than Intermediates or
Veterans to make day trips to the Forest (Figure 14). Furthermore, the results suggest that,
when making overnight trips, Newcomers were less likely to spend the night at a leased or
private cabin site. (For detailed results of this statistical test, see Appendix C, Table 17.)
Newcomers, Intermediates, and Veterans reported significant differences in the season
during which they visited the Forest most often (Figure 15). Newcomers were more likely
than Intermediates or Veterans to report that they visited most often in summer or winter. In
contrast, Newcomers were less likely to report that they visited most often in fall. The three
Figure 14. Day trips versus overnight trips & lodging,
Newcomers, Intermediates, & Veterans
0
20
40
60
80
Day trip Cam ping at
BESF
Leased or
private cabin
State Park Com m ercial
T rip typ e
Pe
rce
nt
N ew co m ers
In term ed .
Veteran s

18
subgroups were most similar in regard to spring. (For detailed results of this statistical test,
see Appendix C, Table 18.)
Participation rates for 16 different outdoor recreation activities were calculated for
Newcomers, Intermediates, and Veterans. These rates were based on responses about
activities participation at BESF during the 12-month period prior to being surveyed.
Participation differences were tested with logistic regression, which made it possible to
control for the effect of age differences across subgroups as the tests were conducted.
Controlling for the effect of age was important because age is often associated with
decreasing participation rates for outdoor activities, and Veterans in this study were, on
average, significantly older than Intermediates or Newcomers. Tests of subgroup
participation rates showed significant differences for eight activities and approached
significance for two more activities ― camping and horseback riding (Figure 16). For eight
activities, including viewing scenery, fishing, day hiking, wildlife watching, hunting,
camping, picnicking, and swimming, participation rates were higher among Veterans and
Intermediates than among Newcomers. For two activities, snowmobiling and horseback
riding, participation rates were highest among Newcomers. (For detailed results of the
statistical tests of subgroup activity participation rates and the related effect of age, see
Appendix C, Table 19.)
Figure 15. Season of most visits to forest,
Newcomers, Intermediates, & Veterans
0
20
40
60
80
Spring Sum m er Fall W inter
Seaso n o f m o st v is its
Pe
rce
nt
N ew co m ers
In term ed .
Veteran s

19
The average satisfaction levels of Newcomers, Intermediates, and Veterans with six
Forest characteristics were compared (Figure 17). All three subgroups reported relatively
high levels of satisfaction with all Forest characteristics, but significant differences were
found on two of the characteristics. Compared to Veterans and Intermediates, Newcomers
reported higher levels of satisfaction with opportunities to visit Forest sites without feeling
crowded. In contrast, Veterans reported the highest level of satisfaction with the ability to
obtain information about the area. (For detailed results of the statistical tests of subgroup
satisfaction with Forest characteristics, see Appendix C, Table 20.)
Figure 16. Activity participation at BESF,
Newcomers, Intermediates, & Veterans
0 20 40 60 80
Horseback*
Swim m ing
Snowm obiling
Picnicking
Cam ping*
Hunting
Wildlife
Day hiking
Fishing
SceneryA
cti
vit
y
Percent
Newcom ers
Interm ed.
Veterans
*Differences approached significance (p < .07%).

20
The responses of Newcomers, Intermediates, and Veterans to four general forest
management issues were also compared (Figure 18). Significant differences were found only
among responses regarding timber harvesting. On average, all three subgroups disagreed
with the statement that the Forest should encourage more timber harvesting, but
disagreement was significantly stronger among the Intermediates than the Veterans. Average
scores of the Newcomers were close to those of the Intermediates but did not differ
significantly from those of either subgroup. Average scores of three subgroups did not differ
significantly for any of the other three forest management issues. (For detailed results of the
statistical tests of subgroup responses to forest management issues, see Appendix C, Table
20.)
Figure 17. Satisfaction with Forest characteristics,
Newcomers, Intermediates, & Veterans
1 2 3 4 5
Adequacy of
signs
Appearance &
m aintenance
Ability to obtain
inform ation*
Absence of
crowding*
Availability of
parking
Access to
places I like
Mean scores
N ewcom ers
In term ed.
Veterans
*Subgroups differed significantly.
Scale: 1 = Not at all satisfied; 5 = Extremely satisfied

21
Discussion of Results
Annual and Seasonal Visitation Levels
As measured by this survey, overall use of BESF exceeds 143,000 visits annually.
Because of the nature of the Forest and the limitations of the survey, this is likely to be a
conservative estimate. Multiple access points and the extensive Forest road system, as well
as the logistic and financial constraints of the survey, made it impossible to be assured of
capturing all visitation during any one sampling period.
Seasonal variation in visitation was consistent with patterns of recreation behavior on the
Forest. Fishing and hunting were the most commonly reported primary activities, and
visitation was heaviest during spring and late fall, the prime fishing and hunting seasons.
The relatively high level of visitation during the short (25 day) early fall season may have
corresponded with interest in viewing scenery during the prime period for fall color. It was,
perhaps, surprising that winter visitation nearly equaled the summer level. This may have
Figure 18. Responses to general management issues,
Newcomers, Intermediates, & Veterans
-2 -1 0 1 2
Should set aside more wild areas
Should stock more fish
Should harvest more timber*
Habitat more important than rec.
Veterans In term ediates N ewcom ers
*Subgroup responses differed significantly.
Strongly
disagree
Strongly
agreeNeutral
22
been because the Forest held adequate snow cover for snowmobiling for the first time in
several years.
Visitor Characteristics, Behavior, and Preferences
BESF has a strong core of loyal visitors. They have been visiting the Forest over an
extended period of time and tend to visit it often. Further, they tend to be older and, when
they visit the Forest, do so with their family and/or friends. It is important, however, to
recognize that there is a small group of first-time visitors who may, in time, have an
influence on the way in which BESF is managed. Given the estimated number of individuals
visiting the Forest, this group may range in number from 7,525 to 12,554.
Regardless of type of user (i.e., first-time vs. repeat), most individuals visit the Forest in
spring or fall. Hence, it is not surprising that when asked about their level of satisfaction
with specific characteristics of the Forest, respondents were likely to indicate that crowding
was an issue. One way to respond to concern about crowding is to provide information to
visitors, including information about alternative locations for recreation, high-use versus low-
use areas of the Forest, and high-use versus low-use time periods (e.g., weekends versus
weekdays).
Two-thirds of Forest visitors limited their stays to a single day. In part, this is likely to be
a function of at least three factors. First, Pennsylvania State Forests provide some
undeveloped campsites and opportunities for backcountry camping but do not provide
overnight cabins or developed campgrounds. Providing more highly-developed facilities of
this type has not been considered consistent with the State Forests‟ mission, which
emphasizes providing opportunities for dispersed recreation. Second, many Forest visitors
spend nights in numerous private cabins located on leased cabin sites or private land near or
inside Forest boundaries. Third, a majority of Forest visitors (66%) reported traveling less
than 50 miles from home. If management wants to increase or extend visitation to the Forest,
a promotional campaign designed to educate current and potential visitors about camping
opportunities on the Forest as well as other types of lodging or camping opportunities near
the Forest should be implemented.
Few children visit BESF. Most visitors (88%) were 31 or older, and nearly 60% reported
having no children living in their household. Fewer than one percent of all visitors were 18

23
or younger. This pattern may be related to the Forest‟s dispersed recreation mission;
opportunities that typically attract families with young children, (e.g., beaches, playgrounds,
etc.) are not provided by Pennsylvania State Forests. The pattern also may be related to
choices made by adult recreationists accompanied by children. For example, a Central
Pennsylvania adult who wishes to take children fishing might choose to visit a State Park
rather than a State Forest. In many cases, the State Park would offer easier road access, more
frequent patrols, and amenities like play equipment, picnic tables, benches, and toilets that
are typically not available in the State Forest.
It may be desirable to promote more use of the Forest by families and young people.
Those who learn early in life to enjoy the opportunities available on the Forest, may also
learn early in life about the State Forest mission and support that mission throughout their
lives. If promoting family use of the Forest is important, management should publicize the
Forest‟s opportunities for “family friendly” recreation like picnicking, walking, hiking,
biking, and wildlife viewing in undeveloped settings.
When asked about their favorite places within the Forest, most indicated that the natural
setting, the privacy of the location and their memories about past experiences contributed to
their feeling that a place within the Forest was special. This information suggests many
visitors place high value on the Forest and/or sites within it. It may be important for
management to share this type of information with several constituencies. Understanding the
high value that visitors place on the Forest could help elected representatives, appointed
officials, and the general public of the Commonwealth appreciate the powerful positive
impact Pennsylvania State Forests have on the people who use them.
Trends in Visitor Characteristics, Behavior, and Preferences
A comparison of Veteran visitors, Intermediates, and Newcomers to BESF revealed that
the backgrounds of Forest visitors were largely similar. Subgroup members were similar in
gender, ethnic background, income, and current residence, as well as political and
environmental orientation. The average age of Newcomers (42 years old) was significantly
less than that of Veterans (53 years old) but not significantly different than the age of
Intermediates (43 years old). Although Newcomers and Intermediates were younger than
Veterans, all three subgroups averaged more than 40 years old. The overall similarity among
24
the three subgroups suggests that the socio-demographic characteristics of Forest visitors will
not change rapidly in the near future.
Newcomers were likely than Intermediates or Veterans to live more than 30 miles from
the Forest, which suggests that the core market area for recreational use of the Forest may be
expanding. This trend is likely to continue as long as the availability of discretionary time
and money do not decrease. To the extent that the Forest‟s recreational market area
continues to expand, the portion of visitors without long-time connections to the Forest is
likely to grow larger. This change may eventually result in a population of stakeholders who
hold more diverse opinions about how the Forest should be managed.
Not only did Newcomers travel farther to visit the Forest; their visitation patterns also
differed from those of the Intermediates and Veterans. Newcomers were more likely than
Intermediates or Veterans to report that their primary season of visitation was summer or
winter, suggesting that growth in recreational use of the Forest is likely to be greatest during
these two seasons. Over time, this change in seasonal visitation patterns may make winter
ranger patrols increasingly important. Although the evidence was not conclusive, survey
data also suggest than Newcomers were more likely than Intermediates or Veterans to make
daytrips to the Forest. This finding is consistent with the results of studies in other areas
across the country that provide opportunities for resource-based recreation. Like the
expanding market area for the Forest, this trend may be linked to the availability of
discretionary time and money. Increasing day-use of the Forest may influence traffic
patterns and volume on Forest roads and may lead to increased demand for day-use areas and
parking.
Differences in activity participation among Newcomers, Intermediates, and Veterans
were complex. Some differences suggest that the mix of recreation activities on the Forest
may be changing. For example, Newcomers were less likely than Intermediates or Veterans
to participate in hunting or fishing. Because Newcomers averaged over 40 years old, it is
unlikely that many of them will become hunters or anglers. Extensive research demonstrates
that few individuals begin hunting or fishing after adolescence. Thus, survey results suggest
that, over time, hunting and fishing may become less common on the Forest. This trend
would be consistent with state and national data that show gradual declines in the numbers of
hunting and fishing licenses sold. In contrast to participation patterns for hunting and

25
fishing, Newcomers were more likely that Intermediates or Veterans to participate in
snowmobiling and horseback riding, suggesting that demand for these activities on the Forest
may continue to grow in the future.
The implications of other participation differences are less clear. Newcomers were less
likely than Intermediates or Veterans to visit the Forest for viewing scenery,
dayhiking/walking, wildlife watching, camping, picnicking, or swimming. These results
appear to be inconsistent with national trends that show growing participation in all these
activities. This apparent inconsistency cannot be resolved with the survey data, but several
explanations are possible. For example, it may be that participation trends in central
Pennsylvania do not match national trends. It is also possible that Newcomers participate in
these activities at other sites or have not yet learned of opportunities to participate in these
activities at BESF.
Differences in satisfaction and responses to general forest management issues among
Newcomers, Intermediates, and Veterans were small. All three subgroups reported high
levels of satisfaction with six Forest characteristics, but significant differences were found
for two characteristics. On one hand, Newcomers expressed the highest level of satisfaction
with opportunities to recreate without feeling crowded. On the other hand, Veterans
expressed the highest level of satisfaction with the ability to obtain information about the
area. These findings are consistent with other research. Newcomers are often most satisfied
with use levels because their frames of reference for the area do not include an earlier period
when visitation was lower. In contrast, Veterans are often most satisfied with the availability
of information because their experience level makes their need for information about the area
low. Given the overall high levels of satisfaction, these differences should not cause undue
concern, but monitoring satisfaction trends would be valuable. Over time, satisfaction with
use levels could remain high among new visitors but decrease among experienced visitors. A
trend of this type could indicate that experienced visitors would gradually be displaced or
“crowded out” of the area and replaced by new visitors with higher tolerance for user density,
leading to continually higher use levels.
Significant differences were found for only one general Forest management issue.
Although all three subgroups disagreed with the statement that the Forest should encourage
more timber harvesting, disagreement was significantly stronger among the Intermediates
26
than the Veterans. Because the difference was small and the scores of Newcomers did not
differ significantly from those of Intermediates or Veterans, no clear trend in user opinions is
indicated.
Recommendations for Future Survey Methods
This visitor survey was designed, in part, to test data collection methods for use in visitor
surveys of other Pennsylvania State Forests. For the survey, the Forest was divided into
eight zones, and data was collected from each zone in a stratified sampling procedure.
During the summer, early fall, and spring of the study year (June 1999 – June 2000), data
was collected with brief, on-site interviews conducted at stops along Forest roads and more
extensive mail-back questionnaires were distributed to individuals who completed on-site
interviews. During the early fall and winter, data was collected by placing survey packets
(cover letter, questionnaire and postage-paid return envelope, covered by a plastic bag) on
the windshields of visitors‟ vehicles.
Using a combination of on-site interviews and mail-back questionnaires, a higher
response rate (60% versus 20%) was achieved, allowing for more confidence about the
representativeness of the sample. However, this approach incurred high labor and
supervision costs associated with fielding interviewers at multiple sampling locations and
presented security concerns for interviewers left in the field without transportation. In
addition, the organizational demands of sustaining this approach for an extended period
placed a considerable burden on management staff, making consistent sampling and survey
administration difficult.
The second approach, placing survey packets on windshields, was less expensive and less
complex because a single driver could cover an extensive area. However, because of low
response rates, this approach raises questions about the representativeness of the sample. In
winter, both approaches were impossible to use on unplowed roads, but it was possible to
place survey packets on the windshields of vehicles parked at Forest access points along
plowed roads.
The advantages and disadvantages of these two approaches are typical when surveying
users of dispersed recreation areas like Pennsylvania‟s State Forests, which are characterized
by extensive, fragmented ownership patterns, multiple access points, and extreme variation in

27
the behavior of recreationists. For that reason, future visitor survey methods should be
evaluated in light of:
Physical characteristics (size, topography, road network, etc.) of the State Forest
being studied;
Seasonal differences in accessibility to the interior of the Forest;
Commuting distance for data collection personnel; and
Consistent, long-term availability of data collection personnel.
Each factor will influence the logistical and monetary cost of any visitor survey. In
considering methods for future surveys, it may be useful to evaluate the advantages and
disadvantages of one simple and one complex survey alternative.
Simple alternative. A simple survey method might use a brief, “self-mailer”
questionnaire (e.g., 5 8 inch card stock or 8½ 11 folding stock imprinted with return
postage) distributed by Forest staff during other, regular duties. These questionnaires could
be placed on vehicle windshields or handed to visitors at comparatively low cost. At the
same time, the number of parties in the area could be estimated by tallying the number of
vehicles and/or parties seen. Party-size information from questionnaires and vehicle/party
tallies could be extrapolated into estimates of overall visitor numbers.
Advantages of this approach include simplicity and low cost. Disadvantages include the
high probability of obtaining biased estimates and the inability to calculate meaningful
margins of error. The brief questionnaires might enhance response rates, but rates likely
would remain low because no personal contact would exist with questionnaires left on
vehicles and significant delays would often occur between the time questionnaires were
distributed and the time they were dropped into the return mail. Those who returned
questionnaires would constitute a self-selected sample unlikely to represent Forest users
accurately. More importantly, any survey method relying on Forest staff to distribute
questionnaire during other, regular duties is likely to return biased estimates. Ranger patrols,
for example, focus by necessity on high-use and problem areas. If rangers were to distribute
questionnaires during patrols, high-use and problem areas would be over-sampled and other
areas would be under-sampled. Furthermore, distributing questionnaires in this manner
would fail to constitute a probability sample, providing no basis for estimating meaningful
margins of error.

28
Complex alternative. A complex survey method would use a stratified random sample of
data collection zones and periods, similar to the approach used on BESF. During each data
collection period, survey staff would, to the extent possible, contact visitors and complete
questionnaires using interviews. Questionnaires could be simple or complex, depending on
the quantity of information desired. (If very complex information was desired, names and
addresses of survey participants could be recorded for follow-up mail contact.) As
interviews were conducted, the number of parties in the area could be estimated by tallying
the number of vehicles and/or parties seen. Party-size information from interviews and
vehicle/party tallies could be extrapolated into estimates of overall visitor numbers.
Disadvantages of this approach include high logistical and monetary costs. Advantages
include the high probability of obtaining unbiased estimates and an ability to calculate
meaningful margins of error. Compared to a simpler method, this approach improves the
probability of obtaining unbiased estimates in two ways. First, the use of field interviews
improves response rates (reducing self-selection bias) and improves the accuracy of
participant responses by eliminating recall bias as a source of error. Second, stratified
random sampling schemes avoid sampling biases associated with distributing questionnaires
in the course of regular staff duties and enable surveyors to subdivide a study area into
relatively homogenous sub-units or strata, reducing the margin of error in overall use
estimates. Finally, stratified random sampling produces a probability sample and provides a
basis for estimating meaningful margins of error.
Employing a complex survey design of the type described here would be costly, just as it
was on BESF. The advantage is in the trustworthiness of the results. In future surveys, some
savings could be realized by eliminating the follow-up, mail-back portion of the survey.
However, this should not be done by collecting more information during on-site interviews
because longer interviews would reduce response rates. Any decision about using a follow-
up, mail-back questionnaire should be based on evaluating the importance of collecting
complex information requiring thoughtful responses. For example, if it were important to
collection information about participant attitudes toward contentious and/or complex Forest
management issues, using a follow-up, mail-back questionnaire would be particularly
valuable.

29
Vehicle and trail counters. As part of this study, the practicality of using vehicle and trail
counters was also tested.1 Neither device was used successfully. Making secure installations
was difficult for counters of both types. Each needed to be protected from passersby but, at
the same time, be positioned to record their passing. In addition counters needed to be
accessible to survey staff. Furthermore, because they were battery-powered, both types of
counters required frequent maintenance, particularly during cold weather. Trail counters not
only needed frequent maintenance, but also failed to make reliable counts during periods of
high winds. The need for frequent maintenance combined with the 40-70 mile commute
from State College to various counter sites quickly exhausted the resources allocated to the
use of counters. With easier access to the counter sites and additional time spent on
installation, calibration, and maintenance, it might have been possible to use both types of
counters successfully. In order to use counters of any type successfully in another study, it is
likely counters would need to be installed permanently or semi-permanently and read and
maintained by personnel who do not need to travel long distances.
Ultimately, decisions about visitor use survey methods in other Pennsylvania State
Forests should be tailored to individual forests. For example, a sampling method might be
highly successful in one Forest but less successful in another because of differences in road
and trail networks or use patterns. Similarly, all of Pennsylvania‟s State Forests share some
important management issues, but other important issues may vary between Forests.
Literature Cited
Scheaffer, R.L., Mendenhall, W., & Ott, L. (1990). Elementary Survey Sampling (4th
Ed.). Boston, MA: PWS-Kent.
1 The vehicle counter tested was the Nu-Metrics brand Hi-Star NC-47. The trail counter tested was the
TrailMaster brand TW1500 active infrared counter.

30
Appendix A: On-site and Follow-up Questionnaires

41
Appendix B: Sampling Strategy

42
Sampling Strategy for the Study
The sampling frame was all five-hour time periods of the study year crossed with the eight
geographic zones created for the study. Thus, the sample units were a series of five-hour
daylight time periods within individual zones. Measurements taken on each sample unit
included date, site(s), number of parties, and party-size(s). To obtain a representative sample,
the five-hour time periods included in the sample were varied between weekdays and weekend
days, as well as among mornings, afternoons, and evenings.
The study year was also stratified seasonally in order to capture seasonal variation in
activities and use levels and facilitate computing seasonal use estimates in addition to an
overall annual estimate. Four unequal-length seasonal strata were designed in consultation
with the Forest‟s District Manager and staff. Beginning and ending dates for each seasonal
stratum were selected to correspond with important annual changes in Forest use patterns. The
summer stratum (mid-June through Labor Day) corresponded to school vacation time and to
moderately active fishing. The fall season (September through mid-December) began with the
return of the school year and extended through fall color and all the major hunting seasons.
The winter season (mid-December through March) was selected to approximate the traditional
snow season. Finally, the spring season (April through mid-June) corresponded with peak
fishing activity.

43
Appendix C: Results Tables

44
Table 1. Sampling dates and locations by season and method
Season
Sampling method a
Date
Day of
week Zone and Location b
Questionnaires
distributed
Summer 6/12/99 Sat. 5 Poe Paddy Picnic Area 8
Onsite/mail-back 6/18/99 Fri. 2 McCall Dam & White Deer Creek Rds. 13
3 Hairy John & Winklebleck Rd. 5
6/19/99 Sat. 4 Cherry Run & Weikert Rds. 17
6 Snyder-Middleswarth Picnic Area 5
7 Shade Mt. Rd. 1
6/24/99 Thurs. 4 Ingleby 4
6/25/99 Fri. 5 Poe Paddy Picnic Area 9
4 Cherry Run & Weikert Rds. 2
6/26/99 Sat. 3 Jones Mt. Rd. 9
3 Hairy John & Winklebleck Rd. 27
7/2/99 Fri. 3 Hairy John & Winklebleck Rd. 11
4 Cherry Run & Weikert Rds. 9
7/3/99 Sat. 3 Hairy John & Winklebleck Rd. 17
5 Poe Paddy Picnic Area 12
8 Greens Valley Rd. 1
7/4/99 Sun. 5 Bear Gap Picnic Area 13
7/5/99 Mon. 2 McCall Dam & White Deer Creek Rds. 46
7/9/99 Fri. 4 Cherry Run & Weikert Rds. 14
7/10/99 Sat. 3 Jones Mt. Rd. 5
7/16/99 Fri. 2 Mile Run Rd. 4
1 Rainsares Rd. 1
7/17/99 Sat. 7 Shade Mt. Rd. 2
5 Bear Gap Picnic Area 5
6 Snyder-Middleswarth Picnic Area 3
7/18/99 Sun. 5 Poe Paddy Picnic Area 17
3 Hairy John & Winklebleck Rd. 6
8 Greens Valley Rd. 9
7/24/99 Sat. 3 Hairy John & Winklebleck Rd. 9
4 Cherry Run & Weikert Rds. 7
7/25/99 Sun. 2 McCall Dam & White Deer Creek Rds. 12
3 Jones Mt. Rd. 7
7/29/99 Thurs. 5 Bear Gap Picnic Area 2
6 Snyder-Middleswarth Picnic Area 1
5 Poe Paddy Picnic Area 2
7/30/99 Fri. 5 Sand Mt. Rd. & S-M Pike 45
8 Green Valley Rd. 1
5 Poe Paddy Picnic Area 1
8/7/99 Sat. 3 Hairy John & Winklebleck Rd. 9
8/13/99 Fri. 5 Sand Mt. Rd. & S-M Pike 23
8/14/99 Sat. 2 McCall Dam & White Deer Creek Rds. 11
8/21/99 Sat. 2 Mile Run Rd. 9
8/22/99 Sun. 2 Mile Run Rd. 10
8/27/99 Fri. 5 Poe Paddy Picnic Area 2
8/29/99 Sun. 5 Sand Mt. Rd. & S-M Pike 40
Table continued next page.
a During summer, early fall, and spring, surveyors stationed at key intersections or roads counted passing
vehicles and asked drivers to stop and complete a brief questionnaire, as well as a longer, mail-back
questionnaire. During late fall and winter, surveyors drove major roads and distributed questionnaire packets
on the windshields of parked vehicles.
b Zones: 1 Rainsares; 2 South Eastville; 3 Hickernell North; 4 Hickernell South; 5 New Lancaster Valley; 6
Troxelville; 7 Shade Mountain; 8 Green‟s Valley.

45
Table 1 continued. Sampling dates and locations by season and method
Season
Sampling method a
Date
Day of
week Zone and Location b
Questionnaires
distributed
Fall 9/12/99 Sun. 3 Hairy John & Winklebleck Rd. 25
Onsite/mail-back 9/19/99 Sun. 2 Mile Run Rd. 25
9/26/99 Sun. 2 Mile Run Rd. 25
10/3/99 c
Sun. 8 Green Valley Rd. 16
10/17/99 c
Sun. 8 Green Valley Rd. 21
10/24/99 c
Sun. 2 Mile Run Rd. 18
Windshield 10/2/99 Sat. 1 3
2 10
3 8
4 0
5 1
6 26
10/3/99 Sun. 3 2
5 17
10/8/99 Fri. 7 7
10/16/99 Sat. 4 11
5 13
6 19
10/30/99 Sat. 2 8
3 7
4 4
5 0
6 29
7 23
11/13/99 Sat. 1 4
2 7
3 11
11/22/99 Mon. 1 13
2 9
3 13
4 14
5 34
6 78
7 12
8 17
11/29/99 Mon. 2 14
3 33
4 22
5 35
6 129
12/11/99 Sat. 2 9
3 26
4 3
Table continued next page.
a During summer, early fall, and spring, surveyors stationed at key intersections or roads counted passing
vehicles and asked drivers to stop and complete a brief questionnaire, as well as a longer, mail-back
questionnaire. During late fall and winter, surveyors drove along major roads and distributed questionnaire
packets on the windshields of parked vehicles.
b Zones: 1 Rainsares; 2 South Eastville; 3 Hickernell North; 4 Hickernell South; 5 New Lancaster Valley; 6
Troxelville; 7 Shade Mountain; 8 Green‟s Valley.
c Onsite/mail-back survey results collected during October were not used to compute use estimates because
these results overlapped with windshield method results collected during the same month.

46
Table 1 continued. Sampling dates and locations by season and method
Season
Sampling method a
Date
Day of
week Zone and Location b
Questionnaires
distributed
Winter 12/18/99 Sat. 2 5
Windshield 3 1
4 2
12/27/99 Mon. 2 3
3 3
1/9/00 Sun. 3 1
6 4
1/16/00 Sun. 3 1
5 3
8 1
1/22/00 Sat. 2 28
5 6
1/29/00 Sat. 2 48
3 23
4 4
5 8
2/5/00 Sat. 2 91
3 5
4 10
2/13/00 Sun. 2 1
3 3
2/19/00 Sat. 2 27
3 11
2/26/00 Sat. 4 3
5 1
3/16/00 Thurs. 4 2
3/19/00 Sun. 2 1
4/1/00 Sun. 3 2
4/1/00 6 7
Table continued next page.
a During summer, early fall, and spring, surveyors stationed at key intersections or roads counted passing
vehicles and asked drivers to stop and complete a brief questionnaire, as well as a longer, mail-back
questionnaire. During late fall and winter, surveyors drove major roads and distributed questionnaire packets
on the windshields of parked vehicles.
On winter sampling days when Forest roads were inaccessible because of snow, questionnaire packets were
placed on vehicles at the following locations: Zone 2 – Mile Run Snowmobile Parking Lot, R.B. Winter
Snowmobile Parking Lot, Route 192 Parking Lot; Zone 3 – Hairy Johns Picnic Area Parking Lot; Zone 4 –
Weikert Parking Lot, District Office Parking Lot; Zone 5 – Jack's Mt. Snowmobile Parking Lot.
b Zones: 1 Rainsares; 2 South Eastville; 3 Hickernell North; 4 Hickernell South; 5 New Lancaster Valley; 6
Troxelville; 7 Shade Mountain; 8 Green‟s Valley.

47
Table 1 continued. Sampling dates and locations by season and method
Season
Sampling method a
Date
Day of
week Zone and Location b
Questionnaires
distributed
Spring 4/1/00 Sun. 5 Poe Paddy Picnic Area 5
Onsite/mail-back 4/15/00 Sun. 2 Mile Run Rd. 28
4/17/99 Tue. 5 Poe Paddy Picnic Area 8
4/30/00 Mon. 2 Mile Run Rd. 6
2 McCall Dam & White Deer Creek Rds. 1
5 Poe Paddy Picnic Area 5
5/6/00 Sun. 5 Poe Paddy Picnic Area 6
5/14/00 Mon. 6 Snyder-Middleswarth Picnic Area 6
4 Cherry Run & Weikert Rds. 1
5/15/00 Tue. 5 Poe Paddy Picnic Area 9
5/27/00 Sun. 4 Cherry Run & Weikert Rds. 2
4 Ingleby 2
5/28/00 Mon. 2 Mile Run Rd. 9
5/29/00 Tue. 2 Mile Run Rd. 8
2 McCall Dam & White Deer Creek Rds. 2
5 Poe Paddy Picnic Area 6
a During summer, early fall, and spring, surveyors stationed at key intersections or roads counted passing
vehicles and asked drivers to stop and complete a brief questionnaire, as well as a longer, mail-back
questionnaire. During late fall and winter, surveyors drove major roads and distributed questionnaire packets
on the windshields of parked vehicles.
b Zones: 1 Rainsares; 2 South Eastville; 3 Hickernell North; 4 Hickernell South; 5 New Lancaster Valley; 6
Troxelville; 7 Shade Mountain; 8 Green‟s Valley.

48
Table 2. Number of interviews completed by sampling zone and season
Number of On-site Interviews
Zones/Sites Summer Fall Spring Overall
Zone 1
Rainsares 1 -- -- 1
Zone 2
Mile Run Rd 23 65 50 138
McCall Dam Rd 82 -- 3 85
Zone 3
Hairy John & Winklebleck Rd 84 25 -- 109
Jones & Brandon Rd 21 -- -- 21
Zone 4
Cherry Run & Weikert Rds 56 -- 3 59
Ingleby 2 -- 4 6
Zone 5
Sand Mt. Rd 109 -- -- 109
Poe Paddy Picnic Area 45 -- 39 84
Bear Gap Picnic Area & Treaster
Valley Rd
20
--
-- 20
Zone 6
Snyder-Middleswarth Picnic Area 9 -- 6 15
Zone 7
Shade Mt. Rd 3 -- -- 3
Zone 8
Greens Valley Rd 11 37 -- 48
Total 466 127 105 698
Note. A total of 92 windshield-survey responses were received in fall, compared to 135 in winter.

49
Table 3. Profile of respondents
Percentage (n)
Summer Fall Winter Spring Overall
Gender
Males 81% (195) 93% (136) 91% (124) 83% (33) 86% (548)
Females 19% (47) 8% (11) 9% (12) 18% (7) 14% (77)
Age
Under 19 0% (0) 1% (1) 1% (1) 0% (0) 1% (2)
19-30 12% (29) 11% (15) 17% (23) 7% (3) 12% (70)
31-40 21% (51) 21% (31) 27% (37) 34% (14) 24% (133)
41-50 24% (59) 33% (49) 25% (34) 20% (8) 27% (150)
51-60 17% (40) 15% (22) 14% (19) 24% (10) 16% (91)
61and older 26% (63) 20% (29) 167% (23) 15% (6) 21% (121)
Education
High school or less 45% (109) 55% (81) 56% (77) 44% (18) 50% (285)
Technical school or college 35% (85) 35% (52) 34% (46) 34% (14) 35% (197)
Graduate School 20% (48) 10% (14) 10% (14) 22% (9) 15% (85)
Income
Under $ 19,999 10% (22) 7% (9) 7% (9) 17% (6) 9% (46)
$20,000-$29,999 19% (41) 19% (25) 16% (20) 3% (1) 17% (87)
$30,000-$49,999 33% (72) 30% (39) 25% (31) 17% (6) 29% (148)
$50,000-$79,999 21% (46) 29% (38) 40% (49) 37% (13) 29% (146)
$80,000+ 17% (36) 15% (19) 12% (15) 26% (9) 16% (79)
Current residence
Farm, ranch, rural area 35% (45) 43% (61) 41% (56) 45% (18) 40% (180)
Small town (under 10,000) 40% (51) 41% (58) 45% (61) 30% (12) 41% (182)
Large town (10,000-49,999) 14% (18) 11% (15) 7% (9) 15% (6) 11% (48)
Small/Large/Metropolitan area 12% (15) 6% (8) 7% (10) 10% (4) 8% (37)
Children living in household
0 child 60% (146) 54% (79) 61% (84) 49% (20) 58% (329)
1 child 12% (28) 21% (27) 15% (21) 10% (4) 14% (80)
2 children 18% (43) 14% (20) 15%(21) 22% (9) 16% (93)
3 or more 10% (25) 14% (21) 8% (11) 20% (8) 12% (65)
Ethnicity
Caucasian or White 98% (238) 100%(147) 100% (136) 100% (40) 99% (561)
Others 2% (4) 0% (0) 0% (0) 0% (0) 1% (4)
Note. Percentages may not add up to 100% due to rounding.

50
Table 4. Visitation patterns by season
Percentage (n)
Visitor Behavior Summer Fall Winter Spring Overall
First time visitor
Yes 10% (48) 1% (3) 5% (7) 7% (8) 7% (66)
No 90% (416) 99% (214) 95% (129) 93% (104) 93% (863)
If no, no. of visits last 12 mos.
0-5 visits 39% (161) 40% (81) 40% (51) 55% (57) 41% (350)
6-10 visits 18% (73) 17% (37) 26% (33) 14% (15) 18% (158)
11-15 visits 9% (38) 9% (20) 141% (14) 10% (10) 10% (82)
16-20 visits 4% (15) 7% (15) 5% (7) 8% (8) 5% (45)
Over 20 visits 31% (129) 29% (61) 19% (24) 14% (14) 26% (228)
If no, primary season of use
Spring 9% (35) 9% (18) 4% (5) 66% (63) 15% (121)
Summer 57% (218) 18% (38) 13% (16) 19% (18) 36% (290)
Fall 31% (118) 63% (131) 24% (29) 10% (10) 36% (288)
Winter 2% (9) 11% (22) 59% (72) 5% (5) 13% (108)
Composition of visitor group
Alone 22% (102) 23% (49) 10% (13) 13% (15) 19% (179)
Family 50% (231) 44% (96) 26% (34) 38% (43) 44% (404 )
Friends 15% (70) 23% (50) 29% (38) 28% (31) 21% (189)
Family & friends 13% (61) 10% (22) 35% (46) 21% (23) 17% (152)
Miles traveled to Forest
Under 26 41% (190) 53% (115) 37% (51) 43% (48) 43% (404)
26-50 22% (104) 21% (45) 29% (40) 20% (22) 23% (211)
51-100 16% (76) 12% (27) 17% (23) 15% (17) 15% (143)
Over 100 21% (96) 14% (31) 17% (23) 22% (25) 19% (175)
Type of Trip
Day trip 62% (287) 78% (169) 77% (106) 56% (63) 67% (625)
Under 1 hour 36% (103) 23% (39) 0% (0) 14% (9) 24% (151)
1-2 hours 24% (68) 15% (25) 2% (2) 11% (7) 16% (102)
3-5 hours 32% (91) 27% (46) 20% (21) 21% (13) 27% (171)
Over 6 hours 9% (25) 35% (59) 78% (83) 54% (34) 32% (201)
Overnight 38% (179) 23% (50) 23% (30) 44% (49) 33% (308)
1 nights 19% (34) 18% (9) 13% (4) 2% (1) 16% (48)
2 nights 35% (62) 41% (20) 20% (6) 35% (17) 34% (105)
3-5 nights 31% (55) 29% (14) 52% (16) 27% (13) 32% (98)
Over 5 nights 16% (28) 12% (6) 16% (5) 37% (18) 19% (57)
Locations of overnight stays
Forest sites 47% (83) 92% (11) -- 67% (32) 53% (126)
Designated campsite 41% (35) 9% (1) -- 64% (21) 45% (57)
Leased cabin site 58% (48) 91% (10) -- 33% (11) 54% (69)
Backcountry site 1% (1) -- -- 3% (1) 2% (2)
Outside Forest 53% (94) 8% (1) -- 33% (16) 47% (111)
Private campground 28% (26) 0% (0) -- 29% (4) 28% (30)
Bed & Breakfast 7% (7) 0% (0) -- 0% (0) 6% (7)
State park 38% (35) 100% (1) -- 36% (5) 38% (41)
Private cabin 27% (25) 0% (0) -- 36% (5) 28% (30)
Note. Percentages may not add up to 100% due to rounding.

51
Table 5. Primary activity on day of interview, by season
Fishing 18% (57) 6% (11) 2% (3) 79% (84) 21% (155)
Hunting 0% (0) 41% (79) 31% (42) 0% (0) 16% (121)
Viewing scenery 18% (56) 16% (30) 2% (2) 1% (1) 12% (89)
Camping 18% (56) 6% (11) 0% (0) 8% (8) 10% (75)
Snowmobiling 0% (0) 0% (0) 55% (74) 0% (0) 10% (74)
Walking/day hiking 13% (43) 5% (10) 7% (9) 8% (8) 9% (70)
Wildlife watching/feeding 13% (42) 12% (23) 1% (1) 0% (0) 9% (66)
Picnicking 12% (37) 4% (8) 0% (0) 4% (4) 7% (49)
Mountain biking 3% (15) 2% (3) 1% (1) 1% (1) 3% (20)
Backpacking 2% (7) 1% (1) 1% (1) 0% (0) 1% (9)
Horseback riding 0% (0) 5% (9) 0% (0) 0% (0) 1% (9)
Driving ORV 2% (6) 1% (4) 0% (0) 1% (1) 1% (8)
Collecting stone 0% (0) 2% (3) 0% (0) 0% (0) 1% (3)
Cutting firewood 0% (0) 1% (2) 0% (0) 0% (0) 1% (2)
Photography 1% (1) 0% (0) 0% (0) 0% (0) 1% (1)
Cross-country skiing 0% (0) 0% (0) 1% (1) 0% (0) 1% (1)
Jogging/trail running 0% (0) 1% (1) 0% (0) 0% (0) 1% (1)
Sledding 0% (0) 0% (0) 1% (1) 0% (0) 1% (1)
Note. Percentages may not add up to 100% due to rounding. Individuals were asked what they anticipated doing
during their visit to BESF. What they actually did during their visit may vary.
Percentage (n)
Summer Fall Winter Spring Overall

52
Table 6. Activity participation rates on day of interview, by season
Viewing scenery 34% (159) 51% (111) 53% (72) 19% (21) 39% (363)
Fishing 18% (84) 8% (18) 12% (16) 82% (92) 23% (210)
Walking/day hiking 23% (109) 18% (39) 21% (29) 24% (27) 22% (204)
Wildlife watching/feeding 17% (81) 27% (59) 17% (23) 12% (13) 19% (176)
Hunting 0% (0) 39% (85) 35% (48) 0% (0) 14% (133)
Camping 18% (82) 6% (14) 7% (10) 17% (19) 13% (125)
Picnicking 11% (51) 7% (16) 8% (11) 15% (17) 10% (95)
Snowmobiling 0% (0) 1% (1) 58% (79) 0% (0) 8% (80)
Driving through 13% (61) 2% (4) 0% (0) 0% (0) 7% (65)
Swimming/tubing 9% (43) 0% (0) 0% (0) 1% (1) 5% (44)
Cabin maintenance 5% (24) 8% (17) 0% (0) 0% (0) 4% (41)
Mountain biking 5% (23) 4% (8) 4% (5) 4% (4) 4% (40)
Photography 2% (7) 4% (8) 10% (14) 6% (7) 4% (36)
Rest & Relax 5% (23) 0% (0) 0% (0) 0% (0) 3% (25)
Backpacking 2% (9) 2% (5) 4% (5) 2% (2) 2% (21)
Cutting firewood 0% (0) 4% (8) 1% (2) 3% (3) 1% (13)
Visiting Friend/Relatives 3% (12) 0% (0) 0% (0) 0% (0) 1% (12)
Horseback riding 0% (0) 5% (10) 1% (2) 0% (0) 1% (12)
Driving ORV 1% (6) 1% (2) 1% (2) 1% (1) 1% (11)
Collecting stone 1% (5) 1% (2) 1% (2) 0% (0) 1% (9)
Target shooting 1% (1) 1% (2) 0% (0) 1% (1) 1% (4)
Scout activity 0% (0) 1% (3) 0% (0) 1% (1) 1% (4)
Berry picking 1% (4) 0% (0) 0% (0) 0% (0) 1% (4)
Jogging/trail running 0% (0) 1% (1) 1% (2) 0% (0) 1% (3)
Family reunion 1% (3) 0% (0) 0% (0) 0% (0) 1% (3)
Using restroom 1% (2) 0% (0) 0% (0) 0% (0) 1% (2)
Cross-country skiing 0% (0) 0% (0) 1% (1) 0% (0) 1% (1)
Sledding 0% (0) 0% (0) 1% (1) 0% (0) 1% (1)
Get water 1% (1) 0% (0) 0% (0) 0% (0) 1% (1)
Collecting insects 1% (1) 0% (0) 0% (0) 0% (0) 1% (1)
Caving 1% (1) 0% (0) 0% (0) 0% (0) 1% (1)
Activity
Percentage (n)
Summer Fall Winter Spring Overall

53
Table 7. Anticipated location of activity participation by season
Percentage (n)
Area used Summer Fall Winter Spring Overall
White Deer Creek/McCall Dam 25% (98) 34% (53) 13% (10) 63% (5) 25% (166)
Poe Paddy 33% (134) 2% (3) 3% (2) 13% (1) 21% (140)
Greens Valley 3% (11) 25% (39) 1% (1) 0% (0) 8% (51)
Hickernell North 7% (27) 13% (21) 0% (0) 0% (0) 7% (48)
Hairy John Picnic Area 4% (15) 10% (16) 16% (12) 0% (0) 7% (43)
R.B. Winter 1% (2) 1% (1) 38% (29) 0% (0) 5% (32)
Penn‟s Creek 5% (21) 1% (1) 3% (2) 13% (1) 4% (25)
Cherry Run 6% (23) 0% (0) 0% (0) 0% (0) 4% (23)
Jones Mt Rd. 5% (19) 0% (0) 1% (1) 0% (0) 3% (20)
Bear Gap 4% (15) 1% (1) 3% (2) 0% (0) 3% (18)
Sand Mt. 4% (15) 1% (2) 0% (0) 0% (0) 3% (17)
Treaster Valley 1% (1) 6% (9) 4% (3) 0% (0) 2% (13)
Mid-State Trail 2% (7) 0% (0) 4% (3) 0% (0) 2% (10)
Poe Valley 0% (0) 2% (3) 6% (5) 13% (1) 1% (9)
Tall Timbers 2% (7) 1% (1) 0% (0) 0% (0) 1% (8)
Shade Mt. 1% (3) 3% (4) 0% (0) 0% (0) !% (7)
Pine Creek Rd. 1% (4) 1% (1) 1% (1) 0% (0) 1% (6)
Strong Improvement 0% (0) 1% (1) 6% (5) 0% (0) 1% (6)
Stony Run 1% (2) 2% (3) 1% (1) 0% (0) 1% (6)
Penn‟s View 1% (5) 0% (0) 0% (0) 0% (0) 1% (5)
Note. Only locations mentioned 5 or more times overall are listed.

54
Table 8. Location of favorite place in Bald Eagle State Forest
Category Count
(n = 441) Percent Wording of response
No specific place 39 8.8%
I ride the roads. So I ride “thru” – No specific location.
No favorite place.
Bald Eagle State Park.
New in area. Only visited one site.
Parks.
Sightseeing.
Bald Eagle State Park – has clean showers and bathrooms. Larger camping area,
nice lake.
All state parks.
No favorite in particular, we just drive to see wildlife and relax.
I have no favorite place.
I like all of Bald Eagle State Forest. I like being in the outdoors without
convenience of home.
Don‟t have one.
I just like riding the roads.
No particular spot like all equal.
I don‟t have a favorite place. I like it all.
Anywhere.
I do not have an available place.
The great outdoors in general.
No favorite.
I visit a few different areas of the state forest. All are equally good.
No favorite spot.
Did not visit enough to see it all.
Any part away from the highway.
Anywhere alone.
I don‟t really have a favorite place.
Have no favorite place.
It‟s all good.
Don‟t really have a favorite. We enjoy area.
All snow scenery.
All areas.
I don't have a favorite place.
All over.
I like the whole park, it's a great place to snowmobile.
All the same.
Parks.
I like them all.
I don't have a favorite - I enjoy the whole trail.
I don't have just one favorite place, but they are all former logging roads in
western Union County.
Prefer not to identify anything.
The forest/woods (in general) 7 1.6%
The woods.
Anywhere in the woods.
The entire forest is wonderful.
The whole forest.
Woodland all around, no noise, very little traffic.
I like to ride through the woods and see snow.
The woods.
Table continued next page.
*Response counted in more than one category; underlined words counted in this category.

55
Table 8 continued. Location of favorite place in the Bald Eagle State Forest
Category Count
(n = 441) Percent Wording of response
The trails (in general) 7 1.6%
The trails and the dam and the waterfalls.
Natural trails.
I trail horse ride and like the trails (not road) through the forest.
Trails for horse back riding.
Anywhere along Mid-state trail.
Hiking.
All snowmobile trails.
Mountains (in general) 7 1.6%
I really love the mountains, so it is hard for me to just select one area, but, I like
the Bear Run Rd. to Bear Gap areas the best.
Mountains.
Around mountains.
Anywhere in the mountains.
A large rock that I set on being able to observe some hollows that come up to the
top of the mountain.
The look out spots when snowmobiling.
Some of the vistas (the views are awesome).
Picnic areas (in general) 5 1.1%
Swimming and picnic area.
Picnic area close to swimming.
We liked picnic area.
Picnic area.
Picnic area.
Creeks (in general) 4 .9%
The stream.
Along the creek.
Along the streams.
Creeks.
A lake (unspecified) 2 .5%
The lake area – it‟s very pretty and offers things to do as a family.
The lake.
Camping areas (in general) 1 .2%
Camping area – in season fishing in stream.
Penns Creek, Poe Paddy, Cherry Run, Railroad Tunnel Area 58 13.2%
Penns Creek.
Area above PFBC, Penns Creek at Cherry Run.
You can look down and see Penns Creek along the trail.
Rock slide/face on south side of Penns Creek on White Mountain, near
intersection of Cherry Run and Penns Creek.
Harleton/Penns Creek area.
Penns Creek fly stretch.
I fish Penns Creek from 19 bridge to 1.5 miles into the no kill area.
Penns Creek from cabin to Cherry Run.
Penns Creek.
Any where along Penns Creek and from towns and cabin.
Penns Creek.
Penn‟s creek below Poe Paddy bridge.
Penns Creek.
Penns Creek and Poe Valley.
Next to Penns Creek 1 ½ mile west on Cherry Row Rd.
Table continued next page.
*Response counted in more than one category; underlined words counted in this category.

56
Table 8 continued. Location of favorite place in the Bald Eagle State Forest
Category Count
(n = 441) Percent Wording of response
Penns Creek, Poe Paddy, Cherry Run, Railroad Tunnel Area, continued
Penns Creek between Weikert and Cherry Run.
Penns Creek from Swift Run to Eagles Bay.
Cherry Run Road – fishing Penns Creek.*
Penns Creek cold water fishery.
The area from Poe Paddy and Harry Johns, especially along Penns Creek.
Poe Paddy camping area. There is approximately 7-10 miles of great fly fishing
and miles of bicycle riding without traffic.
Poe Paddy.
Poe Paddy Park and lake.
Poe Paddy state park – camping, fishing meeting nice people – lovely place.
Poe Paddy area – trestle and tunnel.
Poe Paddy.
Poe Paddy Park.
Poe Paddy.
Trail end camp – Poe Paddy Area.
Trail end cabin.
Poe Paddy area.
Little Poe park.
Poe Paddy area.
Cherry Run Road – fishing Penns Creek.*
Cherry Run.
PA fish commission project. North of Cherry Run.
The catch and release area near Cherry Run a few miles west of Weikert.
In the Cherry Run area, along old Mingle Road.
Cherry Run.
Cherry Run area.
On Cherry Run Road.
Love the Cherry Run area – always seeing wildlife and not many people.
Cherry Run to the tunnel.
Cherry Row Road to Paddy mountain.
Cherry Run, Poe Paddy area.
Cherry Run hollow. Bear Run hollow.
Cherry Run area.
The old railroad tunnel/cave.
I enjoyed the tunnel and the surrounding area.
On the trestle bridge just before the railroad tunnel I love water.
I love walking through the tunnel at Poe Paddy and walking along that trail. It is
so tranquil, beautiful, natural.
The old rail road tunnel.
I guess the railroad tunnel.
Paddy Mt tunnel area.
Train tunnel at Poe Paddy.
All around Poe Paddy Park and the tunnel.
Railroad tunnel at Poe Paddy.
Tunnel (railroad tracks) west of Cherry Run.
Table continued next page.
*Response counted in more than one category; underlined words counted in this category.

57
Table 8 continued. Location of favorite place in the Bald Eagle State Forest
Category Count
(n = 441) Percent Wording of response
Poe Valley Area 34 7.7%
Poe and New Lancaster Valley. Great access and maintained trail.*
In general, the Poe Valley/High Valley area.
Poe Valley Park.
Poe Valley.
Poe Valley lake.
Poe Valley.
The Creek – Treaster Run. Poe Valley State Park.
Poe Valley state park picnic area.
Poe Valley.
The stream below the dam in Poe Valley.
Poe Valley State Park – quiet surrounding.
Overlook looking into Poe Valley.
Poe Valley.
Poe Valley camping area.
Poe Valley.
Poe Valley State Park.
Woods along Poe Creek.
Poe Valley dam.
Poe Valley State Park.
Lake at Poe Valley.
Poe Valley camp area.
I really like Poe Valley – plenty of parking, trails, nice lake.
Poe Valley.
Poe Valley.
Poe Valley State Park.
Area between Poe Valley and Poe Paddy. Poe Valley state park in the fall.
Poe Valley.
Poe Valley park.
Valley area.
Poe Valley area.
Poe Valley.
Poe Valley State Park.
Poe Valley is remote and sparsely inhabited.
Raymond B. Winter, Halfway Dam Area 27 6.1%
I liked Raymond B. Winter Lake
Raymond B. Winter State Park.
R B. Winter in Autumn, Summer…. The body of water makes it.
The R.B. Winter area.
R.B. Winter/half way dam area.
R.B. Winter State Park.
R.B. Winter beach.
The swimming area at R.B. Winter.
R.B. Winter.
R.B. Winters park.
R.B. Winter Park.
Raymond State Park.
Raymond B. Winters Park
Overlook close to R.B. Winters
R.B. Winter Park.
Table continued next page.
*Response counted in more than one category; underlined words counted in this category.

58
Table 8 continued. Location of favorite place in the Bald Eagle State Forest
Category Count
(n = 441) Percent Wording of response
Raymond B. Winter, Halfway Dam Area continued
Lake & campground - R.B. Winters Park.
R.B. Winters.
Lake at R.B. Winter.
R.B. Winter Park.
Halfway dam area.
Halfway dam.
Halfway dam.
Halfway dam.
Halfway Dam and everything.
Halfway Dam. Black Gap.*
Halfway Dam.
Overlook at Halfway Dam.
White Deer Creek/McCall Dam 26 5.9%
White Deer Creek camping site, they are close to water and fishing. White Deer Creek Rd. area and 5 Points area near Mile Run.
Along White Deer Creek.
White Deer Creek, fishing.
White Deer Creek and surrounding areas.
White Deer Creek.
White Deer Creek area.
White Deer Creek. Some of the more secluded areas.
White Deer Creek fly fishing areas.
White Deer Creek area.
White Deer Creek fishing hunting.
White Deer Creek.
White Deer Creek.
White Deer Creek Road
Upper area of White Deer Creek watershed.
White Deer Creek.
All along the White Deer Creek.
Eastville to Hairy Johns & Whitedeer Creeks areas.*
McCall Dam picnic area.
McCalls Dam – secluded and pleasant for picnic, etc.
My favorite area is on top of a mountain very close to McCall Dam Picnic Area.
McCall Dam area.
McCall Dam area. White deer Creek road.
McCall Dam.
McCall area
McCall Dam picnic area.
Hairy Johns 13 2.9%
Eastville to Hairy Johns & Whitedeer Creeks areas.*
The area from Poe Paddy and Harry Johns, especially along Penns Creek.
Harry Johns.
Harry Johns.
Harry Johns picnic area – quiet, peaceful, not crowded like state park.
Harry John‟s Park – Winkelbleck Mtn – vista.
The Harry Johns area.
Harry John State Park.
Harry Johns area trail.
Harry Johns stone pavilion.
Table continued next page.
*Response counted in more than one category; underlined words counted in this category.

59
Table 8 continued. Location of favorite place in the Bald Eagle State Forest
Category Count
(n = 441) Percent Wording of response
Hairy Johns continued
Harry John‟s
Harry John State Park.
Hairy John's.
Tall Timbers 10 2.3%
Tall Timbers/Snyder – Middleswarth state park.*
Tall Timbers –Snyder Middleswarth pristine.*
Tall timbers.
Tall Timbers Trail.
Tall Timbers.
Tall Timbers.
Tall Timbers.
Tall Timbers.
Tall Timbers and Snyder Middleswarth.*
Snyder-Middleswarth and Tall Timbers*
Pine Creek 8 1.8%
Pine Creek road.
Headwaters of Pine Creek.
Pine Creek area.
Pine Creek.
Pine Creek valley.
Pine Creek.
I go all over the Pine Creek area.
Pine Creek road.
Hook Natural Area 8 1.8%
In The Hook – near stream, large moss covered rocks, large trees.
Hooks natural area.
Hook natural area – Union County.
Hook natural area.
The Hook natural area.
Natural Hook Area.
Hook Natural Area.
Hook Natural Area.
Treaster Run 7 1.6%
View‟s into Triester and New Lancaster Valley.
Treaster run, fly fishing for stream raised native trout. Good water, not over
fished, should be made 100% catch and release.
Treaster Valley area.
Mostly visit for hunting or work in Treaster valley.
Treaster valley.
Treaster Valley.
Treaster Valley along the creek and the Bear Gap area.
Snyder/Middleswarth 7 1.6%
Tall Timbers and Snyder Middleswarth.*
Snyder-Middleswarth and Tall Timbers*
Tall Timbers/Snyder – Middleswarth state park.*
Tall Timbers –Snyder Middleswarth pristine.*
I have 3 favorite places depending on what I‟m doing Snyder-Middleswarth for
hiking, Spruce Run for fishing, Bald Eagle Park for picnicking.
A beautiful lookout near Snyder – Middleswarth park.
Middleswarth Park – I like the camp site with the water fall.
Table continued next page.
*Response counted in more than one category; underlined words counted in this category.

60
Table 8 continued. Location of favorite place in the Bald Eagle State Forest
Category Count
(n = 441) Percent Wording of response
Green Valley Area 7 1.6%
It is a certain area in Greens Valley where I always see and harvest deer every
year. I visit the entire Greens Valley area but most often visit the western end
of the valley.
Greens Valley.
Only ever been to Greens Valley area to get firewood. Don‟t have any favorite
place.
Upper green valley about 3 miles into dirt road at top of Centre Hall Mountain.
At the end of Greens Valley Road by stream where bridge is out.
Green Valley area.
Greens Valley.
Winklebleck 5 1.1%
Winklebleck cabin is located in the center of the forest. It is just fun to get away
from the busy life.
Winklebleck over look.
Winklebleck.
Winkelblecks view.
The view of Winklebleck.
Bear Gap 5 1.1%
Bear Gap area.
Bear Gap camp – Hartley Township, Union County.
Bear Gap camp.
Bear Gap.
Bear Mountain.
Black Gap 5 1.1%
Black Gap vista.
Black Gap road.
Burkholder cabin in Black Gap area.
Black Gap lookout.
Halfway Dam. Black Gap.*
Shade Mountain 4 .9%
Shade Mountain on south side of Bear Spring.
Shade Mountain. Between fire tower and Targap trail.
Top of Shade Mountain. Along the dirt road that runs between Rts. 235 and 104.
Shade Mountain.
Buffalo Mountain 4 .9%
The end of Buffalo Mountain where Cooper Mill Rd. and Spruce Run Rd. meet.
There is a gate near Cooper Mill Rd. The road goes over the top of Buffalo Mt.
On top of Buffalo.
Buffalo Mountain.
Weikert Run 4 .9%
Weikert run road, Devil‟s Elbow area, White Mt. (which was a favorite camping
area for me but you can't camp there).
Weikert run area, with the stream, mountain.
Weikert.
Weikert.
Penn‟s View 4 .9%
Penns view.
Penns View.
Penns view, it is so pretty.
Penns View overlook.
Table continued next page.
*Response counted in more than one category; underlined words counted in this category.

61
Table 8 continued. Location of favorite place in the Bald Eagle State Forest
Category Count
(n = 441) Percent Wording of response
Paddy Mountain 3 .7%
Paddy mountain.
Camp site 25 on Paddy Mountain.
On top of Paddy Mountain where I camp, also, down from camp at the creek.
New Lancaster Valley 3 .7%
New Lancaster Valley.
Camp in New Lancaster Valley.
Poe and New Lancaster Valley. Great access and maintained trail.*
Other 97 22.0%
Strong‟s Mountain area.
Molasses Gap.
Jack‟s Mountain - Kettle Gap.
Fishing Rapid Run.
Sand Mountain road.
Knob Ridge in Mifflin County.
Deep Waters.
Rattle Hole.
Buffalo flats, very serene
Stony Run road.
Henster Valley, because of its unique mountain stream and solitude setting.
Always cool even in August.
The area in the Cinder Pile Spring.
Wolf swamp.
Group Oak Trail area.
Scenic over looks.
Fish area.
Front Round Top (Kleckner Spring Cabin).
The fishing area.
RT 144 – clear water and clean air.
Peaceful, not crowded, quiet.
I like the different quiet places were a person can meditate with god and with the
forest.
All ATV trails.
Nittany Mountain around „Mile Run‟ exit of Rt 80. It‟s a familiar area.
Little Pine State Park.
The south part – it‟s high with a look out.
Between Loganton and 192, small but nice to have family gathering.
Climbing Rock, hunting spots close to Climbing Rock.
The Wildcat Trail – it has diverse terrain and a lot of moss.
Fly – special regulation stretch.
There is a spot directly above – about 60 feet – overlook the blue rock pool that
affords an excellent view of White Mountain. At this point, I switch my
favorite place to my summer home, as the questions are more appropriate to
it.
Upstream from cabin: No road.
Mid State Trail from Shower Road at switch back to R.B. Winter Park.
North side of mountain sloping terrain – tree covered.
Sharpback Mountain.
Rt. 192 up through R.B. Winter State Park to Rt. 880.
Table continued next page.
*Response counted in more than one category; underlined words counted in this category.

62
Table 8 continued. Location of favorite place in the Bald Eagle State Forest
Category Count
(n = 441) Percent Wording of response
Other continued
Scenic over look area where observers can see many miles and lake and many
mountains.
Dirt roads.
Enjoy the Hemlock and Pine forest.
Look out tower.
Along the creek, where the beavers have built dams, one can just marvel at nature's
handiwork and beauty.
Back the East Kettle Road, Snyder County.
The overlooks were a beautiful view.
Broken Anvil camp at cross roads of Stoney Road and Shale Pit.
It is a trail that leads to a bridge after walking approximately 45 minutes, also the
powerline hike.
Cooper Mill overlook.
The powerline lookout on the east end of Jones Mountain.
Fire tower.
The amphitheater – is where my family pitched our tent every summer, all summer
– 1950 thru 1964. Beautiful place.
The falls in the campground area a few years ago before the damage of the
flooding and hard winter.
Pavilion – far end.
A valley off of Buffalo Flats Mtn., along the creek.
A rock out cropping on the south face of a mountain.
My favorite place is along a stream in a valley between two mountains.
Delayed harvest fishing area.
White Mountain. I have enjoyed hunting on White Mountain since the time I was
in college at Penn State. It reminds me of the forest on the west coast where
they set aside land in wilderness preserves.
Milroy Vista.
1st pavilion off highway.
The mountains around Woodward.
Sugar Valley east of Carroh.
Green Township.
Cow Bell Trail.
I have not been through the other paths. I have been ride on the south road of I-80
immediately after exiting.
Little Pine.
Lick Run Road.
Area between Greens‟ Valley Road and Hecla Park.
The bottom by the creek with the missing bridge.
South side of Jones mountain near Mifflinburg reservoir. (Hook Natural Area)
Hunting areas.
Hunting spot.
Area I can hike into easily, but be away from most crowds.
Behind the Laurlton center at the reserve.
Sunny side of the Hutt trail area.
It's a place that seems to follow you around...sometimes even after you get back
home
I really like the clear cut that is on Red Gobble Rd.
About 5 miles from Rt. 322. Good bear hunting area.
(where) Hook, Middle Ridge and Jones Mountain come together.
Table continued next page.
*Response counted in more than one category; underlined words counted in this category.

63
Table 8 continued. Location of favorite place in the Bald Eagle State Forest
Category Count
(n = 441) Percent Wording of response
Other continued
The swamp area off summit trail, it‟s beautiful there.
Student trail.
Jack‟s Mountain east of Troxelville. I like to hunt and hike in mountains with farm
fields below.
I like to hike in Hunter Road area.
Little zoo and hunting camp.
A ravine.
Strong‟s improvement.
Almost to the top at Indian trail.
Potter Township.
South of Jones Mountain.
Roaring Creek Valley road.
Buckhorn hunting camp.
Mountain road.
Main parking lot near Forest Hills.
North side of Little Round Top Mountain.
The less traveled trail. The camping area. The trail around the park & dam.
Perhaps the roads open to snowmobiling.
Overlook views with picnic area.
It's along the White Deer Pike and it is very pleasant and quiet with a lot of nature.
Cooper Mill Road trails in firetower vicinity.
I like the fishing between the two bridges on Weikert Run.
Personal cabin/camp 41 9.3%
My camp on Pine Creek Road.
My cabin.
Hunting camp.
Cabin in Bald Eagle State Forest.
Private cabin Winklebleck Road).
Cabin.
Our cabin in the Livonia area.
I personally enjoy the fly fishing area near our winter cabin.
Buck Ridge hunting cabin.
Cabin.
Cabin on leased state forest land on Round Top above Harry Johns park.
Cabin on Pine Creek Rd. in Center Co. on state land.
Our cabin on Cherry Run Rd.
My cabin site.
Private camp within 11 miles of Poe Valley State Park, isolated and usually quiet.
Camp.
Camp – Treaster valley.
Hunting camp in New Lancaster valley, Poe Valley, Walker Lake.
I have a cabin within 2 miles of the dam – it is beautiful scenery and lots of
animals.
Our camp.
The hunting camp.
Buckhorn hunting camp.
Lease C-7-3 at cabin running gap road.
Hunting camp.
My camp.
My camp.
Table continued next page.
*Response counted in more than one category; underlined words counted in this category.

64
Table 8 continued. Location of favorite place in the Bald Eagle State Forest
Category Count
(n = 441) Percent Wording of response
Personal cabin/camp continued
My cabin area. Green Valley Road.
My cabin about ¼ along Lime Run exit.
Our hunting camp.
Little zoo hunting camp.
Camp site.
Our deer camp borders the forest.
The gap that the cabin sits in.
Spending time at our cabin.
Our hunting camp-Haines Twp.- now without water due to new regulations.
My camp.
Our cabin.
Reading Gun Club along Treaster Valley Road.
Our camp.
Hunting cabin.
My cabin in Negro Hollow.
*Response counted in more than one category; underlined words counted in this category.

65
Table 9. What makes this place more special to you than other places that might be similar to it?
Category Count
(n = 472) Percent Wording of response
Recreation experiences - conduciveness (including accessibility) 100 21.2%
Good hunting, good trail access, nice pines.*
Fishing is not bad and not too many people.*
The deer hunting is good and it's not shoulder to shoulder with hunters.*
Good mt. biking, privacy.*
I have been very successful in hunting deer and turkey in this area. Also there is a
beautiful view of Treaster Valley from this location.*
Various terrain, easy access. Numbers of trails.*
Access, pets allowed.*
It seems to be less populated with camps and there are a lot of 4 wheel (or
mountain bike) roads, which allow me to enjoy nature at its best.*
Access in all areas of park and natural beauty.*
The quality of the trout fishing, and the natural beauty of the area.*
The kids (my daughters 7 to 12) love the sand and cool water. I love the scenery
and geology of the area.*
Probably Penns Creek.*
Wild trout stream.*
I love fishing and this creek in this beautiful forest.*
Its great fishing, the scenery, and the creek itself.*
The stream & related scenery is beautiful. The stream is accessible here but not
too accessible.*
Limited access, few people, wildlife, fishing.*
Its natural beauty, quiet, peaceful, serenity and road. Trout fishing.*
Rustic – out of the way camping area.*
Fishing and quiet.*
Good fishing, good hunting, and no crowds.*
It is a quiet place and trails are good.*
It is not overly crowded - it is clean and taken care of - the trails are open.*
Not crowded - adequate length - not too hard nor too easy and it is a good trail.*
It‟s secluded and really scenic and the fishing is good.*
My favorite place to camp has many good qualities – flat, shady, private. No
other place like it in the forest.*
I‟ve walked it a lot and collected insects there.*
I have been visiting this area since 1968 and always enjoyed trout fishing in Penns
Creek.*
We used this place for over 40 years for picnic.*
The recreation and it‟s remained the same for many, many years. It is not
commercialized.*
I hunt there often with my sons and son in law. I‟ve taken several deer there.*
Lot of family memory and fun hunting. I took 7 bucks over the year.*
It was the first place I started hunting deer, the most productive AT.*
Fishing is good. Close to home.*
Stream and good hunting.
Great camping in the camp areas.
Prolific hiking, trout population.
We hunt there.
The beach and lots of picnic tables.
Camping availability.
Swimming, picnic, fishing, and hunting.
Availability of fishing and water.
Table continued next page.
*Response counted in more than one category; underlined words counted in this category.

66
Table 9 continued. What makes this place more special to you than other places that might be similar to
it?
Category Count
(n = 472) Percent Wording of response
Recreation experiences - conduciveness (including accessibility) continued
Availability of parking, availability and wood for camping and cooking, always
has visitors.
Like to hunt there.
My children ride tubes ground the loop of Penn‟s Creek – I could catch big brown
trout and bicycle for miles.
Fishing, well kept, felt welcome.
Very good fishing.
Can ride bikes or roller blade for kids – paved roads for walking.
Excellent fishing.
Good trout fishing.
Fishing.
It provided an excellent food supply for deer and turkeys.
Excellent turkey hunting.
It was a nice place to go to relax and still be in the water nice deep hole for
swimming.
Swimming.
Fishing.
Has everything my family needs to have a fun vacation.
Fishing is always good.
Fly fishing.
Good fishing and camping.
Good fishing.
Quality of wild trout fishing.
The beach is a larger one than Whipples Dam and Greenwood Furnace.
The Sound or White Deer Creek. Running through the mountain.
The fishing in creeks.
Nice for horseback riding.
Camping and hiking.
The fishing.
You can go tubing on the Penn‟s Creek, start and finish in the same spot.
Mountain biking on roads and trails closed to cars
It used to be good hunting but decreased app. 60% from 1987.
Just a nice place, good fishing and hunting.
Game trails, successful past trips.
The beach area – all the recent improvements.
Good hunting.
The game found there.
Being able to have a place to camp.
My hunting area for big game.
Handicap toilet facility.
Easy trail, nice to walk and hunt.
I do 90 % of my hunting there.
To be able to hunt.
I have hunted white-tail deer for the past 53 years.
Shot another buck in same area.
I like hunting in this area.
Access.
Availability of activities.
Table continued next page.
*Response counted in more than one category; underlined words counted in this category.

67
Table 9 continued. What makes this place more special to you than other places that might be similar to
it?
Category Count
(n = 472) Percent Wording of response
Recreation experiences - conduciveness (including accessibility) continued
The almost perfect place to culminate a deer drive.
Walking.
Usually can find deer here.
Access to hiking.
Parking for snowmobilers & bathrooms.
The groomed trails when proper snowfall.
Nice wide road. Good visibility for riding.
My main purpose there is for snowmobiling.
Nice picnic area.
Great hunting.
It is where I hunt and I enjoy it.
Because it contributes to my favorite winter sport.
Great trails by creeks.
Privacy/quiet/relaxing/uncrowded 91 19.3%
It‟s peaceful and beautiful.*
Limited access, and wildlife.*
Fairly remote and can usually see wildlife.*
My year of being in quiet area – it is home.*
Close to home, easy to get to, not crowded.*
Close, uncrowded.*
Not too much traffic and past our camp.*
It doesn‟t take long to get away from civilization.*
It seems to be less populated with camps and there are a lot of 4 wheel (or
mountain bike) roads, which allow me to enjoy nature at its best.*
Rustic – out of the way camping area.*
Fishing and quiet.*
Good fishing, good hunting, and no crowds.*
It is a quiet place and trails are good.*
It is not overly crowded - it is clean and taken care of - the trails are open.*
Not crowded - adequate length - not too hard nor too easy and it is a good trail.*
Peaceful and great scenery.*
It‟s secluded and really scenic and the fishing is good.*
My favorite place to camp has many good qualities – flat, shady, private. No
other place like it in the forest.*
Walking areas make it more private.
It‟s back off from the road and is more private.
Quiet.
Privacy, quietness.
The piece of mind you get coming here.
It is very quiet and me and the family go there a lot.
Relax.
Relaxing.
Not a whole lot of noise and loudness.
Peace and relax able to think.
Remoteness.
Solitude.
Isolation – location.
It‟s by itself, not close to roads.
Table continued next page.
*Response counted in more than one category; underlined words counted in this category.

68
Table 9 continued. What makes this place more special to you than other places that might be similar to
it?
Category Count
(n = 472) Percent Wording of response
Privacy/quiet/relaxing/uncrowded continued
Peaceful, beautiful, restful.
Solitude.
Not crowded.
It is very peaceful.
Less crowded.
No phone, no TV, and little traffic.
It is just a relaxing place to be.
It is very peaceful.
Quiet – peaceful.
Not a lot of traffic, no paved roads, few houses.
Serenity.
Seclusion.
Not too many other people.
Privacy and peaceful.
Away from busy area.
Secluded.
Because it is far enough off the trails to provide solitude.
Quiet and not crowded.
Quiet peaceful atmosphere.
Quiet and tranquility – a place to walk and sit in peace.
Solitude.
It is back in the forest and you can walk on trail and not find a crowd of people.
Out of the way place to get to.
Peaceful and quiet.
Remoteness and uncluttered.
It is secluded – not very much traffic.
Solitude.
The out of the way and restful place it has.
Quiet and peaceful.
Solitude.
Extreme solitude.
Peaceful, clean, relaxing.
It‟s just always been a good relaxing area for me.
Walking to get back into it.
Not many people.
Remoteness.
Seclusion.
No camps.
Vast open space and few hunters or hikers.
Just getting away from so called civilization.
Not as developed, but it‟s getting there.
The remoteness and the structure of the landscape.
It‟s out of society, free from all people.
Not so crowded.
I can easily get off the road and walk away from the world for a while.
Quiet mother nature.*
The obscurity of the trail and its changes by nature such as wind and snow
storms.*
Table continued next page.
*Response counted in more than one category; underlined words counted in this category.

69
Table 9 continued. What makes this place more special to you than other places that might be similar to
it?
Category Count
(n = 472) Percent Wording of response
Privacy/quiet/relaxing/uncrowded continued
Quiet and large trees.*
The stream, seclusion, accessibility, mixed woods, the trail overlooks.*
Long stretch of relatively isolated trail, relatively flat, very green and
overgrowth.*
Limited access, few people, wildlife, fishing.*
Its natural beauty, quiet, peaceful, serenity and road. Trout fishing.*
Beautiful scenery – Peacefulness.*
The view is great but not crowded like other vistas.*
Fishing is not bad and not too many people.*
The deer hunting is good and it's not shoulder to shoulder with hunters.*
Good mt. biking, privacy.*
Since I live along Thomas Dam Road, they are all near home; usually I see no
other person; I do see wildlife and great scenery.*
A dying man showed me this spot. I hardly ever see a soul even if there are 10
cars‟ parked there.*
Past connection/memories/tradition/familiarity 68 14.4%
I know the area very well. Wildlife.*
A dying man showed me this spot. I hardly ever see a soul even if there are 10
cars‟ parked there.*
It‟s special because I have a lot of fond memories at the cabin and I enjoy being
there with my wife and friends.*
Spending time with friends fishing. A lot of good memories.*
It‟s close to home. I don‟t have to travel far to show my children where we had
fun when we were kids. We did not need TV.*
Most familiar and close to home.*
I‟ve walked it a lot and collected insects there.*
I have been visiting this area since 1968 and always enjoyed trout fishing in Penns
Creek.*
We used this place for over 40 years for picnic.*
The recreation and it‟s remained the same for many, many years. It is not
commercialized.*
I hunt there often with my sons and son in law. I‟ve taken several deer there.*
Lot of family memory and fun hunting. I took 7 bucks over the year.*
It was the first place I started hunting deer, the most productive AT.*
My dad had it since I was small and now I own it.
The good times.
It was the first place my father took me to the mountains.
Started with dad since 1947.
The first camping area my husband and I were ever camping at years ago.
My kids grew up there in the summers while I had the concession.
30 years.
My family grew up in the area. It‟s where I learned to hunt and fish. My relatives
logged and were firemen on the logging trails.
Grew up visiting these woods.
I‟ve been going to there since 1969 and the area in general since about 1950.
In an area I grew up in.
Personally it‟s all new memories for me.
Traveled it when I was a kid, now it is blocked off except for hunting season.
Table continued next page.
*Response counted in more than one category; underlined words counted in this category.

70
Table 9 continued. What makes this place more special to you than other places that might be similar to
it?
Category Count
(n = 472) Percent Wording of response
Past connection/memories/tradition/familiarity continued
Childhood family gatherings.
As a young boy, my uncle used to belong to a cabin in this area and he always
took time to take me hunting here, also fishing in Penns Creek.
Come here as a kid.
Memories with my grandma.
This place is my favorite spot all year, especially in the fall and hunting season.
Have been going to this spot since 1959.
55 years of being with friends and relatives.
I belong to it.
Because my parents and grandparents camp there.
I would come there as a child.
Familiarity.
Camped here for years.
Camped there with family as a small child.
Familiarity. Parents used to bring us there while growing up.
Past memories – dating/fishing.
Because it is a place I grew up with.
I‟ve been going there for 14 years to hunt.
I grew up in the area.
Have been going all my life.
That has been in my family for so many years.
I am familiar with it.
I have been there for years, I feel at home there.
Always hunted with pap – so it‟s extra special.
Place where my pappy hunted.
I‟ve been coming here for about 44-45 years. Started coming up here with my
grandfather
I know and hunted the area for over 20 years.
Our camp has a history going back to the early 1900‟s (1903). The history is
primary.
27 years of hunting/hiking memories.
Was built by my grandfather, father and friends.
This place is special to me because of the relationship forged over the years with
the area.
Our kids loved Poe Valley Park in the 70s.
Been going there for years.
My friends and neighbors started to come here in 1994 and camped in tents for 2
weeks during deer season.
It‟s something that we belong to.
I know the movement of the deer through this area.
Childhood memories.
I've been coming since I was a small child.
Years of being there.
A lot of memories.
Snyder – Middleswarth – I grew up around there also I like to see the big
hemlocks and the stream (swift run).*
I have lived in the area my whole life and can count on it not being developed and
its natural beauty destroyed.*
Table continued next page.
*Response counted in more than one category; underlined words counted in this category.
71
Table 9 continued. What makes this place more special to you than other places that might be similar to
it?
Category Count
(n = 472) Percent Wording of response
Past connection/memories/tradition/familiarity continued
My year of being in quiet area – it is home.*
Its access is easy and we know the area pretty well.*
Natural quality 59 12.5%
Quiet mother nature.*
The obscurity of the trail and its changes by nature such as wind and snow
storms.*
Quiet and large trees.*
The stream, seclusion, accessibility, mixed woods, the trail overlooks.*
Long stretch of relatively isolated trail, relatively flat, very green and
overgrowth.*
Limited access, few people, wildlife, fishing.*
Its natural beauty, quiet, peaceful, serenity and road. Trout fishing.*
Snyder – Middleswarth – I grew up around there also I like to see the big
hemlocks and the stream (Swift Run).*
I have lived in the area my whole life and can count on it not being developed and
its natural beauty destroyed.*
Close to the camp I belong to, lots of different covers and trees.*
Access in all areas of park and natural beauty.*
The quality of the trout fishing, and the natural beauty of the area.*
The kids (my daughters 7 to 12) love the sand and cool water. I love the scenery
and geology of the area.*
Probably Penns Creek.*
Wild trout stream.*
I love fishing and this creek in this beautiful forest.*
Its great fishing, the scenery, and the creek itself.*
The stream & related scenery is beautiful. The stream is accessible here but not
too accessible.*
The stream, history, and etc.*
Scenery is great and many trails to explore.*
It‟s scenic.
It is very close to nature, no houses, good fishing.
My son and I observed two eagles while fishing and the next day returned with
rest of family and saw huge black snake (6-7 feet).
The waters flowing and birds singing.
Very mountainous, cheers.
Not commercial.
Undeveloped.
It has an early prehistoric area.
Scenery and water volume in Penns Creek make for outstanding trout fishing.
Beauty.
Its natural beauty.
Beautiful secluded trout stream.
Fall foliage.
Penns is a classic example of a trout stream in the Appalachians. It has an
abundance of wild trout.
It‟s so natural.
It is a wilderness area. I like there that they haven‟t scarred the mountain with
man made things (excessive trails, camp sites, litter, etc).
Table continued next page.
*Response counted in more than one category; underlined words counted in this category.

72
Table 9 continued. What makes this place more special to you than other places that might be similar to
it?
Category Count
(n = 472) Percent Wording of response
Natural quality continued
Somewhat wild, not developed.
Turkeys, deer and squirrels.
I‟ve been successful at seeing plenty of deer, grouse, and turkeys in this area.
I have seen deer, bear, and even seen about 10 porcupines in one area.
Woodland all around.
The timber.
A small meadow with a mountain stream, where mountains reach for the sky.
Deer crossings.
Have saw deer, turkey, and bear.
The forest area.
The trees.
Beauty, natural, healthy stream, and trout.
The woods and snow.
Stream, snow covered trees.
Mixed field & forested areas through which the stream flows.
Wildlife is more prevalent here.
We walk this road in fall and winter and have seen bear, turkey and many kinds of
wildlife.
I know the area very well. Wildlife.*
Good hunting, good trail access, nice pines.*
Since I live along Thomas Dam Road, they are all near home; usually I see no
other person; I do see wildlife and great scenery.*
It‟s peaceful and beautiful.*
Limited, access, and wildlife.*
Fairly remote and can usually see wildlife.*
Proximity/convenience 52 11.0%
Since I live along Thomas Dam Road, they are all near home; usually I see no
other person; I do see wildlife and great scenery.*
Its access is easy and we know the area pretty well.*
Close to home, very clean and nice people.
Fishing is good. Close to home.*
Distance from State College and its unfamiliarity (from my perspective).*
Close to home
Location.
Nice place and close to home.
It‟s closer to my friend‟s camp.
Close to home.
Convenience –easy access from highway.
Close to where we live.
Direct route to where I have to go.
Close to where we stay when in the area.
Close to our hunting cabin.
Way to my cabin so I go through it a lot.
Travel distance to it.
Close to home.
First place I stopped at.
Easy to get to end of the road, close to my home.
Within reasonable distance from home.
Table continued next page.
*Response counted in more than one category; underlined words counted in this category.

73
Table 9 continued. What makes this place more special to you than other places that might be similar to
it?
Category Count
(n = 472) Percent Wording of response
Proximity/convenience continued
Where it is close to home.
Most convenient.
Nearness to our home.
Easy to access.
Accessibility. Own a cabin in Poe Valley.
It‟s a lot closer home.
I‟m from the area.
Nearby.
Close to home.
Our hunting camp is in this area.
Location-close to home.
Close to home.
Closer to home.
Closer than most places.
Location
Close to home.
Close to camp.
Mileage to get there.
Close to home.
It's close to home.
Close to home & it's within driving of home. I can tell how snow is there.
Close to home.
Close to home.
Close to the camp I belong to, lots of different covers and trees.*
Close to home, easy to get to, not crowded.*
Close, uncrowded.*
Not too much traffic and past our camp.*
It doesn‟t take long to get away from civilization.*
It‟s close to home. I don‟t have to travel far to show my children where we had
fun when we were kids. We did not need TV.*
Most familiar and close to home.*
View and can be walked to.*
Views/scenery 23 4.9%
Scenery.
Peaceful and great scenery.*
It‟s secluded and really scenic and the fishing is good.*
Beautiful scenery – Peacefulness.*
The view is great but not crowded like other vistas.*
View and can be walked to.*
The view.
Awesome view of steep valley.
The view.
View.
The view.
The view of the moon and stars in night. The view of South toward Harrisburg in
day.
Great viewing of forest.
A beautiful view.
Table continued next page.
*Response counted in more than one category; underlined words counted in this category.
74
Table 9 continued. What makes this place more special to you than other places that might be similar to
it?
Category Count
(n = 472) Percent Wording of response
Views/scenery continued
The view.
It affords an opportunity to see a large area of forest surrounding valley and farms.
Ever changing views.
Scenery.
Our camp - beautiful scenery.
It has a great view.
View.
The view.
I have been very successful in hunting deer and turkey in this area. Also there is a
beautiful view of Treaster Valley from this location.*
Own a camp/cabin 21 4.4%
Not too much traffic and past our camp.*
My family has a hunting cabin there.*
I own/lease it and the only people that ever come. There is good friends, family,
or invited guests.*
Belong to hunting camp.*
I belong to the Cinder Pile Spring Camp.*
Hunting camp – great members.*
Member of hunting camp since 1947.*
Hunting camp is located in this area.
Own a cabin.
Our cabin located there.
We own.
My cabin is there.
Own a cabin.
Have a cabin there.
Our cabin.
Our hunting cabin.
Our cabin.
Our cabin.
Our hunting cabin.
Our camp.
Own property.
Preference & expectation for encounters with prim. & sec. reference groups 13 2.7%
My family has a hunting cabin there.*
I own/lease it and the only people that ever come. There is good friends, family,
or invited guests.*
Belong to hunting camp.*
I belong to the Cinder Pile Spring Camp.*
Hunting camp – great members.*
Member of hunting camp since 1947.*
The other members.
All my friends come here.
I am a member of an organized camp with good friends.
I made a second family up here with the fellows I hunt with.
Spending time with family.
It‟s special because I have a lot of fond memories at the cabin and I enjoy being
there with my wife and friends.*
Spending time with friends fishing. A lot of good memories.*
Table continued next page.
*Response counted in more than one category; underlined words counted in this category.
75
Table 9 continued. What makes this place more special to you than other places that might be similar to
it?
Category Count
(n = 472) Percent Wording of response
Variety 10 2.1%
It‟s my home away from home. Bald Eagle S.F. is special because there is so
much variety: Hemlock Hollows, Oak Ridge Tops, Rocky areas, Mt. Laurel,
steep Mt. Sides, streams….
Variety for hiking – pretty stream, tall trees, steep climb, ridge trail, airplane
history.
The ability to see so many mountains.
Variety of activities.
We can go to mountain and creek.
Lots of summer and winter activities.
Various terrain, easy access. Numbers of trails.*
Distance from State College and its unfamiliarity (from my perspective).*
The stream, history, and etc.*
Scenery is great and many trails to explore.*
Other 35 7.4%
I own it.
It is wonderful to have a place were you can go because the public owns the land.
The fact that it‟s in original condition.
Location.
Poe Paddy is a wonderful place to experience.
I like the mountain.
Can see landmarks, etc. that are seen by us daily.
It‟s the only one we‟ve been to.
It is unique.
N/A.
Location.
It‟s unique.
Now used for Sunday church.
Can‟t answer, undecided.
Luxuries and comforts are limited.
The history behind the tunnel.
The cabin.
None.
Nice tree.
Nothing.
Rattlesnakes.
Terrain.
Feels like home.
Only visited one small area.
Permission to be there anytime.
Location of leased cabin site.
Cabin.
Penns Creek.
No roads for motorized vehicles.
Penns Creek.
Neat and clean.
Penn's Creek.
Nice place.
Area in general.
Table continued next page.
*Response counted in more than one category; underlined words counted in this category.

76
Table 9 continued. What makes this place more special to you than other places that might be similar to
it?
Category Count
(n = 472) Percent Wording of response
Other continued
Access, pets allowed.*
The location and unique setting in the mountain.
*Response counted in more than one category; underlined words counted in this category.

77
Table 10. If you could ask managers to keep one thing the same about this favorite place, what would that
be?
Category Count
(n = 334) Percent Wording of response
Natural/wilderness qualities 73 21.8%
I think this is a continuing answer, maybe a few more out houses for public use,
keep it looking natural and we thank them for their hard work.*
Limited access –by nature of few roads, keep it as wild and natural as possible.*
Accessibility to the view.*
The remoteness, accessibility to the Hook.*
Undictated landscape –wilderness –high quality.
Keep the trees and stuff just add more eating area and not so close together.
The unspoiled beauty of the area.
Keep natural beauty.
The scenery, keep the area natural.
Closeness of nature.
Natural appearance.
Keep it as natural as possible.
Visibility of deer.
Remoteness and natural areas.
The natural areas should never be changed to make things “comfortable”, but
existing places should never be an "eye sore".
Quiet and clean.
I liked the beauty and the solitude of where I visited.
Maintain pollution free Cherry Run.
It is not overly developed, i.e., it‟s not mulched and landscaped, so it‟s a very
natural setting.
Undeveloped nature –very little picnic or playground areas.
Protect the water quality.
Maintain its natural environment.
Trees.
Don‟t hurt the tree.
Keep the trees and creeks.
Limit the build up – keep it a wilderness and open to everyone.
Forest.
The setting.
Preserve the forest.
Maintain rustic environment.
Seclusion.
Let nature manage it.
The seclusion.
The beach and peaceful atmosphere.
Natural and environment.
The stream.
Leave White Mountain in this wildness area program.
Keep it as natural as possible.
Serenity, beautiful Hemlocks, permitting pets and the horses that visited.
Quiet.
Leave it to mountain. No roads –signs- improvement a trail is a trail.
The beauty.
Peacefulness.
Preserve the natural beauty and stocking program.
Its beauty and tranquility.
Table continued next page.
*Response counted in more than one category; underlined words counted in this category.

78
Table 10 continued. If you could ask managers to keep one thing the same about this favorite place, what
would that be?
Category Count
(n = 334) Percent Wording of response
Natural/wilderness qualities continued
The trees.
Remote.
Water quality.
Keep it wild.
Keep it a beautiful place.
Do not cut areas that have huge trees located in them.
The beautiful way the cover and area is still very wild looking.
Do not change the view.
Keep the trees in the mountain area. Trimmed to avoid loss of the view.
No buildings – leave it wild just like it is.
No urban sprawl.
Protect the environment.
Keep it remote.
Keep it primitive.
Keep its natural beauty.
Keep it wild.
Natural.
Mountain the view.
Keep it as natural as it is.
Scenery.
The overall quality of the stream for fishing purpose.
Wild nature and clean water.
Keep access limited to preserve wildlife.
Keep natural, don't need "paved" parking or flush toilets or fancy buildings.
Stream.
Towering pines over the lake.
Not making the stream any more accessible than it is now. Having to walk
through the dense brush/laurel is part of the fishing experience
Availability of wildlife.
Change nothing/keep everything 61 18.3%
Not sure.
I don‟t know.
Keep area the way it is.
Leave it like it is.
No comment.
Leave it the same.
Leave it alone (except path maintenance).
Change nothing.
Nothing.
Keep it state land.
It‟s fine the way it is.
Nothing.
Everything.
Everything, not just one.
Keep up the good work.
Don‟t know.
Keep it the same.
N/A.
Table continued next page.
*Response counted in more than one category; underlined words counted in this category

79
Table 10 continued. If you could ask managers to keep one thing the same about this favorite place, what
would that be?
Category Count
(n = 334) Percent Wording of response
Change nothing/keep everything continued
Keep this pretty much the way they are.
N/A.
Everything is fine.
Everything, don‟t change it.
Don‟t change anything.
Nothing.
Not sure.
Not sure.
Seems to be run well as it is.
Can‟t think of anything.
Everything the same.
Leave it alone.
Everything.
Keep up the good work that they are doing and have been doing only improve on
it and expand it. I'm sure other good people will help them.
Everything.
Keep doing what you are doing.
The way it is now.
Not sure.
No change.
Nothing.
N/A.
Leave it the way it is.
Keeping as it is.
Keep it the way it is.
The way it is now except for none of cable at top.
Everything.
No more cabins
Never allow electricity to enter this area.
Leave it alone.
No more roads.
Don‟t change a thing.
Leave alone.
As is.
Nothing.
Stay out.
Let it be.
I think the people responsible for managing these areas are doing a great job.
Don‟t change anything.
N/A
Just the way it is.
Leave it alone.
Keep it as it is.
Don't change a thing.
Existing use allowances 60 18.0%
Creek‟s great fishing, just difficult - enough accessibility.*
Keep trails open and maintained.*
We love the new fire ring/grills.
Table continued next page.
*Response counted in more than one category; underlined words counted in this category.

80
Table 10 continued. If you could ask managers to keep one thing the same about this favorite place, what
would that be?
Category Count
(n = 334) Percent Wording of response
Existing use allowances continued
No ATV‟s.
No more houses or shelter built – keep it as it is.
No added buildings, limited timber harvest.
Keep it simple, don‟t add a lot of recreation items.
Keep it open to the public.
Keep it open for use.
Restricted by fishing area.
The area for picnic.
The fishing – the restrictions of ATV‟s – the uncrowded atmosphere.
Camp area.
Keep snowmobiles out.
Keep the new camp sites spaced far apart.
Don‟t allow snowmobiles and ATV‟s. Too noisy, damaging, and irresponsible
people.
Bridge for foot traffic only.
No showers, keep it rustic.
Don‟t commercialize the tubing area. I‟m sure those who have camps there
wouldn't appreciate super highways and long lines becoming a part of their
away time. It's nice to go down to Penns Creek without worrying about if
your hour is up or to bring your wallet because of the price of admission, etc.
To always keep lifeguarded waters
Keep a lot of roads 4x4 only – keep it promotion.
The tables.
Beach and picnic.
Keep trails designated.
The swimming beach.
The way the camps are set up.
Keep it open to public.
Open to the general public.
Continue the fine job of forest management.
Delayed harvest fishing.
Good fishing.
Leave it open to everyone to enjoy.
Keep it open to fishing.
Allowing everyone to use it.
Keep it open to horses.
To keep the amount of camps to a minimum.
Keep it open so everyone can enjoy it.
Don‟t allow any new camps to be built.
Never close it to hunting.
Hiking only. Don‟t join forces with the State Game Lands.
Continues to let us come to our camp on the leased ground.
The hiking trails.
Keep the fire place.
The number of camp sites.
No more camps in area.
Keep the trail open.
Keep 4 wheelers out. No motor vehicles.
Table continued next page.
*Response counted in more than one category; underlined words counted in this category.
81
Table 10 continued. If you could ask managers to keep one thing the same about this favorite place, what
would that be?
Category Count
(n = 334) Percent Wording of response
Existing use allowances continued
No more additional leased land cabins.
Keep the same amount of camps.
Keep it open.
Keep it open for snowmobiling.
Keep open for sleds.
Let snowmobiling continue.
Keep it open to snowmobiling.
Keep it available to the public.
Keep opening the gate for archery hunters.
Keep gate closed during spring and summer.
Leave gate closed during summer so 4-wheelers stay out so they don't ruin the
road.
Public & protected.
Maintain the current profile so it doesn't ever get over-used.
Existing maintenance practices 55 16.5%
Keep trails open and maintained.*
I think this is a continuing answer, maybe a few more out houses for public use,
keep it looking natural and we thank them for their hard work.*
The accessibility to get into it and the good maintenance.*
Keep up the good maintenance.
The way they maintain roads.
Keep the cabin in the good shape.
Keeping things clean
Keep on keeping it clean.
Clean like now, parking is good.
Keep maintenance the some.
Clean - not to litter.
Maintain trails.
Keep up the good work on road maintenance and parks (Poe valley is excellent)
but don't tell too many people.
Cleanliness.
Litter free.
Keep the dirt roads dirt – not black top.
Marking of trails –excellent roads.
To keep up the good roads which uses do repair, and to keep up the replacement
of the new trees for the new forest areas.
Clean bathrooms.
Litter – free area.
Cleanliness.
Don‟t pave the roads.
Keep it clean and roads maintained.
Keep the parks maintained.
The clean pavilions – clear paths.
Cleanliness, general upkeep.
Keep it free of garbage.
Keep it clean.
How clear the park is (its very clean).
Clean.
Table continued next page.
*Response counted in more than one category; underlined words counted in this category.

82
Table 10 continued. If you could ask managers to keep one thing the same about this favorite place, what
would that be?
Category Count
(n = 334) Percent Wording of response
Existing maintenance practices continued
Cleanness.
Keeping the road (good shape).
Roads repaired.
Cleanliness of it.
The condition of the roads.
Not cut too much timbers.
Clean outside of toilets.
Do not pave the roads into the park.
Keep it clean.
Roads.
Keep road in repair.
Do not clear cut timber.
Keep the road open end to the other.
Maintain great roads.
Keep roads and trails.
How clean this place is.
Keep as clean as possible.
Clearing parking lots, grooming of trails.
Easy access and maintained trails.
Keep the parking lot open & semi plowed.
Keep up the good job grooming the snow (when it arrives)
Keep trails & roads groomed.
Dirt roads only, no paved roads.
I think they do a great job maintaining the roads, it is a never-ending job.
Keep using the trail groomer like this year. The trails were kept in excellent
shape.
Accessibility/access 17 5.1%
Creek‟s great fishing, just difficult - enough accessibility.*
Accessibility to the view.*
The accessibility to get into it and the good maintenance.*
The remoteness, accessibility to the Hook.*
Keep roads open in winter months.
Maintain the easy access to the area.
The surrounding grounds, road leading to the cabin.
Keep it open to public.
The access to all the different areas.
Limit the amount of access, this eliminates excessive traffic.
Public access.
Access roads. Great job maintaining dirt road.
Access.
Access to and from it.
Do not add more roads.
Keep the area free and accessible to all.
Accessibility.
Open to public also keep trails open wide so it‟s easy walking.
Existing rules & regulations 8 2.4%
Catch and release rules.
Fishing restriction.
Table continued next page.
*Response counted in more than one category; underlined words counted in this category.

83
Table 10 continued. If you could ask managers to keep one thing the same about this favorite place, what
would that be?
Category Count
(n = 334) Percent Wording of response
Existing rules & regulations continued
Clean conditions including quiet times to rest, no alcohol.
Keep gates lock for hunting season.
A set of rules.
No motorized vehicles and no open fires.
Watch speeding snowmobiling at rest room area and give them a warning or fine.
The alcohol policy stricter.
Existing maintenance practices because it keeps other people out 6 1.8%
Limited access –by nature of few roads, keep it as wild and natural as possible.*
Limited access via motorized vehicle.
Do not increase access or allow more vehicles.
Limited access to stream and wild areas.
Don‟t improve access.
Patrol roads and check cabins for break-ins.
Quiet & peacefulness 1 .3%
The solitude.
Other 53 15.9%
I have no other complaints other than idiots who travel through at 50 miles plus.
Keep managers from having workers continually operate the graders and stone
rake when the forest roads are in good condition. When someone decides
the grader operator needs something to do to keep busy again. Next it rains -
mud and muddy water wash into the streams. Managers don't know what
happens in their district!
Be friendly to those who are not destroying the land. Remember that we all use
and pay for this land.
Frequent checks on visitors.
Allow rock built fire pits or larger metal fire pits with grills.
The old railings.
Restrict vehicles that leave roads –travel in the woods off the roads.
Layout of the area.
Restricting unauthorized camping.
Open roads and trails for all uses.
Freedom to bring my dog (he is small) off leash when no one is around (I strongly
disagree with PA leash law in county).
Let it be available for multiple use.
Trimming does enhance the view.
Everything.
No crowds.
No new bridges.
Do not open areas to vehicle travel. Restrict more areas for vehicle travel.
All areas around the cabin site.
The related (away from it all) feeling.
Isolating lack of development. The bad road and signs do contribute to this.
Preserve tunnel and bridge.
How it used to be a few years ago.
The lean-to‟s at Poe Paddy.
The friendly managers.
Railroad tunnel.
Limit access, development and promote hunting and fishing.
Table continued next page.
*Response counted in more than one category; underlined words counted in this category.

84
Table 10 continued. If you could ask managers to keep one thing the same about this favorite place, what
would that be?
Category Count
(n = 334) Percent Wording of response
Other continued
Their down home friendliness. Ranger stopped while we were introducing my
daughter to fishing and was most helpful and friendly, made her day (and
ours).
To be able to shoot at target range at cabin.
Increased trout stockings of Poe Lake and Poe Creek.
Everything but restrooms.
Private.
Leased land for recreational camps.
Keep big government and city-slickers out.
I would ask them not to make it more attractive to the public – example hiking,
trails, off road, or better road conditions.
I dislike trash that has been left behind by other people. This may be why
camping is no long permitted.
Rebuild bridge.
Quit clear cutting.
Improve stream for better fishing.
Its location.
Keep out.
Openness.
Allow lease cabins on State Game Land.
Quit timbering this area for a few years. I know periodically this has to be done.
Don‟t reduce its size.
Think about discontinuing snowmobiling.
Chase more bucks into the area.
Up-grade roads and road map.
No timbering.
Keep members.
Don‟t allow any form of degradation or pollution.
Snow year round.
Simplicity with buildings.
Don't take anything more away!
*Response counted in more than one category; underlined words counted in this category.
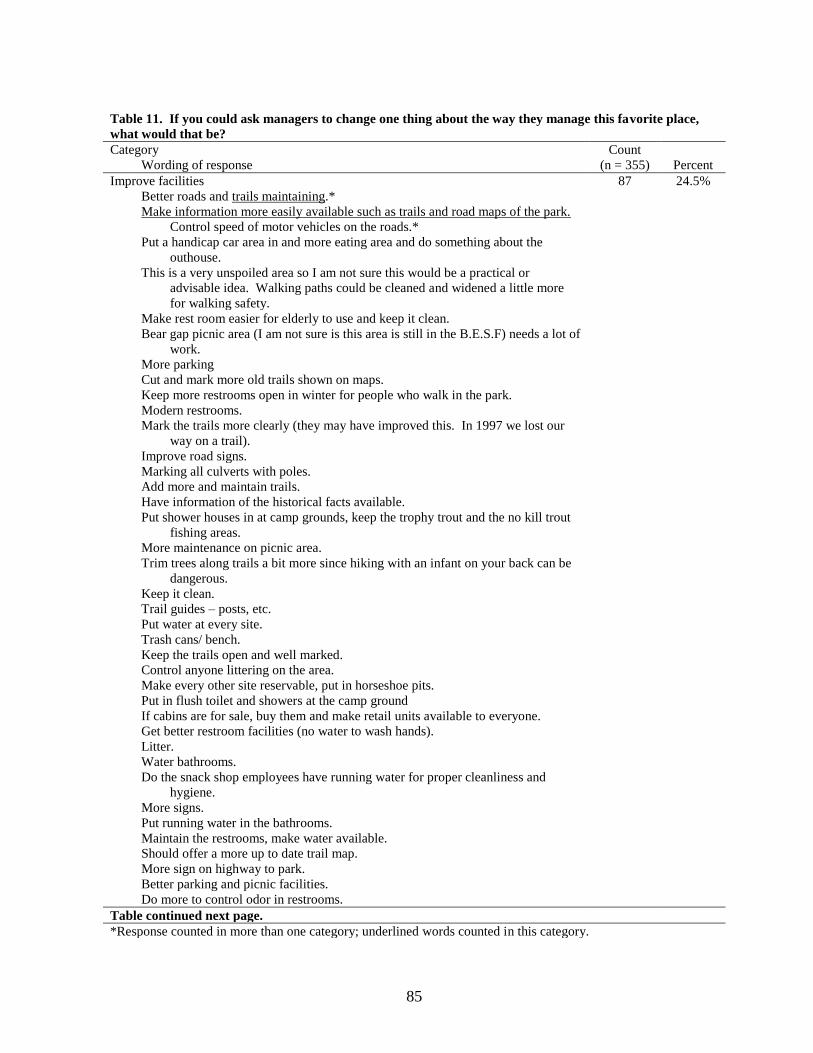
85
Table 11. If you could ask managers to change one thing about the way they manage this favorite place,
what would that be?
Category Count
(n = 355) Percent Wording of response
Improve facilities 87 24.5%
Better roads and trails maintaining.*
Make information more easily available such as trails and road maps of the park.
Control speed of motor vehicles on the roads.*
Put a handicap car area in and more eating area and do something about the
outhouse.
This is a very unspoiled area so I am not sure this would be a practical or
advisable idea. Walking paths could be cleaned and widened a little more
for walking safety.
Make rest room easier for elderly to use and keep it clean.
Bear gap picnic area (I am not sure is this area is still in the B.E.S.F) needs a lot of
work.
More parking
Cut and mark more old trails shown on maps.
Keep more restrooms open in winter for people who walk in the park.
Modern restrooms.
Mark the trails more clearly (they may have improved this. In 1997 we lost our
way on a trail).
Improve road signs.
Marking all culverts with poles.
Add more and maintain trails.
Have information of the historical facts available.
Put shower houses in at camp grounds, keep the trophy trout and the no kill trout
fishing areas.
More maintenance on picnic area.
Trim trees along trails a bit more since hiking with an infant on your back can be
dangerous.
Keep it clean.
Trail guides – posts, etc.
Put water at every site.
Trash cans/ bench.
Keep the trails open and well marked.
Control anyone littering on the area.
Make every other site reservable, put in horseshoe pits.
Put in flush toilet and showers at the camp ground
If cabins are for sale, buy them and make retail units available to everyone.
Get better restroom facilities (no water to wash hands).
Litter.
Water bathrooms.
Do the snack shop employees have running water for proper cleanliness and
hygiene.
More signs.
Put running water in the bathrooms.
Maintain the restrooms, make water available.
Should offer a more up to date trail map.
More sign on highway to park.
Better parking and picnic facilities.
Do more to control odor in restrooms.
Table continued next page.
*Response counted in more than one category; underlined words counted in this category.

86
Table 11 continued. If you could ask managers to change one thing about the way they manage this
favorite place, what would that be?
Category Count
(n = 355) Percent Wording of response
Improve facilities continued
Not sure. Park seems to be run well. Maybe sell firewood there instead of having
to travel to get to it.
Better beach/more sand; improve restrooms.
Electric outlets on camp sites.
Cleaner restrooms.
Open more trails and add volunteers. We would need your responses.
More garbage cans.
Add a small picnic area on top of mountain.
Better mark directions to fly fishing only areas.
Provide more parking, try to keep trails.
Keep the area clean from people.
There‟s a broken automobile bridge that spanned the creek 5 miles down on
Green‟s Valley Road. Fix it please. It‟s the only other way out by vehicle.
Keep the area clean and fix the bridge.
Put back the bridge and stop blocking all the trails.
Need help to find road.
Put cable at top to stop vehicle from rolling down to timbered area.
Put boxes in to play horseshoes.
Put up map of the area so you can see the valley and forest terrain.
Have maps at the entrances so people who never were there would know where
they are.
Keep up Bear Gap (table, fire places).
Ask them to put in a trail to walk around the gap.
Provide firewood.
New trail signs.
Take better care of trails.
Fix the bridge.
Have more snow cleared away for parking of all the snowmobiles.
Trails need to be opened up or blazed.
Get rid of the rocks on the trail.
Have electric.
Put the bridge back in and leave everything.
More snowmobiling trails.
More clearing and grooming of trails.
Keep the snowmobile trails groomed & open up to ATV's when there is no snow.
Put more parking for snowmobile vehicles.
Post signs for very sharp turns.
Always give snow conditions thoroughly & honestly.
To put a street light up at landing and unload snowmobile area.
Provide additional winter parking for truck & trailer parking with trail access.
Enlarge the area.
Use the groomer more than they do.
Prep the snowmobile trails better before snow falls so the trails (roads) are
smoother and don't have rocks laying on them.
Put gates at the ends of Hairy John's parking lots so they could be opened for
snowmobile trailers to park easier.
Food.
Install restroom facilities.
Table continued next page.
*Response counted in more than one category; underlined words counted in this category.

87
Table 11 continued. If you could ask managers to change one thing about the way they manage this
favorite place, what would that be?
Category Count
(n = 355) Percent Wording of response
Improve facilities continued
Put a snowmobile bridge across Penns Creek.
Provide lighting at night, provide better winter maintenance to ride to Hairy
John's.
Allow my father who can't walk (only one leg) to use another form of
transportation to get back to it or he'll never see it.
Clear blow down a little better.
We need a bridge above Weikert to get across Penns Creek so we can have more
trails to ride and so we can ride to Troxelville.
If they want people to use old logging roads as hiking trails, perhaps a very basic
map and distance of trail could be posted at the trail where it leaves the road.
Nothing 74 20.8%
Nothing. (26 responded with this specific answer)
Difficult task.
Maintain the current ambiance.
Everything is fine.
Don‟t mess with it.
I am in agreement in the way it is being managed.
Leave it alone, unchanged.
Nothing.
Can‟t think of anything.
No comment.
Nothing, its O.K. the way it is.
Cannot think of anything.
It‟s O.K.
Can‟t think of any changes.
I have no questions.
Not a thing.
Keep up the good work.
Don‟t know.
Leave it alone.
Not sure.
I don‟t think it‟s damaged by anyone.
No changes.
Same as now.
N/A.
This is a well run organization – high quality people.
Could not think of anything.
Nothing, it‟s great.
N/A.
Leave it as private as it is now.
Not sure.
N/A
Not sure.
None.
Nothing they do a fine job.
No change.
N/A.
Leave it the way it is.
Table continued next page.
*Response counted in more than one category; underlined words counted in this category.

88
Table 11 continued. If you could ask managers to change one thing about the way they manage this
favorite place, what would that be?
Category Count
(n = 355) Percent Wording of response
Nothing continued
It‟s okay the way it is.
Keep up the good work.
They do a good job.
Nothing different.
Keep it the same.
Leave it alone.
They do a very good job as it is.
Leave it alone.
This is a place in the mountains. I would not change it.
Not a thing, they‟re obviously doing a great job.
Leave alone.
Don‟t change a thing.
Keep it the way it is.
Keep up the good work.
Keep it the way it is, no vehicle.
Let it be.
Don‟t over develop.
Nothing new.
N/A
Keep it as it is – A natural area.
Modify use patterns 57 16.1%
Stop doe hunting in state forest and stop people from dumping.*
Less access to remote areas by motorized vehicles, greater presence of the game
commission during hunting and fishing seasons. You have to get out of the
vehicle to catch offenders.*
Let us shoot target with the use of a proper back stop.
Discontinue snowmobiling on forest roads – it packs the snow and I‟m unable to
get into the area until late spring. Discontinue ATV's on trail - their use
causes trails to erode and causes damage to stream.
Do not add other campsites too close together, add more sites closer to a water
source.
If a lot people swimming, open of all swimming area.
Destroy logging roads after they are done logging an area – having too many
logging roads gives the forest too much access.
Eliminate doe season.
Let people camp here.
Limit motor vehicle access, and less timbering of forests.
Allow camping on the site, and make it easier to get a permit.
Limit road access to card holders.
Try to get some more area to hunt so people do not crowd game lands.
Open gates during hunting seasons.
Open fishing in the no kill area to fishing 24 hours.
Get rid of Hosterman pit mine and the politicians that allowed it to be opened.
No doe hunting for a couple of years.
Keep the people out that go tubing.
Keep the ATV‟s off of the roads.
Don‟t let any camping along Cherry Run.
Not have day camping only.
Table continued next page.
*Response counted in more than one category; underlined words counted in this category.

89
Table 11 continued. If you could ask managers to change one thing about the way they manage this
favorite place, what would that be?
Category Count
(n = 355) Percent Wording of response
Modify use patterns continued
Special reg. area, min. size trout 9”, check upstream areas for acid.
Provide off road access in BESF. Increase animal population.
Allow dogs in overnight camping.
Restricted vehicle and other mechanical things.
Less cabins.
Limit people/day.
No motor vehicles.
Less cabins and permanent camping.
Not much except curb development and lower catch limits and enforce them.
Allow pets if you clean up after them.
Allow camping.
Limit vehicle access.
No camping or building fires.
People that have ATV license should have a place set aside to ride.
Come up with some sort of permit to allow ATVs to ride the roads.
Keep motorized vehicles out of there.
Close some roads and make areas accessible by foot only.
No ATV‟s.
Restrict vehicle access to student trail area.
ATV trails.
Allow ATV‟s on State Game Land.
Allow alcoholic beverages at picnic area as in N.Y. State, in moderation of course.
Open the locked gates for all hunting seasons, not just doe season.
Close roads to vehicle traffic.
Limit access.
Allow the use of ATV‟s in the forest like snowmobiles are allowed.
Limited motored access from private land to the west.
Open the gate before archery season so I can spend some time scouting for deer.
Figure out a way to keep cars and trucks off the trails unless they have a good
reason to be there like going to their camp. It costs money to groom trails,
why destroy them?
Open the gate a few weeks before archery season so I may have some time to
scout the area.
Leave gate open before hunting season so we can scout the area.
Discontinue "no snowmobiling" up the road to the lookout. Showers (coin
operated). Snowmobile ramp for people without trailers.
Do not be so quick to post "closed to snowmobiling" when a lumbering operation
is scheduled a few months in advance.
Restrict any kind of development or alteration of the environment.
Not allow 4-wheel drive vehicles on it during snowmobiling season.
Restrict vehicular access.
Modify practices with respect to natural amenities (streams, woods) 43 12.1%
Fix up the roads. Stock more fish.*
Wider road, marked, cleaned parking areas. More wildlife cuts but not as big an
area as at West Boyer Rd. And don't cut area.*
Maintain the roads better and provide more survival areas for the wildlife.*
Only stock Pine Creek preseason it once was a wild trout stream – too many
fisherman killed the wild trout.
Table continued next page.
*Response counted in more than one category; underlined words counted in this category.

90
Table 11 continued. If you could ask managers to change one thing about the way they manage this
favorite place, what would that be?
Category Count
(n = 355) Percent Wording of response
Modify practices with respect to natural amenities (streams, woods) continued
Water flow.
Use select cutting of timber land. Replanting of cherry and oak trees.
Renew forest trees.
Could use stream improvement.
I have written to them about trashing stream parallel to gravel roads by allowing
or pushing cuttings into these streams. Results have been less than
satisfactory.
Release big racked bucks on opening day of deer season at my favorite place.
More deer.
Stock more trout.
Control the logging, no more clear cutting.
Keep it like nature.
Keep bushes cut away so as not to block view.
Forbid logging.
Increase “No Kill” fishing zone on Penn‟s Creek upstream to Coburn.
Clean up fallen trees. Get a place where you can rent horses to ride along the
roads reaching the Poe Valley.
Classify Pine Creek as a wild trout stream again or at least reduce stocking.
Stock more trout and patrol more often.
Clear cut small sections of the forest in a patchwork design. This would improve
bird & deer hunting.
Open all areas to allow cutting of dead wood.
Quit destroying the forest by clear cutting.
Put fish in the lake beside it.
No wood cutting.
Some of the timber should be harvested.
Utilize alternative wood products and stop cutting trees.
Do more to promote wildlife.
More deer (less timber).
Maximize the deer area.
Manage deer herd better.
More trout in creek (year round).
Clearcut some timber.
Trim some of brush along the shoreline of the lake but not enough to cause
erosion.
More clear cutting and planting to attract birds and other wildlife.
Keep it managed for game.
Replant trees that produce food for wildlife.
Improve deer habitat (greater food sources).
Improve deer population.
Try to improve the regeneration of mass producing trees upon harvesting timber.
Stop cutting timber for profit.
More fish.
Remove amenities. Encourage use by people willing to rough it more.
Enforce rules & regulations 30 8.5%
Make information more easily available such as trails and road maps of the park.
Control speed of motor vehicles on the roads.*
Stop doe hunting in state forest and stop people from dumping.*
Table continued next page.
*Response counted in more than one category; underlined words counted in this category.

91
Table 11 continued. If you could ask managers to change one thing about the way they manage this
favorite place, what would that be?
Category Count
(n = 355) Percent Wording of response
Enforce rules & regulations continued
Less access to remote areas by motorized vehicles, greater presence of the game
commission
Slow the idiots (and red-necks) who come flying through in their vehicles.
We went along with the changes that were made but can‟t understand why can‟t
pull RV at bear run station area. People should obey rules and take care of
area.
Make everyone comply with park rules.
Inspect campsite prior to, during, and following visits by campers to ensure
cleanliness.
Better patrolling – more visible DCWR.
Keep out riff raff.
Prevent break-ins.
Patrol more for beer parties at tower somewhat close to cabin. They leave it a
mess with cans and litter.
Probably greater supervision.
Somehow magically keep people from littering.
Keep it better.
Enforcement of littering and vehicles travel in restricted area.
Control language – (foul) at times.
Tighten up on illegal action at night.
Patrol it more – take licenses and numbers to keep the riff raff in tow. Also catch
these people breaking into cabins. More observation.
Stronger/tighter security.
Allow camping while strictly enforcing litter bug laws and all state park rules.
Slow down the vehicle.
Patrol it more often. There are a lot of ATV‟s and speeders and some parties that
go on.
Keep noise down at night.
Enlist more rangers to police and prosecute people who abuse the environment.
Get a set of rules and stick to them instead of every new person that takes over
changing something and some get a personality.
Keep people from dumping garbage.
Up the fines for littering.
Arrest and fine the people who abuse it.
Keep vehicles out of roads when the snow gets too deep they only cut the roads
and get stuck all the time.
My primary activity is hunting and I wish there was more done to increase the
deer population including, but not limited to, action against illegal hunters.
Improve roads 27 7.6%
Better roads and trails maintaining.*
Fix up the roads. Stock more fish.*
Wider road, marked, cleaned parking areas. More wildlife cuts but not as big an
area as at West Boyer Rd. And don't cut area.*
Maintain the roads better and provide more survival areas for the wildlife.*
Fix roads to them.
The road.
Have better roads.
Table continued next page.
*Response counted in more than one category; underlined words counted in this category.
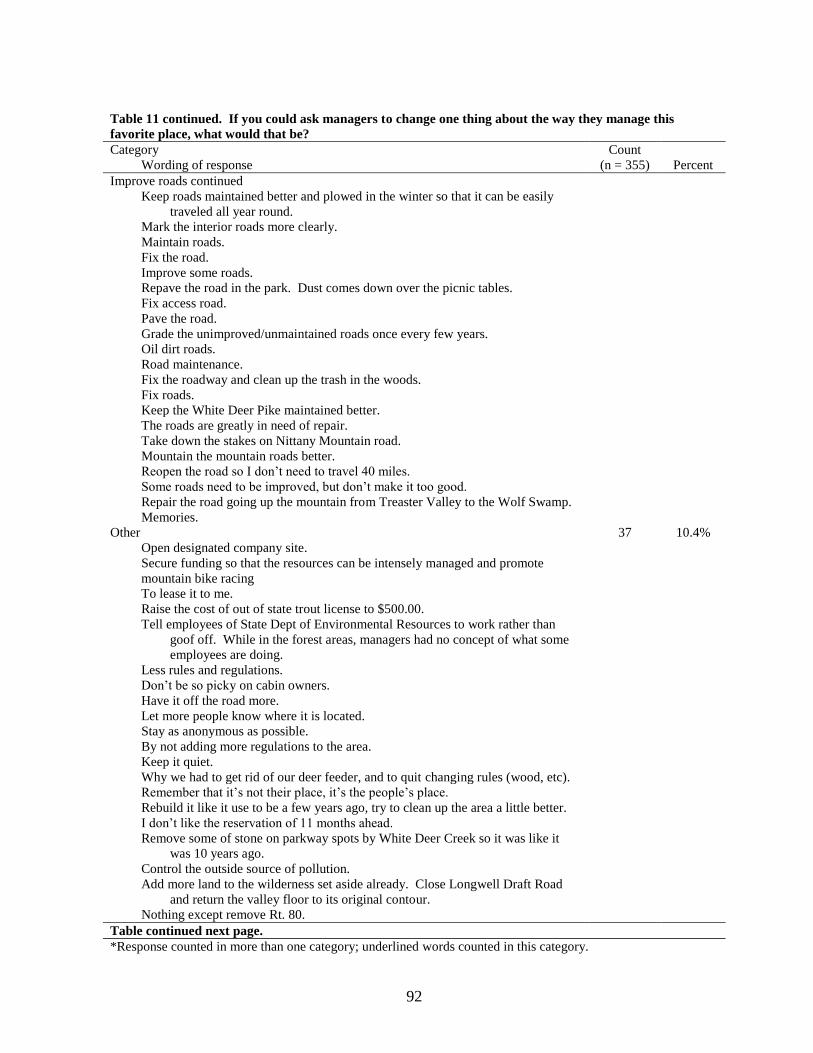
92
Table 11 continued. If you could ask managers to change one thing about the way they manage this
favorite place, what would that be?
Category Count
(n = 355) Percent Wording of response
Improve roads continued
Keep roads maintained better and plowed in the winter so that it can be easily
traveled all year round.
Mark the interior roads more clearly.
Maintain roads.
Fix the road.
Improve some roads.
Repave the road in the park. Dust comes down over the picnic tables.
Fix access road.
Pave the road.
Grade the unimproved/unmaintained roads once every few years.
Oil dirt roads.
Road maintenance.
Fix the roadway and clean up the trash in the woods.
Fix roads.
Keep the White Deer Pike maintained better.
The roads are greatly in need of repair.
Take down the stakes on Nittany Mountain road.
Mountain the mountain roads better.
Reopen the road so I don‟t need to travel 40 miles.
Some roads need to be improved, but don‟t make it too good.
Repair the road going up the mountain from Treaster Valley to the Wolf Swamp.
Memories.
Other 37 10.4%
Open designated company site.
Secure funding so that the resources can be intensely managed and promote
mountain bike racing
To lease it to me.
Raise the cost of out of state trout license to $500.00.
Tell employees of State Dept of Environmental Resources to work rather than
goof off. While in the forest areas, managers had no concept of what some
employees are doing.
Less rules and regulations.
Don‟t be so picky on cabin owners.
Have it off the road more.
Let more people know where it is located.
Stay as anonymous as possible.
By not adding more regulations to the area.
Keep it quiet.
Why we had to get rid of our deer feeder, and to quit changing rules (wood, etc).
Remember that it‟s not their place, it‟s the people‟s place.
Rebuild it like it use to be a few years ago, try to clean up the area a little better.
I don‟t like the reservation of 11 months ahead.
Remove some of stone on parkway spots by White Deer Creek so it was like it
was 10 years ago.
Control the outside source of pollution.
Add more land to the wilderness set aside already. Close Longwell Draft Road
and return the valley floor to its original contour.
Nothing except remove Rt. 80.
Table continued next page.
*Response counted in more than one category; underlined words counted in this category.

93
Table 11 continued. If you could ask managers to change one thing about the way they manage this
favorite place, what would that be?
Category Count
(n = 355) Percent Wording of response
Other continued
Keep the Game Commission from placing bears in this area – it‟s too close to
communities and homes in that area – maximum distance they can go is five
miles from the nearest house with the bridge out.
Change the name of Negro Hollow Rd. to something less offensive.
Have a volunteer day to pick up trash and help clean paths and improve roads.
Make it easier to cut wood.
To successfully manage this place, one must work to put himself out of a job.
Stay out.
Eliminate DCNR.
Reduce the amount of government. It is not their area, it everyone‟s area.
No doe permits.
Outlaw bright eyes or reflectors taped to trees by hunters.
Make this area and most others garbage.
Limit areas.
Pay more attention to the long term quality.
Keep from plowing the roads that I snowmobile.
Not to plow off the parking lots and trails.
Stop making it bad for snowmobiling.
Maybe designate this water as an all tackle catch & release area. Good native
trout fishing is hard to find and this waterway definitely needs to be
protected.
*Response counted in more than one category; underlined words counted in this category.
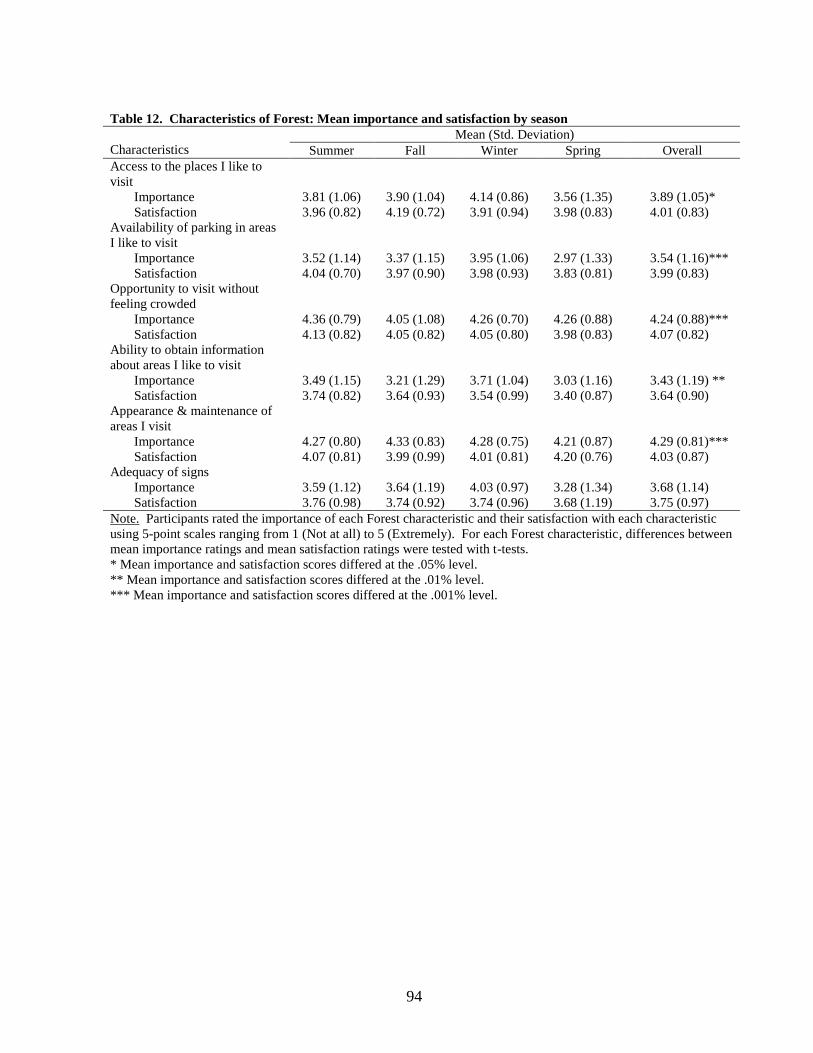
94
Table 12. Characteristics of Forest: Mean importance and satisfaction by season
Characteristics
Mean (Std. Deviation)
Summer Fall Winter Spring Overall
Access to the places I like to
visit
Importance 3.81 (1.06) 3.90 (1.04) 4.14 (0.86) 3.56 (1.35) 3.89 (1.05)*
Satisfaction 3.96 (0.82) 4.19 (0.72) 3.91 (0.94) 3.98 (0.83) 4.01 (0.83)
Availability of parking in areas
I like to visit
Importance 3.52 (1.14) 3.37 (1.15) 3.95 (1.06) 2.97 (1.33) 3.54 (1.16)***
Satisfaction 4.04 (0.70) 3.97 (0.90) 3.98 (0.93) 3.83 (0.81) 3.99 (0.83)
Opportunity to visit without
feeling crowded
Importance 4.36 (0.79) 4.05 (1.08) 4.26 (0.70) 4.26 (0.88) 4.24 (0.88)***
Satisfaction 4.13 (0.82) 4.05 (0.82) 4.05 (0.80) 3.98 (0.83) 4.07 (0.82)
Ability to obtain information
about areas I like to visit
Importance 3.49 (1.15) 3.21 (1.29) 3.71 (1.04) 3.03 (1.16) 3.43 (1.19) **
Satisfaction 3.74 (0.82) 3.64 (0.93) 3.54 (0.99) 3.40 (0.87) 3.64 (0.90)
Appearance & maintenance of
areas I visit
Importance 4.27 (0.80) 4.33 (0.83) 4.28 (0.75) 4.21 (0.87) 4.29 (0.81)***
Satisfaction 4.07 (0.81) 3.99 (0.99) 4.01 (0.81) 4.20 (0.76) 4.03 (0.87)
Adequacy of signs
Importance 3.59 (1.12) 3.64 (1.19) 4.03 (0.97) 3.28 (1.34) 3.68 (1.14)
Satisfaction 3.76 (0.98) 3.74 (0.92) 3.74 (0.96) 3.68 (1.19) 3.75 (0.97)
Note. Participants rated the importance of each Forest characteristic and their satisfaction with each characteristic
using 5-point scales ranging from 1 (Not at all) to 5 (Extremely). For each Forest characteristic, differences between
mean importance ratings and mean satisfaction ratings were tested with t-tests.
* Mean importance and satisfaction scores differed at the .05% level.
** Mean importance and satisfaction scores differed at the .01% level.
*** Mean importance and satisfaction scores differed at the .001% level.

95
Table 13. Characteristics of Forest: Importance and satisfaction categories
Percentage (n)
Characteristics Not at all Somewhat Moderately Very Extremely
Access to the places I like to visit
Importance 3% (15) 8% (44) 20% (109) 36% (195) 34% (185)
Satisfaction 1% (8) 5% (26) 11% (64) 56% (315) 26% (146)
Availability of parking in areas I
like to visit
Importance 7% (38) 12% (63) 24% (133) 34% (186) 23% (125)
Satisfaction 1% (6) 4% (19) 17% (95) 51% (282) 27% (147)
Opportunity to visit without
feeling crowded
Importance 1% (7) 3% (17) 12% (63) 38% (207) 46% (251)
Satisfaction 1% (5) 2% (13) 17% (95) 48% (264) 32% (178)
Ability to obtain information
about areas I like to visit
Importance 8% (43) 14% (73) 26% (140) 33% (178) 20% (108)
Satisfaction 2% (11) 8% (40) 30% (162) 45% (242) 15% (81)
Appearance & maintenance of
areas I visit
Importance 1% (3) 3% (15) 10% (56) 41% (220) 46% (249)
Satisfaction 1% (6) 5% (25) 14% (80) 49% (271) 31% (172)
Adequacy of signs
Importance
6% (33)
9% (47)
23% (127)
35% (192)
27% (148)
Satisfaction 4% (20) 6% (31) 25% (135) 45% (247) 21% (116)
Note. Percentages may not add up to 100% due to rounding. Participants rated the importance of each Forest
characteristic and their satisfaction with each characteristic using 5-point scales ranging from 1 (Not at all) to 5
(Extremely).

96
Table 14. Mean scores of responses to management issues on Forest by season
Issue
Mean (Std. Deviation)
Summer Fall Winter Spring Overall
It is more important to protect
habitat for plants and
animals than provide
opportunities for recreation. 0.74 (1.04) 0.98 (0.99) 0.62 (1.12) 0.78 (1.05) 0.77 a (1.06)
The Forest should encourage
more timber harvesting. -0.64 (1.11) -0.52 (1.25) -0.21 (1.14) -0.65 (1.31) -0.52 b (1.18)
More fish should be stocked in the
streams and lakes to provide
increased sport-fishing
opportunities. 0.33 (1.18) 0.39 (1.06) 0.41 (1.01) 0.40 (1.32) 0.37 c (1.12)
More public lands such as Bald
Eagle State Forest should be
set aside as wild or natural
areas. 1.08 (1.01) 0.88 (1.23) 0.40 (1.21) 1.08 (1.10) 0.86 a (1.16)
Note. Participants responded to each issue on a 5-point scale ranging from -2 (Strongly disagree) to +2 (Strongly
agree). In the “Overall” column, means sharing the same subscript did not differ at the .05% level.
Table 15. Year of first visit to Bald Eagle State Forest and newcomer/veteran categories
Period
Number reporting
first visit
Percent reporting
first visit
Newcomer/veteran category
Number (Percent)
1927 - 1935 11 1.3
Veterans
317 (36.6%)
1936 - 1940 18 2.0
1941 - 1945 12 1.3
1946 - 1950 32 3.7
1951 - 1955 22 2.6
1956 - 1960 62 7.4
1961 - 1965 57 6.5
1966 - 1970 103 11.9
1971 - 1975 95 11.0
Intermediates
331 (38.3%)
1976 - 1980 112 13.0
1981 - 1985 62 7.1
1986 - 1990 62 7.2
1991 - 1995 69 8.0 Newcomers
217 (25.1%) 1996 - 2000 148 17.1

97
Table 16. Background characteristics of newcomer, intermediate, and veteran visitors
Background characteristic
Newcomers
1991-2000 a
(n = 217)
Intermediates
1971-1990 a
(n = 331)
Veterans
1970 or before a
(n = 317)
Test for difference
among groups
Gender (% male) b
83.3 88.1 86.0 2 = 1.53, p = .466
Age (mean years) c
43.5 a
42.9 a
52.8 b
F = 33.30, p < .001
Ethnic background (% Caucasian) b 99.0 99.5 99.2
2 = 1.74, p = .783
Formal education (mean years) c 13.9 a 13.5 ab 13.3 b F = 3.42, p = .034
Annual income (% $30,000 -
$79,999) b
56.8 59.2 56.0 2 = 15.46, p = .217
Residence in youth (% rural or
town < 10,000 people) b
68.5 78.8 83.4 2 = 22.43, p = .013
Current residence (% rural or town
< 10,000 people) b
76.3 82.1 80.3 2 = 8.62, p = .568
Political orientation (%
moderately-very conservative)
bd
61.6 55.6 57.3 2 = 9.44, p = .307
Environmental orientation (mean
score) ce
3.49 a
3.61 a
3.56 a
F = 1.23, p = .294
Distance from residence to BESF
(% 30 miles) b
36.7 54.8 55.6 2 = 22.02, p < .001
a Year of first visit to BESF.
b Differences among subgroups tested with
2 test of independence.
c Differences among subgroups tested with oneway analysis of variance. In each row, subgroup means sharing
the same subscript did not differ significantly in a post-hoc Scheffe test.
d Participants identified themselves as Very Conservative, Moderately Conservative, Slightly Liberal or
Conservative, Moderately Liberal, or Very Liberal.
e Scores represent the mean of responses to 15 items. The minimum score (1) indicates strong beliefs that
environmental problems are not serious and can be managed easily by humans. The maximum score (5) indicates
strong beliefs that environmental problems are serious and cannot be managed easily by humans.
Table 17. Day trips, overnight trips and overnight quarters of newcomer, intermediate, and veteran
visitors
Day trips/overnight quarters
Newcomers
1991-2000 a
(n = 217)
Intermediates
1971-1990 a
(n = 331)
Veterans
1970 or before a
(n = 317) Overall b
Percents
Day trip 75.7 70.2 68.8 71.3
Camping on BESF 9.0 6.0 6.3 6.5
Leased or private cabin site 6.7 12.0 16.7 13.0
State Park 4.3 6.4 4.2 4.5
Commercial lodging or camping 4.3 5.4 4.2 4.7
a Year of first visit to BESF.
b Differences among subgroups tested with
2 test of independence.
2 = 14.93, p = .061.

98
Table 18. Season of most visits to Forest, newcomer, intermediate, and veteran visitors
Season
Newcomers
1991-2000 a
(n = 217)
Intermediates
1971-1990 a
(n = 331)
Veterans
1970 or before a
(n = 317) Overall b
Percents
Spring 15.8 16.7 12.9 15.1
Summer 45.4 35.0 33.7 36.6
Fall 20.4 35.4 42.9 35.3
Winter 18.4 12.9 10.5 13.1
a Year of first visit to BESF.
b Difference among subgroups tested with
2 test of independence.
2 = 24.73, p < .001.
Table 19. Activity participation at BESF during 12 months prior to being surveyed, newcomer,
intermediate, and veteran visitors
Activity
Newcomers
1991-2000 a
(n = 217)
Intermediates
1971-1990 a
(n = 331)
Veterans
1970 or before a
(n = 317) Wald statistic &
probability b
Percent participating
Viewing scenery 63.8 76.2 79.3 11.68, p = .003
Fishing 33.6 44.3 59.0 19.39, p < .001
Walking/day hiking c 47.3 60.3 66.5 17.72, p < .001
Wildlife watching 36.6 52.1 54.0 12.57, p = .002
Hunting 22.9 51.5 68.0 55.29, p < .001
Camping c 18.2 20.6 27.0 5.37, p = .068
Picnicking 30.5 38.5 48.0 11.63, p = .003
Snowmobiling 21.2 19.0 10.0 6.11, p = .047
Swimming c 12.9 21.5 23.0 8.05, p = .018
Mountain biking 9.1 12.8 11.0 1.08, p = .5.83
Photography 21.2 24.1 31.0 3.67, p = .160
Backpacking c 7.6 7.7 7.0 0.94, p = .624
Horseback riding 6.1 2.6 1.5 5.43, p = .066
Driving ORV c 11.4 7.2 9.5 2.82, p = .244
Jogging/trail running 2.3 6.2 4.0 2.70, p = .259
Cross-country skiing 1.5 3.1 4.5 2.01, p = .366
a Year of first visit to BESF.
b Differences in participation rates among subgroups tested with logistic regression.
c Activities for which age was also a significant predictor at the .05% level. For each of these activities,
participation rates decreased significantly as age increased.

99
Table 20. Satisfaction with Forest characteristics, newcomer, intermediate, and veteran visitors
Forest characteristic
Newcomers
1991-2000 a
(n = 217)
Intermediates
1971-1990 a
(n = 331)
Veterans
1970 or before a
(n = 317) Overall
Mean scores b
Access to place(s) I wanted to visit 4.15 a 3.99 a 3.95 a 4.01
Availability of parking in areas I visited 4.02 a 3.97 a 3.98 a 3.99
Opportunity to visit without feeling
crowded
4.31 a 4.08 b 4.02 b 4.10
Ability to obtain information about the area 3.53 a 3.54 a 3.81 b 3.65
Appearance & maintenance of areas I
visited
4.20 a 4.01 a 4.04 a 4.06
Adequacy of signs 3.71 a 3.72 a 3.83 a 3.77 a Year of first visit to BESF.
b Responses ranged from Not at all Satisfied (1) to Extremely Satisfied (5). Differences among subgroups tested
with analysis of variance and found significant at the .05% level. In each row, subgroup means sharing the same
subscript did not differ significantly in a post-hoc Scheffe test.
Table 21. Responses to Forest management issues, newcomer, intermediate, and veteran visitors
Forest management issue
Newcomers
1991-2000 a
(n = 217)
Intermediates
1971-1990 a
(n = 331)
Veterans
1970 or before a
(n = 317) Overall
Mean scores b
It is more important to protect habitat for
plants and animals than provide
opportunities for recreation.
0.63 a 0.88 a 0.73 a 0.77
The Forest should encourage more timber
harvesting.
-0.59 ab -0.62 a -0.33 b -0.50
More fish should be stocked in the streams
and lakes to provide increased sport-
fishing opportunities.
0.28 a 0.45 a 0.32 a 0.36
More public lands such as Bald Eagle State
Forest should be set aside as wild or
natural areas.
0.77 a 0.98 a 0.73 a 0.84
a Year of first visit to BESF.
b Responses ranged from Strongly Disagree (-2) to Strongly Agree (+2). Differences among subgroups tested
with analysis of variance and found significant at the .05% level. In each row, subgroup means sharing the same
subscript did not differ significantly in a post-hoc Scheffe test.