Level 1 Mathematics and Statistics internal...
12
Internal assessment resource Mathematics and Statistics 1.10A v2 for Achievement Standard 91035 PAGE FOR TEACHER USE This resource is copyright © Crown 2012 Page 1 of 12 NZQA Approved Internal Assessment Resource Mathematics and Statistics Level 1 This resource supports assessment against: Achievement Standard 91035 Investigate a given multivariate data set using the statistical enquiry cycle Resource title: Census At School 4 credits This resource: Clarifies the requirements of the standard Supports good assessment practice Should be subjected to the school’s usual assessment quality assurance process Should be modified to make the context relevant to students in their school environment and ensure that submitted evidence is authentic Date version published by Ministry of Education November 2012 Version 2 To support internal assessment from 2013 Quality assurance status These materials have been quality assured by NZQA. NZQA Approved number A-A-11-2012-91035-01-4256 Authenticity of evidence Teachers must manage authenticity for any assessment from a public source, because students may have access to the assessment schedule or student exemplar material. Using this assessment resource without modification may mean that students’ work is not authentic. The teacher may need to change figures, measurements or data sources or set a different context or topic to be investigated or a different text to read or perform.
Transcript of Level 1 Mathematics and Statistics internal...

Internal assessment resource Mathematics and Statistics 1.10A v2 for Achievement Standard 91035 PAGE FOR TEACHER USE
This resource is copyright © Crown 2012 Page 1 of 12
NZQA Approved
Internal Assessment Resource
Mathematics and Statistics Level 1
This resource supports assessment against:
Achievement Standard 91035
Investigate a given multivariate data set using the statistical enquiry cycle
Resource title: Census At School
4 credits
This resource:
Clarifies the requirements of the standard
Supports good assessment practice
Should be subjected to the school’s usual assessment quality assurance process
Should be modified to make the context relevant to students in their school environment and ensure that submitted evidence is authentic
Date version published by Ministry of Education
November 2012 Version 2
To support internal assessment from 2013
Quality assurance status These materials have been quality assured by NZQA.
NZQA Approved number A-A-11-2012-91035-01-4256
Authenticity of evidence Teachers must manage authenticity for any assessment from a public source, because students may have access to the assessment schedule or student exemplar material.
Using this assessment resource without modification may mean that students’ work is not authentic. The teacher may need to change figures, measurements or data sources or set a different context or topic to be investigated or a different text to read or perform.

Internal assessment resource Mathematics and Statistics 1.10A v2 for Achievement Standard 91035 PAGE FOR TEACHER USE
This resource is copyright © Crown 2012 Page 2 of 12
Internal Assessment Resource
Achievement Standard Mathematics and Statistics 91035: Investigate a given multivariate data set using the statistical enquiry cycle
Resource Reference: Mathematics and Statistics 1.10A v2
Resource Title: Census At School
Credits: 4
Teacher guidelines
The following guidelines are designed to ensure that teachers can carry out valid and consistent assessment using this internal assessment resource.
Teachers need to be very familiar with the outcome being assessed by Achievement Standard Mathematics and Statistics 91035. The achievement criteria and the explanatory notes contain information, definitions, and requirements that are crucial when interpreting the standard and assessing students against it.
Context/setting
This assessment activity involves students using the statistical enquiry cycle to make comparisons between groups in a population. The context for this resource is a sample of 92 year 11 students from the 2009 New Zealand Census At School multivariate data set. Students should be familiar with the Census At School survey before doing this assessment activity.
This task could be adapted to fit another data set with at least two category variables and three numerical variables. The sample must be big enough so that for any category variable there are about 25–30 records in each category. The category variables should have no more than two or three categories, for example, gender (male/female), handedness (left/right/ambidextrous), or mode of transport (bus/walk).
Conditions
This activity requires at least two separate sessions. All work must be completed independently. In the first session, students should use approximately 20 minutes to pose two comparison investigative questions. While two questions are asked for, only one is needed for the investigation. Not all combinations of variables are suitable for investigation, for example, height compared by mode of transport is not. The given data set supports five investigations:
height compared by gender
popliteal length compared by gender
bag weight compared by gender
time to school compared by mode of transport to school
bag weight compared by how bag is carried.
Other combinations are unsuitable or trivial. This achievement standard requires students to compare a numerical variable across categories; a comparison of two category variables is not appropriate. In other words, one of the variables

Internal assessment resource Mathematics and Statistics 1.10A v2 for Achievement Standard 91035 PAGE FOR TEACHER USE
This resource is copyright © Crown 2012 Page 3 of 12
investigated must be continuous (for example, height) and the other a category (for example, gender). It is not appropriate to investigate a relationship situation for this task.
Check students’ investigative questions and, if required, give students time to correct or improve them before they begin the second session. If they are unable to produce at least one suitable investigative question, give feedback of a general nature indicating which of the question criteria have not been met; do not provide the question. If more than minimal feedback is needed, the student is not ready for assessment against this standard.
The second (and subsequent) sessions are for students to carry out the analysis and write conclusions. Any technology is allowed for the analysis.
Resource requirements
The data set is available as an Excel spreadsheet [database1-10A2.xls]. Provide students with a paper (Resource Sheet B) copy of the data set for their analysis.
You may wish to give students a template to help them pose investigative questions, for example:
Looking at the data, what are you curious about? Complete the statement “I wonder …”
Write down the variables that you are investigating.
What groups are you comparing?
Additional information
The 2009 New Zealand Census At School can be found at: http://www.censusatschool.org.nz

Internal assessment resource Mathematics and Statistics 1.10A v2 for Achievement Standard 91035 PAGE FOR STUDENT USE
This resource is copyright © Crown 2012 Page 4 of 12
Internal Assessment Resource
Achievement Standard Mathematics and Statistics 91035: Investigate a given multivariate data set using the statistical enquiry cycle
Resource Reference: Mathematics and Statistics 1.10A v2
Resource Title: Census At School
Credits: 4
Achievement Achievement with Merit Achievement with Excellence
Investigate a given multivariate data set using the statistical enquiry cycle.
Investigate a given multivariate data set using the statistical enquiry cycle, with justification.
Investigate a given multivariate data set using the statistical enquiry cycle, with statistical insight.
Student instructions
Introduction
This activity requires you to undertake a statistical investigation using a randomly selected sample from the 2009 New Zealand Census At School database. First, you will pose two investigative questions. Then you will analyse the sample and form a conclusion for one of your questions.
This activity is to be completed independently.
You will be assessed on the quality of your discussion and reasoning and how well you link this to the context.
Task
As you carry out this task, you will use the statistical enquiry cycle (Problem, Plan, Data, Analysis, Conclusion).
Problem
Pose two investigative questions about year 11 students that can be explored using 2009 New Zealand Census At School data. See Student Resource A for part of the data and a description of the variables.
Your investigative questions must be comparison questions. A suitable comparison investigative question is one that reflects the population, has a clear variable to investigate, compares the values of a continuous variable across different categories, and can be answered with the data.
For each question, state the variable you are investigating and the groups you are comparing.
Now choose one of your two questions for investigation using the data found in Student Resource B.

Internal assessment resource Mathematics and Statistics 1.10A v2 for Achievement Standard 91035 PAGE FOR STUDENT USE
This resource is copyright © Crown 2012 Page 5 of 12
Plan and data
Because the 92 year 11 students (a mix of boys and girls) in Student Resource B were selected using the random sampler, the sample can be considered representative of all the students in the database. The data was gathered by the 2009 New Zealand Census At School survey team.
Analysis
Draw at least two appropriate graphs that show different features of the data in relation to your investigative question.
Give appropriate summary statistics.
Describe features of the distributions comparatively (for example, shape, middle 50%, shift, overlap, spread, unusual or interesting features).
Conclusion
Write a conclusion summarising your findings. The conclusion needs to include an informal inference in response to your investigative question and to be supported with relevant evidence.
Internal assessment resource Mathematics and Statistics 1.10A v2 for Achievement Standard 91035 PAGE FOR STUDENT USE
This resource is copyright © Crown 2012 Page 6 of 12
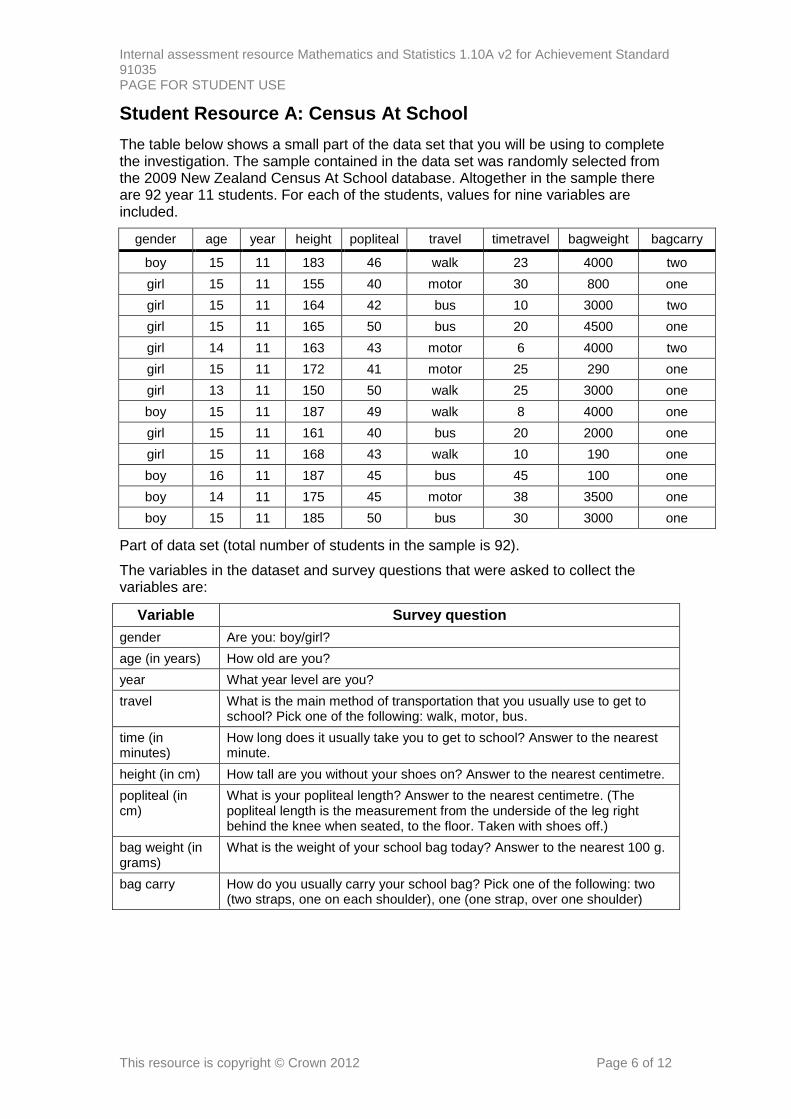
Student Resource A: Census At School
The table below shows a small part of the data set that you will be using to complete the investigation. The sample contained in the data set was randomly selected from the 2009 New Zealand Census At School database. Altogether in the sample there are 92 year 11 students. For each of the students, values for nine variables are included.
gender age year height popliteal travel timetravel bagweight bagcarry
boy 15 11 183 46 walk 23 4000 two
girl 15 11 155 40 motor 30 800 one
girl 15 11 164 42 bus 10 3000 two
girl 15 11 165 50 bus 20 4500 one
girl 14 11 163 43 motor 6 4000 two
girl 15 11 172 41 motor 25 290 one
girl 13 11 150 50 walk 25 3000 one
boy 15 11 187 49 walk 8 4000 one
girl 15 11 161 40 bus 20 2000 one
girl 15 11 168 43 walk 10 190 one
boy 16 11 187 45 bus 45 100 one
boy 14 11 175 45 motor 38 3500 one
boy 15 11 185 50 bus 30 3000 one
Part of data set (total number of students in the sample is 92).
The variables in the dataset and survey questions that were asked to collect the variables are:
Variable Survey question
gender Are you: boy/girl?
age (in years) How old are you?
year What year level are you?
travel What is the main method of transportation that you usually use to get to school? Pick one of the following: walk, motor, bus.
time (in minutes)
How long does it usually take you to get to school? Answer to the nearest minute.
height (in cm) How tall are you without your shoes on? Answer to the nearest centimetre.
popliteal (in cm)
What is your popliteal length? Answer to the nearest centimetre. (The popliteal length is the measurement from the underside of the leg right behind the knee when seated, to the floor. Taken with shoes off.)
bag weight (in grams)
What is the weight of your school bag today? Answer to the nearest 100 g.
bag carry How do you usually carry your school bag? Pick one of the following: two (two straps, one on each shoulder), one (one strap, over one shoulder)
Internal assessment resource Mathematics and Statistics 1.10A v2 for Achievement Standard 91035 PAGE FOR STUDENT USE
This resource is copyright © Crown 2012 Page 7 of 12
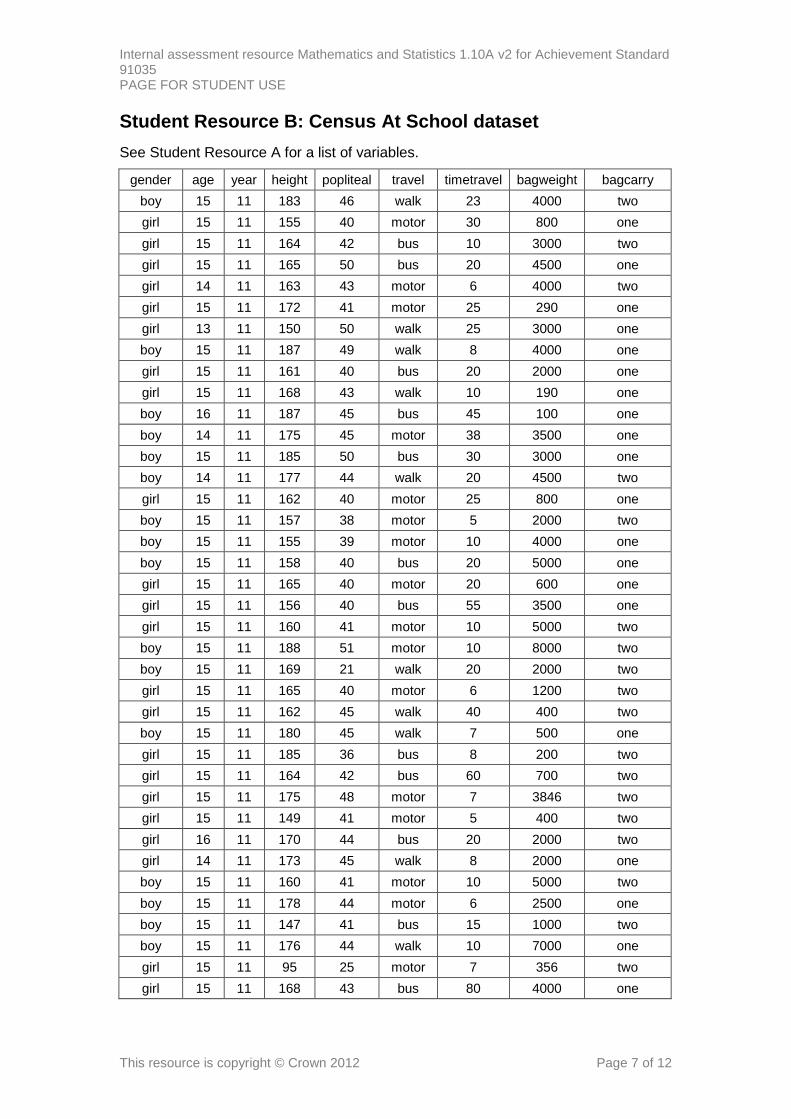
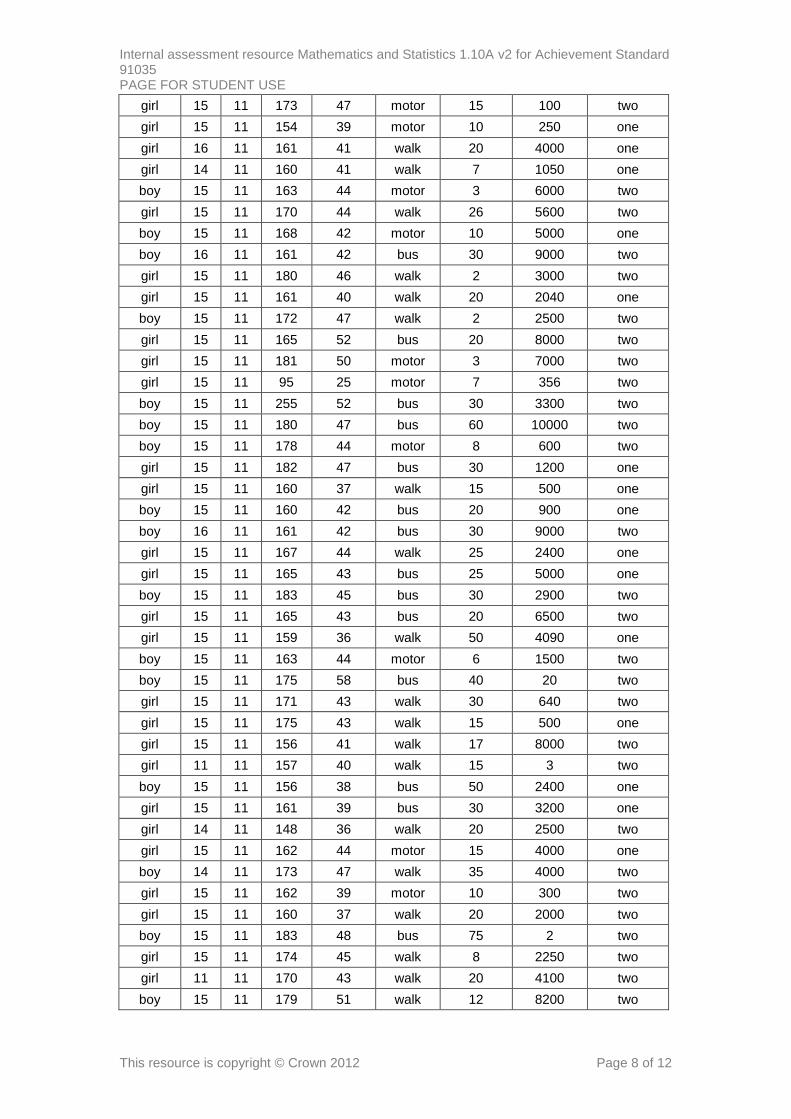
Student Resource B: Census At School dataset
See Student Resource A for a list of variables.
gender age year height popliteal travel timetravel bagweight bagcarry
boy 15 11 183 46 walk 23 4000 two
girl 15 11 155 40 motor 30 800 one
girl 15 11 164 42 bus 10 3000 two
girl 15 11 165 50 bus 20 4500 one
girl 14 11 163 43 motor 6 4000 two
girl 15 11 172 41 motor 25 290 one
girl 13 11 150 50 walk 25 3000 one
boy 15 11 187 49 walk 8 4000 one
girl 15 11 161 40 bus 20 2000 one
girl 15 11 168 43 walk 10 190 one
boy 16 11 187 45 bus 45 100 one
boy 14 11 175 45 motor 38 3500 one
boy 15 11 185 50 bus 30 3000 one
boy 14 11 177 44 walk 20 4500 two
girl 15 11 162 40 motor 25 800 one
boy 15 11 157 38 motor 5 2000 two
boy 15 11 155 39 motor 10 4000 one
boy 15 11 158 40 bus 20 5000 one
girl 15 11 165 40 motor 20 600 one
girl 15 11 156 40 bus 55 3500 one
girl 15 11 160 41 motor 10 5000 two
boy 15 11 188 51 motor 10 8000 two
boy 15 11 169 21 walk 20 2000 two
girl 15 11 165 40 motor 6 1200 two
girl 15 11 162 45 walk 40 400 two
boy 15 11 180 45 walk 7 500 one
girl 15 11 185 36 bus 8 200 two
girl 15 11 164 42 bus 60 700 two
girl 15 11 175 48 motor 7 3846 two
girl 15 11 149 41 motor 5 400 two
girl 16 11 170 44 bus 20 2000 two
girl 14 11 173 45 walk 8 2000 one
boy 15 11 160 41 motor 10 5000 two
boy 15 11 178 44 motor 6 2500 one
boy 15 11 147 41 bus 15 1000 two
boy 15 11 176 44 walk 10 7000 one
girl 15 11 95 25 motor 7 356 two
girl 15 11 168 43 bus 80 4000 one
Internal assessment resource Mathematics and Statistics 1.10A v2 for Achievement Standard 91035 PAGE FOR STUDENT USE
This resource is copyright © Crown 2012 Page 8 of 12
girl 15 11 173 47 motor 15 100 two
girl 15 11 154 39 motor 10 250 one
girl 16 11 161 41 walk 20 4000 one
girl 14 11 160 41 walk 7 1050 one
boy 15 11 163 44 motor 3 6000 two
girl 15 11 170 44 walk 26 5600 two
boy 15 11 168 42 motor 10 5000 one
boy 16 11 161 42 bus 30 9000 two
girl 15 11 180 46 walk 2 3000 two
girl 15 11 161 40 walk 20 2040 one
boy 15 11 172 47 walk 2 2500 two
girl 15 11 165 52 bus 20 8000 two
girl 15 11 181 50 motor 3 7000 two
girl 15 11 95 25 motor 7 356 two
boy 15 11 255 52 bus 30 3300 two
boy 15 11 180 47 bus 60 10000 two
boy 15 11 178 44 motor 8 600 two
girl 15 11 182 47 bus 30 1200 one
girl 15 11 160 37 walk 15 500 one
boy 15 11 160 42 bus 20 900 one
boy 16 11 161 42 bus 30 9000 two
girl 15 11 167 44 walk 25 2400 one
girl 15 11 165 43 bus 25 5000 one
boy 15 11 183 45 bus 30 2900 two
girl 15 11 165 43 bus 20 6500 two
girl 15 11 159 36 walk 50 4090 one
boy 15 11 163 44 motor 6 1500 two
boy 15 11 175 58 bus 40 20 two
girl 15 11 171 43 walk 30 640 two
girl 15 11 175 43 walk 15 500 one
girl 15 11 156 41 walk 17 8000 two
girl 11 11 157 40 walk 15 3 two
boy 15 11 156 38 bus 50 2400 one
girl 15 11 161 39 bus 30 3200 one
girl 14 11 148 36 walk 20 2500 two
girl 15 11 162 44 motor 15 4000 one
boy 14 11 173 47 walk 35 4000 two
girl 15 11 162 39 motor 10 300 two
girl 15 11 160 37 walk 20 2000 two
boy 15 11 183 48 bus 75 2 two
girl 15 11 174 45 walk 8 2250 two
girl 11 11 170 43 walk 20 4100 two
boy 15 11 179 51 walk 12 8200 two

Internal assessment resource Mathematics and Statistics 1.10A v2 for Achievement Standard 91035 PAGE FOR STUDENT USE
This resource is copyright © Crown 2012 Page 9 of 12
boy 15 11 156 47 bus 30 3000 one
boy 15 11 169 49 bus 20 3800 one
girl 14 11 162 36 bus 30 100 one
girl 15 11 173 43 walk 15 1600 one
girl 15 11 165 67 walk 6 20 two
girl 15 11 255 40 motor 10 1000 two
girl 14 11 35 12 walk 5 525 one
girl 14 11 163 40 walk 35 1000 two
boy 15 11 178 45 bus 30 3000 two
girl 15 11 165 45 motor 10 200 one
girl 15 11 164 40 bus 20 1200 two

Internal assessment resource Mathematics and Statistics 1.10A v2 for Achievement Standard 91035 PAGE FOR TEACHER USE
This resource is copyright © Crown 2012 Page 10 of 12
Assessment schedule: Mathematics and Statistics 91035 Census At School
Teacher note: You will need to adapt this assessment schedule to include examples of the types of responses that can be expected.
Evidence/Judgements for Achievement Evidence/Judgements for Achievement with Merit
Evidence/Judgements for Achievement with Excellence
The student shows evidence of investigating a given multivariate data set using each component of the statistical enquiry cycle.
The student:
poses an appropriate comparison question
draws graph(s) and gives summary statistic(s) that allow features of the distributions to be described in relation to the question
writes statements that describe comparative features of the distributions in context. (At least two statements, describing different features, are expected.)
answers the comparison question in the context of the investigation or makes a correct comparison using an informal inference about the population.
Example of possible evidence.
The student poses an appropriate comparison question.
Does the time taken to get to school by bus tend to be longer than the time taken to walk to school for year 11 students in the Census At School database?
The student draws at least one graph, for example, a dot plot or a box plot and gives evidence of at least one summary statistic, for example a modal group.
The student shows evidence of investigating a given multivariate data set using each component of the statistical enquiry cycle, with justification.
The student:
poses an appropriate comparison question
draws graph(s) and gives summary statistics that allow features of the distributions to be described in relation to the question
writes statements with evidence that describe comparative features of the distributions in context. (At least two statements describing different features are expected.)
makes a correct informal inference about the population from the sample data that shows an understanding of sampling variability or of the context
answers the comparison question, with at least one statement of supporting evidence.
Example of possible evidence.
The student poses an appropriate comparison question.
Does the time taken to get to school by bus tend to be longer than the time taken to walk to school for year 11 students in the Census At School database?
The student draws at least one graph, for example, a dot plot or a box plot and gives
The student shows evidence of investigating a given multivariate data set using each component of the statistical enquiry cycle, with statistical insight.
The student:
poses an appropriate comparison question
draws graphs and gives summary statistics that allow features of the distributions to be described in relation to the question. (At least two different graphs showing different features are expected.)
writes statements with evidence that describe key comparative features of the distributions in context. (At least three statements describing different features are expected; key features include middle 50%, shift and overlap, shape, spread, unusual or interesting features.)
makes a correct informal inference about the population from the sample data that shows an understanding of sampling variability and of the context
answers the comparison question with reference to the population and key supporting evidence summarised in context. (What the statistical basis for the claim is and the effect of sampling variability or does the claim make sense considering the actual situation is expected.)
Example of possible evidence.
Internal assessment resource Mathematics and Statistics 1.10A v2 for Achievement Standard 91035 PAGE FOR TEACHER USE
This resource is copyright © Crown 2012 Page 11 of 12
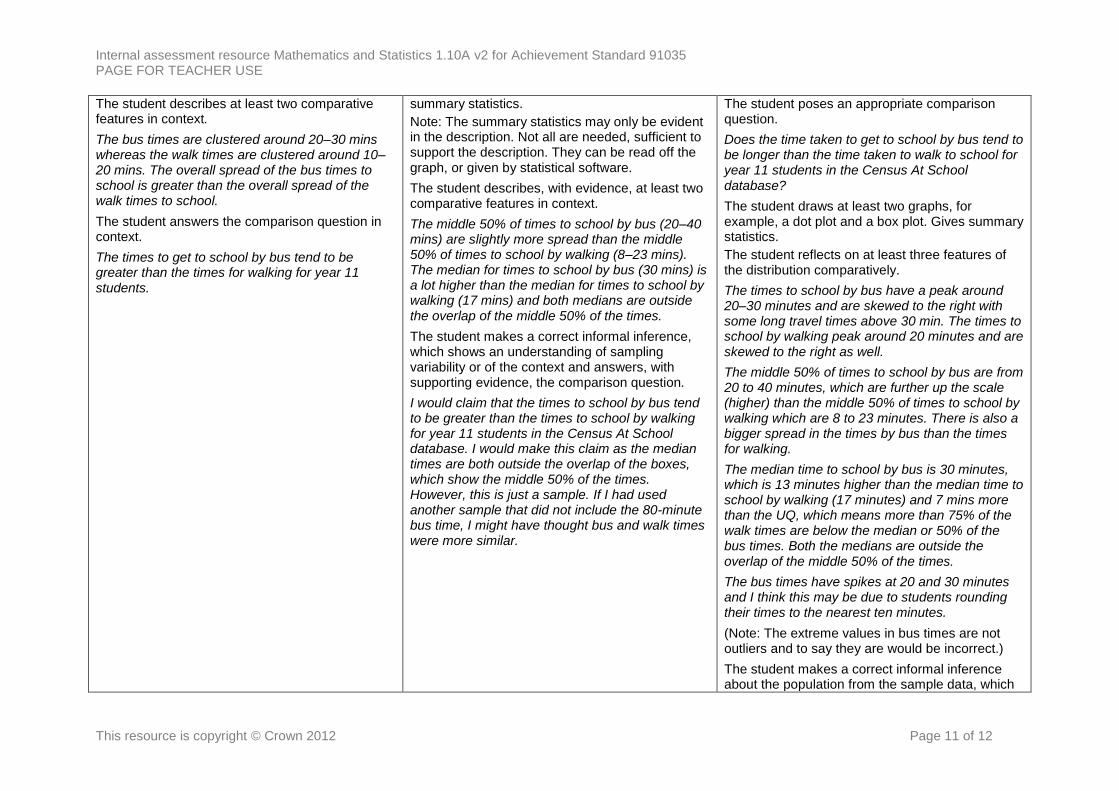
The student describes at least two comparative features in context.
The bus times are clustered around 20–30 mins whereas the walk times are clustered around 10–20 mins. The overall spread of the bus times to school is greater than the overall spread of the walk times to school.
The student answers the comparison question in context.
The times to get to school by bus tend to be greater than the times for walking for year 11 students.
summary statistics.
Note: The summary statistics may only be evident in the description. Not all are needed, sufficient to support the description. They can be read off the graph, or given by statistical software.
The student describes, with evidence, at least two comparative features in context.
The middle 50% of times to school by bus (20–40 mins) are slightly more spread than the middle 50% of times to school by walking (8–23 mins). The median for times to school by bus (30 mins) is a lot higher than the median for times to school by walking (17 mins) and both medians are outside the overlap of the middle 50% of the times.
The student makes a correct informal inference, which shows an understanding of sampling variability or of the context and answers, with supporting evidence, the comparison question.
I would claim that the times to school by bus tend to be greater than the times to school by walking for year 11 students in the Census At School database. I would make this claim as the median times are both outside the overlap of the boxes, which show the middle 50% of the times. However, this is just a sample. If I had used another sample that did not include the 80-minute bus time, I might have thought bus and walk times were more similar.
The student poses an appropriate comparison question.
Does the time taken to get to school by bus tend to be longer than the time taken to walk to school for year 11 students in the Census At School database?
The student draws at least two graphs, for example, a dot plot and a box plot. Gives summary statistics.
The student reflects on at least three features of the distribution comparatively.
The times to school by bus have a peak around 20–30 minutes and are skewed to the right with some long travel times above 30 min. The times to school by walking peak around 20 minutes and are skewed to the right as well.
The middle 50% of times to school by bus are from 20 to 40 minutes, which are further up the scale (higher) than the middle 50% of times to school by walking which are 8 to 23 minutes. There is also a bigger spread in the times by bus than the times for walking.
The median time to school by bus is 30 minutes, which is 13 minutes higher than the median time to school by walking (17 minutes) and 7 mins more than the UQ, which means more than 75% of the walk times are below the median or 50% of the bus times. Both the medians are outside the overlap of the middle 50% of the times.
The bus times have spikes at 20 and 30 minutes and I think this may be due to students rounding their times to the nearest ten minutes.
(Note: The extreme values in bus times are not outliers and to say they are would be incorrect.)
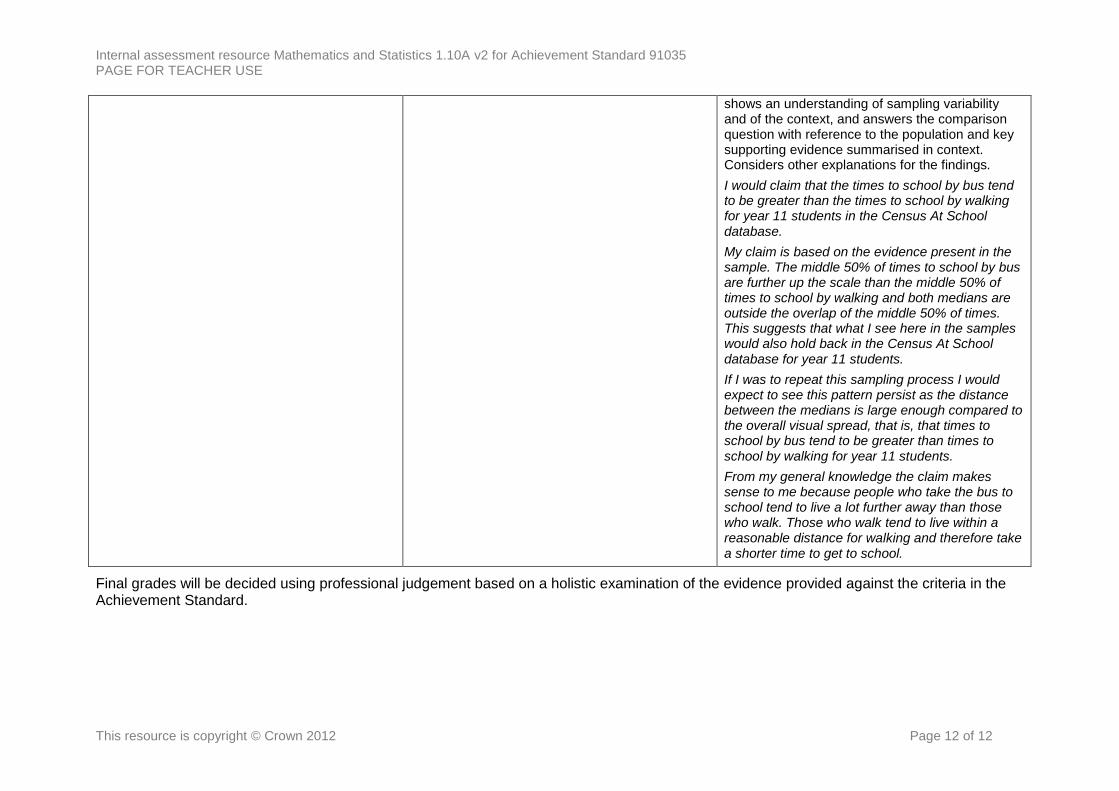
The student makes a correct informal inference about the population from the sample data, which
Internal assessment resource Mathematics and Statistics 1.10A v2 for Achievement Standard 91035 PAGE FOR TEACHER USE
This resource is copyright © Crown 2012 Page 12 of 12
shows an understanding of sampling variability and of the context, and answers the comparison question with reference to the population and key supporting evidence summarised in context. Considers other explanations for the findings.
I would claim that the times to school by bus tend to be greater than the times to school by walking for year 11 students in the Census At School
database.
My claim is based on the evidence present in the sample. The middle 50% of times to school by bus are further up the scale than the middle 50% of times to school by walking and both medians are outside the overlap of the middle 50% of times. This suggests that what I see here in the samples would also hold back in the Census At School database for year 11 students.
If I was to repeat this sampling process I would expect to see this pattern persist as the distance between the medians is large enough compared to the overall visual spread, that is, that times to school by bus tend to be greater than times to school by walking for year 11 students.
From my general knowledge the claim makes sense to me because people who take the bus to school tend to live a lot further away than those who walk. Those who walk tend to live within a reasonable distance for walking and therefore take a shorter time to get to school.
Final grades will be decided using professional judgement based on a holistic examination of the evidence provided against the criteria in the Achievement Standard.