
Letter to share owners Dear share owner - RNS · PDF file2 Bangladesh, Egypt, Indonesia,...
23
2 012, our twenty-seventh year, was another record one, with revenue, profitability, headline margin and earnings per share all reaching new highs and, for the second year running, your Company was awarded a Cannes Lion for Creative Holding Company of the Year, in recognition of your Company’s collective creative excellence. These record results were achieved against a backdrop of economic uncertainty and fragile client confidence. Your share price rose sharply in 2012 – an increase of over 31% to 888.0p at year end. This strong momentum has continued in 2013, with the share price rising to 1,027.0p at the time of writing, up 16% from 1 January. Dividends were increased by almost 16% to 28.51p, a record level. This represents a dividend pay-out ratio of 39% on headline diluted earnings per share, largely achieving the objective set in 2010 of increasing the dividend pay-out ratio to approximately 40%. Your Board will continue to review whether the dividend pay-out ratio should be increased further. Reported billings were down slightly at £44.4 billion, but up well over 1% in constant currencies. Revenues were up 3.5% to £10.4 billion and up almost 6% in constant currencies. Including 100% of associates, revenue is estimated to total £12.6 billion ($20.0 billion). Our revenues exceeded all our competitors for the fifth consecutive year and by an increasing amount. Headline PBIT was up over 7% to £1.531 billion against £1.429 billion in 2011 and up over 11% in constant currencies. Headline PBIT margin was 14.8% in 2012 against 14.3% last year, in line with target and also surpassing the historical pro forma high of 14.3% in 2008. On gross margin, the headline PBIT margin was 16.1%, up 0.6 margin points on 2011. This is probably a more accurate basis for competitive comparisons. Reported profit before interest and tax rose over 4% to £1.311 billion from £1.258 billion. Headline EBITDA (which is a key metric that private equity firms, for example, use for valuing companies) increased by 7% to £1.756 billion. Headline profit before tax was up over 7% to £1.317 billion and reported profit before tax was up over 8% to £1.092 billion. Diluted headline earnings per share were up over 8% to 73.4p (an all-time high) and diluted reported earnings per share decreased by over 2% to 62.8p, reflecting the release of prior year tax provisions in 2011. Free cash flow strengthened to £1.094 billion in the year, over £1 billion for the second consecutive year. Net debt averaged £3.2 billion in 2012, up £0.4 billion at 2012 exchange rates, and net debt at * This letter to share owners should be read in conjunction with and as part of the Directors’ report on pages 113 to 121 and the section headed How we comply on pages 155 to 168. WPP ANNUAL REPORT 2012 How we’re doing 20 Letter to share owners * Dear share owner
Transcript of Letter to share owners Dear share owner - RNS · PDF file2 Bangladesh, Egypt, Indonesia,...

2012, our twenty-seventh year, was another record one, with revenue, profitability, headline margin and earnings per share
all reaching new highs and, for the second year running, your Company was awarded a Cannes Lion for Creative Holding Company of the Year, in recognition of your Company’s collective creative excellence. These record results were achieved against a backdrop of economic uncertainty and fragile client confidence.
Your share price rose sharply in 2012 – an increase of over 31% to 888.0p at year end. This strong momentum has continued in 2013, with the share price rising to 1,027.0p at the time of writing, up 16% from 1 January. Dividends were increased by almost 16% to 28.51p, a record level. This represents a dividend pay-out ratio of 39% on headline diluted earnings per share, largely achieving the objective set in 2010 of increasing the dividend pay-out ratio to approximately 40%. Your Board will continue to review whether the dividend pay-out ratio should be increased further.
Reported billings were down slightly at £44.4 billion, but up well over 1% in constant currencies. Revenues were up 3.5% to £10.4 billion and up almost 6% in constant currencies. Including 100% of associates, revenue is estimated to total £12.6 billion ($20.0 billion). Our revenues exceeded all our competitors for the fifth consecutive year and by an increasing amount. Headline PBIT was up over 7% to £1.531 billion against £1.429 billion in 2011 and up over 11% in constant currencies. Headline PBIT margin was 14.8% in 2012 against 14.3% last year, in line with target and also surpassing the historical pro forma high of 14.3% in 2008.
On gross margin, the headline PBIT margin was 16.1%, up 0.6 margin points on 2011. This is probably a more accurate basis for competitive comparisons. Reported profit before interest and tax rose over 4% to £1.311 billion from £1.258 billion.
Headline EBITDA (which is a key metric that private equity firms, for example, use for valuing companies) increased by 7% to £1.756 billion. Headline profit before tax was up over 7% to £1.317 billion and reported profit before tax was up over 8% to £1.092 billion. Diluted headline earnings per share were up over 8% to 73.4p (an all-time high) and diluted reported earnings per share decreased by over 2% to 62.8p, reflecting the release of prior year tax provisions in 2011.
Free cash flow strengthened to £1.094 billion in the year, over £1 billion for the second consecutive year. Net debt averaged £3.2 billion in 2012, up £0.4 billion at 2012 exchange rates, and net debt at
* This letter to share owners should be read in conjunction with and as part of the Directors’ report on pages 113 to 121 and the section headed How we comply on pages 155 to 168.
WPP ANNUAL REPORT 2012
How we’re doing
20
Letter to share owners*
Dear share owner

31 December 2012 was £2.8 billion, £0.3 billion higher than 2011, reflecting increased spending on acquisitions (chiefly AKQA) and higher dividends. Equity and debt analysts appear comfortable with the level of the Group’s average net debt, which was around 1.8 times headline EBITDA in 2012 compared with 1.7 times in 2011, and well within the Group’s current target range of 1.5-2.0 times.
In September 2012, the Group successfully issued $500 million of 10-year bonds at a coupon of 3.625%, together with $300 million of 30-year bonds at 5.125%. This was the first time a company in our industry has issued 30-year debt and the bonds were well received by investors with strong demand for both. These bonds have improved the maturity profile of the Group’s debt.
Headline interest cover in 2012 was 7.2 times. So far, in the first three months of 2013, average net debt was up approximately £0.3 billion at £3.0 billion against £2.7 billion for the same period in 2012, at 2013 exchange rates. Our long-term debt is currently rated Baa2 and BBB and our short-term debt P2 and A2, by Moody’s and Standard & Poor’s respectively.
With a current equity market capitalisation of approximately £13.0 billion, the total enterprise value of your Company is approximately £16.3 billion, a multiple of 9.1 times 2012 headline EBITDA.
Revenue growth better in fourth quarter
Our reported revenue growth for the year of 3.5% was impacted by the strength of sterling, primarily against the Euro. On a constant currency basis, which excludes the impact of currency movements, revenues were up almost 6%.
On a like-for-like basis, which excludes the impact of currency and acquisitions, revenues were up 2.9%, with gross margin up 2.4%, reflecting pressure on gross margins in the Group’s Consumer Insight custom businesses in the mature markets of North America, the UK and Western Continental Europe. In the fourth quarter, like-for-like revenues were up 2.5%, an improvement on the third quarter
of 1.9%, due to stronger growth in all regions except North America. This reflects a reversal of the declining quarterly like-for-like revenue growth trend which went from 4% in quarter one, to 3% in quarter two and to 2% in quarter three.
Latin America again led the way
Like-for-like revenue growth in North America declined as the year progressed, from over 1% in the first quarter to down -0.6% in quarter four. Relatively strong growth in the Group’s Advertising and Media Investment Management businesses was more than offset by parts of the Group’s Consumer Insight, Public Relations & Public Affairs and Branding & Identity, Healthcare and Specialist Communications businesses. This seems to be indicative of continued pressure on discretionary client spending. In constant currencies, full year revenue growth was well over 3%, while like-for-like revenues were down marginally at -0.1%.
Conversely, and against market trends, the UK showed an improving rate of quarterly like-for-like revenue growth as the year progressed, from 2.5% in the first quarter to over 5% in quarter four. In the last quarter, particularly strong growth in Advertising and Media Investment Management was partly offset by slower growth in Consumer Insight, Branding & Identity and Healthcare Communications. Full year revenue growth in constant currencies was well over 7% and like-for-like growth was 4%.
Western Continental Europe, although relatively more difficult, showed some improvement in the fourth quarter, with growth in Italy, Turkey and (surprisingly) Greece, but Spain, Portugal, Scandinavia, France, the Netherlands and Switzerland were tougher, with the continuing effects of the Eurozone crisis impacting parts of the region. Full year revenue growth in constant currencies was well over 3%, while like-for-like growth was only slightly positive at 0.1%.
Our strongest region in 2012 was again Asia Pacific, Latin America, Africa and the Middle East
WPP ANNUAL REPORT 2012
How we’re doingLetter to share owners
21

Constant currency1 revenue growth by geography % North America
UK
Western Continental Europe
Asia Pacific, Latin America,Africa & Middle East andCentral & Eastern Europe
1211
1211
1211
1211
3.76.3
7.78.8
3.76.3
9.312.6
Headline PBIT2 margins by geography %
North America
UK
Western Continental Europe
Asia Pacific, Latin America,Africa & Middle East andCentral & Eastern Europe
1211
1211
1211
1211
16.315.5
13.614.0
10.411.3
16.915.4
Revenue by geography £m North AmericaUKWestern Continental EuropeAsia Pacific, Latin America,Africa & Middle East andCentral & Eastern Europe
12111009080
2,000
4,000
6,000
8,000
10,000
and Central and Eastern Europe, with constant currency growth of over 9% and like-for-like growth of over 8%, principally driven by Latin America and the BRICs1 and Next 112 parts of Asia Pacific and the CIVETS3 and the MIST4 .
Latin America showed the strongest growth of all of our sub-regions in the year, with constant currency revenues up almost 13% and like-for-like revenues up well over 11%. The Middle East & Africa showed the strongest growth of our sub-regions in the fourth quarter, with like-for-like revenues up almost 10% and with all sectors improving. Full year revenue growth was almost 9%. Central and Eastern Europe, after a difficult third quarter, improved significantly in the final quarter, with like-for-like growth of over 12% in Russia. Full year like-for-like growth in this sub-region was 0.7%.
Full year revenues for the BRICs, which account for almost $2 billion of revenue (almost $3 billion including associates), were up over 11% on a like-for-like basis, with the Next 11 and CIVETS up almost 12% and over 11% respectively. The MIST was up over 11%. In 2012, 30% of the Group’s revenues came from Asia Pacific, Latin America, Africa and the Middle East and Central and Eastern Europe, 0.6 percentage points more compared with the previous year and against the Group’s strategic objective of 35-40% over the next two to three years. Markets outside North America now account for 66% of our revenues.
1 See definition on page 226. 2 The calculation of headline PBIT is set out in note 31 of the financial statements.
1 Brazil, Russia, India and China. 2 Bangladesh, Egypt, Indonesia, Mexico, Nigeria, Pakistan, the Philippines,
South Korea, Turkey and Vietnam (the Group has no operations in Iran). 3 Colombia, Indonesia, Vietnam, Egypt, Turkey and South Africa. 4 Mexico, Indonesia, South Korea and Turkey.
WPP ANNUAL REPORT 2012
How we’re doingLetter to share owners
22

Constant currency1 revenue growth by sector % Advertising and MediaInvestment Management
Consumer Insight
Public Relations& Public Affairs
Branding & Identity,Healthcare andSpecialist Communications
1211
1211
1211
1211
5.212.2
2.81.7
4.26.2
10.210.1
Headline PBIT2 margins by sector %
1211
1211
1211
1211
17.716.1
10.010.5
14.916.1
14.414.3
Advertising and MediaInvestment Management
Consumer Insight
Public Relations& Public Affairs
Branding & Identity,Healthcare andSpecialist Communications
Revenue by sector £m Advertising and MediaInvestment ManagementConsumer InsightPublic Relations & Public AffairsBranding & Identity, Healthcare and Specialist Communications
12111009080
2,000
4,000
6,000
8,000
10,000
Strong growth in advertising and media
Advertising and Media Investment Management remained the strongest-performing sector with full year revenues up 5.2% in constant currencies and 5.1% like-for-like. In the final quarter, constant currency revenues were up 4.0% and like-for-like revenues were up 5.4%, considerably stronger than the third quarter like-for-like growth of 2.9%.
Of the Group’s advertising networks, Ogilvy & Mather, which was named Network of the Year at Cannes, performed especially well in North America, the UK and Latin America, with Grey in North America even stronger. However, the Group’s advertising businesses in Western Continental Europe generally remained under pressure with like-for-like revenues down. Growth in the Group’s Media Investment Management businesses has been very consistent throughout the year, with constant currency revenues up over 12% for the year and like-for-like growth of 11.0%. tenthavenue, the ‘engagement’ network focused on out-of-home media, was established towards the end of 2010 and in 2012 showed strong revenue growth, with like-for-like revenues up over 7% following growth of over 14% in 2011. The strong revenue growth across most of the Group’s businesses, together with good cost control, resulted in the combined reported operating margin of this sector improving by 1.6 margin points to 17.7%.
In 2012, Ogilvy & Mather, JWT, Y&R, Grey and United generated estimated net new business billings of £1.087 billion ($1.740 billion). GroupM (the Group’s Media Investment Management arm, which includes Mindshare, MEC, MediaCom, Maxus, GroupM Search and Xaxis), together with tenthavenue, generated estimated net new business billings of £2.148 billion ($3.437 billion).
Consumer Insight revenues grew 2.8% on a constant currency basis, with gross margin up 0.8%. On a like-for-like basis revenues were up 0.8% with gross margin down 1.1%. The pattern of revenue growth seen in the first nine months continued into the final quarter, with the mature markets of North
1 See definition on page 226. 2 The calculation of headline PBIT is set out in note 31 of the financial statements.
WPP ANNUAL REPORT 2012
How we’re doingLetter to share owners
23

margins for the sector as a whole improved slightly, up 0.1 margin points to 14.4%.
Over 32% of the Group’s 2012 revenues came from direct, digital and interactive, up over one percentage point from the previous year and growing 6.7% like-for-like over 2011. Marketing services comprised almost 60% of our revenues in 2012, a similar proportion to 2011.
Margins reach new high
Headline PBIT margins were up 0.5 margin points to 14.8% compared to 14.3% in 2011, in line with the Group’s margin target and surpassing the previous pre-Lehman pro forma high of 2008 (which we equalled in 2011). This headline margin of 14.8% is after charging £51 million ($82 million) of severance costs compared with £54 million ($84 million) in 2011. In 2012 the impact of exchange rates reduced reported margins and on a like-for-like basis, headline PBIT margins actually improved 0.7 margin points. Over the last two years, reported headline PBIT margins have improved by 1.6 margin points and by 1.8 margin points like-for-like.
Given the significance of Consumer Insight revenues to the Group, with none of our direct parent company competitors present in that sector, gross margin and headline gross margin margins (or headline PBIT as a percentage of gross margin) are a more meaningful measure of comparative margin performance. This is because Consumer Insight revenues include pass-through costs, principally for data collection, on which no margin is charged and with the growth of the internet, the process of data collection is more efficient. Headline gross margin margins were up 0.6 margin points to 16.1%, achieving the highest reported level in the industry.
Group revenues are more weighted to the second half of the year across all regions and functions and particularly in the faster-growing markets of Asia Pacific and Latin America. As a result, the Group’s profitability continues to be skewed to the second half of the year.
America and Continental Europe difficult but counterbalanced by strong growth in the faster-growing markets of Asia Pacific, Latin America, Africa & the Middle East. In the fourth quarter, the UK also slowed. Headline PBIT margins fell 0.5 margin points to 10.0%, while reported gross margin margins (headline PBIT as a proportion of gross margin rather than revenue) fell 0.4 margin points to 13.9%. The central issue continues to be like-for-like revenue growth in the custom businesses in mature markets, where discretionary spending remains under review by clients. Custom businesses in faster-growth markets, and syndicated and semi-syndicated businesses in all markets, remain robust, with strong like-for-like revenue growth.
The Group’s Public Relations & Public Affairs businesses had a more difficult year with full-year growth in constant currencies of 4.2% and like-for-like revenues down 1.0%, with continuing pressure in North America and Continental Europe across most of the Group’s brands, only partly offset by strong growth in the UK, Latin America and the Middle East & Africa. Operating margins fell by 1.2 margin points to 14.9%.
At the Group’s Branding & Identity, Healthcare and Specialist Communications businesses (including direct, digital and interactive), constant currency revenues grew strongly at 10.2% with like-for-like growth of 2.6%. Like-for-like revenue growth slipped slightly in quarter four, due primarily to slower growth in parts of the Group’s Branding & Identity and Healthcare Communications businesses, but remained close to 2%. AKQA, the leading digital agency acquired in July 2012, performed well with full year like-for-like revenues up 10%. Operating
Over 32% of the Group’s 2012 revenues came from direct, digital and interactive... growing 6.7% like-for-like over 2011
WPP ANNUAL REPORT 2012
How we’re doingLetter to share owners
24

Operating costs contained
During 2012, the Group continued to reap the benefits of containing operating costs, with improvements across most cost categories, particularly property, commercial and office costs.
On a like-for-like basis the average number of people in the Group increased by 1.6% in 2012. On the same basis, the number of people in the Group at 31 December 2012 was 0.4% lower than at the end of 2011. This point-to-point decrease reflects the adjustments in staff costs made in the second half of 2012, following the slowdown in revenue growth after the first quarter of the year. Also on a like-for-like basis, revenues increased by 2.9% and gross margin 2.4%.
Reported staff costs, excluding incentives, rose by over 5% and by over 7% in constant currency. Incentive payments amounted to £291 million (or over $465 million), which was well over 16% of headline operating profit before incentives and income from associates, compared with £338 million or almost 20% in 2011. Performance in parts of the Group’s custom research, public relations and public affairs, healthcare and direct, digital and interactive businesses fell short of the maximum performance objectives agreed for 2012, as the like-for-like revenue growth rate slowed in quarters two and three in 2012. This followed the record profit and margin performance in 2011, when most of the Group’s operating companies achieved maximum incentive levels. Our objective remains to pay out approximately 20% of operating profit before bonus and taxes at maximum and 15% at target and, in some cases, 25% at ‘super-maximum’.
Headline operating margins, before all incentives and income from associates, were 16.9%, down 0.1 margin points, compared with 17.0% last year. The Group’s staff cost to revenue ratio, including incentives, increased by 0.3 margin points to 58.9% compared with 58.6% in 2011. Following intentional reductions in 2009 and 2010 after the Lehman crisis, the Group increased its investment in people, particularly in the latter part of 2011 and in early
2012, mainly in the faster-growing geographic and functional markets (such as media investment management and digital) as like-for-like revenues and gross margin increased.
Part of the Group’s strategy is to continue to ensure that variable staff costs (incentives, freelance and consultants costs) are a significant proportion of total staff costs and revenue, as this provides flexibility to deal with volatility in revenues and recessions or slowdowns. In 2012, the ratio of variable staff costs to total staff costs was 11.4%, compared with 12.2% in 2011 and 9.7% in 2009. As a proportion of revenue, variable staff costs were 6.7% in 2012 compared with 7.2% in 2011 and 5.7% in 2009. The business is, therefore, well positioned if current market conditions change.
In the second half of 2012, the Group received the proceeds from the sale of the stake in Buddy Media and also completed the sale of the freehold of 285 Madison Avenue, the New York headquarters of Young & Rubicam Inc. These two transactions combined resulted in an exceptional gain of £102 million.
Offsetting this gain, an exceptional restructuring charge of £93 million was taken, the majority of which was to address certain structural issues within businesses primarily in Western Continental Europe and to balance staffing levels and align staff costs given anticipated levels of revenue.
Although one of the Super Marios, Mario Draghi, who took over as the President of the European Central Bank, has certainly improved the prospects of the Eurozone in the last year or so, it seems that slow growth or stagnation in Western Continental Europe is likely to continue for some time. We may well only be half way through a lost decade, post-Lehman.
In addition, the devastating effects of Hurricane Sandy, the significant loss of power in New York and the subsequent flooding which occurred, had some impact on the operational effectiveness of certain of the Group’s IT infrastructure and the Group has reviewed its back-office systems and made provision for the write-off of IT equipment. This will accelerate the Group’s overhaul of its approach to centralising IT services.
WPP ANNUAL REPORT 2012
How we’re doingLetter to share owners
25

As a result of all this, headline PBIT rose over 7% to £1.531 billion from £1.429 billion, up over 11% in constant currencies. Reported PBIT rose over 4% to £1.311 billion from £1.258 billion, up over 8% in constant currencies.
Net finance costs (excluding the revaluation of financial instruments) were £214 million, up 7% from £200 million in 2011, reflecting higher average net debt, offset by lower funding costs. Headline profit before tax increased by over 7% (over 12% in constant currencies) to £1.317 billion and reported profit before tax was up over 8% (well over 14% in constant currencies) to £1.092 billion.
The Group’s tax rate on headline profit before tax was 21.2%, compared with 22.0% in 2011, and on reported profit before tax was 18.1% against 9.1% in 2011. The difference in the reported tax rate is primarily due to the exceptional release in 2011 of prior year corporate tax provisions following the resolution of a number of open matters.
Diluted headline earnings per share rose over 8% (over 13% in constant currencies) to 73.4p and diluted reported earnings per share decreased by over 2% (increased by almost 2% in constant currencies) to 62.8p, again reflecting the release of prior year tax provisions in 2011.
2012’s challenges
Despite being a record year, 2012 felt very different. We reached our targets, but we got there ugly. Having budgeted 4% like-for-like revenue growth at the beginning of 2012, the first quarter started well on budget, if not ahead, and with the quarter one revised forecast strengthening, investment in talent continued following the additions made at the end of 2011. However, as the like-for-like revenue growth rate started to slow in quarter two, we did not start to make the cost adjustments quickly enough to counter the increased staff investment until quarters three and four, although we are now much better balanced for 2013, with the like-for-like number of people in the business slightly down at the end
of the year compared with the beginning of 2012.So why was 2012 such a difficult year? Clients
were certainly in stronger shape with profits at an all-time high as a proportion of GDP, margins generally stronger, share prices rising as institutional investors rotated out of cash or government securities and sitting on, in the case of US-based multinationals, over $2 trillion in cash with relatively unleveraged balance sheets. But, whilst clients were certainly in better shape than pre-Lehman in September 2008, they still lacked the necessary confidence given the ‘grey swans’, or known unknowns. Black swans are the unknown unknowns which, by definition, we do not know what they are (like Cyprus, or the tragic Boston bombings).
There are at least four grey swans, perhaps five now in the case of the UK. Firstly, the fragility of the Eurozone, certainly better since Mario Draghi took over as President of the ECB, but still subject to potential shocks, for example, from elections in Italy or potential corruption problems in Spain, or a black swan in Cyprus. The Eurozone has also been aided by others stressing the need to reduce unemployment and surrendering the inflation rate constraint, for example, by the Chairman of the Federal Reserve Bank in the US, the re-elected Prime Minister Abe in Japan and perhaps the new Governor of the Bank of England in the UK. This has certainly helped equity securities too.
Second, the problems of the Middle East, which are probably now, if anything, worse than a year ago, with heightened conflicts and tensions in Tunisia, Libya, Egypt, Gaza, Syria and above all, potential conflicts between Israel and Iran.
Third, a China or BRICs hard or soft landing, although all the evidence we have seems to point to a soft landing in China and continued growth in Brazil and India, and even stronger growth in Russia. The rise of the hundreds of millions in the new middle-classes in all these countries seems to be the real economic motive force, particularly for the fast-moving consumer goods industries. Certainly, in the case of China, the West seems to have fundamentally misunderstood the significance of the 12th Five Year Plan. That plan looks for lower
WPP ANNUAL REPORT 2012
How we’re doingLetter to share owners
26

quantum, but higher quality growth at around 7.5% p.a. compound (which we would kill for), combined with higher consumption, lower savings, a social security safety net and stronger services sector (almost a charter for WPP). The new politburo leadership seems to be another bull market signal.
Fourth, and most importantly, dealing with the US deficit and a record level of $16 trillion of debt in the most effective way. This remains the elephant in the room, as the US is still twice the size of the Chinese economy at around $16 trillion GDP versus over $8 trillion out of a global total of around $70 trillion. The last minute attempts to deal with the problem in the US Congress on New Year’s Eve in 2012 only succeeded in kicking the can further down the road and the sequester is ill-equipped to help, having been really devised as a compromise measure in June 2011 never to be used. Neither will the sequester help growth in the first half of 2013 in the US.
Finally, the decision to launch a referendum for Britain’s European Union membership, whilst no doubt being an astute political move, adds further uncertainty to the UK economy until after the next UK General Election in 2015.
So all in all, whilst clients may be more confident than they were in September 2008 pre-Lehman, with stronger balance sheets, these increased levels of uncertainty, combined with strengthened corporate governance scrutiny, make them unwilling to take further risks. They remain focused on a strategy of adding capacity and brand building in both fast-growth geographic markets and functional markets like digital and containing or reducing capacity, perhaps with brand building to maintain or increase market share, in the mature, slow growth markets.
This approach also has the apparent virtue of limiting fixed cost increases and increasing variable costs, although we naturally believe that marketing is an investment not a cost. We see little reason if any for this pattern of behaviour to change in 2013, with continued caution being the watchwords. There is certainly no evidence to suggest any such change in behaviour so far in 2013.
The outlook for 2013 continues to be demanding
2013 looks to be another demanding year. There will be no maxi- or mini-quadrennial events and, as mentioned above, the US deficit and debt remain ignored.
The pattern for 2013 looks very similar to 2012, perhaps with increased client confidence balancing the lack of maxi- or mini-quadrennial events. Forecasts of worldwide real GDP growth still hover around 3%, with inflation of 2% giving nominal GDP growth of around 5% for 2013, although they have been reduced recently and may be reduced further in due course. Advertising as a proportion of GDP should at least remain constant overall, although it is still at relatively depressed historical levels, particularly in mature markets, post-Lehman, and advertising should grow at least at a similar rate as GDP.
The three maxi-quadrennial events of 2012, the UEFA Football Championships in Central and Eastern Europe, the Summer Olympics and Paralympics in London and last, but not least, the US Presidential elections in November did underpin industry growth but not, perhaps, as much as was thought, with money being switched from existing budgets, particularly in the cases of the UEFA Championships and Olympics.
Although both consumers and corporates seem to be increasingly cautious and risk averse, they should continue to purchase or invest in brands in both fast- and slow-growth markets to stimulate top-line sales growth. As a leading chief investment officer of one of the largest investment institutions said earlier this year, companies may be running out of ways of
[Clients] remain focused on a strategy of adding capacity and brand building in both fast-growth geographic markets and functional markets like digital
WPP ANNUAL REPORT 2012
How we’re doingLetter to share owners
27

2012 digital revenue1 vs peers $bn
$5.4bn
$2.8bn
$0.6bn$1.0bn
$2.8bn
WPP HavasOmnicom Publicis IPG
2012 revenue by geography vs peers $bn
0
4
8
12
16
20Asia Pacific, Latin America, Africa & Middle East and Central & Eastern EuropeWestern Europe & UKNorth America WPP Havas1,3Aegis/
Dentsu5IPG1,4Publicis1,3Omnicom1,2
reducing costs and have to focus more on top-line growth. Merger and acquisition activity may be another way of doing this, but may be a more risky way than investing in marketing and brand and hence market share.
In 2013, our prime focus will remain on growing revenues and gross margin faster than the industry average, driven by our leading position in the new markets, in new media, and in consumer insight, including data analytics and the application of technology, creativity and ‘horizontality’ – the increasing opportunities for coordination and co-operation between activities both nationally and internationally, and at a client and country level. New markets, new media and Consumer Insight account respectively for 30%, 33%1 and 24% of the Group’s revenues of $16.5 billion, demonstrating the success of our strategic focus.
At the same time, we will concentrate on meeting our operating margin objectives by managing absolute levels of costs and increasing our flexibility in order to adapt our cost structure to significant market changes and by ensuring that the benefits of the restructuring investments taken in 2012 are realised.
The initiatives taken by the parent company in the areas of human resources, property, procurement, IT and practice development continue to improve the flexibility of the Group’s cost base. Additionally, as noted earlier, flexible staff costs (including incentives, freelance and consultants) remain close to historical highs of around 7% of revenues and continue to position the Group extremely well should current market conditions change.
1 Peer digital revenue according to Advertising Age percentages applied to FY US$ revenue.1 Including AKQA on a full-year basis.
1 Sourced from 2012 company presentations. Central & Eastern Europe estimated at 3% of revenue.
2 Assumed non-Euro countries in Europe are 3% of revenue and Canada is 1.5% of revenue.
3 Assumed $1=€0.79 based on the average for 2012.4 Assumed Canada is 1.5% of revenue.5 Aegis/Dentsu based on disclosed pro forma group revenue splits against
2012 analyst estimates.
New markets, new media and Consumer Insight account respectively for 30%, 33%1 and 24% of the Group’s revenues
WPP ANNUAL REPORT 2012
How we’re doingLetter to share owners
28

Revenue in faster-growing markets 2004-2012 $bn
WPPOmnicom1,2
Publicis1
IPG1
2004 2010 2011 20120
1
2
3
4
5
The budgets for 2013 have been prepared on a somewhat more conservative basis than usual (hopefully) following the slowing like-for-like revenue growth rate in the middle two quarters of 2012. However, they continue to reflect the faster-growing geographical markets of Asia Pacific, Latin America, Africa and Central and Eastern Europe and faster-growing functional sectors of Advertising, Media Investment Management and direct, digital and interactive to some extent moderated by the slower growth in the mature markets of the US and Western Europe. Our 2013 budgets show like-for-like revenue and gross margin growth of around 3% and a target operating margin improvement of 0.5 margin points.
Incentive plans for 2013 will continue to emphasise revenue (particularly in the mature markets of our custom Consumer Insight businesses) and operating profit growth in conjunction with operating margin improvement, although objectives will continue to include qualitative Group objectives, including coordination and co-operation, talent management and succession planning.
At the time of writing, we have revenue and profit data for the first three months of 2013. The Group has had a solid start to the year, with like-for-like revenue growth up over 2% in the first quarter. The trend by geography is similar to the final quarter of 2012, with strong growth in Asia Pacific and Latin America, countered by the more difficult mature Western and Continental Europe markets. By sector, Advertising and Media Investment Management remains strong and Consumer Insight is showing an improvement in growth compared with the fourth quarter of 2012. These trends are in line with our budgets, which also indicate a broadly steady rate of growth throughout the year, albeit with the usual conservatism in quarter four. Operating profits and margins were above budget.
2014 looks a better prospect, however, with the FIFA World Cup in Brazil, the Winter Olympics in Sochi and, would you believe, another US election – the mid-term Congressionals. The first two events will continue to reposition Brazil and Latin America
1 Peer data sourced from annual results translated at average exchange rate for the year.
2 Assumed non-Euro countries in Europe are 3% of revenue and Canada is 1.5% of revenue.
and Russia and Central and Eastern Europe in the world’s mind, just like the Beijing Olympics did for China and Asia and the FIFA World Cup did for South Africa and the continent of Africa – and London 2012 did for the UK.
The longer term looks more favourable
In the long term, the outlook for the communications services industry appears favourable.
Globalisation, overcapacity of production in most sectors and the shortage of human capital, the developments in new technologies and media, the growth in importance of internal communications, the need to influence retail distribution, brand emphasis on health and wellness, the growth in government spending and the new focus on corporate sustainability issues such as climate change underpin the need for our clients to continue to differentiate their products and services both tangibly and intangibly.
Moreover, the continuing growth of the BRICs, Next 11 and other faster-growing geographical markets will add significant opportunities in Asia Pacific, Latin America, Africa and the Middle East and Central and Eastern Europe – along with the growth of ‘new-BRICs’ such as Vietnam, Pakistan, Indonesia, Bangladesh, Nigeria, Colombia, Turkey and Mexico and even Myanmar. Advertising and marketing services expenditure as a proportion
WPP ANNUAL REPORT 2012
How we’re doingLetter to share owners
29
of GDP has started to resume its growth, although in these relatively low-inflationary times, where our clients have limited pricing power, we remain committed to working with our clients and their procurement departments to improve the effectiveness and efficiency of their spending and investments.
Given these short-term and long-term trends, your Company believes it has the correct strategic priorities – new markets, new media, Consumer Insight and ‘horizontality’ – and a focus on not only strategic planning, creative execution and distribution, but also on both the application of technology and analysis of data, to the benefit of our clients and people.
Including associates, the Group currently employs over 165,000 full-time people (up from over 158,000 the previous year) in over 3,000 offices in 110 countries. It services 350 of the Fortune Global 500 companies, all 30 of the Dow Jones 30, 63 of the NASDAQ 100, 31 of the Fortune e-50, and almost 760 national or multinational clients in three or more disciplines. Almost 480 clients are served in four disciplines and these clients account for over 57% of Group revenues. The Group also works with almost 360 clients in six or more countries.
These statistics reflect the increasing opportunities for ‘horizontality’ – developing client relationships between activities nationally, internationally and by function. We estimate that well over a third of new assignments in the year were generated through the joint development of opportunities by two or more Group companies. The Group continues to improve co-operation and coordination among its operating
companies in order to add value to our clients’ businesses and our people’s careers, an objective which has been specifically built into short-term incentive plans. ‘Horizontality’ has been accelerated through the appointment of more than 35 Global Client Leaders for our major clients, accounting for almost $6 billion of total revenues of $17 billion, and Country Managers in a growing number of ‘test’ markets. The Group continues to lead the industry in coordinating investment geographically and functionally through parent company initiatives and winning Group pitches. For example, the Group has been very, very successful in the recent wave of consolidation in the pharmaceutical industry and the resulting ‘team’ pitches.
The Group continues to improve co-operation and coordination among its operating companies in order to add value to our clients’ businesses and our people’s careers
WPP ANNUAL REPORT 2012
How we’re doingLetter to share owners
30
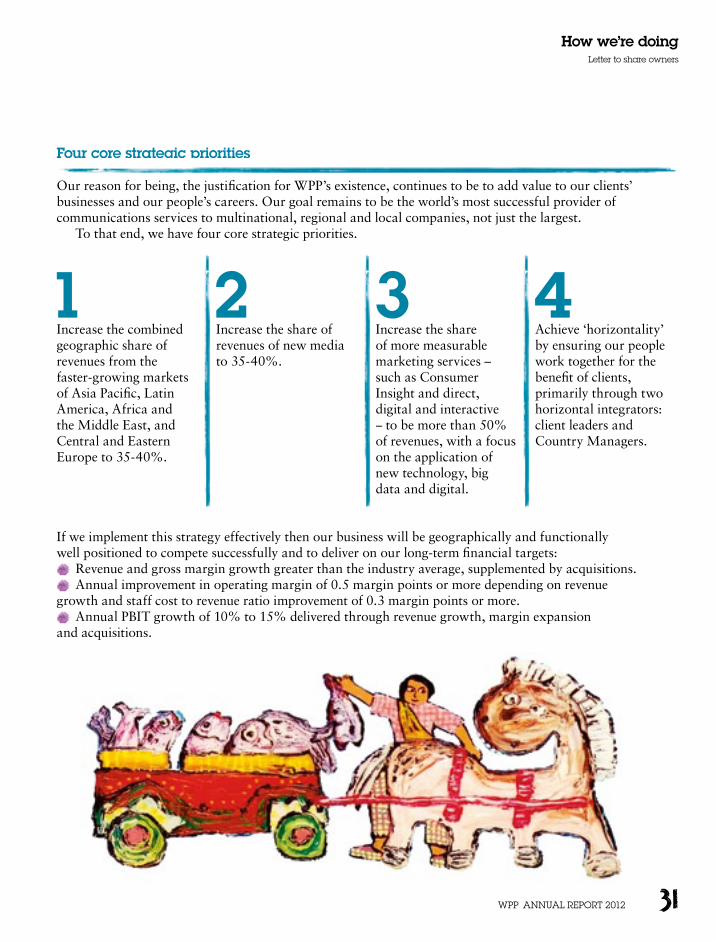
Four core strategic priorities
Our reason for being, the justification for WPP’s existence, continues to be to add value to our clients’ businesses and our people’s careers. Our goal remains to be the world’s most successful provider of communications services to multinational, regional and local companies, not just the largest.
To that end, we have four core strategic priorities.
1Increase the combined geographic share of revenues from the faster-growing markets of Asia Pacific, Latin America, Africa and the Middle East, and Central and Eastern Europe to 35-40%.
2Increase the share of revenues of new media to 35-40%.
3Increase the share of more measurable marketing services – such as Consumer Insight and direct, digital and interactive – to be more than 50% of revenues, with a focus on the application of new technology, big data and digital.
4Achieve ‘horizontality’ by ensuring our people work together for the benefit of clients, primarily through two horizontal integrators: client leaders and Country Managers.
If we implement this strategy effectively then our business will be geographically and functionally well positioned to compete successfully and to deliver on our long-term financial targets:
Revenue and gross margin growth greater than the industry average, supplemented by acquisitions. Annual improvement in operating margin of 0.5 margin points or more depending on revenue
growth and staff cost to revenue ratio improvement of 0.3 margin points or more. Annual PBIT growth of 10% to 15% delivered through revenue growth, margin expansion
and acquisitions.
WPP ANNUAL REPORT 2012
How we’re doingLetter to share owners
31

Headline operating margins1 vs peers %
2008 2009 201220112010
WPPIPGOmnicomPublicisHavasWPP including associatesWPP grossmargin margin2
5
10
15
20
Our six specific objectives
Here are six objectives which represent our key performance indicators (KPIs). For an assessment of how we performed against them in 2012, read on.
1 Continue to improve operating margins.
2 Increase flexibility in the cost structure.
3 Use free cash flow to enhance share owner value and improve return on capital.
4 Continue to develop the value added by the parent company.
5 Emphasise revenue growth more as margins improve.
6 Improve still further the creative capabilities and reputation of all our businesses.
1 First, to continue to improve operating margins. In 2012, we achieved a margin of 14.8%, a new high. We continue to believe a margin of around 18% or more is a tough, but realistic, objective
given that our best-performing companies in each services sector have already demonstrated they can perform at a combined Group margin of 17%. It may well be that headline PBIT as a percentage of gross margin is a more accurate competitive comparison and we achieved 16.1% in 2012, the highest level in the industry.
The Group has embarked on a number of programs to improve operational effectiveness including shared service centres and offshoring certain tasks away from high-cost markets. We are consolidating IT infrastructure and centralising systems development and applications to create efficiencies and focus investment. These programs are projected to deliver a 1.0 margin point benefit over the course of the next three to five years.
1 Based on headline operating profit as defined on page 227, excluding share of results of associates, and sourced from relevant public filings, adjusted to a comparable basis to WPP.
2 Gross margin margin is defined as headline PBIT as a proportion of gross margin.
WPP ANNUAL REPORT 2012
How we’re doingLetter to share owners
32

Distributions to share owners1 £m
1211100908
4.3%Buy-backsDividends paid
4.5%3.0%3.4%4.7%
4.3% 0
150
300
450
600
2 Second, to increase flexibility in the cost structure. In 2012, flexible staff costs (including incentives, freelance and consultants) remained close to historical
highs of around 7% of revenues and continue to position the Group extremely well, if current market conditions change.
Change in variable costs % 2012201120102009
Variable staff costs as a % of staff costs
Variable staff costs as a % of revenue
0
3
6
9
12
157.89.7 6.77.25.712.2 11.413.4
3 Third, to enhance share owner value and maximise the return on investment on the Company’s substantial free cash flow of almost £1.1 billion (or over $1.7 billion).
There are broadly three alternative uses of funds: Capital expenditure, which usually approximates
the depreciation cost. Pressure here has eased as technology pricing has fallen, although we have increased investment in our digital- and technology-based service offering, in line with our strategic goals. The Group has actively assessed its IT infrastructure in 2012 and consequently accelerated its overhaul of centralised IT services, although the pace of process simplification, offshoring and outsourcing needs to be quickened. We have been too slow. We have also invested significantly more in real estate following lease renewals to secure greater efficiencies. A large part of the proceeds from the sale of the freehold of 285 Madison Avenue in New York have been reinvested in relocating the headquarters of Young & Rubicam Inc. to a more modern, efficient facility at 3 Columbus Circle.
Mergers and acquisitions, which have historically taken the lion’s share of free cash flow. Here we have raised the hurdle rate on capital employed so that our return on capital may be increased. There is a very
significant pipeline of reasonably-priced small- and medium-sized potential acquisitions, with the exception of Brazil and India and digital in the US, where prices seem to have got ahead of themselves because of pressure on our competitors to catch up. This is clearly reflected in some of the operational and governance issues that are starting to surface elsewhere in the industry, particularly in fast-growing markets like China and Brazil.
Our acquisition focus in 2012 was again on the triple play of faster-growing geographic markets, new media and consumer insight, including the application of technology and big data, totally consistent with our strategic priorities in the areas of geography, new communication services and measurability. In 2012, the Group spent £500 million on initial acquisition payments, net of cash acquired and disposal proceeds. Net acquisition spend is currently targeted at around £300 to £400 million per annum and we will continue to seize opportunities in line with our strategy.
Dividends or share buy-backs. We have increasingly come to the view, based on co-operative research with leading investment institutions, that, currently, the markets favour consistent increases in dividends and higher maintainable pay-out ratios, along with anti-dilutive buy-backs and, of course, sensibly-priced strategic acquisitions.
Following the strong first-half results in 2012, your Board raised the interim dividend by 18%, around 5.0 percentage points higher than the growth in headline
1 Sum of share buy-backs and dividends paid divided by average shares in issue for the relevant period, as a percentage of the average share price for the relevant period.
WPP ANNUAL REPORT 2012
How we’re doingLetter to share owners
33
diluted earnings per share, a pay-out ratio in the first half of 34%. For the full year, headline diluted earnings per share rose by 8.4% and the final dividend has been increased by 15%, bringing the total dividend for the year to 28.51p per share, up 15.9%, 7.5 percentage points higher than the growth in headline diluted earnings per share. With a dividend pay-out ratio of 39% in 2012, and having largely achieved the objective of a 40% pay-out ratio set in 2010, your Board will give consideration to the merits of increasing the pay-out ratio further, in the range of 45-50%. Dividends paid in respect of 2012 will total almost £360 million for the year.
On 2 January 2013, the Scheme of Arrangement between WPP 2012 Limited (formerly WPP plc) and its share owners, in relation to the introduction of a new Jersey incorporated and UK tax resident parent company, became effective and new WPP, which has adopted the same name, WPP plc, became the new parent company of the WPP Group. As a consequence of the Group returning its tax residence to the UK, the dividend access plan and scrip dividend have been terminated.
Share buy-backs will continue to be targeted to absorb any share dilution from issues of options or restricted stock, although the Company does also have considerable free cash flow to take advantage of any anomalies in market values, as it did last year. Share buy-backs in 2012 cost £135 million, representing 1.3% of issued share capital.
4Fourth, we will continue to develop the value added by the parent company and build unique integrated marketing approaches for clients. WPP is not just
a holding company focused on planning, budgeting, reporting and financial issues, but a parent company that can add value to our clients and our people in the areas of human resources, property, procurement, IT and practice development, including sustainability. We will continue to do this through a limited group of 400 or so people at the centre in London, New York, Tokyo, Hong Kong, Shanghai and São Paulo. This does not mean that we seek to diminish the strength of our
operating brands, but rather to learn from one another. Our objective is to maximise the added value for our clients in their businesses and our people in their careers.
Many of our initiatives are possible because of the scale on which we now operate. In the optimum use of property, in information technology and in procurement generally, we are able to achieve efficiencies that would be beyond the reach of any individual operating company. But it is also clear that there is an increasing requirement for the centre to complement the operating companies in professional development and client coordination. It is a relatively recent development for certain multinational marketing companies, when looking to satisfy their global communications needs, to make their initial approach not to operating companies, but directly to holding or parent companies.
Such assignments present major, and increasingly frequent, opportunities for the few groups of our size. It is absolutely essential that we have the professional resources and the practice development capability to serve such clients comprehensively, actively and creatively. Initiatives involving some of the world’s largest marketers continue to gain momentum. The world’s largest advertiser is itself integrating its efforts around brands, in the areas of advertising, media investment management, market research, packaging design and public relations. Our largest client is seeking a seamless model, effectively a one-client agency within our Group. All our clients, whether global, multinational or local, continue to focus on the quality of our thinking, coordination of communications and price. In response, we focus on talent, structure and incentives.
Managing talent is the priority
Talent and its management therefore remain at the heart of our reason to be: that is what our clients pay us for. Development of our people and the way we manage that talent is a critical determinant of performance and on that critical dimension, we continue to make significant progress.
WPP ANNUAL REPORT 2012
How we’re doingLetter to share owners
34

In developing highly competitive incentives combined with extremely attractive working environments, we increasingly differentiate ourselves from our competitors and improve the attractiveness of WPP companies as destinations for talent. Our quarterly reviews with the operating companies have been structured to give more time and attention to talent and to clients. Our recruiting efforts throughout 2012 were especially fruitful as we successfully targeted and recruited top talent within and beyond our industry, often competing with investment banking, management consulting, new media and private equity offers. The war for talent is fierce and will intensify further, and there is more to be done.
The blueprint for our executive development curriculum has been completed, and our flagship client leadership training program, Maestro, now in its 10th year, is being continuously developed. The parent company and each of our operating companies have installed their own approach to performance assessment and succession planning, aimed at developing the careers of their people, improving the quality of feedback, coaching and mentoring they receive and providing for orderly succession. A senior management mentoring and development program, ‘The X Factor’, run by Charlotte Beers, the former chairman and CEO of Ogilvy & Mather and chairman of JWT, continues to prepare women for the next level of leadership in the Group.
In 2011, your Company teamed up with the Shanghai Art & Design Academy (SADA) to establish the WPP School of Marketing and Communications. This jointly run school offers China’s first professional marketing and communications three-year diploma program. This initiative continued in 2012, with the second intake of 88 students. After 18 years, the WPP Marketing Fellowship program remains (sadly) the only multi-disciplinary and multi-geographical recruitment and training initiative in the industry.
We continued to scrutinise and modify our compensation practices, both to offer competitive and appropriately based rewards to our people and to attract outstanding talent from elsewhere. This
is a key strategic priority for us. Our competition is, sometimes, not so rigorous in evaluating and rewarding performance – for example, taking advantage of sharp falls in share prices to re-price or issue options or giving limited disclosure to investors of compensation plan details. A failure of external, as well as internal, audiences to understand the importance of globally competitive incentive-based compensation will undermine the Company’s leadership position. After all, we invest almost $10 billion a year in human capital, as opposed to only $500 million in fixed assets – 20 times more.
Communications
Of all businesses, a communications services company must be a model of excellent external and internal communications. To that end, we accelerate understanding of the Group’s vast resources with a raft of regular communications through our websites, our social media channels and in print: our monthly public online news bulletin, e.wire; our consistently-awarded global newspaper and eBook, The WIRE; our annual Atticus Journal of original marketing thinking; the WPP Reading Room, an extensive online library of think pieces (both public and original) from WPP professionals worldwide; our online Fact Files profiling Group resources/ companies/products; regular communication on Group initiatives such as the WPP Worldwide Partnership Program and the WPP Marketing Fellowship Program; our annual award-winning Sustainability Report and this consistently award-winning Annual Report, both in print and online.
As part of the increased focus on ‘horizontality’, WPP’s award-winning public website is being refreshed to highlight the scope and scale of the Group as well as enhancing the overall user experience. The Group intranet is being redeveloped to facilitate further internal strategic alliances and cross-company co-operation.
WPP ANNUAL REPORT 2012
How we’re doingLetter to share owners
35

Property management
In 2012 we again reduced our core property portfolio. While overall square footage rose by 1.4% from 23.2 million sq ft to 23.5 million sq ft, this was less than half the 2.9% increase in revenue attributable to acquisitions, and considerably less than the 5.8% growth in constant currency revenues.
Average square foot per head dropped from 211 sq ft to 207 sq ft, but this was partly offset by a 1.6% increase in cost per square foot to £29.50. As a result, we held the establishment cost-to-revenue ratio at 6.7%, flat with prior year and ahead of our long term 7% run-rate target.
Our aim for 2013 is to improve on this level in spite of sharp increases in Asia property costs and the impending end of a number of significant below market leases in the region.
Procurement
In procurement, our goal is to make savings and add value across all of WPP’s external spend, with particular emphasis on opportunities to leverage our scale to the benefit of our clients and our companies.
In 2012, we completed a three-year implementation of a procurement spend analytics system which now provides supplier-level visibility of close to $5 billion of external spend, across our eight largest markets – the US, the UK, Germany, France, Spain, China, India and Brazil. Access to data of this detail is now driving supplier cost reduction and value improvement targets across the Group. At least one further market will be added in 2013, and others in subsequent years. As a consequence of better data, 2012 also saw the re-organisation of procurement into four spend teams with global/regional reach.
For 2013, we will continue our focus on the key drivers of supplier cost. Specifically for technology and indirect procurement, our goal is to have a minimum of 50% of supplier spend in each major country, covered by WPP preferred suppliers and contracts, and for these
preferred suppliers to work with us to deliver year-on-year value improvement. Specific targets will be set for the newest areas of procurement focus, following detailed opportunity analysis which began in 2012.
Information technology
In 2012 we initiated a major review of the Group’s IT operations to make them better co-ordinated, more responsive to changing needs (both internal and external) and more cost-effective. Core to this strategy will be greater centralisation and consolidation of the Group’s IT infrastructure and services, with the objective of delivering savings of around 10% (or £50 million) on current delivery cost. We estimate implementation will take two to three years and we have engaged PwC to assist with the project.
As mentioned previously, these initiatives were accelerated in the fourth quarter of 2012 following the devastation caused by Hurricane Sandy. The significant loss of power in New York and subsequent flooding had some impact on the operational effectiveness of certain of the Group’s IT infrastructure and back-office systems, making the overhaul of our centralised IT services all the more important.
Additionally, the rapid and continuing convergence of mobile, voice and data communications has allowed us to take advantage of new offerings in the telecommunications sector to increase efficiencies and to provide enhanced support to our increasingly mobile workforce.
Practice development
In practice development we continue to develop horizontal initiatives in a focused set of high-potential areas across our vertical operating brands: in media investment management, healthcare, sustainability, government, new technologies, new markets, retailing, shopper marketing, internal communications, financial services and media and entertainment. Specifically, we continue to invest in
WPP ANNUAL REPORT 2012
How we’re doingLetter to share owners
36
Organic revenue growth vs peers %
Q410 Q111 Q211 Q311 Q411 Q112 Q212 Q312 Q412
WPPIPG1
Omnicom1
Publicis1
Havas1
WPP organicgross margin margin
-2
0
2
4
6
8
10
12
14
sharing insights and developing initiatives through WPP Digital (in digital marketing and media) and The Store (in distribution and retail).
In key geographic markets we are increasingly coordinating our activities through WPP Country Managers. We continue to believe that increasing coordination is required between our brands at the country and global levels, as the arguments for investment in regional management become weaker, largely because of improved technology. In addition, we have increased the number of WPP Global Client Leaders to co-ordinate our efforts on behalf of clients and to ensure they receive maximum benefit from their relationships with WPP operating brands.
Furthermore, we continue to encourage internal strategic alliances and promote co-operation. Practice development initiatives have therefore been reinforced in such areas as healthcare, retail, internal communications, corporate sustainability and media and entertainment. This has been especially important in developing our portfolio of direct investments in new media under WPP Digital and where our investments are working with our agencies and people to bring new technology capabilities and understanding to our clients.
All these initiatives are designed to ensure that we, the parent company, really do (as well as being perceived to) inspire, motivate, coach, encourage, support and incentivise our operating companies to achieve their strategic and operational goals.
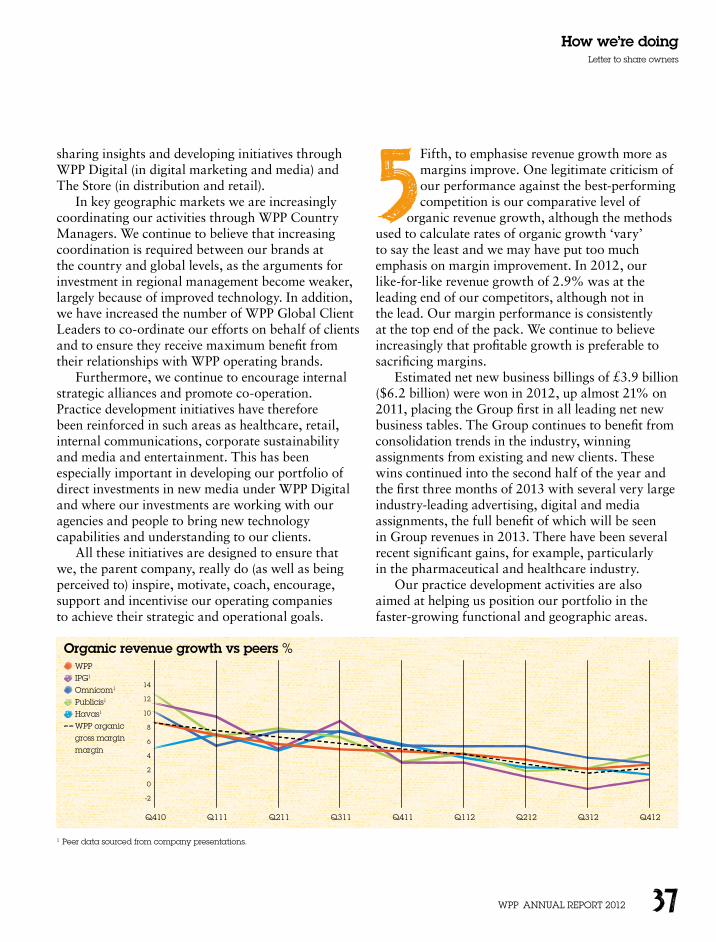
5Fifth, to emphasise revenue growth more as margins improve. One legitimate criticism of our performance against the best-performing competition is our comparative level of
organic revenue growth, although the methods used to calculate rates of organic growth ‘vary’ to say the least and we may have put too much emphasis on margin improvement. In 2012, our like-for-like revenue growth of 2.9% was at the leading end of our competitors, although not in the lead. Our margin performance is consistently at the top end of the pack. We continue to believe increasingly that profitable growth is preferable to sacrificing margins.
Estimated net new business billings of £3.9 billion ($6.2 billion) were won in 2012, up almost 21% on 2011, placing the Group first in all leading net new business tables. The Group continues to benefit from consolidation trends in the industry, winning assignments from existing and new clients. These wins continued into the second half of the year and the first three months of 2013 with several very large industry-leading advertising, digital and media assignments, the full benefit of which will be seen in Group revenues in 2013. There have been several recent significant gains, for example, particularly in the pharmaceutical and healthcare industry.
Our practice development activities are also aimed at helping us position our portfolio in the faster-growing functional and geographic areas.
1 Peer data sourced from company presentations.
WPP ANNUAL REPORT 2012
How we’re doingLetter to share owners
37

The Group completed 65 acquisitions in 2012; 28 acquisitions and investments were classified in new markets (of which 20 were in new media), 27 in Consumer Insight, including data analytics and the application of technology, with the balance of 10 driven by individual client or agency needs.
Specifically, in 2012 acquisitions and increased equity stakes were completed in Advertising and Media Investment Management in the US, Germany, the Netherlands, the Slovak Republic, Turkey, Israel, Jordan, Brazil, Colombia, Mexico, Australia, China, South Korea, Thailand and Vietnam; in Consumer Insight in the US, France, Germany, Turkey, UAE, Chile, China and Pakistan; in Public Relations & Public Affairs in the US, Canada, the UK, Denmark, Finland, France, Russia and Australia; in direct, digital and interactive in the US, the UK, Germany, Hungary, Russia, South Africa, Turkey, Australia, China, Indonesia, Pakistan and Singapore; and in Healthcare Communications in Hong Kong.
So far in 2013, the Group has made acquisitions or increased equity interests in Advertising and Media Investment Management in Australia, Canada, Colombia, Myanmar and Thailand; in Consumer Insight in Cambodia and Myanmar; in Public Relations & Public Affairs in China and Vietnam; and in direct, digital and interactive in Latin America, China, the Philippines, South Africa, Turkey, the UK and the US.
These acquisitions continue to move us forward to our previously described strategic priorities; expanding the share of revenues of our businesses in Asia Pacific, Latin America, Africa and the Middle East, and Central and Eastern Europe to 35-40%; in new media to 35-40%; and in Consumer Insight, direct, digital and interactive, to over one-half.
Expansion plans
We intend to expand our strong networks – Ogilvy & Mather, JWT, Y&R, Grey, United, CHI Bates & Partners, Mindshare, MEC, MediaCom, Maxus, tenthavenue, TNS, Millward Brown, Kantar Media,
Kantar Health, Kantar Retail, Kantar Worldpanel, Hill+Knowlton Strategies, Ogilvy Public Relations, Burson-Marsteller, Cohn & Wolfe, OgilvyOne Worldwide, Wunderman, OgilvyAction, G2, POSSIBLE, 24/7 Media, AKQA, Ogilvy CommonHealth Worldwide, Sudler & Hennessey, ghg, The Brand Union, Landor and FITCH – in high-growth markets or where their market share is insufficient. Indeed, we recently announced the merger of OgilvyAction and G2 to form the largest and most geographically complete activation agency in the world. Together they will be uniquely placed to exploit the intersection of the world’s brands and distribution systems.
We will also enhance our leadership position in Consumer Insight by further development of our key brands with particular emphasis on North America, Asia Pacific, Latin America and Continental and Eastern Europe. We will continue our growth of research panels and have established a Kantar-wide operational capability. We will reinforce our growing position in media research through Kantar Media, which includes our investments in television and internet audience research and IBOPE, Marktest and CSM/CTR, which, combined, is the market leader outside North America. We now measure television and/or internet audiences in 46 countries around the world.
In addition, we intend to reinforce our worldwide strength in direct and interactive marketing and research through our traditional channels such as OgilvyOne, Wunderman, G2, Blanc & Otus and Lightspeed. We will also invest directly in new channels through start-ups, particularly as US and French valuations in search, for example, are still prohibitive. Other opportunities will be sought to enhance our online capabilities.
Lastly, we will continue to develop our specialist expertise in areas such as healthcare, retail and interactive and to identify new high-growth areas.
WPP ANNUAL REPORT 2012
How we’re doingLetter to share owners
38

Creativity remains paramount
6Sixth, to improve still further the creative capabilities and reputation of all our businesses. In pursuing these aims, the Group is led by John O’Keeffe, WPP’s
worldwide creative director. Under John’s guidance progress continues to be impressive.
There is much talk of co-ordinated communications, ‘horizontality’, and price effectiveness.
All are important. None is as important as the quality of the work. Creative excellence remains and will remain
paramount. If you drew a graph plotting creative awards (as a proxy for creativity) against margins, for any group of agencies, there would be a very strong correlation. The more awards, the stronger the margins. The client’s procurement department fades into the background when the work is strong.
Of the three things we do – strategic thinking, creative execution and co-ordination – creative execution is undoubtedly the most important.
This of course means creativity in its broadest sense. Our clients look for creative thinking and output
not just from advertising agencies, public relations and design companies, but also from our media companies and our research companies. Millward Brown remains arguably one of our most creative brands. Witness the BrandZ™ Top 100 Most Powerful Brands study published annually with the Financial Times and its study of the BrandZ™ Top 50 Most Valuable Chinese Brands, together with the recently launched BrandZ™ Top 50 Most Valuable Latin American Brands.
We intend to achieve our creative objectives by stepping up our training and development programs; by recruiting the finest external talent; by celebrating and rewarding outstanding creative success tangibly and intangibly; by acquiring strong creative companies; and by encouraging, monitoring and promoting our companies’ achievements in winning creative awards.
Early on in his tenure John O’Keeffe identified Cannes as the most important arena to demonstrate the Group’s creative credentials. Results have been very encouraging.
For the second year running your Company was named Creative Holding Company of the Year at the 2012 Cannes Lions International Festival of Creativity. The festival is the world’s premier showcase for excellence in communications, covering all markets and all disciplines. Back to back recognition of this kind is a real marker of progress and consistency, particularly as our main competitors posted record performances of their own.
Based on the collective number of Cannes Lions awarded to WPP agencies for creative excellence, WPP accumulated 1,589 points in the competition, followed by Omnicom second with 1,383 points and Publicis with 1,018 points. Awards were won by WPP agencies from more than 30 countries across all continents. Following 2011’s advertising Grand Prix for JWT Shanghai, in a gratifying double for WPP China, 2012 saw another Grand Prix awarded to Ogilvy Shanghai. And in what proved to be a stellar year all round, Ogilvy was also named winner of the coveted Network of the Year.
2012 also saw the sixth annual WPPED Cream awards, our internal awards program for outstanding work across the Group.
Having said this, we have to maintain a careful and to some extent cautious approach. A recent significant problem we had in the creative area has made us take a long, detailed look at our creative culture to make sure that our emphasis on creative improvement doesn’t result in inappropriate ‘scam’ ads for festivals, for example. We need to take total responsibility for such events and make sure that our drive in creativity doesn’t result in totally inappropriate behaviour.
WPP ANNUAL REPORT 2012
How we’re doingLetter to share owners
39

Sustainability matters
The Group’s commitment to, and investment in, sustainability initiatives supports major business wins. We estimate that clients who engaged with WPP on our approach to sustainability were worth $1.2 billion to the Group in 2012.
We are in business for the long term and, like all leading companies today, we recognise our responsibilities to clients, our people and the world at large. Sustainability at WPP cuts across all areas of our business. From the work we do for clients, to the time we donate to causes through pro bono work and the way we run our company and look after our people. Sustainability issues are ever more important to our clients, and our own track record gives us credibility as advisors on these topics.
A summary of the Group’s approach to sustainability can be found on pages 145 to 153. Please also see our annual Sustainability Report on the work our clients and our people do in these increasingly important areas.
Future challenges
A colossal amount remains to be done – challenging our clients, and therefore us. It seems certain that once these objectives are achieved, they will be replaced by new ones. As companies grow in size, most chairmen and CEOs become concerned that their organisations may become flabby, slow to respond, bureaucratic and sclerotic. Any sensible business leader aggressively resists this phenomenon; we all seek the benefits of size and scale without sacrificing the suppleness and energy of a smaller firm. And, for the first time, new technologies now make this possible on a global platform. WPP wants the scale and resources of the largest firm together with the heart and mind of a small one.
And finally...
All our most successful marketing clients follow marketing’s most fundamental rules: understand your consumers; know what they want; anticipate change; provide the answers; be constant in your delivery.
WPP, too, is a marketing company. Our consumers are our clients. And we try very hard to follow those same fundamental rules. A significant change that we were early to identify and first to satisfy has been the demand among some clients to be served not by a series of specialist agencies but by a dedicated team; a team made up of specialists from all relevant communications disciplines, who remain members of their specialist agencies, while at the same time collaborating on a daily basis to provide a truly integrated client service with no joins showing. This (at least in part) is what we mean by ‘horizontality’.
Rapid changes in technology, the fragmentation of media and the acknowledged success of many of the early teams have made this approach increasingly attractive to certain clients.
As a structure, it is less radical than it probably sounds. In the far-off days of ‘the full-service agency’, a client’s working account group – the only unit of real importance to the client – would be
Sustainability performance summary2012 2011 2010
Value of client business supported by our sustainability credentials* $1.2bn $1bn –Gender diversity (% of women total employees) 54% 54% 54%Gender diversity (% of women Board directors/executive leaders) 32% 31% 31%Investment in training and welfare £57.8m £58.3m £48.9mCarbon footprint (tonnes of CO2 per person) 2.45 2.44 2.51Social investment (£ million) £16.2m £15.3m £14.3m
* Value of clients who requested information on our sustainability policies and performance through their supplier management process.
WPP ANNUAL REPORT 2012
How we’re doingLetter to share owners
40

formed from specialists from each department: account management, planning, creative, media – and any of many others according to a specific client’s specific needs.
The team approach is similar; and, much like the agency account group, expects its members to have something approaching dual nationality. They are at once paid-up members of their specialist tribe, be it department or company – and committed members of the dedicated client team.
The needs of no two clients are the same. The team approach will never be universal. But seamless collaboration of this kind, with no compromise on quality, requires high degrees of understanding of the bigger picture – which, of course, is precisely why the client values it so highly.
Last year’s Group performance, as detailed in this report, was made possible by tens of thousands of talented individuals; each with a particular individual skill; some working entirely in groups within their companies and some in dedicated client teams; and all contributing to a greater whole.
They have earned our very public gratitude.
Philip LaderChairman
Sir Martin SorrellGroup chief executive
Paul RichardsonGroup finance director
WPP ANNUAL REPORT 2012
How we’re doingLetter to share owners
41

Forward-looking statements
In connection with the provisions of the Private Securities Litigation Reform Act of 1995 (the ‘Reform Act’), the Company may include forward-thinking statements (as defined in the ‘Reform Act’) in oral or written public statements issued by or on behalf of the Company. These forward-looking statements may include, among other things, plans, objectives, projections and anticipated future economic performance based on assumptions and the like that are subject to risks and uncertainties. As such, actual results or outcomes may differ materially from those discussed in the forward-looking statements. Important factors which may cause actual results to differ include but are not limited to: the anticipated loss of a material client or key personnel, delays or reductions in client advertising budgets, shifts in industry rates of compensation, government compliance costs or litigation, natural disasters or acts of terrorism, the Company’s exposure to changes in the values of other major currencies (because a substantial portion of its revenues are derived and costs incurred outside of the UK) and the overall level of economic activity in the Company’s major markets (which varies depending on, among other things, regional, national and international political and economic conditions and government regulations in the world’s advertising markets). In addition, you should consider the risks described under the caption principal risks and uncertainties on pages 162 to 165, which could also cause actual results to differ from forward-looking information. In light of these and other uncertainties, the forward-looking statements included in this document should not be regarded as a representation by the Company that the Company’s plans and objectives will be achieved. The Company undertakes no obligation to update or revise any such forward-looking statements, whether as a result of new information, future events or otherwise.
WPP ANNUAL REPORT 2012
How we’re doingLetter to share owners
42