Lessons Learned in Static Analysis Tool...
19
Providing World-Class Services for World-Class Competitiveness 1 Lessons Learned in Static Analysis Tool Evaluation
Transcript of Lessons Learned in Static Analysis Tool...

Providing World-Class Services forWorld-Class Competitiveness
1
Lessons Learned in StaticAnalysis Tool Evaluation
Providing World-Class Services forWorld-Class Competitiveness
2
♣ Lessons learned in the evaluation of five (5)commercially available static analysis tools
♣ Topics– Licensing– Performance Measurement– Limitations of Test Cases– Flaw Reporting– Tool Output– Tool Tuning– Tool Suites– Summary
Overview

Providing World-Class Services forWorld-Class Competitiveness
3
♣ Licensing schemes vary among vendors and have very littlein common– Terminology ambiguity (or the same term applied differently by
vendors)• Lines of Code (LOC)• Codebase
♣ Impacts– Return on investment is impacted based on usage
• Secondary releases of code can be impacted by a cumulative LOCcount
– Restrictions on access to output data tied to license scheme♣ Current license schemes better suited for Software (Sw)
Developers vs. Sw Auditors (third party evaluators)
Licensing

Providing World-Class Services forWorld-Class Competitiveness
4
♣ A consistent set of criteria is required formeasuring tool performance– A true positive (TP) is a flaw/weakness identified by a
tool that is proven to be an actual flaw/weakness– A false positive (FP) is a flaw/weakness identified by a
tool that is proven not to be an actual flaw/weakness– A false negative (FN) is a known flaw/weakness that the
tool did not identify• Determining FN rates is problematic as it requires a
thorough knowledge or annotation of the code• The lack of an accurate FN count makes determining the
accuracy of the tools problematic
Performance Measurement

Providing World-Class Services forWorld-Class Competitiveness
5
Limitations of Test Cases
♣Results very sensitive to test caseselection– Tools perform differently with different
languages• Multi-language data set use is desired
– Flaws are grouped at a high level (flaw type)• Many distinct flaws are categorized as buffer overflow• Need to cover the detail of each flaw types
– Complicating factors include:• Read vs. write, scope, indirection, control flow• Natural vs. Seeded flaws• Scalability test difficulty

Providing World-Class Services forWorld-Class Competitiveness
6
Natural Code♣ Exhibits complicated paths♣ Employs real data structs♣ Uses advanced techniques♣ Can stress scalability♣ Exhibits idioms♣ Unknown design intent♣ Unknown # of real flaws♣ Hard to automate analysis
Seeded Code♣ Flaw content (mostly) known♣ Flaw independence♣ Result equivalence easier to
determine♣ Auto generation/testing♣ Very limited in complexity♣ Flaw frequency distribution
does not mirror real world
Limitations of Test Cases (2)

Providing World-Class Services forWorld-Class Competitiveness
7
Limitations of Test Cases (3)
♣Many programs generate code during build– Code is not always generated in an easy to
follow style (complicates review)– Code base is usually very robust– Code base may contain dead or useless code– Some tools will not analyze generated code
♣Causes problems:– One TP or FP can appear as many– Unusual code structure can cause lots of FPs

Providing World-Class Services forWorld-Class Competitiveness
8
Flaw Reporting
♣ Standard formats w/incomplete data♣ Level of detail provided varies
– Some tools provided flaw source, line #, and trace backlinks, and examples etc.; others are limited
♣ Trend analysis varied from non-existing toexcellent
♣ Different levels of checkers granularity♣ No application programming interface (API) to
audit results or access to results data base

Providing World-Class Services forWorld-Class Competitiveness
9
184 fprintf(f, uri);185 fprintf(f, "\r\n");186 for (i = 0; i < nh; ++i)187 fprintf(f, h[i]);
Line 184 was correctlyidentified as containing aFormat String vulnerability. Thevariable “uri” in this programis user controllable and ispassed unchecked to the “format”parameter of “fprintf”.
Line 187 was identified as aTainted Data/Unvalidated UserInput vulnerability. It iscorrect that the data containedin “h[i]” is unchecked usersupplied data, however, likeline 184, this is also passed tothe “format” parameter of“fprintf”. This issue is more aFormat String vulnerability thanit is a Tainted Data issue.
Flaw Reporting (2)

Providing World-Class Services forWorld-Class Competitiveness
10
Tool Output
♣ Tools vary in the types of flaws they detect♣ Certain checkers tended to produce a large
number of FPs (noise generators)– These need to be identified– Difficult without prior knowledge
♣ Manual analysis – Manually inspect the flaw todetermine validity– Open to human interpretation– Experienced human auditor should always make better
judgment than tool– Time consuming
♣ So how do you make a somewhat “objective”comparison of tool performance?

Providing World-Class Services forWorld-Class Competitiveness
11
♣ Objective: Identify 25 flaws types that weredetected by all 5 tools– Only 3 flaw types were detected by all 5 tools– Only 10 flaws types were detected by 4 out of 5 tools
• Improper Return Value Used, Buffer Overflow, CommandInjection, Format String, Memory Leak, Null Pointer De-reference, Tainted Data, Time of Check to Time of Use(TOCTOU), Use After Free, Un-initialized Value
• This set ended up being of interest to the evaluationbecause of coverage not because of the flaw type itself
– There were some additional flaws covered by the tools,but the code base did not provide TP hits
♣ Evaluate the tools at their default and “ideal”settings– Reduce the “noisy” checkers
Tool Output (2)

Providing World-Class Services forWorld-Class Competitiveness
12
Potentialloss of raw
results
More manualanalysis
Tool Tuning
♣ Not all tools are tunable– Some allow tuning in the analysis and/or post analysis
phase
♣ Analysis Phase– Enable/disable analysis engines, algorithms– Set thresholds, filtering of results– Create custom models or rules to help analysis
♣ Post-Analysis Phase (Review and Audit)– Filtering– Categorization– Prioritization

Providing World-Class Services forWorld-Class Competitiveness
13
♣ Initially, requires sample code bases of known flaws– Sample code base consists of analyzed natural and/or seeded
code– Can be further refined as your knowledge base of code grows
♣ Tuning is based upon the flaw checkers– Turn on ALL flaw checking options in the analysis phase and
run the tool against your code samples♣ For each reported issue from the tool extract:
– source file, line number, flaw type, checker - mark it as a TP orFP
♣ Sort by flaw type, then artificially turn off each checker andplot how this affects the TP/FP rate– Shows best TP/FP tuning by flaw type– Allows for comparisons between tools– No constraints on the tool during the analysis phase
Tool Tuning - Virtual
Providing World-Class Services forWorld-Class Competitiveness
14
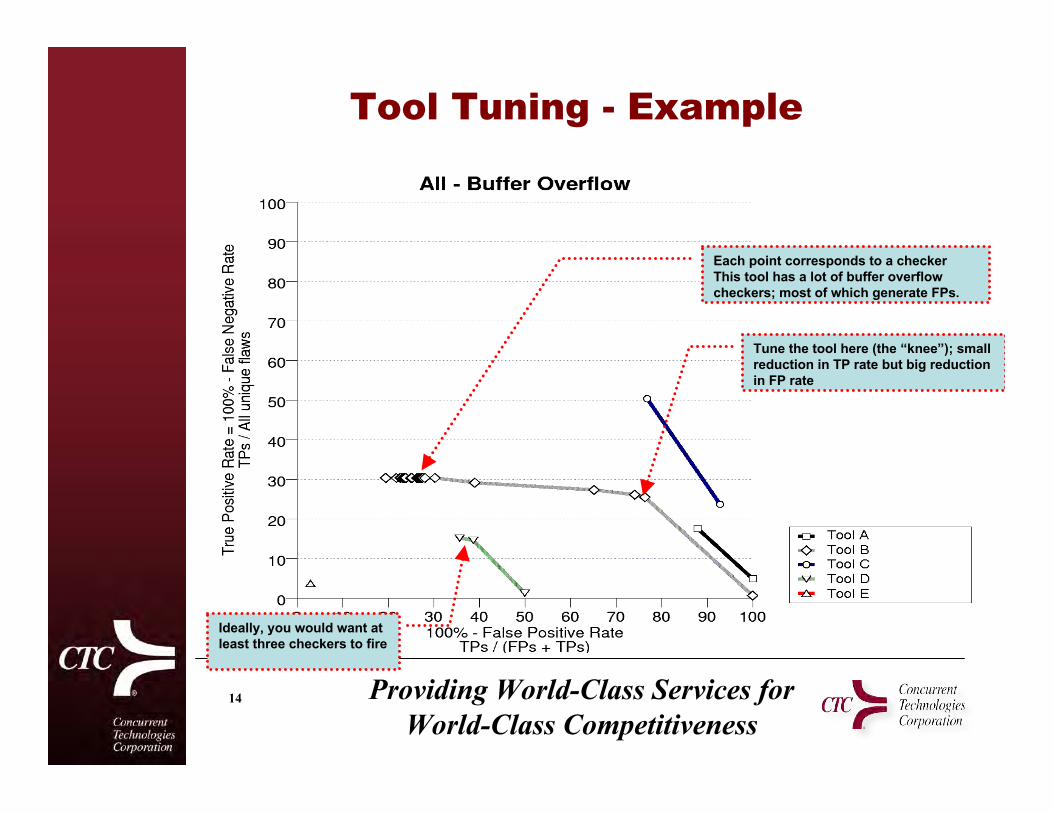
Tool Tuning - Example
Tune the tool here (the “knee”); smallreduction in TP rate but big reductionin FP rate
Each point corresponds to a checkerThis tool has a lot of buffer overflowcheckers; most of which generate FPs.
Ideally, you would want atleast three checkers to fire

Providing World-Class Services forWorld-Class Competitiveness
15
♣ Coverage by one tool is not sufficient– Hard to compare tool performance based on coverage
across the 10 common flaws as a whole– Need to look at how tools perform on a flaw by flaw basis
♣ Trade off between aggressive and conservativetools– Aggressive tools tend to report more TPs but also more
FPs– Conservative tools report fewer FPs but increase the FN
rate
♣ A suite of tools will provide better coverage– Maximized individual flaw coverage requires 2 or 3 tools
Tool Suites

Providing World-Class Services forWorld-Class Competitiveness
16
Tool Suites (2)
Contribution to Total Reported TPs
0%
10%
20%
30%
40%
50%
60%
70%
80%
90%
100%
Impr
oper
Ret
urn
Value
Use
Form
at S
tring
Mem
ory
Leak
TOCTO
U
Buffe
r Ove
rflow
Com
man
d In
ject
ion
Uni
nitia
lized
Var
iabl
e Use
Null P
oint
er D
eref
eren
ce
Taint
ed D
ata
Use
Afte
r Fre
e
Tool E
Tool D
Tool C
Tool B
Tool A

Providing World-Class Services forWorld-Class Competitiveness
17
Tool Suites (3)
Contriution to Total Reported FPs
0%
20%
40%
60%
80%
100%
Impr
oper
Ret
urn
Value
Use
Form
at S
tring
Mem
ory
Leak
TOCTO
U
Buffe
r Ove
rflow
Com
man
d In
jection
Uninitia
lized
Var
iable
Use
Null P
oint
er D
eref
eren
ce
Taint
ed D
ata
Use
Afte
r Fre
e
Tool E
Tool D
Tool C
Tool B
Tool A

Providing World-Class Services forWorld-Class Competitiveness
18
Buffer Overflow Tool Suite Results
Tool A
Tool B
Tool C
Tool D
Tool E
Tool A+B
Tool A+B+C+D+E
0
10
20
30
40
50
60
70
80
90
100
0 10 20 30 40 50 60 70 80 90 100
100% - % of FPs
% o
f T
Ps
Tool A Tool B Tool C Tool D Tool E Tool A+B Tool A+B+C+D+E
Tool Suites (4)

Providing World-Class Services forWorld-Class Competitiveness
19
Summary
♣ Tool overlap is not necessary in a tool suite, but overlap canincrease your confidence
♣ Performance measurement is relative– Sensitive to test case selection– No standard
♣ Lack of automation– Analysis heavily dependent on human verification
♣ Virtual tuning enables you to identify individual toolsstrengths
♣ Disambiguation– Complex problem– Determining if two flaws are the same