Lessons from working with the UK Takeover code -...
16
Capturing synergies in public market transactions Lessons from working with the UK Takeover Code May 2017
Transcript of Lessons from working with the UK Takeover code -...
Capturing synergies in public market transactionsLessons from working with the UK Takeover Code
May 2017

1 Capturing synergies in public market transactions Lessons from working with the UK Takeover Code
1Capturing synergies in public market transactions Lessons from working with the UK Takeover Code
It has now been almost one year since the first issue of ‘Capturing Synergies in Public Market Transactions’ was released. The report set out lessons learned following the revisions to the Takeover Code (the ‘Code’) rules that apply when statements are made regarding the quantification of synergies in transactions (‘quantified financial benefits statement’ (QFBS)).
What we have heard is that the first issue was helpful to management teams starting out with a QFBS, as well as to the directors of those businesses involved, in terms of understanding the requirements, the statements required and the differing views of parties involved in the transaction. It has also provided an excellent basis for discussions with the Takeover Panel, financial advisors and legal advisors.
To build on this positive response and encourage further discussions we wanted to provide an update to take into account transactions over the last 11 months. Over this period we have noted two developments of particular interest:
► Firstly, since the changes to the Code, we have seen the emergence of ‘revised’ QFBS statements following competitive tension in the transaction with the offeror issuing a second statement with an increased quantum of synergies. No doubt the extra time allowed the suitors to process new information or review information not gathered and prepared sufficiently previously, to tackle more difficult synergies and substantiate a further quantum or adjust categories where necessary in light of new information.
► Secondly there has been a notable increase in the inclusion of revenue synergies. Previously only one merger included revenue synergies in the QFBS since the revisions to the Code. In the last eleven months, four parties issued a QFBS that included revenue synergies with one becoming the first non-retail offeror to quantify revenue synergies in a QFBS since the revised Code.
As with the first issue we hope that this updated review provides further useful insights into emerging QFBS practice and aids more effective discussions between advisers and their clients. If you would like to further explore any of the points raised please contact me or one of our team.
Best wishes,
Introduction
M ich el D riessen
Partner, Head of Markets, Transaction Advisory Services, UK&I
2 Capturing synergies in public market transactions Lessons from working with the UK Takeover Code
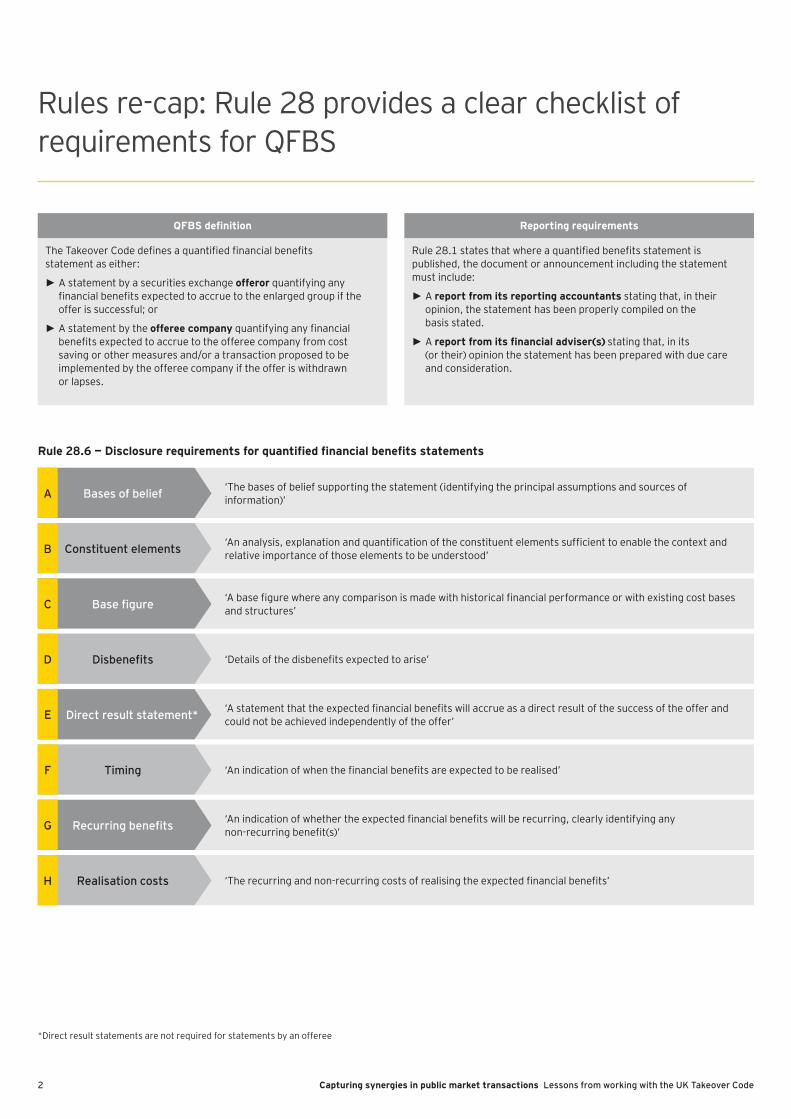
Rules re-cap: Rule 28 provides a clear checklist of requirements for QFBS
The Takeover Code defines a quantified financial benefits statement as either:
► A statement by a securities exchange of f eror quantifying any financial benefits expected to accrue to the enlarged group if the offer is successful; or
► A statement by the of f eree company quantifying any financial benefits expected to accrue to the offeree company from cost saving or other measures and/or a transaction proposed to be implemented by the offeree company if the offer is withdrawn or lapses.
Rule 28.1 states that where a quantified benefits statement is published, the document or announcement including the statement must include:
► A report f rom its reporting accountants stating that, in their opinion, the statement has been properly compiled on the basis stated.
► A report from its financial adviser(s) stating that, in its (or their) opinion the statement has been prepared with due care and consideration.
QFBS definition R eporting req uirements
Rule 28.6 — Disclosure requirements for quantified financial benefits statements
‘The bases of belief supporting the statement (identifying the principal assumptions and sources of information)’Bases of beliefA
‘An analysis, explanation and quantification of the constituent elements sufficient to enable the context and relative importance of those elements to be understood’Constituent elementsB
‘Details of the disbenefits expected to arise’DisbenefitsD
‘An indication of when the financial benefits are expected to be realised’TimingF
‘A base figure where any comparison is made with historical financial performance or with existing cost bases and structures’Base figureC
‘A statement that the expected financial benefits will accrue as a direct result of the success of the offer and could not be achieved independently of the offer’Direct result statement*E
‘An indication of whether the expected financial benefits will be recurring, clearly identifying any non-recurring benefit(s)’Recurring benefitsG
‘The recurring and non-recurring costs of realising the expected financial benefits’Realisation costsH
*Direct result statements are not required for statements by an offeree

Capturing synergies in public market transactions Lessons from working with the UK Takeover Code 3

4 Capturing synergies in public market transactions Lessons from working with the UK Takeover Code
Offeror QFBS published 2014 to March 2017* — c. £170bn of deals with c. £3.9bn of financial benefits
Transactions with QFBS prepared by the offeror
* QFBS have been identified following a review of publically available sources as at 24 March 2017 ** Values expressed in other currencies converted to GBP at the rate quoted in the announcement (where provided)*** Revised QFBS statement1 Combined cost base is sum of offeror and offeree revenues minus sum of offeror and offeree EBITDA2 Financial benefits excludes £1,500mn of ‘exploration expenditure’ savings which are assumed to be non-recurring benefits3 Financial benefits are recurring benefits only — one-time capital expenditure synergies of c. $145mn (c £91mn) are not included
# O f f eree O f f erorO f f eror domicile
D eal V alue (£m) * *
Fi nancial benefits (£m) * *
R ealisation costs (£m) * *
R atio of costs to benefits
Cost synergies as
% of combined cost base1 D ate
1 Amec Foster Wheeler Plc
John Wood Group Plc UK 2,224 110 190 1.7 1.3% 13–Mar–17
2 Aberdeen Asset Management Plc
Standard Life Plc UK 3,776 200 320 1.6 2.1% 6–Mar–17
3 Booker Group Plc Tesco Plc UK 3,657 175 145 0.8 0.3% 27–Jan–17
4 William Hill The Rank Group Plc, 888 Holdings Plc
UK 3,000 100 69 0.7 7.0% 10–Aug–16
5 British Polythene Industries PLC
RPC Group PLC UK 261 23 5 0.2 1.5% 9–Jun–16
6 LSE Group plc*** Deutsche Börse AG DE 10,505 327 436 1.3 16.1% 1–Jun–16
7 Darty plc*** Groupe Fnac Société Anonyme FR 637 109 90 0.8 2.1% 21–Apr–16
8 Home Retail Group plc***
Sainsbury plc UK 1,100 145 130 0.9 0.5% 1–Apr–16
9 Skyepharma PLC Vectura Group plc UK 441 10 9 0.9 9.6% 16–Mar–16
10 SABMiller ABINbev BE 71,000 923 593 0.6 3.4% 11–Nov–15
11 Gala Coral Group Ltd. Ladbrokes plc UK 925 65 81 1.2 3.2% 30–Oct–15
12 Betfair Group PLC Paddy Power plc IRE 2,870 50 65 1.3 16.7% 26–Aug–15
13 Partnership Assurance Group plc
Just Retirement Group plc UK 669 40 60 1.5 5.3% 11–Aug–15
14 Alent plc Platform Specialty Products Corporation
US 1,351 32 32 1.0 1.3% 13–Jul–15
15 BG Group plc Royal Dutch Shell plc UK 47,000 6802 660 1.0 2.4% 8–Apr–15
16 Rexam Plc Ball Corporation US 4,288 197 197 1.0 0.3% 19–Feb–15
17 Salamander Energy plc
Ophir Energy plc UK 314 8 6 0.8 2.5% 14–Jan–15
18 Catlin Group Limited XL Group plc US 2,790 133 166 1.3 7.3% 17–Dec–14
19 Friends Life Group Limited
Aviva plc UK 5,600 225 350 1.6 2.2% 21–Nov–14
20 Columbus Communications Inc.
Cable & Wireless Communications Plc
UK 1,158 533 69 1.3 0.6% 6–Nov–14
21 Synergy Health plc STERIS Corporation US 1,200 19 37 1.9 5.3% 13–Oct–14
22 Spirit Pub Company plc
Greene King plc UK 774 30 25 0.8 1.7% 4–Nov–14
23 Balfour Beatty Carillion plc UK 2,100 175 225 1.3 1.8% 14–Aug–14
24 Green Compliance PLC APC Technology Group plc UK 5 1 0 0.0 1.7% 30–Jul–14
25 TUI Travel PLC TUI AG DE 1,932 52 61 1.2 1.9% 27–Jun–14
26 Dixons Retail plc Carphone Warehouse Group plc
UK 1,900 80 60 0.8 0.2% 15–May–14

5Capturing synergies in public market transactions Lessons from working with the UK Takeover Code
Offeree QFBS, revenue synergies, revised statements and transaction analysis
# O f f eree O f f erorO f f eror domicile
D eal V alue (£m)
Fi nancial benefits (£m)
R ealisation costs (£m)
R atio of costs to benefits
Cost savings as % of cost base D ate
1 Cable & Wireless Communications
Liberty Global plc UK 3,600 82 110 1.3 1.2% 16–Nov–15
2 SABMiller ABINbev BE 71,000 686 17 0.0 2.6% 9–Oct–15
Transactions with QFBS prepared by the offeree
62%15
23UK
Europe (excl. UK)
US
Revised QFBS statements
In 2016 there were three revised QFBS. All of these revised statements showed an increased quantum of synergies, on average an increase of 50%.
Whilst these developments may simply be the product of specific competitive pressures requiring Management to broaden the number of categories being reviewed, no doubt the additional time that was available has allowed potential acquirers to process new and/or additional information to substantiate further synergies. This development perhaps points to the importance of early development of the synergy model as well as early involvement of advisers with knowledge of QFBS reporting to ensure acquirers can make the most of the synergy opportunity.
Financials
Retail
Gaming
Energy
Other
Indicative evolution of financial benefits in revised statements
Revenue synergies
Prior to 2016 only one QFBS included a quantifying statement on revenue synergies. It is worth noting that one proposed transaction is the first non-retail deal to quantify revenue synergies. The other four deals quantifying revenue synergies have all been in the retail sector, with ‘store-in-store’ or concession plans at the heart of these synergies.
Initial QFBS
50%
Revised QFBS
O f f eree market sectors% of total number of offeror QFBS, 2014 to March 2017
S ummary of origins of of f erors% of total number of offeror QFBS, 2014 to March 2017
19%
15%
12%12%
42%
Although the Code allows for revenue synergies as a category of ‘financial benefit’, by their nature they have no obvious ceiling and are not in the direct control of management. The challenge is to find sufficient past experience (track record), benchmarks and external research to substantiate the bases of belief of revenue synergies achievable through the transaction.

6 Capturing synergies in public market transactions Lessons from working with the UK Takeover Code
All QFBS contain some description of bases of belief, although the level of detail varies across statements. Where the financial benefits have been estimated ‘outside in’ generally less facts are available and more explanation on why synergies are achievable is required.
The majority of offeror statements contain a direct result statement, although a small number do not clearly state the benefits cannot be achieved independently of the offer.
Only one statement has provided a numerical value for the baseline in the QFBS itself — the majority just describe the nature of the baseline.
Only two statements in infrastructure intensive industries identified a non-recurring (capex) benefit — all other statements presented only recurring synergies.
Nearly all statements have broken down the expected cost synergies into constituent elements either expressed as absolute values or percentages of a total.
► The average number of financial benefits categories (‘constituent elements’) announced is three.
► Very few QFBS express benefits as a range. Statements generally either describe the financial benefits as an approximation or as a floor.
► An average of c. 55% of total financial benefits related to SGA costs.
Whilst all statements provide an indication of when 100% ‘runrate’ synergies will be achieved, not all statements contain phasing. Nearly all statements see full financial benefits being achieved by year three.
A majority of statements expressed that no ‘material’ dis-synergies were expected or expressed as net of expected dis-synergies — only one statement quantified a disbenefit.
Realisation costs are estimated in all QFBS with the majority also providing a view on timing. The average ratio of realisation costs to full financial benefit run rate is x1.0.
How do the statements stack up against the QFBS requirements?
Whilst the majority of QFBS have a similar structure and wording there are some variations in the level of detail: for example, not all statements provide a quantum for the base figure.
B ases of beliefA
D irect result statement
E
Base figureC
R ecurring benefits?
G
Constituent elements
B
T imingF
DisbenefitsD
R ealisation costs
H
Requirement

7Capturing synergies in public market transactions Lessons from working with the UK Takeover Code

8 Capturing synergies in public market transactions Lessons from working with the UK Takeover Code
How to make the QFBS process run smoothly and make the most of the synergy opportunity
Management analysis
Review data and process
Operating strategy
Review with management
Refine supported view
Fin. benefits, costs and phasing
Assumptions and bases of belief
Report on statement
Prepare announcement (public report, consent letter)
The high level process for management and advisers … 2 . 7 annou nc ement
C. F ou r weeks
R ep orting ac c ou ntant
Clear integration strategy including management team, organisational structure and target operating model
The offeror is aware of the timeline and required information to prepare synergy case
Key relevant personnel are made available to work with the reporting accountants and financial advisors
Management has provided detailed support for the assumptions relating to financial and operational data
Evidence of a good integration track record following any prior transactions
Focused on controllability with clear bases of belief, not just aspirations
Roles of other participants (e.g., advisors) are clearly defined
Early focus on drafting disclosure and not just the numbers
Plans (phasing assumptions, costs etc.) regarding future operational changes are not operationally feasible
Reporting accountant brought in too late to allow time for the process and thus financial benefits to be fully reported on
Key operational resource/ functional leads have no/limited availability to engage in the process
Lack of information — particularly on hostile deals
Limited/no previous integration experience to provide credibility to management plans
Significant weight placed on difficult to be reported on synergies (e.g., revenue synergies)
Due to lack of understanding of requirements, disclosure of expected synergies insufficient for the Code
Press communications not consistent with Code requirements
... and why ... ... and why not ...
W h en it goes w ell . . .Robust evidence base and well prepared management team enable management’s approach to estimating total synergy value in line with the Code
… and when it might not ...No thorough systematic approach and insufficient evidence to substantiate the estimated synergy value to allow management to announce the intended quantum under the Code.
Track record of delivery
Track record of delivery
External BenchmarkingExternal Benchmarking
Operational analysis of combined business
Operational analysis of combined business
Quality of management information
Quality of management information
Management total synergy value
Amount disclosed in QFBS
Management total synergy value
Amount disclosed in QFBS
Illustrative onlyIllustrative only

9Capturing synergies in public market transactions Lessons from working with the UK Takeover Code
EY has reported on more QFBS than any other firm
The role of the reporting accountant in QFBS follows on from support undertaken on earlier mergers benefits statements. However, the public availability of the Rule 28 statements gives a good view of those firms engaged for the preparation of QFBS.*
** Financial benefits in a new statement as offeree (as opposed to the original statement that was made as an offeror). The offeror for this subsequent transaction, Liberty Global, did not prepare an independent QFBS.
* Offeror QFBS published 2014 to March 2017.
CWC and Liberty Global (Nov 15)
R u l e 2 8 R ep orting A c c ou ntant — E Y
Deal value — £3.6bn
Financial benefits — £82mn**
Spirit Pub and Greene King (Nov 14)
R u l e 2 8 R ep orting A c c ou ntant — E Y
Deal value — £774mn
Financial benefits — £30mn
Catlin Group and XL Group (Dec 14)
R u l e 2 8 R ep orting A c c ou ntant — E Y
Deal value — £2.8bn
Financial benefits — £133mn
Balfour Beatty and Carillion (Aug 14)
R u l e 2 8 R ep orting A c c ou ntant — E Y
Deal value — £2.1bn
Financial benefits — £175mn
Q F B S by reporting accountant* PWC
13
6
8
9
BDO
KPMG
Deloitte
EY
William Hill and The Rank Group/ 888 Holdings (Aug 16)
R u l e 2 8 R ep orting A c c ou ntant — E Y
Deal value — £3bn
Financial benefits — £100m
Darty and Groupe FNAC (Sep 15, revised statement Apr 16)
R u l e 2 8 R ep orting A c c ou ntant — E Y
Deal value — £637mn
Financial benefits — £63mn
Synergy health and STERIS Corp. (Oct 14)
R u l e 2 8 R ep orting A c c ou ntant — E Y
Deal value — £1.2bn
Financial benefits — £19mn
Salamander Energy and Ophir Energy (Jan 15)
R u l e 2 0 R ep orting A c c ou ntant — E Y
Deal value — £314m
Financial benefits — £7.8m
Columbus and CWC (Nov 14)
R u l e 2 8 R ep orting A c c ou ntant — E Y
Deal value — £1.2bn
Financial benefits — £53mn
1 0 Capturing synergies in public market transactions Lessons from working with the UK Takeover Code
Key contacts
M ich el D riessen P artner, H ead of M arkets, Transac tion A dvisory S ervic es, UK& I
T: + 44 20 7951 8792 E: [email protected]
S cott M cCubbin P artner — Transac tion S u p p ort, I P O Lead, UK& I London
T: + 44 20 7951 3519 E: [email protected]
T ony Q ui P artner — O p erational Transac tion S ervic es London
T: + 44 20 7951 5820 E: [email protected]
M ike P arr P artner — O p erational Transac tion S ervic es London
T: + 44 20 7951 8551 E: [email protected]
Ian Haywood E x ec u tive D irec tor — O p erational Transac tion S ervic es London
T: + 44 20 7951 2167 E: [email protected]
David Spence E x ec u tive D irec tor — O p erational Transac tion S ervic es London
T: + 44 20 7951 7286 E: [email protected]
Michael Wada P artner — O p erational Transac tion S ervic es, F inanc ial S ervic es
T: + 4 4 2 0 7 9 5 1 9 3 6 8 E : mwada@ u k. ey . c om

1 1Capturing synergies in public market transactions Lessons from working with the UK Takeover Code
Are you prepared for a long life together?life together?A n effec tive p ost- merger integration strategy hel p s ensu re su c c ess b ey ond seal ing the deal . ey.com/tas # B etterQ uestions

1 2 Capturing synergies in public market transactions Lessons from working with the UK Takeover Code
Notes

1 3Capturing synergies in public market transactions Lessons from working with the UK Takeover Code
Notes

E Y | Assurance | Tax | Transactions | Advisory
A b ou t E YEY is a global leader in assurance, tax, transaction and advisory services. The insights and quality services we deliver help build trust and confidence in the capital markets and in economies the world over. We develop outstanding leaders who team to deliver on our promises to all of our stakeholders. In so doing, we play a critical role in building a better working world for our people, for our clients and for our communities.
EY refers to the global organization, and may refer to one or more, of the member firms of Ernst & Young Global Limited, each of which is a separate legal entity. Ernst & Young Global Limited, a UK company limited by guarantee, does not provide services to clients. For more information about our organization, please visit ey.com.
A b ou t E Y ’ s Transac tion A dvisory S ervic esHow you manage your capital agenda today will define your competitive position tomorrow. We work with clients to create social and economic value by helping them make better, more-informed decisions about strategically managing capital and transactions in fast-changing markets. Whether you’re preserving, optimizing, raising or investing capital, EY’s Transaction Advisory Services combine a set of skills, insight and experience to deliver focused advice. We can help you drive competitive advantage and increased returns through improved decisions across all aspects of your capital agenda.
Ernst & Young LLPThe UK firm Ernst & Young LLP is a limited liability partnership registered in England and Wales with registered number OC300001 and is a member firm of Ernst & Young Global Limited.
Ernst & Young LLP, 1 More London Place, London, SE1 2AF.
© 2017 Ernst & Young LLP. Published in the UK. All Rights Reserved.
ED None
EY-000033493.indd (UK) 06/17. Artwork by Creative Services Group London.
In line with EY’s commitment to minimise its impact on the environment, this document has been printed on paper with a high recycled content.
Information in this publication is intended to provide only a general outline of the subjects covered. It should neither be regarded as comprehensive nor sufficient for making decisions, nor should it be used in place of professional advice. Ernst & Young LLP accepts no responsibility for any loss arising from any action taken or not taken by anyone using this material.
ey.com/uk