LESSONS FROM THE NATIONAL EXPERIENCE OF … · The household sector savings to GDP ratio was 7.7...
31
Asia-Pacific Development Journal Vol. 8, No. 1, June 2001 69 LESSONS FROM THE NATIONAL EXPERIENCE OF INDIA IN MOBILIZING DOMESTIC AND EXTERNAL RESOURCES FOR ECONOMIC DEVELOPMENT V.R. Panchamukhi* This paper attempts to give an overview of various aspects of the national experience of India in mobilizing domestic and external resources for economic development. It attempts to present not only a statistical profile of the facts about the mobilization and disbursement of resources, but also tries to provide information about the institutional framework and the policy issues relating to the problem of resource mobilization. SAVINGS AND INVESTMENT Historical profile Domestic savings constitute perhaps the most important single financial resource for economic development. Normally, in the early stages of development domestic savings are not adequate for the level of investment that is required to realizing a target rate of growth. Total investment required to achieve a desired growth rate of GDP is derived by using the capital output ratio that reflects efficiency in the use of investment resources. The macroeconomic formula for estimating the investment required is as follows: I = β x G x Y, where I is investment, β is capital output ratio, G is growth rate of GDP and Y is the base-year value of GDP. I – S, where S stands for savings, gives the external resources required to realize GDP growth. In India the savings-to-GDP ratio was 10.4 per cent in 1950/51. It rose to 12.7 per cent in 1960, 15.7 per cent in 1970, 21.2 per cent in 1980 and 24.3 per cent in 1990 (table 1). It declined in the period 1991-1993 but again increased to 25.5 per * Director General, Research and Information System for the Non-Aligned and Other Developing Countries, New Delhi, India.
Transcript of LESSONS FROM THE NATIONAL EXPERIENCE OF … · The household sector savings to GDP ratio was 7.7...

Asia-Pacific Development Journal Vol. 8, No. 1, June 2001
69
LESSONS FROM THE NATIONAL EXPERIENCE OF INDIA INMOBILIZING DOMESTIC AND EXTERNAL RESOURCES
FOR ECONOMIC DEVELOPMENT
V.R. Panchamukhi*
This paper attempts to give an overview of various aspects of the nationalexperience of India in mobilizing domestic and external resources foreconomic development. It attempts to present not only a statistical profileof the facts about the mobilization and disbursement of resources, but alsotries to provide information about the institutional framework and the policyissues relating to the problem of resource mobilization.
SAVINGS AND INVESTMENT
Historical profile
Domestic savings constitute perhaps the most important single financialresource for economic development. Normally, in the early stages of developmentdomestic savings are not adequate for the level of investment that is required torealizing a target rate of growth. Total investment required to achieve a desiredgrowth rate of GDP is derived by using the capital output ratio that reflects efficiencyin the use of investment resources. The macroeconomic formula for estimating theinvestment required is as follows:
I = β x G x Y,
where I is investment, β is capital output ratio, G is growth rate of GDP and Y is thebase-year value of GDP.
I – S, where S stands for savings, gives the external resources required torealize GDP growth.
In India the savings-to-GDP ratio was 10.4 per cent in 1950/51. It rose to12.7 per cent in 1960, 15.7 per cent in 1970, 21.2 per cent in 1980 and 24.3 per centin 1990 (table 1). It declined in the period 1991-1993 but again increased to 25.5 per
* Director General, Research and Information System for the Non-Aligned and Other DevelopingCountries, New Delhi, India.

Asia-Pacific Development Journal Vol. 8, No. 1, June 2001
70
cent in 1995. The years after 1995 have once again experienced a decline in thesavings rate. Against this, the gross-investment-to-GDP ratio was 10.2 per cent in1950. It increased to 15.7 per cent in 1960, when India launched itself effectively onthe path of planned development. After that, the investment rate increased to reach27.7 per cent in 1990. There was a decline in the investment rate during the period1991-1993 and it was only in 1995 that the investment rate reached the level of27.2 per cent. The post-1995 period has once again seen a decline in the grossinvestment rate.
The difference between investment and savings as a proportion of GDP beganat -0.2 per cent in 1950, but reached its highest level of 3.0 per cent in 1960. Theinvestment-savings gap in GDP remained modest throughout the period from 1970 to1998 except in 1990, when this ratio reached 3.4 per cent.
Table 2 gives the savings rates and the investment rates in a comparativeframework for different developing countries. The table shows that savings andinvestment rates in India are much lower than those prevailing in many other developingcountries. The investment-savings gap as a proportion of GDP in India is rathersmall. But this ostensibly small need for external resources has been maintained onlyat relatively low levels of investment and the gross savings rate is also low. Thelesson from this experience is that more concerted efforts should be made to increasethe savings rate to levels beyond 30 per cent and investment rates also to beyond
Table 1. Savings and investment rates(as a proportion of GDP)
YearDomestic savings Gross investment External resources
(S/Y) (I/Y) (I-S)/Y
1950 10.4 10.2 -0.2
1960 12.7 15.7 3.0
1970 15.7 16.6 0.9
1980 21.2 22.7 1.5
1990 24.3 27.7 3.4
1991 22.9 23.4 0.5
1992 22.0 23.9 1.9
1993 22.5 23.1 0.6
1994 25.0 26.1 1.1
1995 25.5 27.2 1.7
1996 23.3 24.6 1.3
1997 24.7 26.2 1.5
1998 22.3 23.4 1.1
Source: Government of India, Economic Survey 1999-2000.

Asia-Pacific Development Journal Vol. 8, No. 1, June 2001
71
Table 2. Savings, investment and inflation rates of selected developing countries(Percentage)
1996 1997 1998 1999
ChinaSavings/GDP 39.5 40.1 41.5 41.0Investment/GDP 39.6 38.2 39.0 40.0Inflation rate 8.3 2.8 -0.8 -1.4
IndiaSavings/GDP 26.1 24.7 22.3 24.8Investment/GDP 27.3 26.2 23.4 26.5Inflation rate 9.4 6.8 13.1 7.0
PakistanSavings/GDP 14.2 12.6 16.0 12.2Investment/GDP 18.6 17.8 17.1 14.8Inflation rate 10.8 11.8 7.8 5.7
Sri LankaSavings/GDP 15.5 21.4 19.3 20.8Investment/GDP 24.2 24.4 26.6 28.6Inflation rate 15.9 9.6 9.4 6.0
IndonesiaSavings/GDP 30.1 31.0 26.2 25.4Investment/GDP 30.7 31.3 26.6 25.4Inflation rate 6.5 11.1 77.6 20.4
MalaysiaSavings/GDP 42.6 43.9 48.1 46.4Investment/GDP 41.6 42.5 25.8 27.4Inflation rate 3.5 2.7 5.3 3.0
PhilippinesSavings/GDP 14.6 14.0 12.4 13.5Investment/GDP 24.0 24.9 20.3 20.3Inflation rate 8.4 5.1 9.0 7.0
SingaporeSavings/GDP 49.3 50.4 49.9 50.0Investment/GDP 37.0 38.7 33.5 34.5Inflation rate 1.4 2.0 .. 0.4
ThailandSavings/GDP 35.8 35.1 38.7 33.2Investment/GDP 41.7 35.0 23.7 24.7Inflation rate 5.8 5.7 8.1 0.3
Republic of KoreaSavings/GDP 34.0 33.7 33.4 34.1Investment/GDP 37.9 34.2 20.9 27.3Inflation rate 4.9 4.4 7.5 0.9
Source: United Nations, ESCAP, Economic and Social Survey of Asia and the Pacific 2000.

Asia-Pacific Development Journal Vol. 8, No. 1, June 2001
72
35 per cent. An investment-savings gap as a proportion of GDP could then be sustainedat a level of 2 to 3 per cent, as is the case in many fast-growing developing economies.
Table 3 gives average annual growth rates of savings, investment and GDPfor the periods 1950-1970, 1970-1990 and 1990-1999. The growth rate of savingswas 6.1 per cent during the period 1950-1960. It increased to 7.4 per cent in theperiod 1960-1970 but declined slightly to 7.3 per cent in the period 1990-1999, whichwas characterized by a programme of intensive reforms such as liberalization andglobalization. It is, however, rather puzzling that the growth rate of savings declinedat a time when the Indian economy was becoming rapidly integrated into the worldeconomy and flows of external capital were becoming liberalized. The growth rate ofinvestment was 7.7 per cent in the 1950s and rose to 12.2 per cent in the 1980s. Thegrowth rate of investment declined marginally in the 1990s to 7.6 per cent.
GDP grew 4.7 per cent in the 1950s, 5.0 per cent in the 1960s and 5.8 percent in the 1980s. The growth rate of GDP in current prices in the 1990s reached7.4 per cent. The growth rate of GDP in constant prices is obviously much lowerthan that current prices. The growth rate of GDP at factor cost in constant prices was3.2 per cent in the 1950s, 3.6 per cent in the 1960s, 3.7 per cent in the 1970s and3.3 per cent in the 1980s. In the 1990s, GDP in constant prices grew at 3.3 per cent.
Table 4 gives the composition of savings in the broad categories of thehousehold, private corporate and public sectors as a proportion of GDP at currentmarket prices. The household sector savings to GDP ratio was 7.7 per cent in1950/51 and 8.4 per cent in 1960/61. There was a significant rise in the householdsector savings to GDP ratio to 11.3 per cent in 1970/71, 16.1 per cent in 1980/81 and20.5 per cent in 1990/91. The data of new series reveal that the household sectorsavings to GDP ratio was 18.5 per cent in 1998/99. The ratio of private corporatesector savings to GDP increased from 1.0 per cent in 1950/51 to 1.7 per cent in1980/81, 2.8 per cent in 1990/91 and 3.8 per cent in 1998/99. The ratio of publicsector savings to GDP started at a level of 1.8 per cent in 1950/51 and reached a high
Table 3. Compound growth rate of investment, savings and GDP
Gross domestic Gross domestic
Investment Savings product at product atmarket prices constant prices
1950-1960 7.662 6.114 4.677 3.2
1960-1970 7.912 7.467 4.979 3.669
1970-1980 12.187 10.013 5.8 3.696
1980-1990 12.363 10.383 5.678 3.301
1990-1999 11.806 10.365 7.744 3.382
Source: Calculated from data given in Government of India, Economic Survey 1999-2000.

Asia-Pacific Development Journal Vol. 8, No. 1, June 2001
73
of 4.9 per cent in 1976/77. Thereafter, it has declined consistently, reaching a level of1 per cent in 1991, 1.5 per cent 1992/93 and almost 0 per cent in 1998/99.
Household sector savings constitute a major proportion of total savings in theeconomy. The share of household sector savings in total savings in the economy was84.3 per cent in 1990/91 and was estimated to be 82.7 per cent in 1998/99. The shareof private corporate sector savings in total savings was 11.5 per cent in 1990/91 andwas estimated to be 17.2 per cent in 1998/99. It is important to note that the share ofpublic sector savings in total savings has been consistently declining, from18.5 per cent in 1970/71 to 16.2 per cent in 1980/81 and 4.2 per cent in 1990/91. It isestimated that in 1998/99 the share of public sector savings in total savings was just0.1 per cent.
The inferences that follow from this information are the following: thehousehold sector is the most important sector for generating savings in the economy.Next in importance is the private corporate sector. In view of the increase in thenumber of the loss-making public sector enterprises and also on account of increasingprivatization of public sector enterprises, the share of public sector savings has beendeclining consistently.
Table 4. Savings composition
(Millions of rupees)
Year Household sector Private corporate sector Public sector
1950 71 800 8 900 16 800(73.64) (9.13) (17.23)
1960 136 200 27 600 42 500(66.02) (13.38) (20.6)
1970 487 300 65 700 125 300(71.28) (9.69) (18.47)
1980 2 184 800 228 400 465 400(75.9) (7.93) (16.17)
1990 10 962 300 1 494 000 543 600(84.33) (11.49) (4.18)
1998 2 885 500 6 478 600 2 107 900(77.07) (17.30) (5.63)
1999 32 545 600 6 757 300 57 200(82.69) (17.17) (0.15)
Source: Government of India, Economic Survey 1999-2000.
Note: Figures in parentheses indicate shares in total.

Asia-Pacific Development Journal Vol. 8, No. 1, June 2001
74
Lessons from the experience
From the analysis of the trends and patterns of savings and investments forthe past few decades, the following lessons and guidelines can be drawn: (a) eventhough the savings rate has shown an increase over the past three to four decades, it isstill far below the rates realized in other developing countries which have showna spectacular growth performance. For example, savings rates in most of theSouth-East Asian and East Asian economies have been in the range of 30 to 35 percent or even more for a long period of time. India could have achieved much highersavings rates in the 1980s and 1990s; (b) the investment rates in the Indian economyhave also been much lower compared with the other successful economies of theregion. India could have realized much higher investment rates along with a muchhigher savings rate in the 1980s and in the 1990s; (c) the rate of capital formation inboth the private and public sectors has not shown an increasing trend over time.However, there have been disturbing fluctuations on a year-to-year basis which haveresulted in a number of intersectoral imbalances; (d) India adopted the policy ofreserving the commanding heights of the economy for the public sector for a longperiod as part of its overall development paradigm. Many studies have shownthat the trend in private sector investments was highly correlated with the trend inpublic-sector investments. In other words, any sluggishness in public-sector investments has had a significant negative effect on private-sector investments. In away, public-sector investment was functioning as an engine of growth of investmentactivity in the economy until the beginning of the reform process in the 1990s;(e) with the gradual slowing down of public-sector investment and the opening up ofthe economy for private-sector investment, even in the areas of infrastructure, miningand services, which were formerly reserved for the public sector, the inverse relationshipbetween public-sector investment and private-sector investment has considerablyweakened. Private-sector investment is expected to respond positively to this newpolicy environment despite the slowing down of public-sector investments and theincrease in disinvestment activity in the public sector; and (f) the analysis of theinstability indices of select macroeconomic parameters like savings rate, investmentrate, export to GDP ratio and growth rate of GDP shows that there is an inverserelationship between growth and stability. There is thus an increasing challenge ofrealizing growth with stability in the coming decades.
BANKING AND FINANCIAL SYSTEM
An overview
The institutional framework for the mobilization of financial resources hasbeen one well-developed feature of the Indian economic system over the past severaldecades. The financial system is essentially aimed at mobilizing financial savings

Asia-Pacific Development Journal Vol. 8, No. 1, June 2001
75
and intermediating between the suppliers of savings and the demanders of resources.The financial system is supposed to facilitate financial transactions by providingfacilities for payments, clearance and settlement mechanisms. It is only the efficiencyof the financial system which determines whether the full potential of resources hasbeen mobilized at any particular stage of development. An efficient financial systemfacilitates mobilization of the full potential of resources, promotes productiveinvestment and thereby generates high economic growth.
The institutions falling within the framework of the financial system are, ingeneral, the following: (a) commercial banks, (b) development finance institutions,(c) cooperative banks, (d) various types of mutual funds, (e) venture capital funds forindustry and technology, (f) non-banking financial intermediaries, (g) specialized ruralbanks, (h) specialized development banks for industry, external trade, housing, etc.and (i) various types of social security institutions such as insurance companies andpension and provident funds.
In addition to the above institutions, India has a well-established capital marketwith suitable regulatory and monitoring capacity. Different varieties of financialinstruments for money and capital markets have also evolved over time to make thecapital market system one of the most important institutions for overall resourcegeneration.
Commercial banking sector
The commercial banking sector in India has been one of the well-establishedinstitutions for the mobilization and intermediation of financial resources. It was wayback in 1969 that the banking system was nationalized with the objective of promotingthe scope and content of resource mobilization in different parts of the country andalso for influencing the sectoral allocation of resources for balanced social andeconomic development in the country. The Government was the principal owner ofthe nationalized banks and the functioning of the banks was governed by the rules,norms and stipulations laid down by the Ministry of Finance of the Government ofIndia and the Reserve Bank of India, which was the custodian of the banking systemin the country. The mandates given to the nationalized banks included the followingstipulations: (a) banks should expand their branch network to the different parts ofthe country to cover rural areas and other remote areas which do not normally haveaccess to institutionalized facilities for resource mobilization and resource supplies;(b) banks were obliged to lend a stipulated proportion of their total advances to selectedpre-specified sectors like agriculture, small industries, rural development, social sectors,housing, and backward regions and sections of society. This stipulation included theprovision of credit for special social security schemes, like the Prime Minister’s RozgarYogana (PMRY) and Jawahar Rozgar Yogana; and (c) banks were required to conformto the interest rates fixed by the Reserve Bank of India as part of the overall monetary

Asia-Pacific Development Journal Vol. 8, No. 1, June 2001
76
policy of the Government. They were also required to adhere strictly to variousprudential norms such as cash reserve ratio and statutory liquidity ratio, and invest ingovernment securities as prescribed from time to time. Bank nationalization washeralded as a major revolutionary step in the financial system of India in conformitywith the perceived goals of socialism, in particular, the objective of growth withequity.
Banks mobilize the savings of individuals, households, societies, corporateentities, etc. in the form of various types of deposits. Returns in terms of interestincome and the security of financial assets have been the major factors facilitating thetask of the banking sector in mobilizing resources and performing the function ofintermediaries for resource transfer. It is interesting to analyse the growth of thecommercial banking infrastructure in the country over the past 30 years. Table 5presents an overview of the growth profile of commercial banking from 1969 to 1998.There were only 89 commercial banks in 1969 and this number increased to 276 in1991, 284 in 1995 and 300 in 1998. For instance, there was a significant upsurge inthe number of commercial banks that came on the scene after bank nationalization.There were no regional rural banks (RRBs) in 1969, while there were 196 RRBs byMarch 1991.
The number of bank offices in India was only 8,262 in June 1969. Thisnumber increased to 60,220 in 1991, 62,267 in March 1995 and 64,218 in March1998. The number of bank offices in the rural sector was only 1,833 in June 1969and by March 1991 there were 35,206 rural bank offices, an increase of 19 times inthe course of about two decades since 1969. The rate of expansion of bank offices inthe semi-urban, urban and metropolitan centres was less spectacular compared withthe expansion in the rural sector. The number of bank offices in sectors other thanthe rural sector was 6,429 in 1969 and this increased to 25,014 in March 1991, anincrease of about 400 per cent.
There was one bank office for a population of 64,000 in 1969, whereas by1991 there was one bank office for a population of 14,000. The deposits of thescheduled commercial banks and the credit advanced by these banks also expandedsignificantly after 1969. Deposits of scheduled commercial banks increased fromRs 46,460 million in 1969 to Rs 2,011,990 million by March 1991. Deposits furtherincreased to Rs 3,868,590 million by 1995 and Rs 6,054,100 million by March 1998.That means that deposits increased 43 times in the period 1969-1991 and 3 timesbetween 1991 and 1998. The credit advanced by the scheduled commercial banksalso expanded significantly from 1969 to 1991 and thereafter as well. The credit ofscheduled commercial banks increased from Rs 36 billion in 1969 to Rs 1,218,650million by 1991, an increase of 34 times over the course of 22 years. The deposits ofscheduled commercial banks as a percentage of national income in current pricesamounted to only 15.5 per cent in 1969. This increased to 48.1 per cent in 1991 andreached 50.1 per cent in 1997. The share of priority-sector advances in the total

Asia-Pacific Development Journal Vol. 8, No. 1, June 2001
77
Table 5. Progress of commercial banking
Important indicators June 1969 March 1991 March 1995 March 1998
No. of commercial banks 89 276 284 300
Number of bank offices in India 8 262 60 229 62 367 64 218
Rural 1 833 35 206 33 004 32 878Semi-urban 3 342 11 344 13 341 13 980Urban 1 584 8 046 8 868 9 597Metropolitan 1 503 5 624 7 154 7 763
Population per office 64 14 15 15(in thousands)
Deposits of scheduled 46 460 2 011 990 3 868 590 6 054 100commercial banks in India(millions of rupees)
Credits of scheduled 35 990 1 218 650 2 115 600 3 240 790commercial banks in India(millions of rupees)
Deposits of scheduled 15.5 48.1 51.7 N.A.commercial banks aspercentage of national income(in current prices)
Share of priority-sector 14.0 37.7 33.7 N.A.advances in total credit ofscheduled commercial banks(percentage)
Credit/deposit ratio 77.5 60.6 54.7 53.5
Source: Reserve Bank of India, Basic Statistical Returns, vol. 25, March 1996.
credit of scheduled commercial banks increased from 14 per cent in 1969 to 37.7 percent in 1991. This share declined marginally to 34.8 per cent in 1997. Thecredit-deposit ratio of the commercial banks was 77.5 per cent in 1969 and camedown to 60.6 per cent in 1991 and 53.5 per cent in March 1998. The cash-depositratio increased from 8.2 per cent in 1969 to 17.6 per cent in 1991 and came down to10.1 per cent in 1998.
The lessons that can be drawn from the experience of the banking sector overa period of about three decades since bank nationalization in 1969 are the following:(a) given the spurt of policy support, the expansion of bank offices in the rural andurban areas of the economy was extremely fast and helped to mobilize savings indifferent parts of the country through the banking system; (b) both deposits andadvances of the banking sector have increased significantly over the period and this

Asia-Pacific Development Journal Vol. 8, No. 1, June 2001
78
has given a boost to production and trading activities in different parts of the country;and (c) as mandated by the Reserve Bank of India and the Government, the banks hadto honour certain obligations in terms of lending to priority sectors of the economy,such as agriculture, small industry and backward regions and classes. The share ofpriority-sector lending thus increased significantly over the period 1969-1991. Thepositive impact of this priority-sector lending is seen in the expansion of agriculturalinfrastructure, small-scale industries, development of backward regions andempowerment of backward sections of the society.
Rural banking
One feature of the banking system in India which deserves special mentionis rural banking. Conscious efforts were made to spread banking facilities to the ruralsector in order to facilitate development and diversification of the activities in therural economy. There are currently three major players in the rural credit scene:(a) rural branches of the commercial banks; (b) regional rural banks (RRBs); and(c) cooperative credit agencies. The rural credit delivery system has been extensivelystreamlined by the establishment of the RRBs since 1975. The National Bank forAgriculture and Rural Development (NABARD) has been playing the role of sponsorfor a large number of rural credit institutions. The RRBs cater to select specifictarget groups in the rural sector. The rate of interest charged on rural credit is muchlower than the market rate of interest charged by the commercial banks. Even thoughthe rural banking system has grown extensively in the economy, rural credit institutionsare facing significant problems of viability and sustainability. These problems arecaused by the low income levels of the target groups to which they cater, the limitedbanking facilities offered by these institutions to non-target groups and a high defaultrate among the clientele of the rural credit system. Even though these institutionshave been playing a crucial role in the banking system, their sustainability in themedium and long term is now in great doubt unless some remedial measures are takento streamline their activities and improve their operational efficiency.
Weaknesses of the banking system
While bank nationalization brought about a significant upsurge in bankingactivities in the country, a number of weaknesses also developed simultaneously. Thecritical appraisal of the banking system carried out by various expert groups in thepost-1991 period revealed the following deficiencies of the banking system in thecountry: (a) in view of the rapid expansion of banking offices and also owing to theobligations of priority-sector lending and other statutory obligations, the profitabilityof the banks started declining; (b) even though the banks performed project appraisalin a scientific manner before extending advances to the different enterprises, a numberof factors contributed to the growth of defaulters in loan repayment and the “sickness”

Asia-Pacific Development Journal Vol. 8, No. 1, June 2001
79
of industry and these resulted in the expansion of the banking sectors’ non-performingassets (NPAs). The obligations of priority-sector lending and other investment normsalso contributed to an increase in loan losses and non-performing assets. This tendedto weaken the banking sector gradually over time; (c) in view of the decline in theprofitability of the banks and the increase in NPAs, the ability of the banking systemto build its own capital base dwindled. Gradual erosion of the capital base obviouslyimplied weakening of the banking sector and curtailment of its growth potential;(d) in view of the direct involvement of the Government and the RBI in the managementand operations of the banking system, the competitive environment was adverselyaffected. As a result of the erosion of the competitive environment, there was noincentive to improve efficiency and bring about innovation in the management of thebanks. The rapid expansion of branches also implied indiscriminate growth of bankstaff and a gradual decline in the quality of human resources and hence the erosion ofthe work culture in the banking system; and (e) the banking system was not exposedto modernization techniques such as computerization, professional management andcommercial decision-making. All this implied a decline in the competitive strength ofthe banking system.
Banking-sector reforms
Realization of the emerging weaknesses in the banking system has led to theadoption of reforms in the banking sector since the early part of the 1990s. Thefamous Committee on the Reforms of the Financial System (Narasimham Committee),which submitted its report in 1992, made a number of far-reaching recommendationsfor financial-sector reforms. There was also a second committee (again underNarasimham’s chairmanship) in 1998 which reviewed the progress of the reforms andmade further recommendations.
Table 6. Non-performing assets as a proportion of net advances
(Percentage)
1995/96 1996/97 1997/98 1998/99
Public-sector banks 8.90 9.18 8.15 8.13I. State Bank of India group 6.88 7.70 6.89 7.74II. Nationalized banks 10.14 10.07 8.91 8.35
Indian private-sector banks .. 5.37 5.26 6.92I. Old private-sector banks 4.51 6.65 6.46 8.42II. New private-sector banks .. 1.97 2.63 4.15
Foreign banks 0.81 1.92 2.25 2.03
Source: Reserve Bank of India, Report on Trends and Progress of Banking in India, 1998/99.
Asia-Pacific Development Journal Vol. 8, No. 1, June 2001
80
The Narasimham Committee found that the stipulations of SLR (statutoryliquidity ratio) and CRR (cash reserve ratio) together accounted for 50 per cent of theaggregate deposits of the banking system. This implied a diversion of the funds ofthe banking system to the activities of the Government which included payment ofsalaries and many non-developmental purposes. The Committee felt that this was oneof the major causes of the decline in the profitability of the banking system. It wastherefore recommended that the SLR and CRR should be reduced over time.
The SLR requires banks to invest a predetermined proportion of their netdemand and time liabilities (NDTL) in government and other approved securities.These requirements serve as an instrument of monetary control. However, they endup by pre-empting the lendable resources of banks and thereby distort their portfoliopatterns. These reserves also earn either nil or relatively low rates of interest andhence impinge upon the income-earning potential of the banks. The CRR stipulatesthat a bank must hold a certain percentage of its NDTL as reserves with the ReserveBank in order to ensure the liquidity of the banking system. This also results in thereduction of the volume of the banks’ lendable resources and hence adversely affectsprofitability.
Table 7 presents the profile of the CRR and the SLR from 1991/92 onwardsand shows the nature of the reductions that have been brought about in the bankingsystem in recent years as part of the reform process. The Committee felt that thedirected-credit programmes stipulated by the Reserve Bank of India and the Governmentof India contributed to the increase in the NPAs of the banking system. The Committeerecognized the purpose of distributive justice implied in the directed-credit programmebut felt that fiscal measures rather than the credit system should be used to pursue thegoals of distributive justice. It also felt that directed-credit programmes led to thesegmentation of the credit market and introduced inflexibility in bank operations,which further implied severe restrictions on the availability of bank funds to theproductive sectors. It therefore urged that the stipulation of directed credit should beconsiderably reduced and, in due course, phased out.
In order to improve the competitive environment for the banking system, theCommittee recommended that new private-sector banks be allowed to enter the marketand also that greater autonomy be permitted to public-sector banks for their operationaleffectiveness. As a result of the implementation of the Narasimham Committee report,many reforms have been introduced in the financial sector, thereby facilitatingincreased efficiency and profitability in the banking system. Some of the elements ofthe reforms are recounted in the following paragraphs: (a) SLR has been reducedfrom 38.5 per cent to 31.5 per cent and has moved towards the target of 25 per cent.The medium-period target of 10 per cent for CRR has already been achieved and it ishoped that it will be further reduced by 3 to 5 per cent of the total deposits asrecommended by the Committee; (b) a number of private-sector banks have startedfunctioning as a result of the easing of the norms of entry and exit of private-sector

Asia-Pacific Development Journal Vol. 8, No. 1, June 2001
81
Table 7. Trends in cash reserve ratio (CRR) and statutory liquidityratio (SLR), 1991/92 to 1997/98
CRR Base SLR
(as percentage of NDTL*) (as percentage of NDTL*)
1991/92 15 38.5
1992/93 15 37.75
1993/94 14 34.75
1994/95 15 33.75
1995/96 14 31.5
April 1996 13 31.5
July 1996 12 31.5
October 1996 11.5 31.5
January 1997 10 31.5
October 1997 9.75 25.0
January 1998 10.5 25.0
April 1998 10.0 25.0
Source: Reserve Bank of India, Annual Report, various issues, and Reserve Bank of India, Credit
Policy, October 1997 and April 1998.Note: * Net demand and time liabilities.
banks; (c) the nationalized banks have been allowed direct access to the capital marketto mobilize funds from the public while the Government would continue to hold51 per cent of the equity of the banks. Interest rates have been rationalized andsimplified and considerably deregulated; (d) the interest yield on government securitiesis moving towards market-related rates; (e) the branch licensing policy has beenextensively liberalized; (f) the accounting and prudential norms relating to incomerecognition and capital adequacy have been stipulated in conformity with internationalstandards; (g) a number of debt tribunals have been set up in order to facilitate andexpedite the adjudication and recovery of the debts; and (h) the Government has beenproviding capital to the banking system for its recapitalization by making budgetaryprovisions for this purpose. The Reserve Bank of India has set up a Board forFinancial Bank Supervision for strengthening the supervisory function of RBI.
Efficiency of the banking system
A comparison of selected efficiency measures introduced between 1993/94and 1996/97 is presented in table 8. Four important efficiency measures wereintroduced. They are: (a) net interest margin (NIM), defined as the difference betweeninterest income earned and interest payments expended divided by average total assets,which measures a bank’s core earning capacity; (b) operating profit to staff expense

Asia-Pacific Development Journal Vol. 8, No. 1, June 2001
82
Table 8. Trends in efficiency of bank groups, 1993/94 and 1996/97
1993/94 1996/97
SBI&A NB PV FR SBI&A NB PV NPV FR
Net interest margin as 3.2 2.3 3.4 5.6 3.5 3.0 3.0 2.9 4.1percentage of averageassets
Operating cost as percentage 3.1 2.9 3.1 2.1 2.9 2.9 2.5 1.9 3.0of average assets
Staff expenditure as percentage 2.1 2.0 2.2 0.7 2.1 2.1 1.5 0.3 1.0of average assets
Operating profit/staff 0.9 0.4 0.9 11.8 1.0 0.6 1.2 1.0 3.4expenses
Source: Computed from Indian Banks’ Association, Performance Highlights of Banks, several issues.Notes: SBI&A: State Bank of India and associates; NB: nationalized banks; PV: old domestic
private banks; NPV: new domestic private-sector banks; FR: foreign banks.
(OPSE), defined as operating profit divided by total staff expense, which is an indicatorof labour productivity; (c) operating cost ratio (OCR), defined as total operating costdivided by average total assets, which measures a bank’s ability to economize on totalcosts; and (d) staff expense ratio (SER), defined as total staff expense divided byaverage total assets, which is a measure of manpower expenses. These data show thatthere has not been much improvement in the efficiency of any bank group over theyears of the reform process. However, it should be stressed that the efficiency impactof the reform process will require a longer period than is available in this analysis.
Development finance institutions
While the commercial banks are expected to provide funds essentially for theworking capital needs of the industrial sector, the development finance institutions aresupposed to provide funds for major capital investments. However, this focus offunctions has declined over time.
Resource mobilization and the disbursement of funds for investment are carriedout by various financial institutions, mutual funds and non-banking companies. Amongthe financial institutions, the following are the major institutions with a significantrole in the task of resource mobilization and resource disbursement: (a) the IndustrialDevelopment Bank of India – functioning since 1964; (b) the Industrial FinanceCorporation of India (first national-level development bank established in India in1948); (c) the Industrial Credit and Investment Corporation of India – established in1955 as a public limited company; (d) the Small Industries Development Bank of

Asia-Pacific Development Journal Vol. 8, No. 1, June 2001
83
India (SIDBI) – functioning since 1990/91; (e) the Industrial Investment DevelopmentBank of India Ltd. (called the Industrial Reconstruction Bank of India before 1997);(f) the Shipping Credit Investment Corporation of India (SCICI); (g) the Risk Capitaland Technology Finance Corporation Limited (RCTC); (h) the Trade Developmentand Investment Company of India Ltd. (ICICI Venture Funds Management CompanyLtd.); (i) the Tourism Finance Corporation of India; (j) the Life Insurance Corporationof India; (k) the Unit Trust of India; (l) the General Insurance Co; (m) state-levelfinance corporations; and (n) small industries development corporations (SIDCs).
These different financial institutions have been sanctioning and disbursingfunds for different activities in the economy. Some institutions have been createdwith specific objectives from time to time and they have been serving their purposeswith well-designed organizational structures and operational modalities. Theseinstitutions draw their capital base, either from the Government, or from some of thewell-established financial institutions, or from the market. Out of these, IDBI, IFCIand ICICI, in general, cater to the long-term financial requirements of medium- andlarge-scale industrial enterprises. They have well-established project appraisaldepartments and a highly trained manpower with technical, financial and managerialexpertise. The industrial enterprises which approach these institutions for financialsupport have to submit very detailed project reports, containing an economic andfinancial appraisal of their project proposals. They have to provide detailed estimatesof the economic rates of return, various financial ratios, internal rate of return, estimatesof domestic resource cost, estimates of effective rates of protection, payback period,debt service coverage ratio, profile of capacity utilization, analysis of market potentialand technological and managerial feasibility analysis. These institutions adopt theapproach of rigorous project appraisal techniques to decide on the viability of theproposed projects and the reliability of the estimated demand for funds. Theseinstitutions also have well-structured departments for monitoring the performance ofthe companies established with their financial assistance. They have their ownnominees on the boards of directors of these assisted companies and they monitortheir performance to derive advance signals of any impending sickness of theenterprises.
SIDBI is an institution which was specially created in 1990 to provide financialassistance to small industries. RCTC, functioning since 1988 (RCTC was originallyestablished as a society named Risk Capital Foundation sponsored by IFCI in 1975),is a specialized institution for providing capital to new entrepreneurs and for thedevelopment of new technologies. TFCI, started in 1989, has the purpose of promotingtourism-related investment activities.
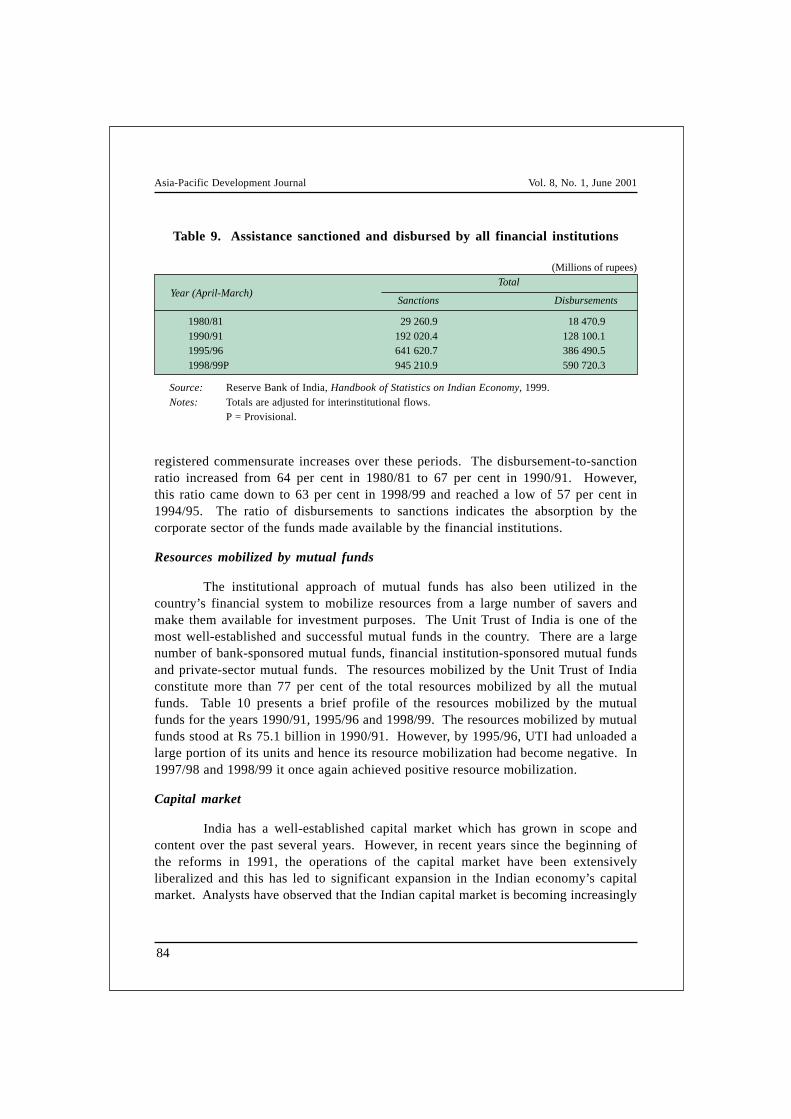
Table 9 provides information about the total sanctions and disbursementsmade by all the financial institutions taken together, in the years 1980/81, 1990/91and 1998/99. The sanctions increased from Rs 29.3 billion in 1980/81 to Rs 192.0billion in 1990/91 and to Rs 945,220 million by 1998/99. The amounts disbursed also
Asia-Pacific Development Journal Vol. 8, No. 1, June 2001
84
registered commensurate increases over these periods. The disbursement-to-sanctionratio increased from 64 per cent in 1980/81 to 67 per cent in 1990/91. However,this ratio came down to 63 per cent in 1998/99 and reached a low of 57 per cent in1994/95. The ratio of disbursements to sanctions indicates the absorption by thecorporate sector of the funds made available by the financial institutions.
Resources mobilized by mutual funds
The institutional approach of mutual funds has also been utilized in thecountry’s financial system to mobilize resources from a large number of savers andmake them available for investment purposes. The Unit Trust of India is one of themost well-established and successful mutual funds in the country. There are a largenumber of bank-sponsored mutual funds, financial institution-sponsored mutual fundsand private-sector mutual funds. The resources mobilized by the Unit Trust of Indiaconstitute more than 77 per cent of the total resources mobilized by all the mutualfunds. Table 10 presents a brief profile of the resources mobilized by the mutualfunds for the years 1990/91, 1995/96 and 1998/99. The resources mobilized by mutualfunds stood at Rs 75.1 billion in 1990/91. However, by 1995/96, UTI had unloaded alarge portion of its units and hence its resource mobilization had become negative. In1997/98 and 1998/99 it once again achieved positive resource mobilization.
Capital market
India has a well-established capital market which has grown in scope andcontent over the past several years. However, in recent years since the beginning ofthe reforms in 1991, the operations of the capital market have been extensivelyliberalized and this has led to significant expansion in the Indian economy’s capitalmarket. Analysts have observed that the Indian capital market is becoming increasingly
Table 9. Assistance sanctioned and disbursed by all financial institutions
(Millions of rupees)Total
Sanctions Disbursements
1980/81 29 260.9 18 470.91990/91 192 020.4 128 100.11995/96 641 620.7 386 490.51998/99P 945 210.9 590 720.3
Source: Reserve Bank of India, Handbook of Statistics on Indian Economy, 1999.Notes: Totals are adjusted for interinstitutional flows.
P = Provisional.
Year (April-March)

Asia-Pacific Development Journal Vol. 8, No. 1, June 2001
85
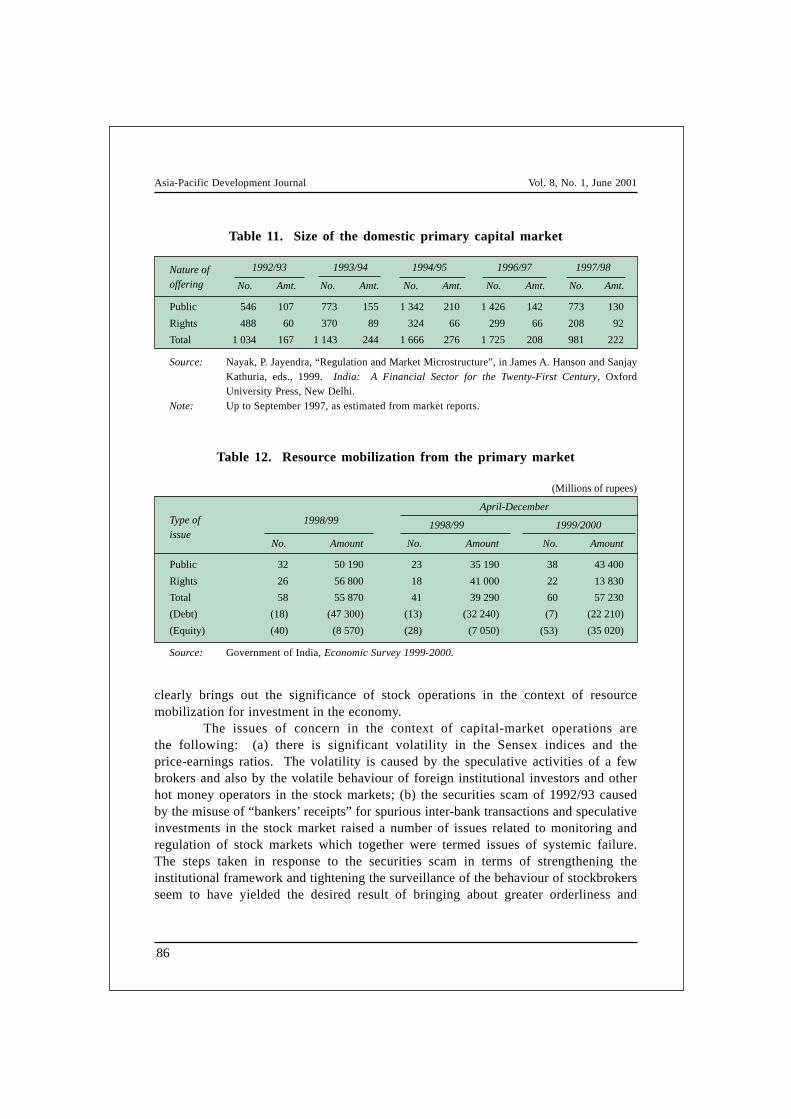
well organized with a reduction in transaction costs and an increase in the efficienciesof market operations and information flows. In order to bring discipline and orderlinessto the capital markets, India has established a powerful institution called the Securitiesand Exchange Board of India (SEBI) to supervise, monitor and guide the operationsof the stock markets and the behaviour of stockbrokers. A number of over-the-counterexchange facilities (OTCs) have been established and well-equipped credit ratingagencies have also come into being with the objective of guiding investors in managingtheir investment portfolios. The primary market and also the secondary and derivativesmarket have been growing significantly in the capital market over the past few years.The Bombay Stock Exchange, the National Stock Exchange and various other stockexchanges have become the venues for intense capital-market operations. The growthin the size of the primary capital market can be gauged from the consistent increase inthe number of primary issues and growth in the capital raised over the period1992/93 to 1996/97, as shown in table 11. The emergence of various mutual fundsand venture capital funds has also facilitated the growth of the capital market bylinking the large number of small investors with the transactions of these institutions.Table 12 shows that resource mobilization from the primary market during April toDecember 1999 was Rs 57,230 million, a 46 per cent increase over the amount raisedin the comparable period of the previous financial year. Banks and financial institutionswere the largest beneficiaries of the resources mobilized through the primary marketoperations. The other indicators of the growing strength of stock market operationsare the Sensex indices, price-earnings ratios and average daily turnover. Table 13
Table 10. Resources mobilized by mutual funds
(Millions of rupees)
Year UTI* Bank-sponsored FI-sponsored Private-sector Total
(April- mutual funds mutual funds mutual funds (1+2+3+4)
March) (1) (2) (3) (4)
1990/91 45 520.95 23 510.94 6 030.54 – 75 080.43
1995/96 -63 140.00 1 130.30 2 340.81 1 330.03 -58 320.86
1998/99P 1 700.00 2 530.18 5 760.42 20 900.37 30 890.97(-1 300.00)
Source: Unit Trust of India and respective mutual funds.P = Provisional.– = Not applicable.FI = Financial institution.
* For Unit Trust of India (UTI), the figures are gross value (with premium of net salesunder all domestic schemes. Figures in brackets pertain to net sales at face value(excluding premium). Data from 1970/71 to 1990/91 relate to July-June period.
Asia-Pacific Development Journal Vol. 8, No. 1, June 2001
86
Table 11. Size of the domestic primary capital market
1992/93 1993/94 1994/95 1996/97 1997/98
No. Amt. No. Amt. No. Amt. No. Amt. No. Amt.
Public 546 107 773 155 1 342 210 1 426 142 773 130
Rights 488 60 370 89 324 66 299 66 208 92
Total 1 034 167 1 143 244 1 666 276 1 725 208 981 222
Source: Nayak, P. Jayendra, “Regulation and Market Microstructure”, in James A. Hanson and SanjayKathuria, eds., 1999. India: A Financial Sector for the Twenty-First Century, OxfordUniversity Press, New Delhi.
Note: Up to September 1997, as estimated from market reports.
Nature ofoffering
Table 12. Resource mobilization from the primary market
(Millions of rupees)
April-December
1998/99 1999/2000
No. Amount No. Amount No. Amount
Public 32 50 190 23 35 190 38 43 400
Rights 26 56 800 18 41 000 22 13 830
Total 58 55 870 41 39 290 60 57 230
(Debt) (18) (47 300) (13) (32 240) (7) (22 210)
(Equity) (40) (8 570) (28) (7 050) (53) (35 020)
Source: Government of India, Economic Survey 1999-2000.
1998/99
clearly brings out the significance of stock operations in the context of resourcemobilization for investment in the economy.
The issues of concern in the context of capital-market operations arethe following: (a) there is significant volatility in the Sensex indices and theprice-earnings ratios. The volatility is caused by the speculative activities of a fewbrokers and also by the volatile behaviour of foreign institutional investors and otherhot money operators in the stock markets; (b) the securities scam of 1992/93 causedby the misuse of “bankers’ receipts” for spurious inter-bank transactions and speculativeinvestments in the stock market raised a number of issues related to monitoring andregulation of stock markets which together were termed issues of systemic failure.The steps taken in response to the securities scam in terms of strengthening theinstitutional framework and tightening the surveillance of the behaviour of stockbrokersseem to have yielded the desired result of bringing about greater orderliness and
Type of
issue

Asia-Pacific Development Journal Vol. 8, No. 1, June 2001
87
Table 13. Stock market indicators
Price/earnings Average daily turnover
Index1 ratio (millions of rupees)
Sensex S&P CNX BSE BSE NSE
Nifty Sensex
1998/99
April 4 006.81 1 159.35 16.11 14 040 16 340
May 3 686.39 1 063.15 14.84 13 020 17 920
June 3 250.69 941.65 12.94 10 230 13 430
July 3 211.31 931.40 12.69 9 240 12 840
August 2 933.85 852.80 11.13 9 110 11 510
September 3 102.29 904.95 11.30 12 570 14 220
October 2 812.49 824.00 9.83 12 430 14 350
November 2 810.66 817.75 11.12 10 110 11 540
December 3 055.41 884.25 12.08 12 130 15 650
January 3 315.57 966.20 13.10 17 110 23 510
1999/2000April 3 325.69 978.20 13.50 14 210 17 970
May 3 963.56 1 132.30 15.76 17 250 23 930
June 4 140.73 1 187.70 16.53 15 110 18 400
July 4 542.34 1 310.15 18.40 21 200 25 210
August 4 898.21 1 412.00 19.87 22 730 24 410
September 4 764.42 1 413.10 20.41 22 180 26 610
October 4 444.56 1 325.45 21.01 28 850 34 390
November 4 622.21 1 376.15 19.99 24 560 31 590
December 5 005.82 1 480.85 20.91 35 650 44 810
January 5 205.39 1 546.20 N.A. N.A. N.A.
Source: Government of India, Economic Survey 1999-2000.1. Monthly closing; Sensex (1978/79 = 100) and S&P CNX Nifty (1995 = 100).
Year/month
discipline in the stock markets. However, there is much more that needs to be doneto regulate and discipline stock market operations; (c) the information system aimedat facilitating the decisions of small investors and brokers and regulating organizationslike SEBI and RBI has yet to be streamlined. Despite the establishment of OTCs,there are a large number of investors who operate on the stock markets with highlyinadequate information and poor analytical knowledge; (d) the failure of a large numberof non-banking financial companies (NBFCs) in the period 1995-1998 and the delayin settling the claims of a large number of investors and punishing the guilty has alsocaused significant damage to the image of the capital market in the Indian economy;

Asia-Pacific Development Journal Vol. 8, No. 1, June 2001
88
and (e) the Indian capital market was saved from the shock effects caused by thecollapse of the capital market and banking system in the East Asian and South-EastAsian economies in 1997-1998, largely because of the cautious approach adoptedwith regard to capital-account convertibility and also the limited opening up of thefinancial sector to foreign operators. In recent months, however, there has been asignificant increase in the presence of foreign operators in the Indian capital market.Further, with increasing liberalization of the banking sector and the opening up of theinsurance sector as well as the power and telecom sectors to foreign investors, thenexus between the financial sector and the real sector of the economy and that betweenthe domestic sectors and the international sectors seems to have increased significantly.Some analysts have pointed out that this new scenario has good potential for theexpansion of resource mobilization activities, but also has the danger of increasingthe inherent instabilities in the Indian economy. In view of this, a vigilant policymaker and an efficient surveillance system seem to be the urgent requirements of theemerging scenarios in the economy.
GOVERNMENT FINANCES
In a federal set-up as in India one has to consider essentially two layers ofgovernment. One, the central Government, and the other, the governments of thevarious states of the federal set-up. Of course, there are organizations of governanceat still lower levels like panchayats, district administrations and municipalities. Infact, in the new wave of decentralization of economic power, the panchayat-leveladministration is also given responsibility for executing certain development projectsand disbursing funds for development purposes. However, resource mobilization anddisbursement are essentially done at the level of the central Government and the stategovernments.
The accounts of the Government are maintained in two types: the revenueaccount and the capital account. The revenue account shows revenue receipts andrevenue expenditure and the difference between these two heads of accounts is termedrevenue surplus or deficit. Similarly, the capital account presents receipts on capitalaccounts and expenditure on capital accounts and the difference between the twobecomes the capital-account surplus or deficit. The gross fiscal position of theGovernment, which is in deficit, is financed through various sources which includeexternal finances, market borrowings and other liabilities like small savings, providentfunds, special deposits and reserve funds. Whatever is not met through these sourcesis termed the budget deficit.
Table 14 gives the major components of central government receipts fromdifferent sources for the past few years. These major sources include tax revenueconsisting of direct taxes and indirect taxes and non-tax revenues as well as capitalreceipts. There are two major components of direct taxes, namely, personal income

Asia-Pacific Development Journal Vol. 8, No. 1, June 2001
89
Tab
le 1
4.
Cen
tral
gov
ernm
ent
rece
ipts
: m
ajor
com
pone
nts
(Mill
ions
of
rupe
es)
Tax
Dir
ect
Indi
rect
of w
hich
---
Non
-tax
Reve
nue
Tota
lD
irec
t tax
/In
dire
ct ta
x/C
usto
mTa
x re
v./
Rev.
rece
ipts
/
Year
reve
nue
tax
tax
cust
omre
venu
ere
ceip
tsre
ceip
tsta
x re
v.ta
x re
v.du
ties/
rev.
tota
l
(net
)du
ties
indi
rect
tax
rece
ipts
rece
ipts
1970
/71
24 5
105
110
19 4
005
240
8 42
032
930
53 3
900.
210.
790.
270.
740.
62
1980
/81
93 5
8018
930
74 6
5034
090
30 1
5012
3 73
020
2 91
00.
200.
800.
460.
760.
61
1990
/91
429
780
69 0
3036
0 75
020
6 44
011
9 76
054
9 54
093
9 51
00.
160.
840.
570.
780.
58
1995
/96
819
390
222
870
596
520
347
570
281
910
1 10
1 30
01
684
680
0.27
0.73
0.58
0.74
0.65
1996
/97
937
010
253
740
683
270
428
510
325
780
1 26
2 79
01
878
230
0.27
0.73
0.63
0.74
0.67
1997
/98
956
720
271
720
685
000
401
930
382
290
1 33
9 01
02
320
680
0.28
0.72
0.59
0.71
0.58
1998
/99
(RE)
1 09
5 37
035
3 56
074
1 81
042
6 48
048
1 28
01
576
650
2 81
9 12
00.
320.
680.
570.
690.
56
1999
/200
0 (B
E) @
1 32
3 65
042
2 48
090
1 17
050
3 69
050
4 75
01
828
400
2 83
8 82
00.
320.
680.
560.
720.
64
Sour
ce:
Res
erve
Ban
k of
Ind
ia, H
andb
ook
of S
tati
stic
s on
Ind
ian
Eco
nom
y, 1
999.
RE
=R
evis
ed e
stim
ates
.B
E=
Bud
get
esti
mat
es.
#=
Net
of
stat
es’
shar
e.@
=In
clud
es t
he e
ffec
ts o
f bu
dget
pro
posa
ls.

Asia-Pacific Development Journal Vol. 8, No. 1, June 2001
90
tax and corporate tax. Indirect taxes consist of excise duties and custom duties. Themajor components of non-tax revenue are the interest receipts on various deposits andadvances made by the Government. All these together constitute revenue receipts.The major heads of capital receipts are market borrowings, small savings, providentfunds, special deposits, recovery of loans, disinvestment receipts and external loans.It can be seen that tax revenue was just Rs 93.6 billion in 1980/81; it increased toRs 429.8 billion in 1990/91 and shot up to Rs 1,095.4 billion in 1998/99. The budgetestimates for 1999/2000 put tax revenue at Rs 1,323.7 billion. Direct tax revenue as apercentage of total tax revenue was 20 in 1980/81, 16 in 1990/91, 27 in 1995/96,28 in 1997/98 and 32 in 1998/99. Within direct tax revenue, the share of corporatetax rose from 69 per cent in 1990/91 to 96.5 per cent in 1998/99. The share ofindirect taxes in total tax revenue was 80 per cent in 1980/81; it increased to 84 percent in 1990/91 and fell to 68 per cent in 1998/99. Customs duties revenue constituted56 per cent of total indirect tax revenue in that year.
It is interesting to examine the composition of the expenditure of the centralGovernment. Once again the expenditures are categorized as revenue expenditureand capital expenditure. Table 15 presents the revenue expenditure and capitalexpenditure along with their major components. It can be observed that in revenueexpenditure the burden of interest payments and subsidies increased significantly after1990/91. The share of interest payments in total expenditure was 18.1 per cent in1980/81. It increased to 20.2 per cent in 1990/91 and 35.4 per cent in 1998/99.However, the share of subsidies in total revenue expenditure decreased from 14.1 percent in 1980/81 to 11.3 per cent in 1998/99. The share of capital outlays in totalgovernmental expenditure has been declining over the years and this has contributedto a reduction in the investment expenditure of the central Government. The grossfiscal deficit as a proportion of GDP was 5.7 per cent in 1980/81; it increased to8.3 per cent in 1990/91 but there was a decline to 5.9 per cent in 1998/99.
Ever since the reforms were intensified, a crucial issue of debate has beenthe role of the Government in the management of resources and the developmentprocess in the economy. As is well known, India started its development process inthe 1950s in the framework of a mixed economy in which the private sector and thepublic sector coexisted. The development paradigm chosen in India also impliedcoexistence of planning and the market, a blend of physical controls and fiscalmeasures, growth of private-sector profits and expansion of social sectors, etc.However, since the beginning of the reform process in 1991, a shift has been takingplace in the development paradigm and this has generated a debate on a number ofissues of analytical and policy importance. The question of redefining the role of theState and restructuring its functions has been one of the major issues at the forefrontof the debate. The new perceptions that have been emerging in this context and thenew challenges of government finance are the following: (a) the State should withdrawfrom those economic sectors where its presence is not warranted and also where the

Asia-Pacific Development Journal Vol. 8, No. 1, June 2001
91
Tab
le 1
5.
Maj
or h
eads
of
expe
ndit
ure
of t
he c
entr
al g
over
nmen
t
(Mill
ions
of
rupe
es)
Reve
nue
of w
hich
---
Subs
idie
sC
apita
lC
apita
lTo
tal
Subs
idie
s/In
tere
stRe
v. ex
p./
Cap
ital
Gro
ss fi
scal
Year
expe
nditu
rein
tere
stex
pend
iture
outla
ysex
pend
iture
rev.
exp
.pa
y./r
ev. e
xp.
tota
l exp
.ex
p./to
tal e
xp.
defic
it/ex
p.
paym
ents
1970
/71
31 3
006
060
940
24 9
409
420
56 2
400.
030
0.19
40.
557
0.44
3--
1980
/81
144
100
26 0
4020
280
83 5
8030
730
227
680
0.14
10.
181
0.63
30.
367
5.7
1990
/91
735
160
214
980
121
580
317
820
121
300
1 05
2 98
00.
165
0.29
20.
698
0.30
28.
3
1995
/96
1 39
8 61
050
0 45
013
3 72
038
4 15
014
0 99
01
782
750
0.09
60.
358
0.78
50.
215
5.8
1996
/97
1 58
9 33
059
4 78
016
3 64
042
0 74
014
1 96
02
010
070
0.10
30.
374
0.79
10.
209
4.7
1997
/98
1 80
3 50
065
6 37
019
4 87
051
7 19
017
5 26
02
320
680
0.10
80.
364
0.77
70.
223
5.7
1998
/99
(RE)
2 18
1 39
077
2 48
024
6 83
063
7 73
019
5 19
02
819
120
0.11
30.
354
0.77
40.
226
5.9
1999
/200
0 (B
E)2
369
870
880
000
238
380
468
950
244
000
2 83
8 82
00.
101
0.37
10.
835
0.16
54.
0
Sour
ce:
Res
erve
Ban
k of
Ind
ia, H
andb
ook
of S
tati
stic
s on
Ind
ian
Eco
nom
y, 1
999.
RE
= R
evis
ed e
stim
ates
.B
E =
Bud
get
esti
mat
es.

Asia-Pacific Development Journal Vol. 8, No. 1, June 2001
92
private sector can do a better job; (b) the State should concentrate on the task ofinfrastructure development, in particular, the social infrastructure, and function asa facilitator of development with appropriate regulatory and monitoring responsibilities;(c) the State should gradually reduce the subsidies given to such economic sectors aspower, railways, food distribution, agriculture, exports and economic services andpricing in these sectors should be based upon economic principles rather than highlycostly social considerations; (d) there should be gradual downsizing of the governmentsector (sometimes termed “rightsizing”) by a gradual reduction in manpower,curtailment of unproductive expenditure and a moratorium on additional employment;(e) the Government should disinvest in a number of sectors so that the burden ofmanaging these sectors is reduced over time. In fact, the present Governmenthas a separate ministry of disinvestment to expedite the process of disinvestment inpublic-sector enterprises (it should be noted, however, that the pace at which thedisinvestment is taking place has been so rapid in recent months that many questionsand doubts have been raised about the advisability of such a rapid disinvestmentprocess); (f) the Government’s initiatives to reduce subsidies in a number of sectorshave not made significant progress owing to various political and social compulsions.In fact, some state governments have indulged in populist measures which have broughtabout a great setback to the subsidy reduction programme of the central government;(g) the Government has the major task of reducing the fiscal deficit to reasonablelevels. While there has been some success in the process of reducing fiscal deficits,the central and state governments are still faced with the problem of large outstandingliabilities due to internal and external debts. The total outstanding liabilities of theGovernment were placed at 56.6 per cent of GDP in 1998/99 and this is very large byany standard. The Government also has yet another burden of subtle liabilities calledcontingent liabilities, in the form of guarantees provided by the Government. Asa proportion of GDP, these outstanding contingent liabilities are estimated to havebeen in the range of 5 to 5.5 per cent in recent years; (h) in the context of reducingfiscal deficits, the Government has the dilemma of identifying the areas for increasein revenues and reduction in expenditures. It has been observed that the Governmentintroduces cuts in capital expenditure, thereby adversely affecting the growth potentialand creating infrastructural bottlenecks. Cuts in social-sector spending are also effected,thereby frustrating the basic goals of government expenditure; (i) one of the problemsof government finance in a federal set-up is that of devolution of funds from thecentral Government to the state governments and from state governments to the lowerlevels of economic decision-making like municipalities and panchayats. The devolutionof funds from the central Government to the state governments is done through twoinstitutions, namely, the Planning Commission, which is a permanent statutory bodyset up by Act of Parliament, and the Finance Commissions, which are set up everyfive years by the President of India to make recommendations for the devolution ofshares of central taxes and duties to the states. The allocation of funds by the Planning

Asia-Pacific Development Journal Vol. 8, No. 1, June 2001
93
Commission pertains to the size of the development plan drawn up by each stategovernment and is termed plan grants. The devolution done according to therecommendations of the Finance Commissions takes into account the non-planrequirements of the different states and factors such as the size of the state, stage ofdevelopment and revenue-raising capacity, and considerations of inter-state equity andoverall stability and development are taken into consideration while making thedevolution of funds from the centre to the state. It may be mentioned, incidentally,that the recent report on the Eleventh Finance Commission has raised a number ofcontroversies and debates on the ground that states which have done well in managingtheir resources efficiently have not been given due credit in terms of increased allocationof funds to facilitate their rapid growth.
EXTERNAL RESOURCES
An overview
One of the significant segments of resource management pertains to theexternal sector. The external sector consists of seven major dimensions: (a) balanceof trade with regard to goods; (b) balance of trade with regard to invisibles on thecurrent account; (c) transactions on the capital account; (d) bilateral and multilateralcapital flows; (e) resources raised in capital markets abroad; (f) foreign directinvestment in productive sectors; and (g) portfolio capital flows in the domestic capitalmarkets. In recent years, India has initiated many reform measures which involveextensive liberalization of economic activities and increasing globalization aimed atintegrating the Indian economy into the global economy.
On the trade front, India has significantly reduced its tariff and non-tariffbarriers in conformity with its commitments to the World Trade Organization. Manyinitiatives have also been taken at the bilateral, regional and subregional levels – forexample, in the SAARC region – to liberalize the movement of goods and servicesand investment flows. India has also opened up its market for imports of consumergoods by removing the quantitative restrictions (QRs) on such imports and also bystreamlining the tariff rates on them. By March 2001, almost all consumer goodswere to be opened up for import without QRs. Table 16 presents an overview ofIndia’s balance of payments in US dollars for the years 1980/81, 1985/86, 1990/91,1993/94, 1995/96 and 1998/99. India had a negative merchandise trade balance allthese years and this negative trade balance has been increasing in size, particularly inthe post-liberalization period. The main observations on the phenomenon of externalbalance are the following: (a) there has been slow growth in exports and relativelyfaster growth in imports; (b) net invisibles on the current account have always beenpositive and this has significantly increased in recent years, owing to exports of softwareservices; (c) the current account as a whole continues to be in negative balance and

Asia-Pacific Development Journal Vol. 8, No. 1, June 2001
94
Table 16. India’s overall balance of payments
(Millions of US dollars)
Item 1980/81 1985/86 1990/91 1993/94 1995/96 1998/99
I. Merchandise(A) Exports f.o.b. 8 445 9 461 18 477 22 683 32 311 34 298(B) Imports c.i.f. 16 314 17 294 27 914 26 739 43 670 47 544
Trade balance (A-B) -7 869 -7 834 -9 437 -4 056 -11 359 -13 246
II. Invisibles, net 5 065 2 967 -243 2 898 5 449 9 208
III. Current account (I+II) -2 804 -4 867 -9 680 -1 158 -5 910 -4 038
IV. Capital account (A to F) 1 665 4 506 7 188 9 695 4 689 8 260(A) Foreign investment ... ... 103 4 235 4 805 2 412(B) External assistance, net 1 409 1 370 2 210 1 901 883 820(C) Commercial borrowings, net 252 954 2 248 607 1 275 4 362(D) Rupee debt service ... ... -1 193 -1 053 -952 -802(E) NRI deposits, net 226 1 444 1 536 1 205 1 103 1 742(F) Other capital -222 738 2 284 2 800 -2 425 -274
V. Overall balance (III+IV) -1 140 -361 -2 492 8 537 -1 221 4 222
VI. Monetary movements 1 140 361 2 492 -8 537 1 221 -4 222(VII+VIII+IX)
VII. Reserves 654 577 1 278 -8 724 2 936 -393(Increase -, decrease +)
VIII. IMF, net 336 -216 1 214 187 -1 715 -3 829
IX. SDR allocation 150 0 0 0 0 0
Source: Reserve Bank of India, Handbook of Statistics on Indian Economy, 1999.
remains a source of anxiety for the policy makers; (d) on the capital account, theinflow of foreign investment has significantly increased, although it is much less thanwhat would have been expected in response to the policy changes initiated in theeconomy; (e) net commercial borrowings have been showing an increasing trend,resulting in increasing future liabilities and burden of repayment. Another source ofmajor resource flow has been NRI deposits in response to the various alternative NRIdeposit schemes, including the most successful resurgent India bonds, etc.; (f) in viewof the increase in foreign capital movements for both long-term investments and portfolioinvestments, the foreign exchange reserves of the country have increased. Additionsto foreign exchange reserves were particularly significant in 1993/94 and 1996/97while there was a depletion of the reserves in 1995/96; and (g) the annual changes inthe reserves position indicate considerable volatility in the flow of short-term capital.The impact of these volatilities is to be seen in the frequent fluctuations in the Sensex

Asia-Pacific Development Journal Vol. 8, No. 1, June 2001
95
indices of the stock markets and also in the fluctuations in the exchange rate and thegradual depreciation of the rupee in the foreign exchange market.
India’s external debt
Another index of the country’s resource position is given by the externaldebt situation. Table 17 presents a broad overview of India’s external debt positioncategorized into long-term debt and short-term debt. The table also presents someselect debt indicators such as debt stock to GDP ratio and debt-service ratio. Somesignificant observations on the table provide revealing insights: (a) the share ofconcessional debt as a percentage of total debt declined consistently over the period1990-1999. It came down from 46.7 per cent in 1990 to 37.9 per cent in 1999; (b) theshare of short-term debt in total debt was in the range of 7 to 10 per cent during1990-1993 and it has declined considerably in subsequent years, except in 1997, whenit reached 7.2 per cent; (c) the debt stock to GDP ratio has been fluctuating: it
Table 17. India’s external debt
(Millions of US dollars)
Item 1990 1993 1995 1997 1999P
Total long-term debt 68 356 83 683 94 739 86 744 93 902
Short-term debt 7 501 6 340 4 269 6 726 4 329(a) NRI deposits (up to 1-year maturity) 3 244 2 603 2 278 3 773 2 199(b) FC(B&O)D (up to 1-year maturity) 0 779 0 0 0(c) Others (trade-related)** 4 257 2 958 1 991 2 953 2 130
of which short-term debt of 6 months 2 004 1 793 1 991 2 953 2 130
Gross total 75 857 90 023 99 008 93 470 98 231
Concessional debt 35 443 40 097 44 845 39 489 37 244As percentage of total debt 46.7 44.5 45.3 42.2 37.9
Short-term debt 7 501 6 340 4 269 6 726 4 329As percentage of total debt 9.9 7.0 4.3 7.2 4.4
Debt indicators:Debt stock – GDP Ratio (percentage) 28.5 39.8 30.0 23.8 23.7Debt-service ratio (percentage) 30.9 27.5 26.2 21.2 18.0(for fiscal year) (including debtservicing on non-civilian credits)
Source: Reserve Bank of India, Handbook of Statistics on Indian Economy, 1999.Note: Multilateral loans do not include revaluation of IBRD pooled loans and exchange rate
adjustment under IDA loans for pre-1971 credits. Debt-service ratio from the year 1992/93includes the revised private transfer contra-entry on account of gold and silver imports.P = Provisional.** Does not include suppliers’ credit of up to 180 days.

Asia-Pacific Development Journal Vol. 8, No. 1, June 2001
96
reached its highest level of 41 per cent in 1992. However, in recent years it has beenshowing a declining tendency; (d) the debt-service ratio was above 25 per cent until1995. However, it has been consistently declining in subsequent years and reached alow of 18 per cent in 1999.
The above profile of India’s external debt seems to suggest that the policyinitiatives taken by the Government to deal with the external debt situation have beensatisfactory. However, the issues of concern pertain to the high degree of volatilityin the debt and the persistence of a high debt stock to GDP ratio and a rather highdebt-service ratio. In recent months, the increasing volatility of the exchange ratesand the stock market indices have also been of great concern to the policy makers.
ECONOMIC STABILITY
It has been accepted both in the analytical literature and in the policy literaturethat macroeconomic stability is a prerequisite for the realization of the full potentialof savings and investment in the economy. Of course, macroeconomic stability maybe only a necessary precondition and not a sufficient condition to sustain high growthand avoid crisis situations. The recent experience of the East Asian and South-EastAsian economies seems to suggest that financial and economic crises frustrating thegrowth effort could emerge even though all the macroeconomic fundamentals were ingood shape. The health of a country’s macroeconomic situation can be gauged by theanalysis of four or five select macroeconomic indicators, namely, inflation, the grossfiscal deficit as a proportion of GDP, the internal and external debt liabilities of theGovernment, the current account deficit to GDP ratio and the import cover of reserves.In an economy like India’s, where agriculture constitutes the most significant sectorfor the generation of income and employment, the growth rate of agriculture and itsannual fluctuations also need to be taken into account in examining the stability ofthe economy. Further, growth of the social sectors like education and health andindicators of inequality and unemployment rates also need to be considered in theanalysis of the stability of an economic system.
Using inflation measured by the wholesale price index (WPI), it can beobserved that the period 1990/91 to 1994/95 – the initial period of the reform process– experienced very high inflation rates of above 10 per cent on average. In the periodfrom 1995/96 onwards, however, the inflation rate has been significantly lower andhas been fluctuating between 4.8 per cent and 7.7 per cent. The inflation rates measuredby the consumer price index (CPI) number are higher than those indicated by thewholesale price index numbers. In 1998/99, for example, the inflation rate measuredby the CPI was 13.1 per cent while the same measured by WPI was only 6.9 per cent.
With regard to the gross fiscal deficit (GFD) to GDP ratio, the symptoms ofinstability still seem to be very high, as indicated by the high GFD ratios and theirhigh annual volatility.

Asia-Pacific Development Journal Vol. 8, No. 1, June 2001
97
The ratio of current account deficit to GDP reached a high of -2.3 per cent1990/91 but thereafter it has been kept under control at a reasonable level, below-1.5 per cent, owing to the favourable movement of invisibles. However, the tradedeficit to GDP ratio continues to remain high in a range of -3.2 per cent to -3.7 percent of GDP.
As indicated earlier, the internal and external debt liabilities of the Governmentstill remain at very high levels, causing concern about longer-term stability. Further,the health of the banking sector and the financial system as a whole are also a sourceof concern for stability since some of the indicators of the health of the bankingsystem, in particular, non-performing assets, profitability rates and capital adequacyratios do not seem to provide very favourable signals of stability. To this could beadded the volatility of the capital markets as indicated by the fluctuations in theSensex indices and the volatility of the foreign exchange markets as indicated by thefluctuations in the exchange rates, which are other causes for concern with regard tothe overall Indian economic situation. Since investments by foreign institutionalinvestors have played a significant role in the Indian capital market in recent years,the increasing volatility on a month-to-month basis in the net investment by foreigninstitutional investors (FIIs) could also be a source of concern with regard to theoverall stability of the economy. In the year 1998/99, for example, there was a netoutflow of Rs 8.1 billion of FII investment, while in 1997/98 there was a net inflowof Rs 59,780 million. The year 1997/98 also experienced some months of net outflowsin FII investments.
On the whole, the financial and economic scene of the Indian economy seemsto be characterized by many symptoms of instability and since the policy makers haveyet to strengthen their expertise in dealing with the emerging new situations ofliberalization and globalization these symptoms deserve to be taken seriously so thatappropriate preventive measures are initiated much before the symptoms manifestthemselves in the form of a crisis situation. If the past record of policy makers indealing with various external shocks such as the Asian and Latin American crises hasany relevance, it is legitimate to ask what the policy responses would be in dealingwith instabilities and averting the emergence of a new crisis.
CONCLUDING OBSERVATIONS
This paper has dealt with a large number of diverse issues pertaining to thevery complex theme of mobilization of resources for development. It has attemptedto present a historical perspective of different macroeconomic variables and also ofthe institutional framework of the Indian economy with a view to drawing lessonsfrom past experience. The paper has dealt with topics such as savings and investment,the banking and financial system, government finances, the challenges of the externalsector and the problems of economic stability. The paper has aimed at being both

Asia-Pacific Development Journal Vol. 8, No. 1, June 2001
98
informative and analytical. It should be underlined that the problem of resourcemobilization raises such complex issues that it is difficult to do justice to all aspectsof the subject in a short paper like this. However, in each section the paper hashighlighted the broad orders of magnitude and certain major lessons of past experienceand indicated policy directions that deserve special consideration for the future.
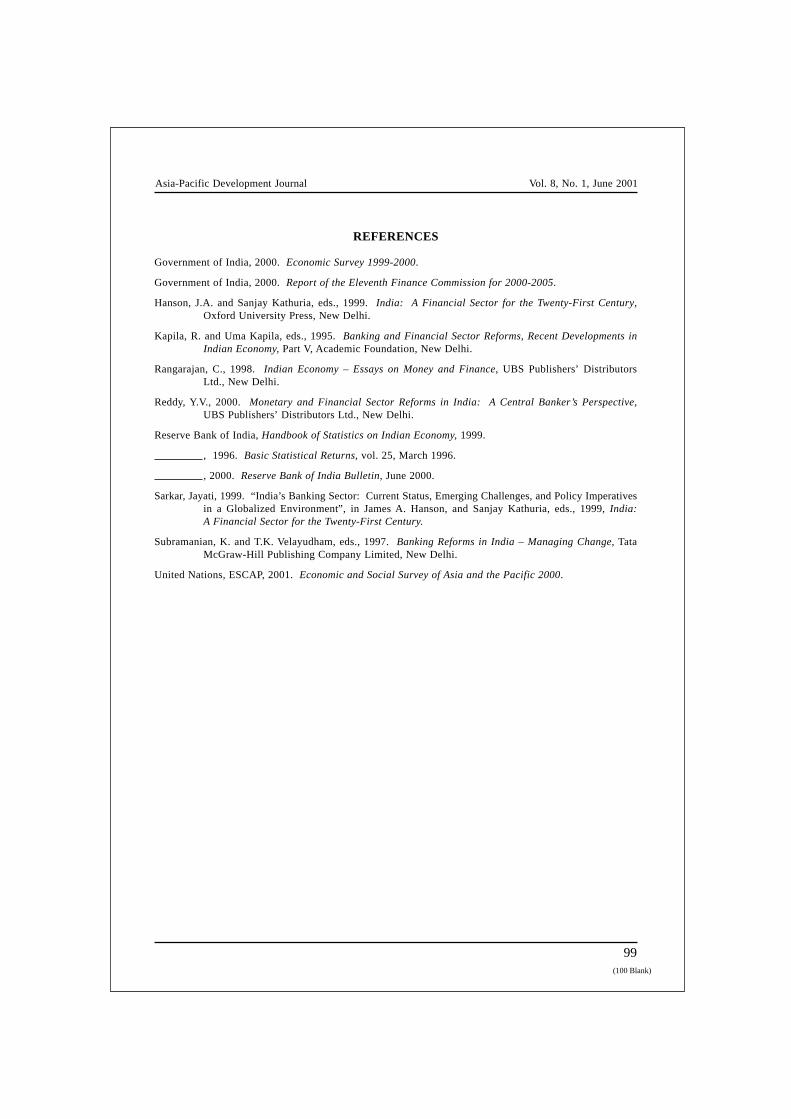
Asia-Pacific Development Journal Vol. 8, No. 1, June 2001
99
REFERENCES
Government of India, 2000. Economic Survey 1999-2000.
Government of India, 2000. Report of the Eleventh Finance Commission for 2000-2005.
Hanson, J.A. and Sanjay Kathuria, eds., 1999. India: A Financial Sector for the Twenty-First Century,Oxford University Press, New Delhi.
Kapila, R. and Uma Kapila, eds., 1995. Banking and Financial Sector Reforms, Recent Developments inIndian Economy, Part V, Academic Foundation, New Delhi.
Rangarajan, C., 1998. Indian Economy – Essays on Money and Finance, UBS Publishers’ DistributorsLtd., New Delhi.
Reddy, Y.V., 2000. Monetary and Financial Sector Reforms in India: A Central Banker’s Perspective,UBS Publishers’ Distributors Ltd., New Delhi.
Reserve Bank of India, Handbook of Statistics on Indian Economy, 1999.
, 1996. Basic Statistical Returns, vol. 25, March 1996.
, 2000. Reserve Bank of India Bulletin, June 2000.
Sarkar, Jayati, 1999. “India’s Banking Sector: Current Status, Emerging Challenges, and Policy Imperativesin a Globalized Environment”, in James A. Hanson, and Sanjay Kathuria, eds., 1999, India:A Financial Sector for the Twenty-First Century.
Subramanian, K. and T.K. Velayudham, eds., 1997. Banking Reforms in India – Managing Change, TataMcGraw-Hill Publishing Company Limited, New Delhi.
United Nations, ESCAP, 2001. Economic and Social Survey of Asia and the Pacific 2000.
(100 Blank)