Mayo Clinic Virtual Hall Exhibitor Prospectus Mayo Clinic ...

©2011 MFMER | slide-1
A Roadmap for Improving
Healthcare Service Quality and
Patient Experience Lessons and Tools from Mayo Clinic
UHC CG-CAHPS Conference
July 10, 2014 l Chicago, IL
Denise M. Kennedy, MBA l Service Administrator, Mayo Clinic Arizona
Assistant Professor of Healthcare Systems Engineering, Mayo Clinic College of Medicine

From an Arizona Outpatient…
“I didn’t get the
Mayo Clinic
experience.”
Source: PRC Verbatim Comments
©2011 MFMER | slide-3
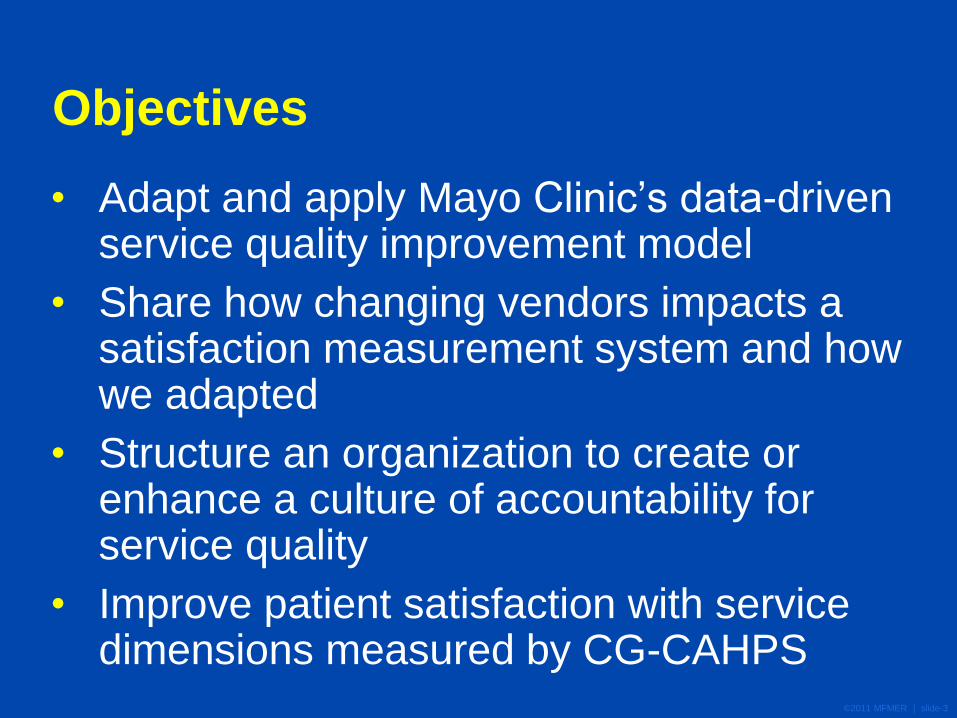
Objectives
• Adapt and apply Mayo Clinic’s data-driven service quality improvement model
• Share how changing vendors impacts a satisfaction measurement system and how we adapted
• Structure an organization to create or enhance a culture of accountability for service quality
• Improve patient satisfaction with service dimensions measured by CG-CAHPS

©2011 MFMER | slide-4
Mayo Clinic
• Three main campuses + Mayo Clinic Health System
• Served more than 1 million patients last year

©2011 MFMER | slide-5
Strategic Focus
Mission
• To inspire hope and contribute to health and well-being by providing the best care to every patient every day through integrated clinical practice, education, and research
Vision
• Mayo Clinic will provide an unparalleled experience as the most trusted partner for health care
Primary Value
• The needs of the patient come first

William J. Mayo, MD
1861-1939
Living Our Primary Value
©2011 MFMER | slide-7
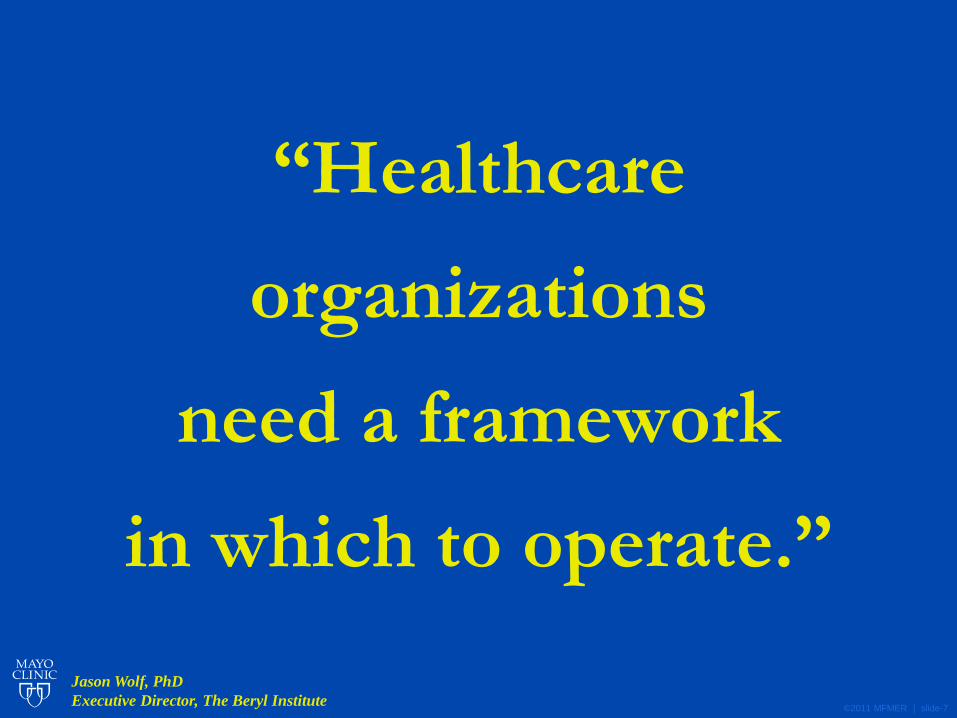
“Healthcare
organizations
need a framework
in which to operate.”
Jason Wolf, PhD
Executive Director, The Beryl Institute

©2011 MFMER | slide-8
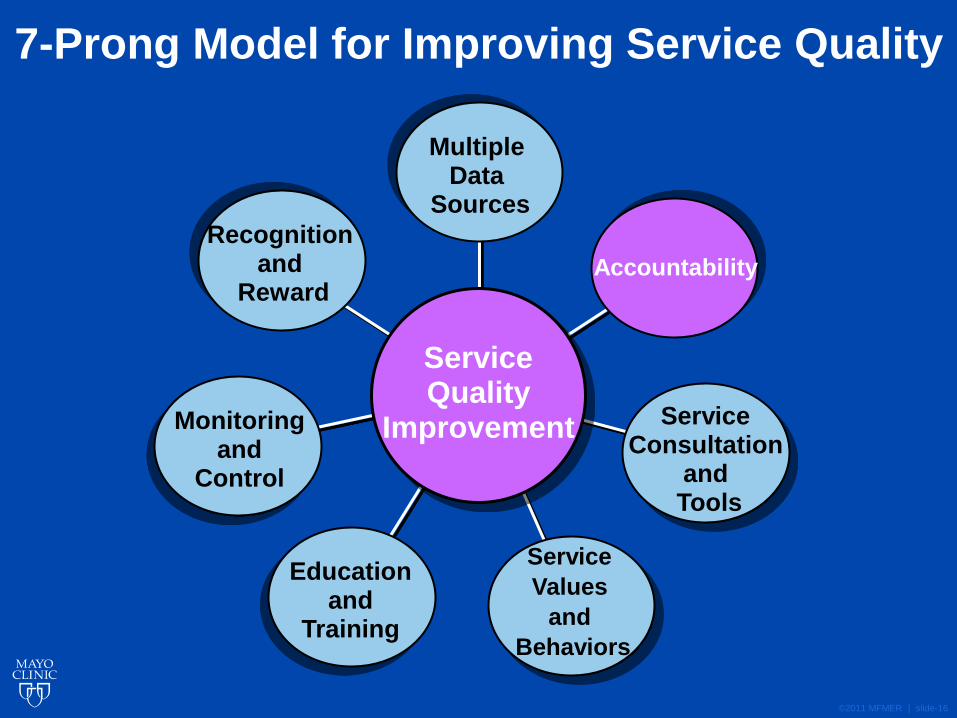
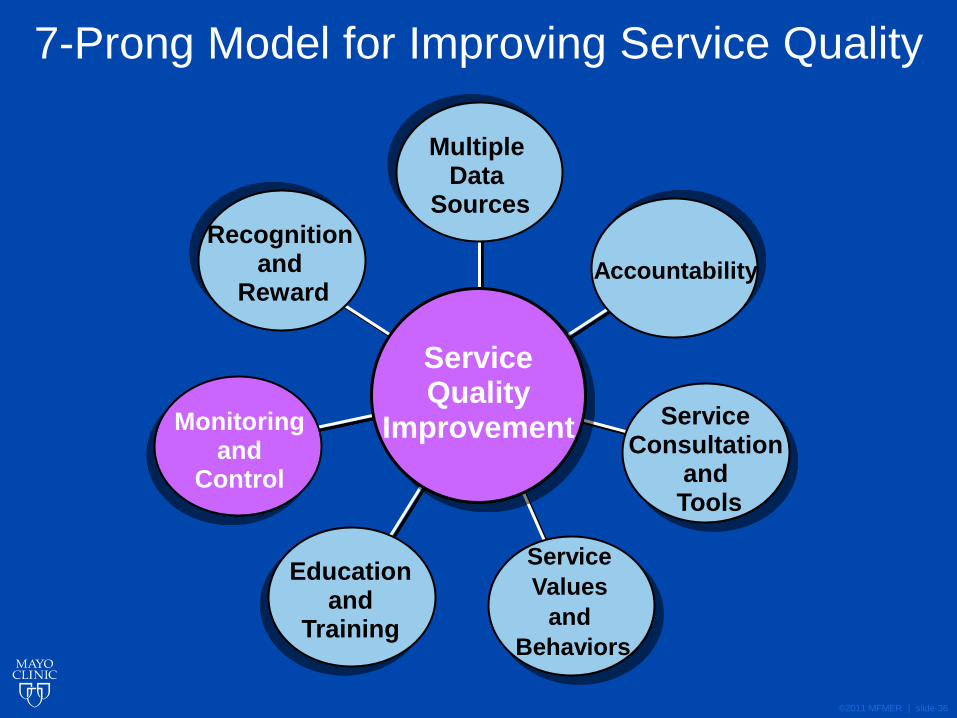
7-Prong Model for Improving Service Quality
Recognition and
Reward
Multiple Data
Sources
Accountability
Service Consultation
and Tools
Service
Values
and
Behaviors
Education and
Training
Monitoring and
Control
Service Quality
Improvement
DM Kennedy, RJ Caselli, and LL Berry. 2011. “A Roadmap for Improving Healthcare Service Quality,” Journal of
Healthcare Management, 56 (6), 385-402.

©2011 MFMER | slide-9
Service Performance Scorecard
• Perception data grouped with operational and other data
• Current quarter and longitudinal trends
• Emailed quarterly to executive and department leaders
• Increases awareness and accountability

Drivers of Perception of Overall Quality
Source: PRC 2010 Outpatient Satisfaction Data - n=34,218

Patient Perception of Overall Quality of Care from Provider
Source: PRC 2011 Outpatient Satisfaction Data

HCAHPS – Phase 1 Online Module
• Audience - all front-line hospital staff who help create the patient experience
• Provides general information and a link to the survey
• Teaches the 8 dimensions • Communication with nurses
• Communication with doctors
• Hospital environment – clean & quiet
• Responsiveness of hospital staff
• Pain management
• Communication about medications
• Discharge information
• Overall rating of hospital
• Provides verbal and behavioral suggestions
□ Never
□ Sometimes
□ Usually
□ Always
Survey Scale

HCAHPS Phase 2 – Push and Use the Data
Communication with Doctors
Source: HospitalCompare.gov, Reporting Period 7/1/20012 – 6/30/2013

Patient Comments
“The doctor really paid attention to what I said and listened to me.
The atmosphere is pleasant & feels healing.
I feel safe, taken care of & well informed here.
My ‘wait’ was under 5 min.
Appreciate the personal attention & care.
Thank you Michael, Misty & Linda for team excellence.
I did not feel like just another number out there.
I feel the front desk staff is not very polite and the girls were gossiping behind the counter.
As a new patient, I needed a better understanding of their processes.
A phone employee was rude, abrupt, unempathetic.
I feel the office staff could be more empathetic in dealing with people.
I would have liked better customer service from the staff.”
Source: PRC 2011 Satisfaction Survey
©2011 MFMER | slide-15
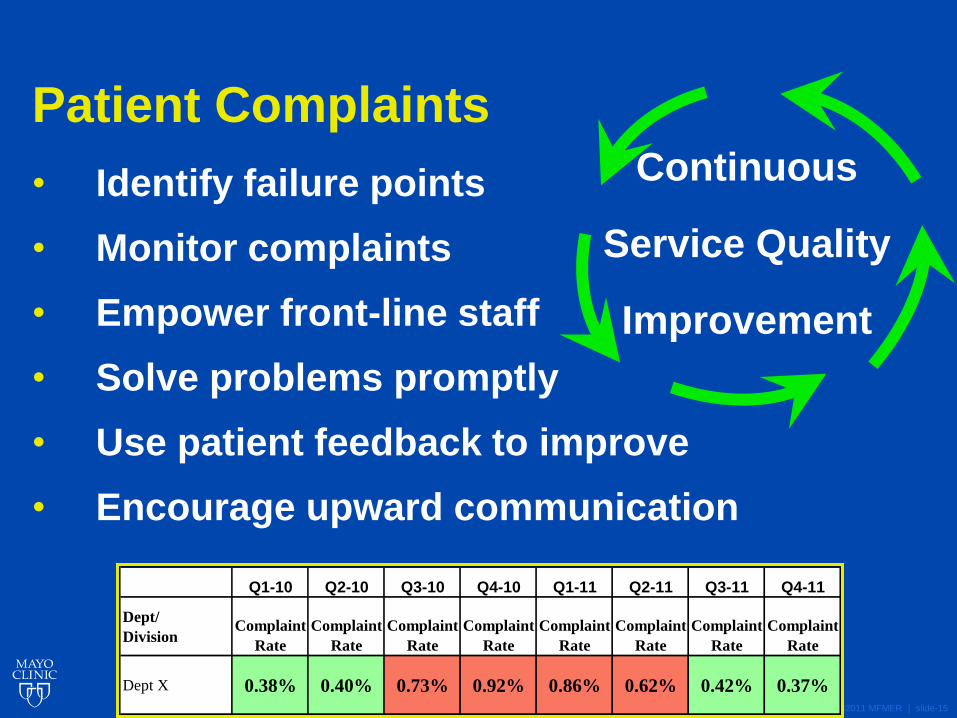
Patient Complaints
• Identify failure points
• Monitor complaints
• Empower front-line staff
• Solve problems promptly
• Use patient feedback to improve
• Encourage upward communication
Continuous
Service Quality
Improvement
Q1-10 Q2-10 Q3-10 Q4-10 Q1-11 Q2-11 Q3-11 Q4-11
Dept/
DivisionComplaint
Rate
Complaint
Rate
Complaint
Rate
Complaint
Rate
Complaint
Rate
Complaint
Rate
Complaint
Rate
Complaint
Rate
Dept X 0.38% 0.40% 0.73% 0.92% 0.86% 0.62% 0.42% 0.37%
©2011 MFMER | slide-16
7-Prong Model for Improving Service Quality
Recognition and
Reward
Multiple Data
Sources
Accountability
Service Consultation
and Tools
Service
Values
and
Behaviors
Education and
Training
Monitoring and
Control
Service Quality
Improvement

©2011 MFMER | slide-17
Clinical
Practice
Committee
Department Chairs and
Administrators Scorecard Metrics
Practice Performance
& Behaviors
Service
Committee
Progress reports to and
feedback from various
leadership groups
Service Accountability Loop
Kennedy, et al. 2011. “A Roadmap for Improving Healthcare Service Quality,”
Journal of Healthcare Management, 56 (6), 385-402.

Refining Service Quality Oversight
Chair/Administrator
submit action plan
to OPS leadership
within 30 days
Chair/OA present
action plan
status report
to OPS at 90 days
At Face-to-Face: • Reviews data,
improvement
resources, standard
action plan template,
and timelines
Within 2 weeks, OPS Chair
meets w/ Dept/Div
Chair/Admin. If unable to
schedule within 2 weeks,
emails data and
action plan template.
Quarterly
scorecard
distributed
to Chairs/Admins
Svc subcommittee
reviews
scorecard;
identifies issues
Svc Administrator
reviews
with Chair,
Clinic Operations
Svc Admin reports
issues and
recommendations
to CPC OPS
Action
Plan in
place?
Yes
No
START
CPC
Scorecard
monitored

©2011 MFMER | slide-19
7-Prong Model for Improving Service Quality
Recognition and
Reward
Multiple Data
Sources
Accountability
Service Consultation
and Tools
Service
Values
and
Behaviors
Education and
Training
Monitoring and
Control
Service Quality
Improvement

Department-level Service Quality Analysis
• Perception data trends, complaint trends, recommendations and improvement resources
• Prepared during the service consultation partnership
• Reviewed face-to-face
• Action plan started

Phone Call Parking Receptionist
Exam Room Discharge Bill Receipt
Kennedy, DM, Nordrum, JT, Edwards, FD, Caselli, RJ, and Berry, LL. “Improving Service Quality in Primary
Care.” American Journal of Medical Quality. Pre-published January 14, 2014, DOI: 10.1177/1062860613518093.
Facility/Waiting
Family Medicine Improvement Opportunities
Global
Perception
Nursing
Test Results
START
END
Service % Exc
Phone
access
38%
Appointment
access
48%
Phone staff
courtesy
51%
Overall
rating
59% Overall
rating
53% Efficiency 60%
Time spent
waiting
39%
Respect for
privacy
69%
Cleanliness 66%
Courtesy &
friendliness
66%
Overall
quality
61%
Value for
amount
paid
48%
Overall
quality
69%
Likelihood
to recommend
85%
Billing
process
34% Promptly
informed
patient
52% Instructions
for caring
for self after
appointment
52% Thoroughness 62%
Enough time 69%
Listening 67%
Explaining 66%
Words & terms 70%
Involving the
patient
65%
Courtesy/caring 75%
Being on time 54%
Quality of care
from provider
71%

Service consultation Service Administrator is an internal consultant to management, providing objective analysis and expertise, and positioned solely as an improvement resource. Accountability and oversight are achieved through other means.
Telephone system
and workflow analysis
A training coordinator observes call handling— volumes, time to answer, hold times, transfers, use of front and back office lines—and provides a report of issues and opportunities for improvement.
Provider communication
skills-building
Resources include a day-long, interactive group workshop, mentoring, or more intensive one-on-one coaching services. Providers may self refer or be referred by their department chairs.
Service basics
education and training
Gives staff a better understanding of service basics and how behaviors influence the customer’s perception of quality. Consists of basic core content and is customized with department-level data and relevant interactive exercises.
Service auditing Objective analysis of a department’s service environment, patient flow, and staff performance. A final report of observations and recommendations is provided.
Service best practice
database
Practices and work samples from areas performing at or above benchmark are compiled in a spreadsheet designed to filter by service attribute, department, process owner, process.
Multi-disciplinary
simulation center
A facility that is ideal for small, intact team education and training. The focus is on improving communication and teamwork skills.
Performance monitoring
checklists
Standardize expectations and performance and encourage process control to sustain improvements.
Action plan template Identifies issues, potential solutions, accountable people, and completion dates.
Service Improvement Toolbox

©2011 MFMER | slide-23
7-Prong Model for Improving Service Quality
Recognition and
Reward
Multiple Data
Sources
Accountability
Service Consultation
and Tools
Service
Values
and
Behaviors
Education and
Training
Monitoring and
Control
Service Quality
Improvement

©2011 MFMER | slide-24
MCA Service Values and Behaviors
Solutions-Focused
Empathetic
Reliable
Value Others
Exceed Expectations

©2011 MFMER | slide-25
Solutions-Focused
• Solve problems when and where they occur
• Work together to improve processes
• Share ideas
• Seek and provide feedback
Empathetic • Apologize for any inconvenience
• Seek and convey understanding of the other person
• Connect personally by smiling, making eye contact,
greeting, and listening
• Treat everyone as you wish you or your family to be
treated
“SERVE”

©2011 MFMER | slide-26
Reliable
• Commit to team and others
• Give your best every day
• Keep your promises
• Own the work ~ If you don’t have the answer, find it.
Value Others
• Show appreciation for each other
• Respect the patients and each other
• Acknowledge diversity and appreciate differences
• Do what is right
• Protect patient and employee confidentiality
• Refrain from gossiping
“SERVE”

©2011 MFMER | slide-27
Exceed Expectations
• Contribute to an unparalleled patient/family experience
• Anticipate needs and respond before being asked
• Commit to and show enthusiasm for service
“SERVE”

©2011 MFMER | slide-28
Create Memorable Experiences (Culture of Voluntarism)
• Patients expect quality, basic level of service, do
no harm
• Exceeding expectations differentiates
• Give a haircut
• Plan a wedding ceremony
• Waltz with an elderly patient
• Plan a surprise birthday party
• Remove a license plate frame
Step outside your job description

©2011 MFMER | slide-29
7-Prong Model for Improving Service Quality
Recognition and
Reward
Multiple Data
Sources
Accountability
Service Consultation
and Tools
Service
Values
and
Behaviors
Education and
Training
Monitoring and
Control
Service Quality
Improvement

©2011 MFMER | slide-30
Simplify Value Creation
Value = Clinical Outcomes + Safety + Service
Cost over Time
Smoldt, Robert K. and Denis A. Cortese. 2007. “Pay for Performance or Pay for Value?” Mayo Clinic
Proceedings 82 (2): 210-13.
Value = Benefits to Patient
Burdens Endured

Simplify Service Issue Identification The “Gaps” Framework
Gap 2: Process
Design and
Standards
Gap 3: Service
Performance
Gap 4: Service
Communications
Gap 1: Customer
Expectations
Service
Expectations
Service
Experience
Customer Gap
Adapted from Parasuraman, A., Valarie A. Zeithaml, and Leonard L. Berry. 1985. “A Conceptual Model of Service Quality and Its Implications for Future Research.” Journal of Marketing 49: 41-50.
©2011 MFMER | slide-32
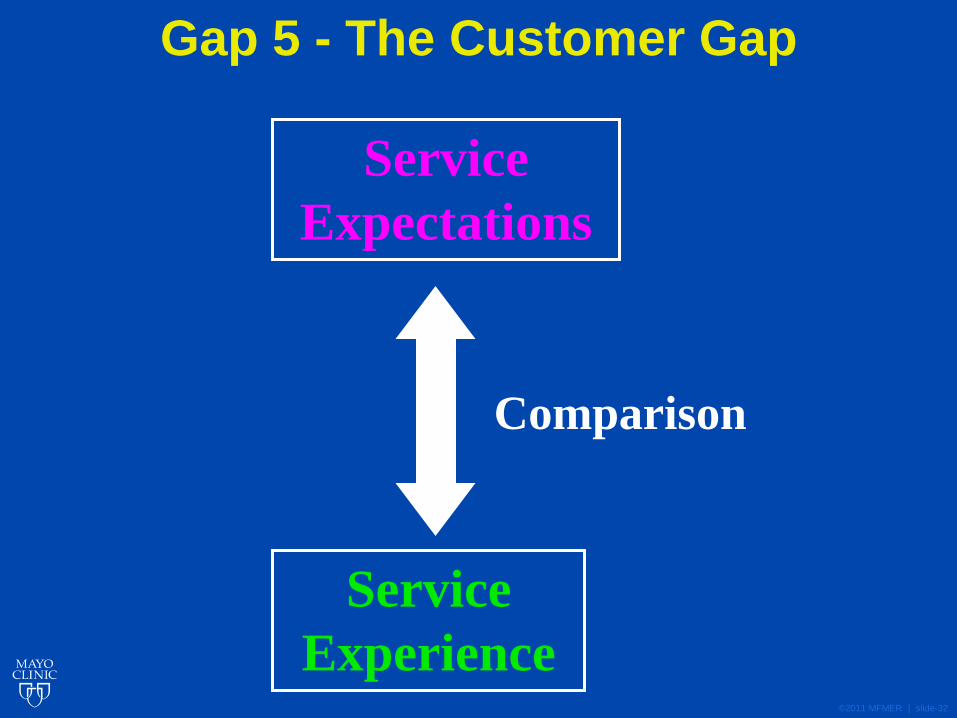
Gap 5 - The Customer Gap
Service
Expectations
Service
Experience
Comparison

Reliability #1 Ability to perform the promised service
dependably and accurately
Responsiveness Willingness to help customers and provide
prompt service
Empathy The caring, individualized attention the firm
provides its customers
Assurance Knowledge and courtesy of employees and
their ability to convey trust and confidence
Tangibles Appearance of physical facilities, equipment,
personnel, and communication materials
Parasuraman, A., Zeithaml, Valarie A., and Berry, Leonard L. “SERVQUAL: A Multiple-Item Scale for Measuring Consumer
Perceptions of Service Quality,” Journal of Retailing, Spring 1988;64, 1, 12-40.
Service Dimensions We Know What Customers Expect

©2011 MFMER | slide-34
Understanding Patient Expectations Purpose of Today’s Appointment
Adapted - Beeson SC. Practicing Excellence: A Physician's Manual to Exceptional Healthcare. Florida: Firestarter Publishing, 2006.

©2011 MFMER | slide-35
Setting Patient Expectations Informing of Test Results
©2011 MFMER | slide-36
7-Prong Model for Improving Service Quality
Recognition and
Reward
Multiple Data
Sources
Accountability
Service Consultation
and Tools
Service
Values
and
Behaviors
Education and
Training
Monitoring and
Control
Service Quality
Improvement

©2011 MFMER | slide-37
Monitoring Front-line Service

©2011 MFMER | slide-38
Monitoring Telephone Service

©2011 MFMER | slide-39
7-Prong Model for Improving Service Quality
Recognition and
Reward
Multiple Data
Sources
Accountability
Service Consultation
and Tools
Service
Values
and
Behaviors
Education and
Training
Monitoring and
Control
Service Quality
Improvement

©2011 MFMER | slide-40
Celebrate Service Excellence

©2011 MFMER | slide-41
Results 2008-2011 *
* Q1-12 began a new vendor implementation with different survey methodology, different rating scale,
different measurement of “overall” quality. Outpatient data available, beginning Q1-13.

©2011 MFMER | slide-42
Front-Door Attendants
“What stands out most is when
she pushed my mother in her wheelchair
all the way to the cafeteria,
took her over to the buffet line,
explained everything the chef was serving,
found her a comfortable place to sit,
and even set place settings and drinks.
Mary is truly a Mayo employee
who goes above and beyond.” Source: MCA Patient
Comment Card

©2011 MFMER | slide-43
Dept 3 Provider Service Attributes
57
59
61
63
65
67
69
71
73
75
77
2006 2007 2008 2009 2010
Thoroughness
Spending Enough Time
Listening
Using Words and Terms
Involving You in Decisions
Being Courteous and Caring
Explaining Medical Condition
% E
xcell
en
t
Dept 1 Provider Service Attributes
55
57
59
61
63
65
67
69
71
73
75
2006 2007 2008 2009 2010
Thoroughness
Spending Enough Time
Listening
Using Words and Terms
Involving Patient in Decisions
Being Courteous and Caring
Explaining Medical Condition
% E
xcell
en
t
Dept 4 Provider Service Attributes
63
65
67
69
71
73
75
77
79
81
83
2006 2007 2008 2009 2010
Thoroughness
Spending Enough Time
Listening
Using Words and Terms
Involving Patient in Decisions
Courtesy and Caring
Explaining Medical Condition
% E
xcell
en
t
Dept 2 Provider Service Attributes
60
65
70
75
80
85
2006 2007 2008 2009 2010
% E
xcell
en
t
Thoroughness
Spending Enough Time
Listening
Using Words and Terms
Involving Patient in Decisions
Courtesy and Caring
Explaining Medical Condition
Provider Service Improvement
Kennedy, et. al. 2011. “A Roadmap for Improving Healthcare Service Quality,” Journal of Healthcare Management, 56 (6), 385-402.

Improved Perception of Provider Communication
after Skills-Building Workshop
Kennedy, DM, Fasolino, JP, and Gullen, DJ. 2014. “Improving the Patient Experience through Provider Communication Skills Building.”
Patient Experience Journal. Vol. 1: Iss. 1, Article 10. Available at: http://pxjournal.org/journal/vol1/iss1/10

©2011 MFMER | slide-45
Likelihood to Recommend
80
81
82
83
84
85
86
87
88
89
90
2002 2003 2004 2005 2006 2007 2008 2009 2010
% D
efi
nit
ely
Wo
uld
Value
52
53
54
55
56
57
58
59
60
61
62
2002 2003 2004 2005 2006 2007 2008 2009 2010
% E
xcell
en
t
Outcome
52
53
54
55
56
57
58
59
60
61
62
2005 2006 2007 2008 2009 2010
% E
xcell
en
t
Quality
71
72
73
74
75
76
77
78
79
80
81
2004 2005 2006 2007 2008 2009 2010
% E
xcell
en
t
Impact on Clinic Global Perception
Kennedy, et. al. 2011. “A Roadmap for Improving Healthcare Service Quality,” Journal of Healthcare Management, 56 (6), 385-402.

Family Medicine Service Improvement
Survey Question n
%
Excellent n
%
Excellent p Value
Thoroughness of medical exam 273 62 274 70 0.04
Spending enough time * 278 69 277 74 NS
Listening to patient concerns * 280 67 274 75 0.04
Using understandable words and terms * 280 70 279 77 NS
Explaining medical condition * 273 65 271 73 0.04
Involving patient in decisions about care * 273 65 273 72 NS
Showing courtesy and caring 280 74 279 80 NS
Being on time for the appointment 279 54 277 59 NS
Overall quality of care from provider 280 71 279 78 NS
Representative Patient Comments
Survey Question n
%
Excellent n
%
Excellent p Value
Teamwork between doctors, nurses, and staff 267 56 270 64 0.04
Promptly informing patient of test results * 244 52 258 62 0.02
Courtesy/friendliness of nurses
and medical assistants 277 66 275 70 NS
Courtesy/helpfulness of telephone staff * 269 51 271 61 0.02
Access to appointments when needed * 276 48 277 53 NS
Ease of access by phone * 239 38 242 45 NS
Perception of efficiency 279 60 279 66 NS
Overall quality of care * 278 69 279 79 0.01
Representative Patient Comments
2009 2011
"I liked the interaction
with the physician."
"He seems like he has nothing else
to do besides talk to me and answer
questions."
"I would have liked
better customer
service from the staff."
"I felt the whole thing was an excellent
experience and very well organized."
All
ied
Healt
h S
taff
P
rovid
er
Kennedy, et al. “Improving Service Quality in
Primary Care.” American Journal of Medical
Quality. Pre-published January 14, 2014,
DOI: 10.1177/1062860613518093.

Perception of Overall Quality
in Family Medicine
The arrow indicates implementation of the service quality improvement model in early 2010.
n = 280/year
Kennedy, et al. “Improving Service Quality in Primary Care.” American
Journal of Medical Quality. Pre-published January 14, 2014, DOI:
10.1177/1062860613518093.

Outpatient Overall Quality 2013
New Top Box = “Strongly Agree”
2012 2013
Clinic - Outpatient 87
Dept 1 85
Dept 2 85
Dept 3 87
Dept 4 88
Family Medicine 88 2013 vendor 90th percentile = 89%

©2011 MFMER | slide-49
Preparing for CG-CAHPS*
* Service attributes currently measured in the CG-CAHPS Adult 12-month questionnaire 2.0
CG-CAHPS Service Attributes Representative Improvement Activities
Ease of access by phone
~ Ongoing monitoring of call centers metrics and
patient verbatim comments
~ Workflow redesign
~ Adjust staffing patterns
Courtesy/helpful/respectful telephone staff
~ Hire for service; orient to role; shadow
~ Service/communication education & training
~ Ongoing supervisor monitoring and coaching
~ Centralized QA program
Access to appointments when needed
"Say Yes" campaign - Review and remove, as able,
hard stops, case reviews, and other barriers into the
specialty practice
Waiting room wait time
~ Formalizing a late-arrival policy
~ Practice redesign - streamline, improve throughput,
gather info prior to visit
Provider communication and service behaviors
Global rating of provider
~ Presentations to leadership groups
~ Push data to chairs
~ Individual provider portfolio
~ Consult/help with interpreting data
~ 3-tier communication skills-building resources-
web-based/self-directed, workshop, 1:1 coaching
Informing patient of test results
~ Set patient expectations re: timing and method
~ Set service standards to notify non-portal users of
test results
~ Identify likely portal users and promote benefits
~ Help set up portal account

©2011 MFMER | slide-50
Conclusions
Service quality improvement is best approached
as:
• A comprehensive, data-driven,
continuous improvement model
• A model in which leadership engagement
and support are essential
• A long-term journey vs. a destination
• Setbacks will occur
• Internal customers first