
LESSON Capture-Recapture 2.2 W - Algebra 1 -...
5
LESSON 2.2 LESSON 2.2 Capture-Recapture 103 Capture-Recapture W ildlife biologists often need to know how many deer are in a national park or the size of the perch population in a large lake. It is impossible to count each deer or fish, so biologists use a method called “capture-recapture” that uses ratios to estimate the population. To estimate a fish population, biologists first capture some of the fish and put tags on them. Then these tagged fish are returned to the lake to mingle with all of the untagged fish. The biologist allows time for the fish to mix thoroughly, captures another sample, and counts how many of the sample are tagged. The Universe is a grand book which cannot be read until one first learns to comprehend the language.... It is written in the language of mathematics. GALILEO GALILEI Investigation Fish in the Lake In this investigation you’ll simulate the capture-recapture method and examine how it works. The bag represents a lake, the white beans are the untagged fish in the lake, and the red beans will replace white beans to represent tagged fish. Your objective is to estimate the total number of fish in the lake. Step 1 Reach into the lake and remove a handful of fish to tag. Count and record the number of fish you removed. Replace these fish (white beans) with an equal number of tagged fish (red beans). Return the tagged fish to the lake. Set aside the extra beans. Step 2 Allow the fish to mingle (seal the bag and shake it). Again remove a handful of fish, count them all, and count the number of tagged fish. In a table like this, record those counts and the ratio of tagged fish to total fish in the sample. You have taken one sample by randomly capturing some of the fish. You could use this sample to estimate the number of fish in the lake, but by taking several samples, you will get a better idea of the ratio of tagged fish to total fish in the lake. Replace the fish, mix them, and repeat the sampling process four times, filling in a row of your table each time. You will need ● a paper bag ● white beans ● red beans Tagging Simulation Sample number Number of Total number Ratio of tagged tagged fish of fish fish to total fish 1 2
Transcript of LESSON Capture-Recapture 2.2 W - Algebra 1 -...
L E S S O N
2.2
LESSON 2.2 Capture-Recapture 103
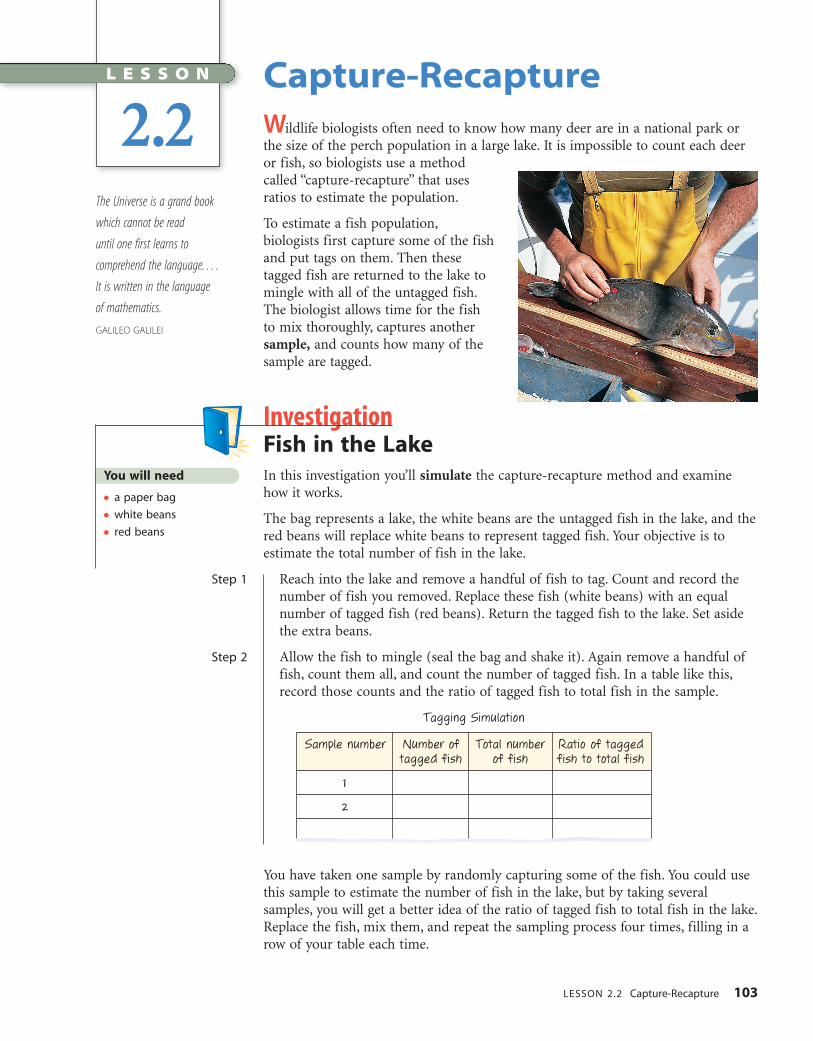
Capture-RecaptureWildlife biologists often need to know how many deer are in a national park orthe size of the perch population in a large lake. It is impossible to count each deeror fish, so biologists use a methodcalled “capture-recapture” that usesratios to estimate the population.
To estimate a fish population,biologists first capture some of the fishand put tags on them. Then thesetagged fish are returned to the lake tomingle with all of the untagged fish.The biologist allows time for the fishto mix thoroughly, captures anothersample, and counts how many of thesample are tagged.
The Universe is a grand book
which cannot be read
until one first learns to
comprehend the language. . . .
It is written in the language
of mathematics.
GALILEO GALILEI
InvestigationFish in the LakeIn this investigation you’ll simulate the capture-recapture method and examinehow it works.
The bag represents a lake, the white beans are the untagged fish in the lake, and thered beans will replace white beans to represent tagged fish. Your objective is toestimate the total number of fish in the lake.
Step 1 Reach into the lake and remove a handful of fish to tag. Count and record thenumber of fish you removed. Replace these fish (white beans) with an equalnumber of tagged fish (red beans). Return the tagged fish to the lake. Set asidethe extra beans.
Step 2 Allow the fish to mingle (seal the bag and shake it). Again remove a handful offish, count them all, and count the number of tagged fish. In a table like this,record those counts and the ratio of tagged fish to total fish in the sample.
You have taken one sample by randomly capturing some of the fish. You could usethis sample to estimate the number of fish in the lake, but by taking severalsamples, you will get a better idea of the ratio of tagged fish to total fish in the lake.Replace the fish, mix them, and repeat the sampling process four times, filling in arow of your table each time.
You will need
● a paper bag
● white beans
● red beans
Tagging Simulation
Sample number Number of Total number Ratio of taggedtagged fish of fish fish to total fish
1
2
DA2SE_763_02.qxd 10/17/2005 18:54 Page 103
Step 3 Choose a representative ratio for the five ratios. Explain how you decided thiswas a representative ratio.
Step 4 If you mixed the fish well, should the fraction of tagged fish in a sample benearly the same as the fraction of tagged fish in the lake? Why or why not?
Step 5 Write and solve a proportion to find the number of fish in the lake. (About howmany beans are in your bag?) Why is this method called capture-recapture? Howaccurate are predictions using this method? Why?
104 CHAPTER 2 Proportional Reasoning and Variation
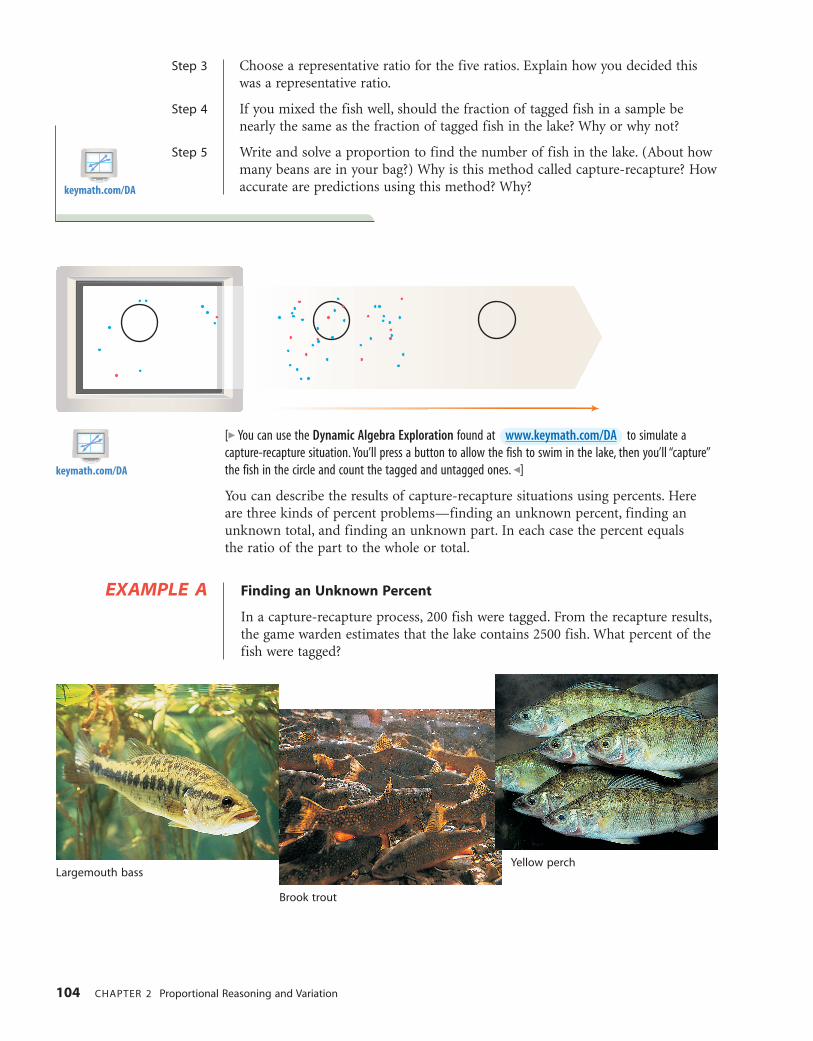
[� You can use the Dynamic Algebra Exploration found at to simulate acapture-recapture situation. You’ll press a button to allow the fish to swim in the lake, then you’ll “capture”the fish in the circle and count the tagged and untagged ones. �]
You can describe the results of capture-recapture situations using percents. Hereare three kinds of percent problems—finding an unknown percent, finding anunknown total, and finding an unknown part. In each case the percent equals the ratio of the part to the whole or total.
Finding an Unknown Percent
In a capture-recapture process, 200 fish were tagged. From the recapture results,the game warden estimates that the lake contains 2500 fish. What percent of thefish were tagged?
www.keymath.com/DA
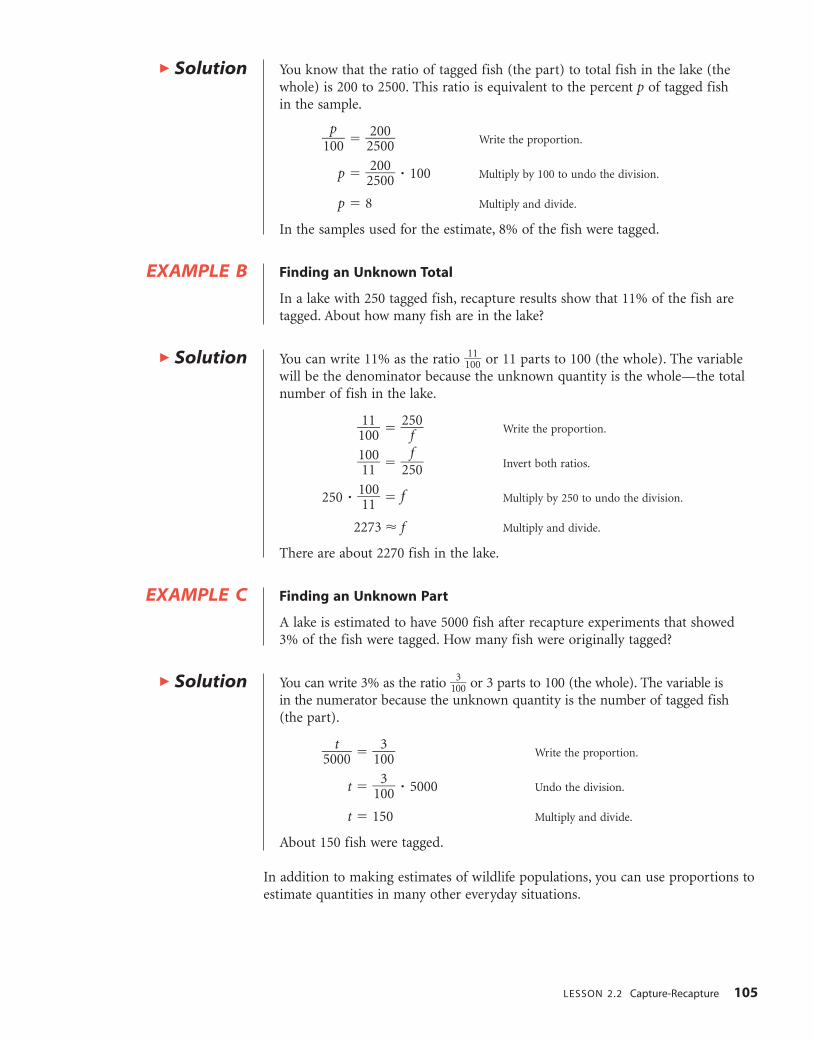
Brook trout
Yellow perch
EXAMPLE A
Largemouth bass
keymath.com/DA
keymath.com/DA
DA2SE_763_02.qxd 10/17/2005 18:54 Page 104
LESSON 2.2 Capture-Recapture 105
You know that the ratio of tagged fish (the part) to total fish in the lake (thewhole) is 200 to 2500. This ratio is equivalent to the percent p of tagged fish in the sample.
�1p00� � �2
250000� Write the proportion.
p � �2250000� � 100 Multiply by 100 to undo the division.
p � 8 Multiply and divide.
In the samples used for the estimate, 8% of the fish were tagged.
Finding an Unknown Total
In a lake with 250 tagged fish, recapture results show that 11% of the fish aretagged. About how many fish are in the lake?
You can write 11% as the ratio �11010� or 11 parts to 100 (the whole). The variable
will be the denominator because the unknown quantity is the whole—the totalnumber of fish in the lake.
�11010� � �
25f0
� Write the proportion.
�11010
� � �25f0� Invert both ratios.
250 � �11010
� � f Multiply by 250 to undo the division.
2273 � f Multiply and divide.
There are about 2270 fish in the lake.
Finding an Unknown Part
A lake is estimated to have 5000 fish after recapture experiments that showed 3% of the fish were tagged. How many fish were originally tagged?
You can write 3% as the ratio �1300� or 3 parts to 100 (the whole). The variable is
in the numerator because the unknown quantity is the number of tagged fish(the part).
�50t00� � �1
300� Write the proportion.
t � �1300� � 5000 Undo the division.
t � 150 Multiply and divide.
About 150 fish were tagged.
In addition to making estimates of wildlife populations, you can use proportions toestimate quantities in many other everyday situations.
� Solution
EXAMPLE B
� Solution
EXAMPLE C
� Solution
DA2SE_763_02.qxd 10/17/2005 18:54 Page 105
106 CHAPTER 2 Proportional Reasoning and Variation
EXERCISES
Practice Your Skills
1. The proportion �32
23
05� � �10
g0� represents the question “320 is what percent of 235?”
Write each proportion as a percent question.
a. �2w4� � �1
3020� b. �45
t0� � �1
4080� c. �1
9187� � �1
n00�
2. You can write the question “What number is 15% of 120?” as the proportion �12
x0� � �1
1050�. Write each question as a proportion.
a. 125% of what number is 80?
b. What number is 0.25% of 46?
c. What percent of 470 is 72?
3. There are 1582 students attending the local high school. Seventeen percent of thestudents are twelfth graders. How many twelfth graders are there?
4. APPLICATION Write and solve a proportion for each situation.
a. A biologist tagged 250 fish. Then she collected another sample of 75 fish, ofwhich 5 were tagged. How many fish would she estimate are in the lake?
b. A biologist estimated that there were 5500 fish in a lake in which 250 fish hadbeen tagged. A ranger collected a sample in which there were 15 tagged fish.Approximately how many fish were in the sample the ranger collected?
Reason and Apply
5. Marie and Richard played 47 games of backgammon lastmonth. Marie’s ratio of wins to losses was 28 to 19.
a. Estimate the number of games you expect Marie towin if she and Richard play 12 more games. Explainyour thinking.
b. Write a proportion, and solve for Marie’s expectednumber of wins if she and Richard play 12 moregames.
c. Write a proportion and solve it to determine howmany games she and Richard will need to play beforeRichard can expect to win 30 games.
6. Jon opened a package of candies and counted them. He found 60 candies in the1.69-ounce package.
a. Estimate the number of candies in a 1-pound (16-ounce) bag. Explain yourthinking for this estimate.
b. Write the proportion and solve for the number of candies in a 1-pound package.Compare your approximation to your estimate in 6a.
c. How much would 1 million candies weigh? Give your answer in pounds.
a
a
a
a
a
�
�
keymath.com/DA
DA2SE_763_02.qxd 10/17/2005 18:54 Page 106
LESSON 2.2 Capture-Recapture 107
7. APPLICATION Terry and Jesse are writing a paper together. They’refinished, except for proofreading the draft. Each reads the draftseparately. Terry finds 24 errors, and Jesse finds 36 errors. Whenthey compare their results, they find that they’ve both marked 18of the same errors. Use the capture-recapture method to estimatethe number of errors that both of them missed. (Hint: The errorfound by either student can be used as the number of taggederrors in the capture phase. The other student represents therecapture phase with the errors found by both being the taggederrors.)
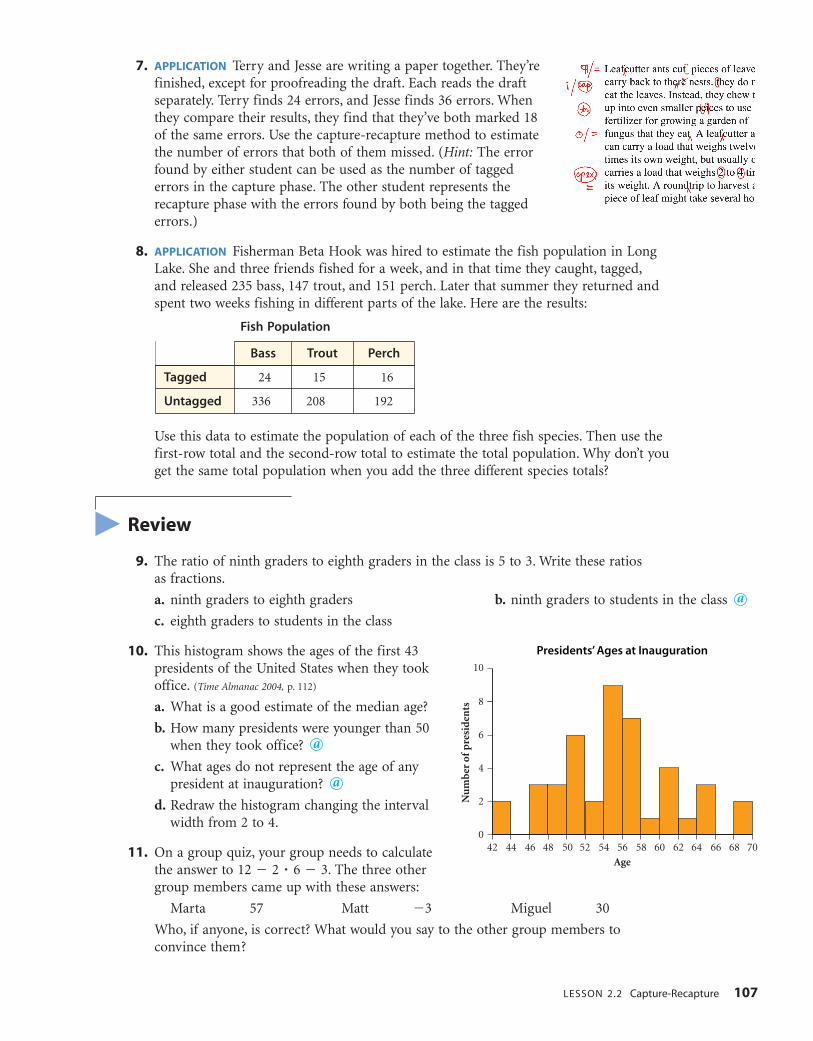
8. APPLICATION Fisherman Beta Hook was hired to estimate the fish population in LongLake. She and three friends fished for a week, and in that time they caught, tagged,and released 235 bass, 147 trout, and 151 perch. Later that summer they returned andspent two weeks fishing in different parts of the lake. Here are the results:
Use this data to estimate the population of each of the three fish species. Then use thefirst-row total and the second-row total to estimate the total population. Why don’t youget the same total population when you add the three different species totals?
Review
9. The ratio of ninth graders to eighth graders in the class is 5 to 3. Write these ratios as fractions.
a. ninth graders to eighth graders b. ninth graders to students in the class
c. eighth graders to students in the class
10. This histogram shows the ages of the first 43presidents of the United States when they tookoffice. (Time Almanac 2004, p. 112)
a. What is a good estimate of the median age?
b. How many presidents were younger than 50when they took office?
c. What ages do not represent the age of anypresident at inauguration?
d. Redraw the histogram changing the intervalwidth from 2 to 4.
11. On a group quiz, your group needs to calculatethe answer to 12 � 2 � 6 � 3. The three othergroup members came up with these answers:
Marta 57 Matt �3 Miguel 30
Who, if anyone, is correct? What would you say to the other group members toconvince them?
a
a
a
42 44 46 48 50 52 54 56 58 60 62 64 66 68 70
2
0
4
6
8
10
Age
Nu
mb
er o
f p
resi
den
ts
Presidents’ Ages at Inauguration
�
Fish Population
Bass Trout Perch
Tagged 24 15 16
Untagged 336 208 192
DA2SE_763_02.qxd 10/17/2005 18:54 Page 107