Lesson 8: Exploring the Symmetry in Graphs of Quadratic · Lesson 8: Exploring the Symmetry in...
13
NYS COMMON CORE MATHEMATICS CURRICULUM M4 Lesson 8 ALGEBRA I Lesson 8: Exploring the Symmetry in Graphs of Quadratic Functions 81 This work is derived from Eureka Math ™ and licensed by Great Minds. ©2015 Great Minds. eureka-math.org This file derived from ALG I-M4-TE-1.3.0-09.2015 This work is licensed under a Creative Commons Attribution-NonCommercial-ShareAlike 3.0 Unported License. Lesson 8: Exploring the Symmetry in Graphs of Quadratic Functions Student Outcomes Students examine quadratic equations in two variables represented graphically on a coordinate plane and recognize the symmetry of the graph. They explore key features of graphs of quadratic functions: -intercept and -intercept, the vertex, the axis of symmetry, increasing and decreasing intervals, negative and positive intervals, and end behavior. They sketch graphs of quadratic functions as a symmetric curve with a highest or lowest point corresponding to its vertex and an axis of symmetry passing through the vertex. Lesson Notes F-IF.B.4 and F-IF.B.7a are central to the concepts in this lesson as students recognize the symmetry of the graph of a quadratic equation and sketch their graphs as a symmetric curve with a highest or lowest point corresponding to its vertex (a maximum or minimum value of the function) and the axis of symmetry passing through the vertex. This lesson is an exploration focusing on the symmetric nature of quadratic functions and their graphs and the interpretation of the key features. Classwork Opening (4 minutes): Graph Vocabulary Introduce the following terms, and discuss their meanings. Demonstrate these features on a projection of one of the photographs or on a graph that is either sketched or projected onto the screen. If students keep a journal, have them put these terms in their vocabulary section. Graph Vocabulary AXIS OF SYMMETRY: Given a quadratic function in standard form, () = + + , the vertical line given by the graph of the equation =− is called the axis of symmetry of the graph of the quadratic function. VERTEX: The point where the graph of a quadratic function and its axis of symmetry intersect is called the vertex. END BEHAVIOR OF A GRAPH: Given a quadratic function in the form () = + + (or () = ( − ) +), the quadratic function is said to open up if > and open down if <. If >, then has a minimum at the -coordinate of the vertex; that is, is decreasing for -values less than (or to the left of) the vertex, and is increasing for -values greater than (or to the right of) the vertex. If <, then has a maximum at the -coordinate of the vertex; that is, is increasing for -values less than (or to the left of) the vertex, and is decreasing for -values greater than (or to the right of) the vertex.
Transcript of Lesson 8: Exploring the Symmetry in Graphs of Quadratic · Lesson 8: Exploring the Symmetry in...
NYS COMMON CORE MATHEMATICS CURRICULUM M4 Lesson 8
ALGEBRA I
Lesson 8: Exploring the Symmetry in Graphs of Quadratic Functions
81
This work is derived from Eureka Math ™ and licensed by Great Minds. ©2015 Great Minds. eureka-math.org This file derived from ALG I-M4-TE-1.3.0-09.2015
This work is licensed under a Creative Commons Attribution-NonCommercial-ShareAlike 3.0 Unported License.
Lesson 8: Exploring the Symmetry in Graphs of Quadratic
Functions
Student Outcomes
Students examine quadratic equations in two variables represented graphically on a coordinate plane and
recognize the symmetry of the graph. They explore key features of graphs of quadratic functions: 𝑦-intercept
and 𝑥-intercept, the vertex, the axis of symmetry, increasing and decreasing intervals, negative and positive
intervals, and end behavior. They sketch graphs of quadratic functions as a symmetric curve with a highest or
lowest point corresponding to its vertex and an axis of symmetry passing through the vertex.
Lesson Notes
F-IF.B.4 and F-IF.B.7a are central to the concepts in this lesson as students recognize the symmetry of the graph of a
quadratic equation and sketch their graphs as a symmetric curve with a highest or lowest point corresponding to its
vertex (a maximum or minimum value of the function) and the axis of symmetry passing through the vertex. This lesson
is an exploration focusing on the symmetric nature of quadratic functions and their graphs and the interpretation of the
key features.
Classwork
Opening (4 minutes): Graph Vocabulary
Introduce the following terms, and discuss their meanings. Demonstrate these features on a projection of one of the
photographs or on a graph that is either sketched or projected onto the screen. If students keep a journal, have them
put these terms in their vocabulary section.
Graph Vocabulary
AXIS OF SYMMETRY: Given a quadratic function in standard form, 𝒇(𝒙) = 𝒂𝒙𝟐 + 𝒃𝒙 + 𝒄, the vertical line given by the graph
of the equation 𝒙 = −𝒃
𝟐𝒂 is called the axis of symmetry of the graph of the quadratic function.
VERTEX: The point where the graph of a quadratic function and its axis of symmetry intersect is called the vertex.
END BEHAVIOR OF A GRAPH: Given a quadratic function in the form 𝒇(𝒙) = 𝒂𝒙𝟐 + 𝒃𝒙 + 𝒄 (or 𝒇(𝒙) = 𝒂(𝒙 − 𝒉)𝟐 + 𝒌), the
quadratic function is said to open up if 𝒂 > 𝟎 and open down if 𝒂 < 𝟎.
If 𝒂 > 𝟎, then 𝒇 has a minimum at the 𝒙-coordinate of the vertex; that is, 𝒇 is decreasing for 𝒙-values less than
(or to the left of) the vertex, and 𝒇 is increasing for 𝒙-values greater than (or to the right of) the vertex.
If 𝒂 < 𝟎, then 𝒇 has a maximum at the 𝒙-coordinate of the vertex; that is, 𝒇 is increasing for 𝒙-values less than
(or to the left of) the vertex, and 𝒇 is decreasing for 𝒙-values greater than (or to the right of) the vertex.
NYS COMMON CORE MATHEMATICS CURRICULUM M4 Lesson 8
ALGEBRA I
Lesson 8: Exploring the Symmetry in Graphs of Quadratic Functions
82
This work is derived from Eureka Math ™ and licensed by Great Minds. ©2015 Great Minds. eureka-math.org This file derived from ALG I-M4-TE-1.3.0-09.2015
This work is licensed under a Creative Commons Attribution-NonCommercial-ShareAlike 3.0 Unported License.
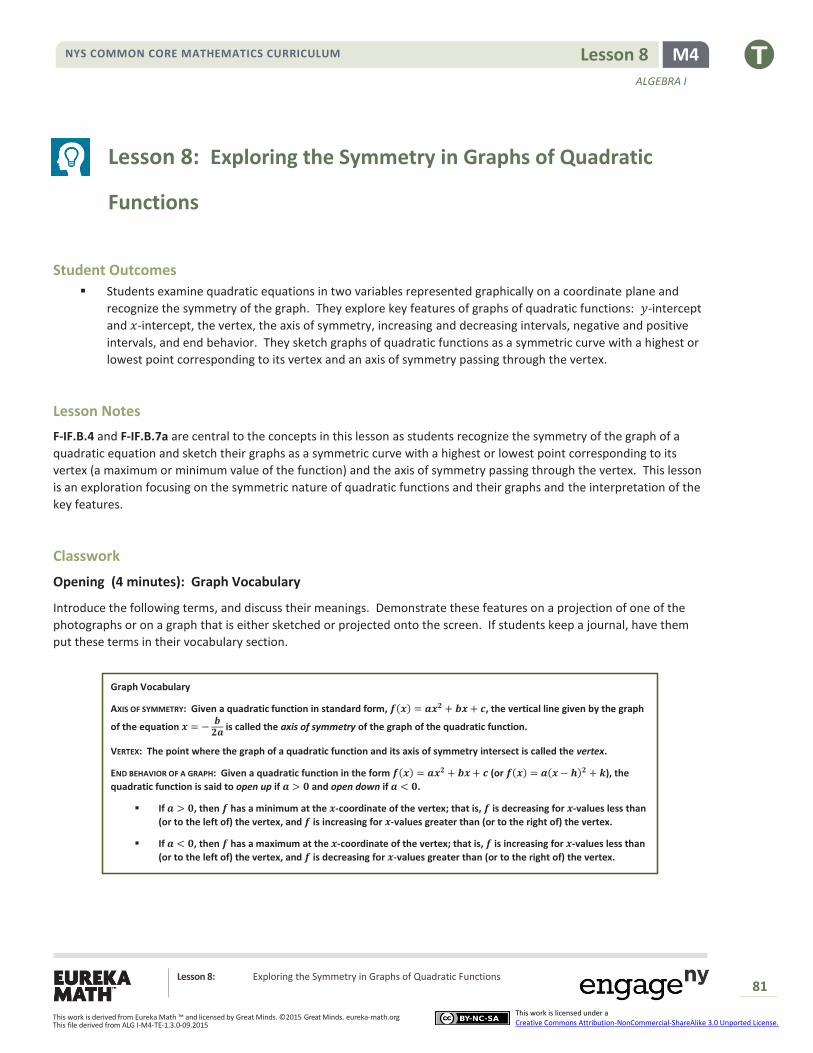
A quadratic function is a polynomial function of degree 2. A quadratic function is in standard form if it is written in the
form, 𝑓(𝑥) = 𝑎𝑥2 + 𝑏𝑥 + 𝑐, for constants 𝑎, 𝑏, 𝑐 with 𝑎 ≠ 0 and for 𝑥 any real number. Given a quadratic function in
standard form, the vertical line given by the graph of the equation, 𝑥 = −𝑏
2𝑎, is called the axis of symmetry of the graph
of the quadratic function.
Exploratory Challenge 1 (5 minutes)
Either project the photographs below on the board or print them so that the class can view them together. Use the
arched features of the architecture and the two questions beneath the photographs to help students describe the
overall shape of the graph of a quadratic function in their own words. Consider finding other photographs of similar
curves in nature or in architecture to add to or use in place of the ones presented in this exercise.
IMPORTANT: In the interest of full disclosure, many of the photographs in Exploratory Challenge 1 cannot actually be
modeled with a quadratic function but rather are catenary curves. These are “quadratic-like” and can be used for our
teaching purposes as they display many of the same features, including the symmetry we are exploring in this lesson.
For more information, see the following links for discussions on the difference:
Is the Gateway Arch a Parabola?
http://www.intmath.com/blog/is-the-gateway-arch-a-parabola/4306
Catenary and Parabola Comparison
http://mathforum.org/library/drmath/view/65729.html
End behavior: This graph of
a quadratic function opens
up. As the values of 𝒙
approach +∞ and −∞, the
values of 𝒚 approach +∞.
x
y
NYS COMMON CORE MATHEMATICS CURRICULUM M4 Lesson 8
ALGEBRA I
Lesson 8: Exploring the Symmetry in Graphs of Quadratic Functions
83
This work is derived from Eureka Math ™ and licensed by Great Minds. ©2015 Great Minds. eureka-math.org This file derived from ALG I-M4-TE-1.3.0-09.2015
This work is licensed under a Creative Commons Attribution-NonCommercial-ShareAlike 3.0 Unported License.
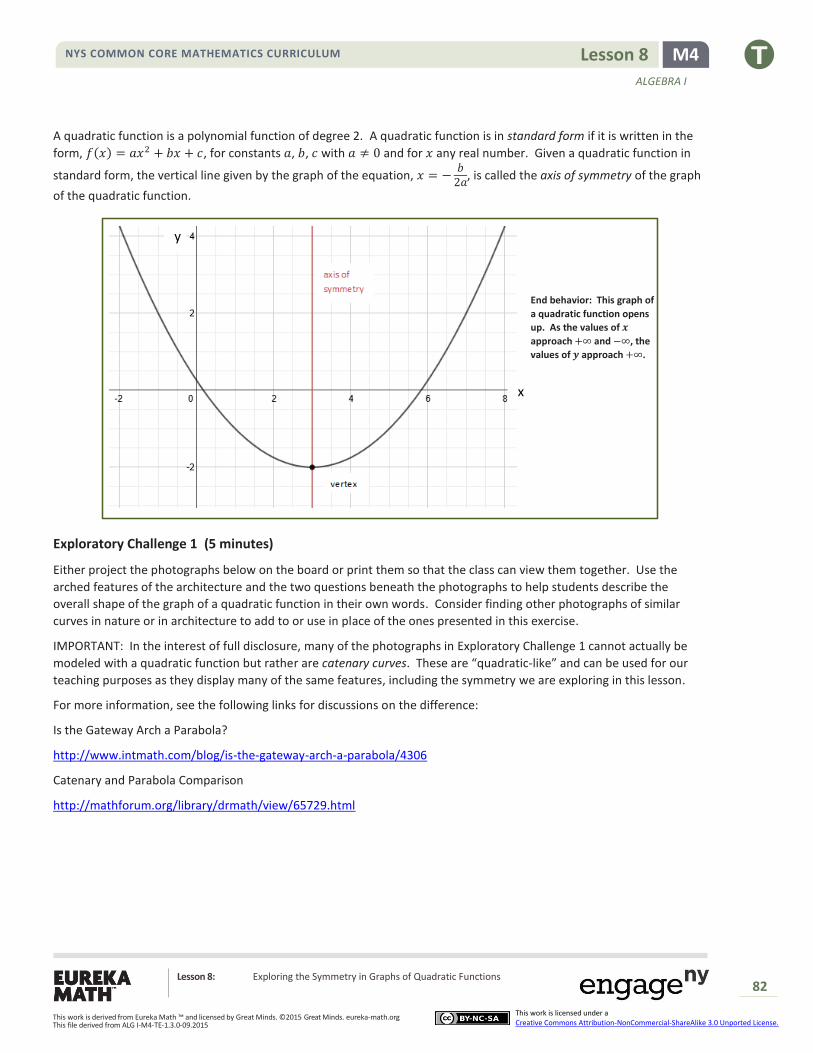
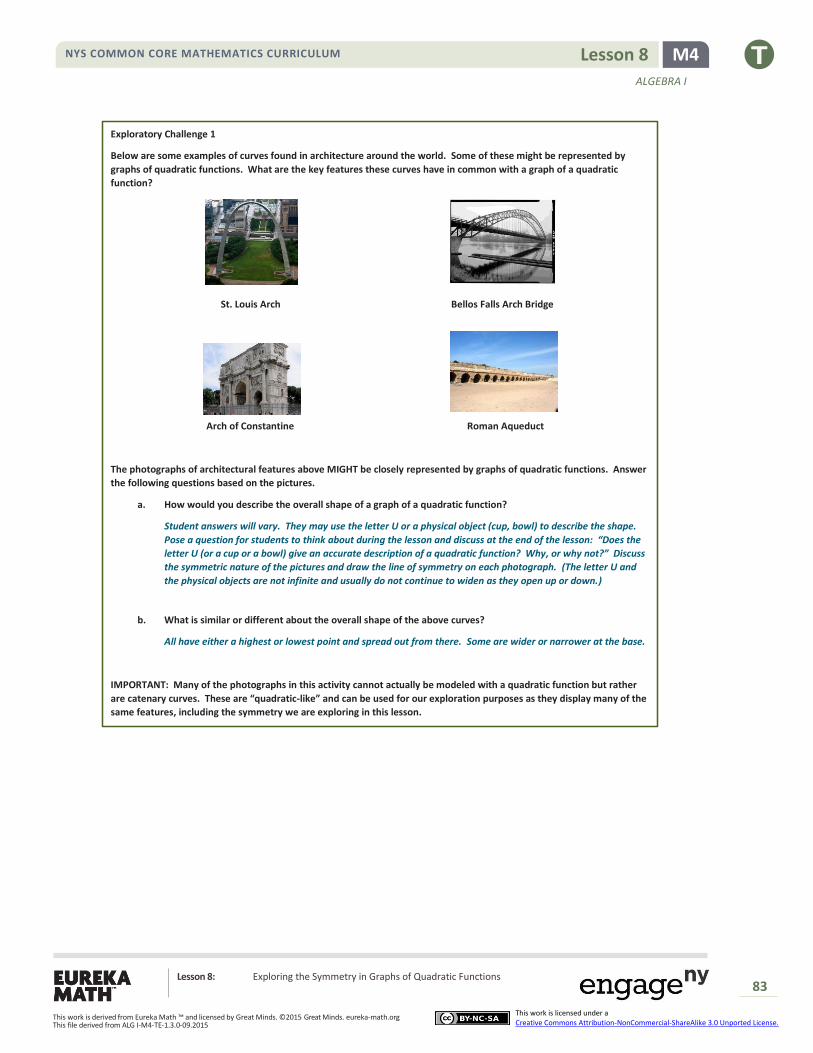
Exploratory Challenge 1
Below are some examples of curves found in architecture around the world. Some of these might be represented by
graphs of quadratic functions. What are the key features these curves have in common with a graph of a quadratic
function?
St. Louis Arch Bellos Falls Arch Bridge
Arch of Constantine Roman Aqueduct
The photographs of architectural features above MIGHT be closely represented by graphs of quadratic functions. Answer
the following questions based on the pictures.
a. How would you describe the overall shape of a graph of a quadratic function?
Student answers will vary. They may use the letter U or a physical object (cup, bowl) to describe the shape.
Pose a question for students to think about during the lesson and discuss at the end of the lesson: “Does the
letter U (or a cup or a bowl) give an accurate description of a quadratic function? Why, or why not?” Discuss
the symmetric nature of the pictures and draw the line of symmetry on each photograph. (The letter U and
the physical objects are not infinite and usually do not continue to widen as they open up or down.)
b. What is similar or different about the overall shape of the above curves?
All have either a highest or lowest point and spread out from there. Some are wider or narrower at the base.
IMPORTANT: Many of the photographs in this activity cannot actually be modeled with a quadratic function but rather
are catenary curves. These are “quadratic-like” and can be used for our exploration purposes as they display many of the
same features, including the symmetry we are exploring in this lesson.
NYS COMMON CORE MATHEMATICS CURRICULUM M4 Lesson 8
ALGEBRA I
Lesson 8: Exploring the Symmetry in Graphs of Quadratic Functions
84
This work is derived from Eureka Math ™ and licensed by Great Minds. ©2015 Great Minds. eureka-math.org This file derived from ALG I-M4-TE-1.3.0-09.2015
This work is licensed under a Creative Commons Attribution-NonCommercial-ShareAlike 3.0 Unported License.
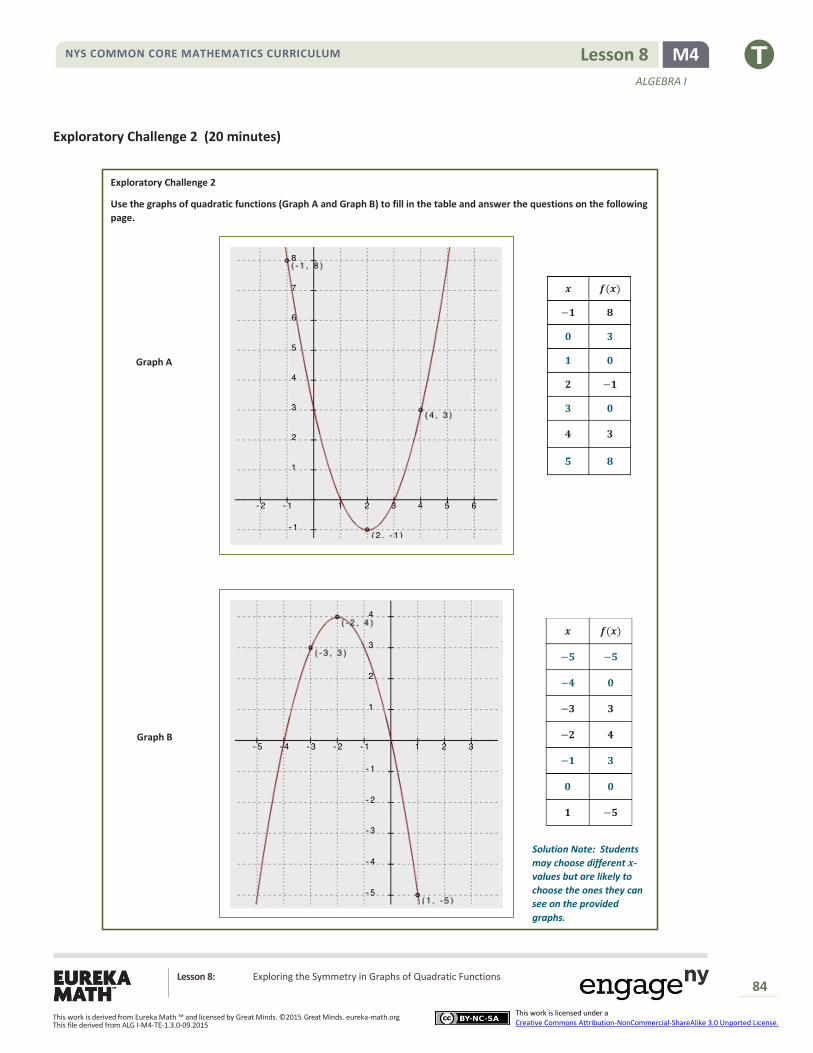
Exploratory Challenge 2 (20 minutes)
Exploratory Challenge 2
Use the graphs of quadratic functions (Graph A and Graph B) to fill in the table and answer the questions on the following
page.
𝒙 𝒇(𝒙)
−𝟓 −𝟓
−𝟒 𝟎
−𝟑 𝟑
−𝟐 𝟒
−𝟏 𝟑
𝟎 𝟎
𝟏 −𝟓
𝒙 𝒇(𝒙)
−𝟏 𝟖
𝟎 𝟑
𝟏 𝟎
𝟐 −𝟏
𝟑 𝟎
𝟒 𝟑
𝟓 𝟖
Graph A
Graph B
Solution Note: Students
may choose different 𝒙-
values but are likely to
choose the ones they can
see on the provided
graphs.
NYS COMMON CORE MATHEMATICS CURRICULUM M4 Lesson 8
ALGEBRA I
Lesson 8: Exploring the Symmetry in Graphs of Quadratic Functions
85
This work is derived from Eureka Math ™ and licensed by Great Minds. ©2015 Great Minds. eureka-math.org This file derived from ALG I-M4-TE-1.3.0-09.2015
This work is licensed under a Creative Commons Attribution-NonCommercial-ShareAlike 3.0 Unported License.
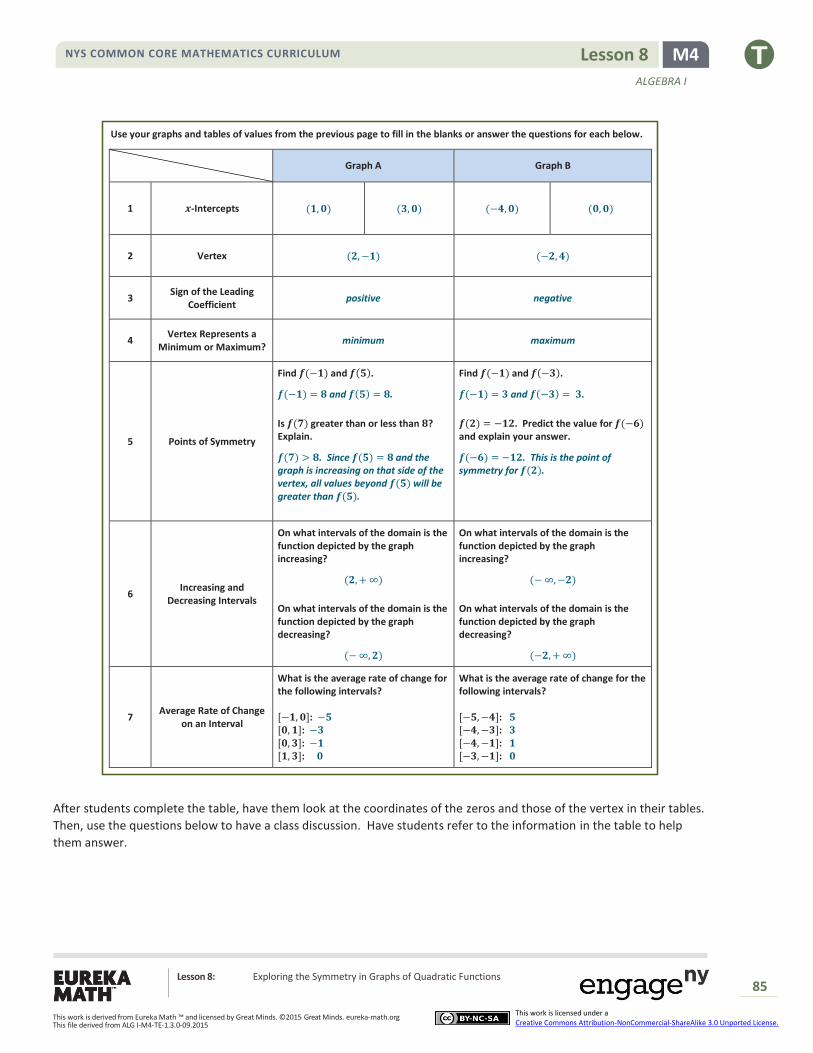
Use your graphs and tables of values from the previous page to fill in the blanks or answer the questions for each below.
Graph A Graph B
1 𝒙-Intercepts (𝟏, 𝟎) (𝟑, 𝟎) (−𝟒, 𝟎) (𝟎, 𝟎)
2 Vertex (𝟐, −𝟏) (−𝟐, 𝟒)
3 Sign of the Leading
Coefficient positive negative
4 Vertex Represents a
Minimum or Maximum? minimum maximum
5 Points of Symmetry
Find 𝒇(−𝟏) and 𝒇(𝟓).
𝒇(−𝟏) = 𝟖 and 𝒇(𝟓) = 𝟖.
Is 𝒇(𝟕) greater than or less than 𝟖? Explain.
𝒇(𝟕) > 𝟖. Since 𝒇(𝟓) = 𝟖 and the graph is increasing on that side of the vertex, all values beyond 𝒇(𝟓) will be greater than 𝒇(𝟓).
Find 𝒇(−𝟏) and 𝒇(−𝟑).
𝒇(−𝟏) = 𝟑 and 𝒇(−𝟑) = 𝟑.
𝒇(𝟐) = −𝟏𝟐. Predict the value for 𝒇(−𝟔) and explain your answer.
𝒇(−𝟔) = −𝟏𝟐. This is the point of symmetry for 𝒇(𝟐).
6 Increasing and
Decreasing Intervals
On what intervals of the domain is the function depicted by the graph increasing?
(𝟐, + ∞)
On what intervals of the domain is the function depicted by the graph decreasing?
(− ∞, 𝟐)
On what intervals of the domain is the function depicted by the graph increasing?
(− ∞, −𝟐)
On what intervals of the domain is the function depicted by the graph decreasing?
(−𝟐, + ∞)
7 Average Rate of Change
on an Interval
What is the average rate of change for the following intervals? [−𝟏, 𝟎]: −𝟓 [𝟎, 𝟏]: −𝟑 [𝟎, 𝟑]: −𝟏 [𝟏, 𝟑]: 𝟎
What is the average rate of change for the following intervals? [−𝟓, −𝟒]: 𝟓 [−𝟒, −𝟑]: 𝟑 [−𝟒, −𝟏]: 𝟏 [−𝟑, −𝟏]: 𝟎
After students complete the table, have them look at the coordinates of the zeros and those of the vertex in their tables.
Then, use the questions below to have a class discussion. Have students refer to the information in the table to help
them answer.
NYS COMMON CORE MATHEMATICS CURRICULUM M4 Lesson 8
ALGEBRA I
Lesson 8: Exploring the Symmetry in Graphs of Quadratic Functions
86
This work is derived from Eureka Math ™ and licensed by Great Minds. ©2015 Great Minds. eureka-math.org This file derived from ALG I-M4-TE-1.3.0-09.2015
This work is licensed under a Creative Commons Attribution-NonCommercial-ShareAlike 3.0 Unported License.
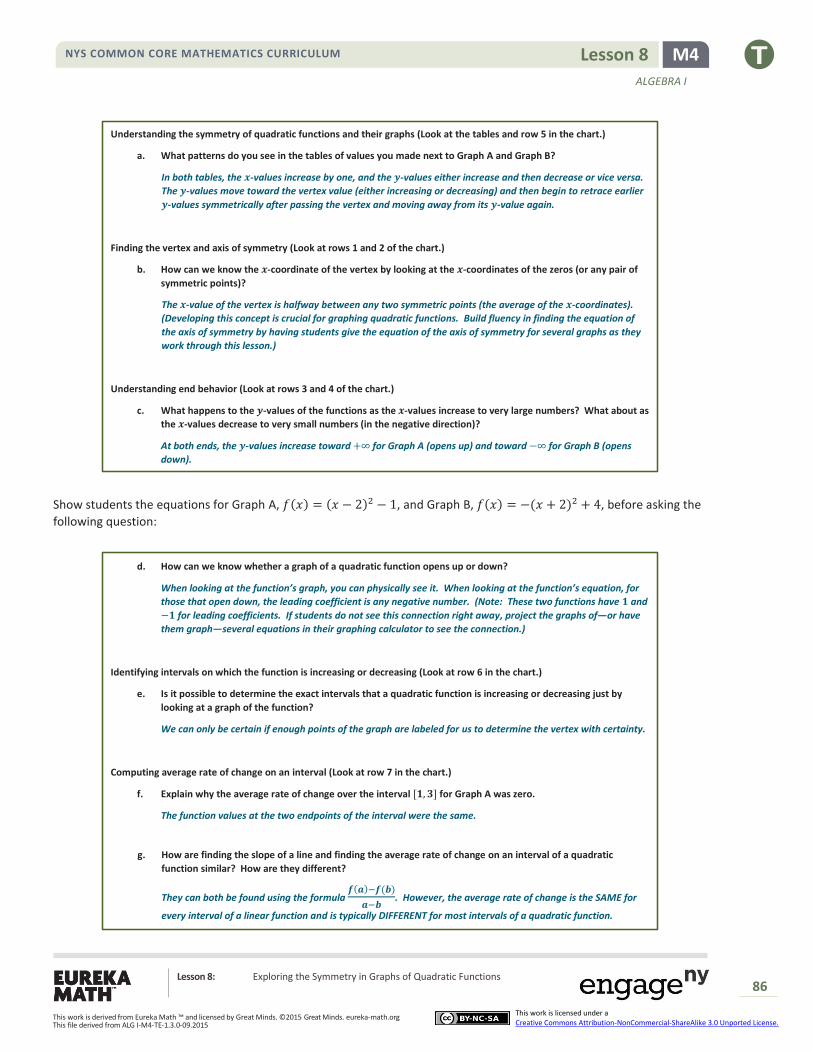
Understanding the symmetry of quadratic functions and their graphs (Look at the tables and row 5 in the chart.)
a. What patterns do you see in the tables of values you made next to Graph A and Graph B?
In both tables, the 𝒙-values increase by one, and the 𝒚-values either increase and then decrease or vice versa.
The 𝒚-values move toward the vertex value (either increasing or decreasing) and then begin to retrace earlier
𝒚-values symmetrically after passing the vertex and moving away from its 𝒚-value again.
Finding the vertex and axis of symmetry (Look at rows 1 and 2 of the chart.)
b. How can we know the 𝒙-coordinate of the vertex by looking at the 𝒙-coordinates of the zeros (or any pair of
symmetric points)?
The 𝒙-value of the vertex is halfway between any two symmetric points (the average of the 𝒙-coordinates).
(Developing this concept is crucial for graphing quadratic functions. Build fluency in finding the equation of
the axis of symmetry by having students give the equation of the axis of symmetry for several graphs as they
work through this lesson.)
Understanding end behavior (Look at rows 3 and 4 of the chart.)
c. What happens to the 𝒚-values of the functions as the 𝒙-values increase to very large numbers? What about as
the 𝒙-values decrease to very small numbers (in the negative direction)?
At both ends, the 𝒚-values increase toward +∞ for Graph A (opens up) and toward −∞ for Graph B (opens
down).
Show students the equations for Graph A, 𝑓(𝑥) = (𝑥 − 2)2 − 1, and Graph B, 𝑓(𝑥) = −(𝑥 + 2)2 + 4, before asking the
following question:
d. How can we know whether a graph of a quadratic function opens up or down?
When looking at the function’s graph, you can physically see it. When looking at the function’s equation, for
those that open down, the leading coefficient is any negative number. (Note: These two functions have 𝟏 and
−𝟏 for leading coefficients. If students do not see this connection right away, project the graphs of—or have
them graph—several equations in their graphing calculator to see the connection.)
Identifying intervals on which the function is increasing or decreasing (Look at row 6 in the chart.)
e. Is it possible to determine the exact intervals that a quadratic function is increasing or decreasing just by
looking at a graph of the function?
We can only be certain if enough points of the graph are labeled for us to determine the vertex with certainty.
Computing average rate of change on an interval (Look at row 7 in the chart.)
f. Explain why the average rate of change over the interval [𝟏, 𝟑] for Graph A was zero.
The function values at the two endpoints of the interval were the same.
g. How are finding the slope of a line and finding the average rate of change on an interval of a quadratic
function similar? How are they different?
They can both be found using the formula 𝒇(𝒂)−𝒇(𝒃)
𝒂−𝒃. However, the average rate of change is the SAME for
every interval of a linear function and is typically DIFFERENT for most intervals of a quadratic function.
NYS COMMON CORE MATHEMATICS CURRICULUM M4 Lesson 8
ALGEBRA I
Lesson 8: Exploring the Symmetry in Graphs of Quadratic Functions
87
This work is derived from Eureka Math ™ and licensed by Great Minds. ©2015 Great Minds. eureka-math.org This file derived from ALG I-M4-TE-1.3.0-09.2015
This work is licensed under a Creative Commons Attribution-NonCommercial-ShareAlike 3.0 Unported License.
Extension Question:
One has to look very hard to find two intervals on the graph of a quadratic function with the same average rate
of range. Can you find some?
For Graph A, an example is [1, 3] and [0, 4]; both have an average rate of change of 0. For Graph B, an
example is [−2, 1] and [−1, 0]; both have an average rate of change of −3.
Point out that intervals having infinity for an end-point need a parenthesis (not a closed bracket) on that side. Remind
students of the closed and open holes they used for one-variable graphs in Module 1. Have them think about how you
could close the hole on infinity when it is not a distinct value but always just out of reach. Also, point out that the rate of
change at 𝑥 = 2 is neither negative nor positive but is, in fact, zero.
Finding a unique quadratic function:
h. Can you graph a quadratic function if you don’t know the vertex? Can you graph a quadratic function if you
only know the 𝒙-intercepts?
Students are likely to intuit that they need more than just a vertex but may not see that the 𝒙-intercepts are
not quite enough. If they do not, move to the next question.
i. Remember that we need to know at least two points to define a unique line. Can you identify a unique
quadratic function with just two points? Explain.
No, there are many different quadratic functions whose graphs pass through any two given points. (If
students think they CAN define a unique quadratic function, try giving the class two symmetry points, for
example the 𝒙-intercepts, and have each student draw a graph of the quadratic function that passes through
those zeros. When they compare with each other, they should find that almost every student in the class
found a different graph.)
j. What is the minimum number of points needed to identify a unique quadratic function? Explain why.
With three distinct points that are not collinear, you can identify the unique quadratic function that passes
through all three. (At this stage, students might have trouble writing the equation from just any three points.)
Exploratory Challenge 3 (10 minutes)
Present to students the following graph, table, and questions in their student materials. Have them work with a partner
or small group to complete the graph, fill in some values in the table, and then answer the questions. After students
have completed the questions, ask the questions aloud to see if students agree about the answers.
NYS COMMON CORE MATHEMATICS CURRICULUM M4 Lesson 8
ALGEBRA I
Lesson 8: Exploring the Symmetry in Graphs of Quadratic Functions
88
This work is derived from Eureka Math ™ and licensed by Great Minds. ©2015 Great Minds. eureka-math.org This file derived from ALG I-M4-TE-1.3.0-09.2015
This work is licensed under a Creative Commons Attribution-NonCommercial-ShareAlike 3.0 Unported License.
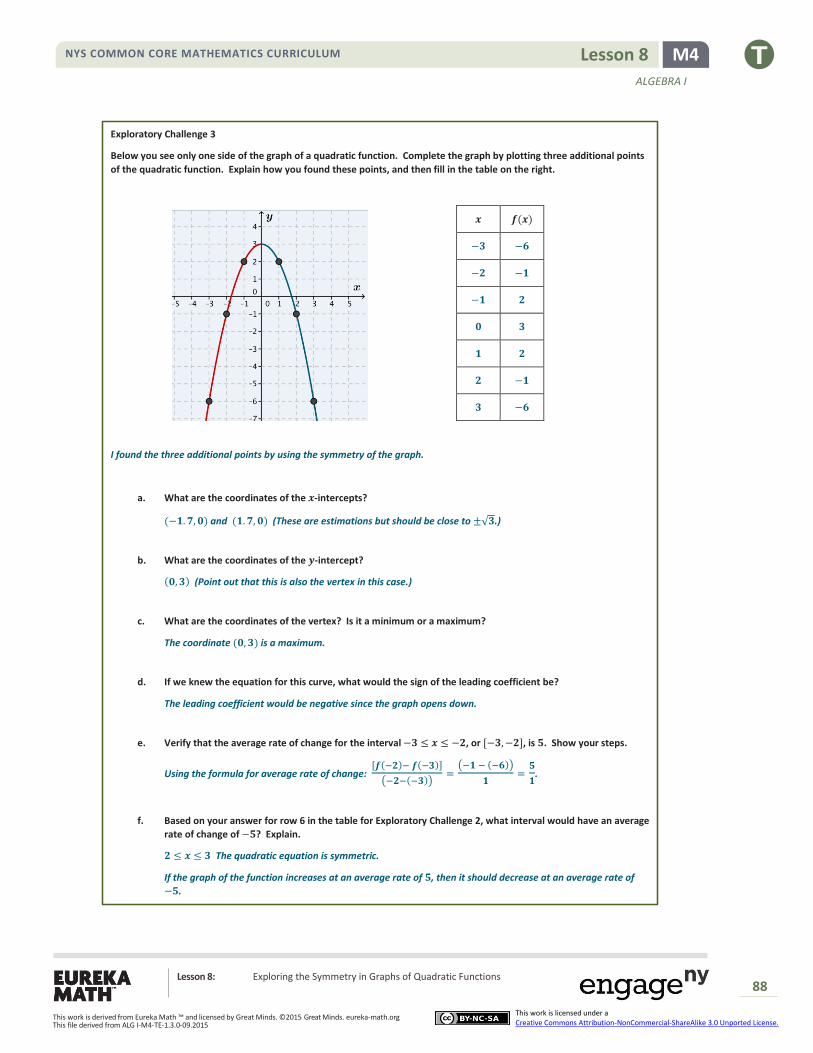
Exploratory Challenge 3
Below you see only one side of the graph of a quadratic function. Complete the graph by plotting three additional points
of the quadratic function. Explain how you found these points, and then fill in the table on the right.
I found the three additional points by using the symmetry of the graph.
a. What are the coordinates of the 𝒙-intercepts?
(−𝟏. 𝟕, 𝟎) and (𝟏. 𝟕, 𝟎) (These are estimations but should be close to ±√𝟑.)
b. What are the coordinates of the 𝒚-intercept?
(𝟎, 𝟑) (Point out that this is also the vertex in this case.)
c. What are the coordinates of the vertex? Is it a minimum or a maximum?
The coordinate (𝟎, 𝟑) is a maximum.
d. If we knew the equation for this curve, what would the sign of the leading coefficient be?
The leading coefficient would be negative since the graph opens down.
e. Verify that the average rate of change for the interval −𝟑 ≤ 𝒙 ≤ −𝟐, or [−𝟑, −𝟐], is 𝟓. Show your steps.
Using the formula for average rate of change: [𝒇(−𝟐)− 𝒇(−𝟑)]
(−𝟐−(−𝟑))=
(−𝟏 − (−𝟔))
𝟏=
𝟓
𝟏.
f. Based on your answer for row 6 in the table for Exploratory Challenge 2, what interval would have an average
rate of change of −𝟓? Explain.
𝟐 ≤ 𝒙 ≤ 𝟑 The quadratic equation is symmetric.
If the graph of the function increases at an average rate of 𝟓, then it should decrease at an average rate of
−𝟓.
𝒙 𝒇(𝒙)
−𝟑 −𝟔
−𝟐 −𝟏
−𝟏 𝟐
𝟎 𝟑
𝟏 𝟐
𝟐 −𝟏
𝟑 −𝟔
NYS COMMON CORE MATHEMATICS CURRICULUM M4 Lesson 8
ALGEBRA I
Lesson 8: Exploring the Symmetry in Graphs of Quadratic Functions
89
This work is derived from Eureka Math ™ and licensed by Great Minds. ©2015 Great Minds. eureka-math.org This file derived from ALG I-M4-TE-1.3.0-09.2015
This work is licensed under a Creative Commons Attribution-NonCommercial-ShareAlike 3.0 Unported License.
Closing (2 minutes)
The graphs of quadratic functions have a unique symmetrical nature with a maximum or minimum function
value corresponding to the vertex.
When the leading coefficient of the quadratic expression representing the function is negative, the graph
opens down, and when positive, it opens up.
Exit Ticket (4 minutes)
Lesson Summary
Quadratic functions create a symmetrical curve with its highest (maximum) or lowest (minimum) point
corresponding to its vertex and an axis of symmetry passing through the vertex when graphed. The 𝒙-coordinate of
the vertex is the average of the 𝒙-coordinates of the zeros or any two symmetric points on the graph.
When the leading coefficient is a negative number, the graph opens down, and its end behavior is that both ends
move towards negative infinity. If the leading coefficient is positive, the graph opens up, and both ends move
towards positive infinity.
NYS COMMON CORE MATHEMATICS CURRICULUM M4 Lesson 8
ALGEBRA I
Lesson 8: Exploring the Symmetry in Graphs of Quadratic Functions
90
This work is derived from Eureka Math ™ and licensed by Great Minds. ©2015 Great Minds. eureka-math.org This file derived from ALG I-M4-TE-1.3.0-09.2015
This work is licensed under a Creative Commons Attribution-NonCommercial-ShareAlike 3.0 Unported License.
Name Date
Lesson 8: Exploring the Symmetry in Graphs of Quadratic Functions
Exit Ticket
1. If possible, find the equation for the axis of symmetry for the graph of a quadratic function with the given pair of
coordinates. If not possible, explain why.
a. (3, 10) (15, 10)
b. (−2, 6) (6,4)
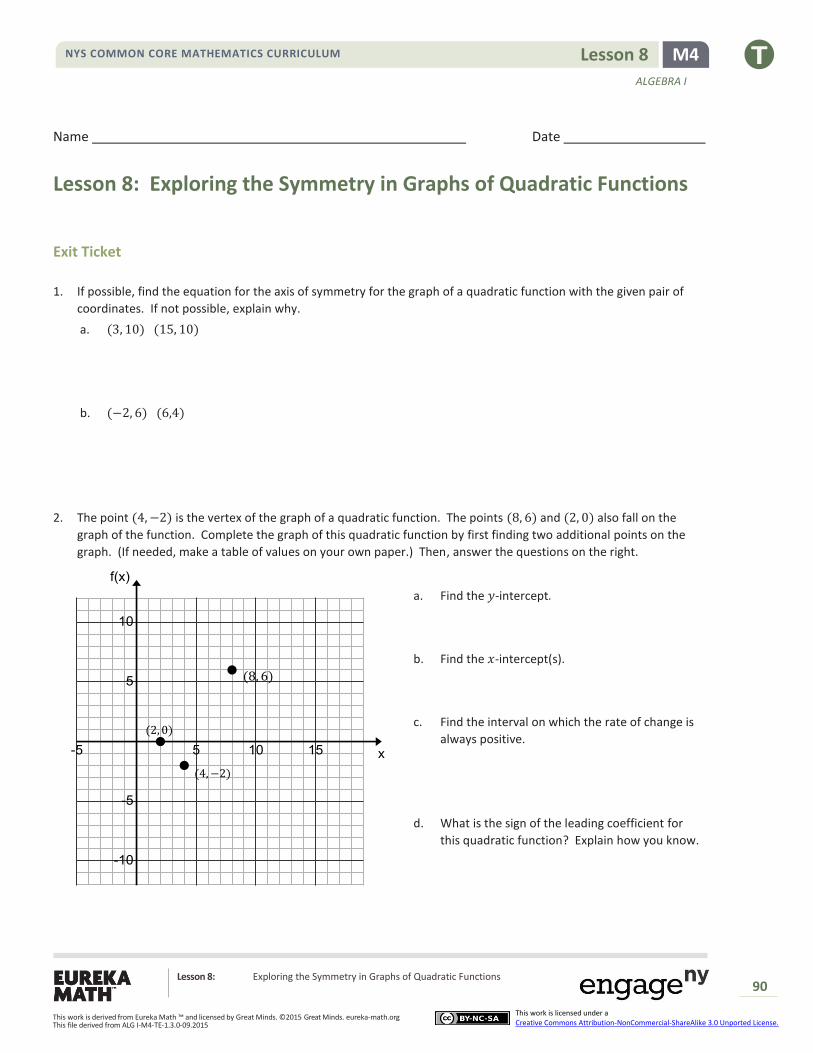
2. The point (4, −2) is the vertex of the graph of a quadratic function. The points (8, 6) and (2, 0) also fall on the
graph of the function. Complete the graph of this quadratic function by first finding two additional points on the
graph. (If needed, make a table of values on your own paper.) Then, answer the questions on the right.
a. Find the 𝑦-intercept.
b. Find the 𝑥-intercept(s).
c. Find the interval on which the rate of change is
always positive.
d. What is the sign of the leading coefficient for
this quadratic function? Explain how you know.
(4, −2)
(2, 0)
(8, 6)
NYS COMMON CORE MATHEMATICS CURRICULUM M4 Lesson 8
ALGEBRA I
Lesson 8: Exploring the Symmetry in Graphs of Quadratic Functions
91
This work is derived from Eureka Math ™ and licensed by Great Minds. ©2015 Great Minds. eureka-math.org This file derived from ALG I-M4-TE-1.3.0-09.2015
This work is licensed under a Creative Commons Attribution-NonCommercial-ShareAlike 3.0 Unported License.
Exit Ticket Sample Solutions
1. If possible, find the equation for the axis of symmetry for the graph of a quadratic function with the given pair of
coordinates. If not possible, explain why.
a. (𝟑, 𝟏𝟎) (𝟏𝟓, 𝟏𝟎)
Even though the coordinate values are not 𝒙-intercepts, students can use the symmetric nature of the function
to find that the equation of the axis of symmetry goes through the midpoint joining the two 𝒙-coordinates of
the symmetric points, or the average of the values of the two coordinates:
𝒙 =𝟑 + 𝟏𝟓
𝟐=
𝟏𝟖𝟐
= 𝟗. So, 𝒙 = 𝟗 is the equation for the axis of symmetry.
b. (−𝟐, 𝟔) (𝟔, 𝟒)
The given coordinates are not symmetric values; therefore, we cannot find the equation of the axis of
symmetry.
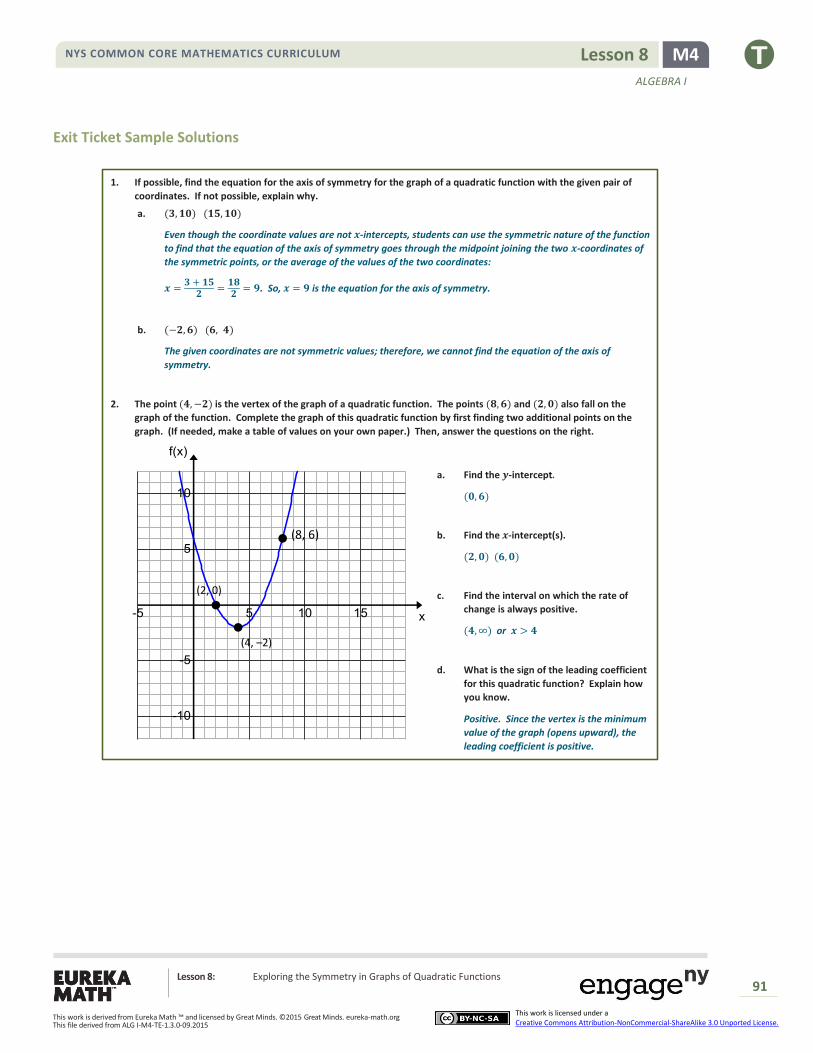
2. The point (𝟒, −𝟐) is the vertex of the graph of a quadratic function. The points (𝟖, 𝟔) and (𝟐, 𝟎) also fall on the
graph of the function. Complete the graph of this quadratic function by first finding two additional points on the
graph. (If needed, make a table of values on your own paper.) Then, answer the questions on the right.
(𝟎, 𝟔)
(𝟐, 𝟎) (𝟔, 𝟎)
a. Find the 𝒚-intercept.
b. Find the 𝒙-intercept(s).
c. Find the interval on which the rate of
change is always positive.
(𝟒, ∞) or 𝒙 > 𝟒
d. What is the sign of the leading coefficient
for this quadratic function? Explain how
you know.
Positive. Since the vertex is the minimum
value of the graph (opens upward), the
leading coefficient is positive.
(8, 6)
(4, –2)
(2, 0)
NYS COMMON CORE MATHEMATICS CURRICULUM M4 Lesson 8
ALGEBRA I
Lesson 8: Exploring the Symmetry in Graphs of Quadratic Functions
92
This work is derived from Eureka Math ™ and licensed by Great Minds. ©2015 Great Minds. eureka-math.org This file derived from ALG I-M4-TE-1.3.0-09.2015
This work is licensed under a Creative Commons Attribution-NonCommercial-ShareAlike 3.0 Unported License.
Problem Set Sample Solutions
1. Khaya stated that every 𝒚-value of the graph of a quadratic function has two different 𝒙-values. Do you agree or
disagree with Khaya? Explain your answer.
The graph of a quadratic function has two different 𝒙-values for each 𝒚-value except at the vertex where there is
only one.
2. Is it possible for the graphs of two different quadratic functions to each have 𝒙 = −𝟑 as its line of symmetry and
both have a maximum at 𝒚 = 𝟓? Explain and support your answer with a sketch of the graphs.
Students should sketch two graphs with vertex at (−𝟑, 𝟓) and different 𝒙-intercepts.
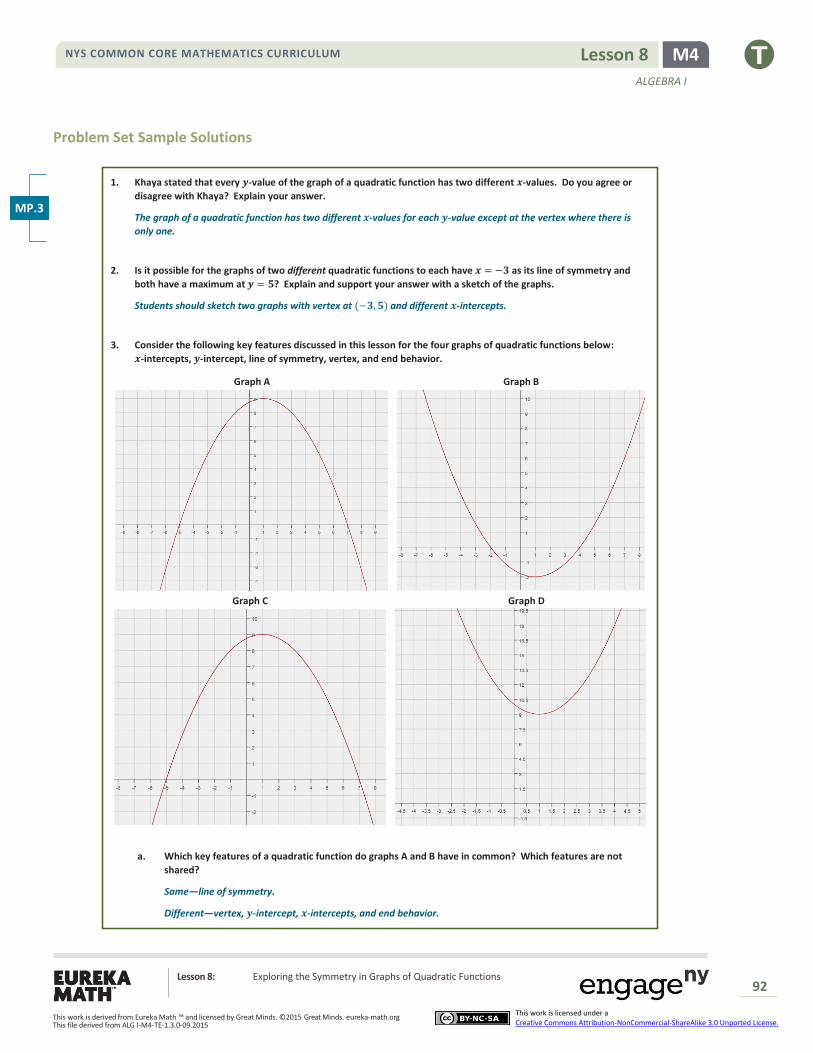
3. Consider the following key features discussed in this lesson for the four graphs of quadratic functions below:
𝒙-intercepts, 𝒚-intercept, line of symmetry, vertex, and end behavior.
a. Which key features of a quadratic function do graphs A and B have in common? Which features are not
shared?
Same—line of symmetry.
Different—vertex, 𝒚-intercept, 𝒙-intercepts, and end behavior.
MP.3
Graph A Graph B
Graph C Graph D
NYS COMMON CORE MATHEMATICS CURRICULUM M4 Lesson 8
ALGEBRA I
Lesson 8: Exploring the Symmetry in Graphs of Quadratic Functions
93
This work is derived from Eureka Math ™ and licensed by Great Minds. ©2015 Great Minds. eureka-math.org This file derived from ALG I-M4-TE-1.3.0-09.2015
This work is licensed under a Creative Commons Attribution-NonCommercial-ShareAlike 3.0 Unported License.
b. Compare graphs A and C, and explain the differences and similarities between their key features.
Same—line of symmetry, vertex, 𝒙-intercepts, 𝒚-intercept, and end behavior.
Different—none, Graphs A and C are the same. The images of the graphs are cropped differently, so it may
appear that the two are different.
c. Compare graphs A and D, and explain the differences and similarities between their key features.
Same—line of symmetry and vertex
Different—𝒙-intercepts (point out that Graph D does not have 𝒙-intercepts), 𝒚-intercept, and end behavior.
d. What do all four of the graphs have in common?
All four graphs have the same line of symmetry.
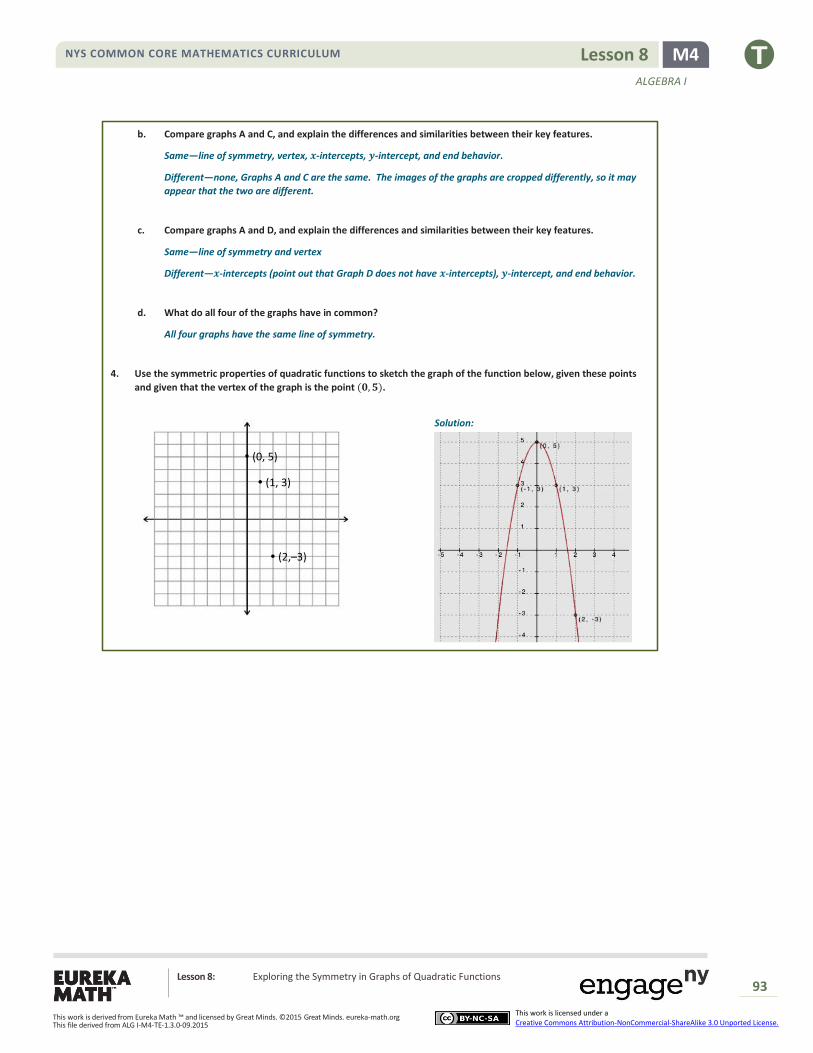
4. Use the symmetric properties of quadratic functions to sketch the graph of the function below, given these points
and given that the vertex of the graph is the point (𝟎, 𝟓).
(0, 5)
(2,–3)
(1, 3)
Solution: