Lesson 10-9 Inequalities Systems of
5
Lesson Systems of Inequalities 635 Lesson 10-9 Systems of Inequalities 10-9 In Lesson 6-9, you graphed linear inequalities like y < 11 and y ≥ 4x + 3 on a coordinate plane. These inequalities describe half- planes. In this lesson, you will see how to graph regions described by a system of two or more inequalities. Solving a system of inequalities involves finding the common solutions of two or more inequalities. Example 1 Graph all solutions to the system ⎧ ⎨ ⎩ x ≥ 0 y ≥ 0 . Solution First graph the solution to x ≥ 0. It is shown at the left below. Then graph the solution y ≥ 0, shown at the right below. y x y x The solution to the system is the set of points common to both of the sets above. At the right we show the solutions to the two inequalities superimposed. At the far right is the solution to the system. The solution is the intersection of the two solution sets above shown in green. It consists of the first quadrant and the nonnegative parts of the x- and y-axes. Recall that in general, the graph of Ax + By < C is a half-plane, and that it lies on one side of the boundar y line Ax + By = C. BIG IDEA The graph of the solutions to a system of linear inequalities is a region bounded by lines. y x y x Refer to the figure. Find c if a c b a. a = 75° and b = 40° b. a = 75° and b = 39° c. a = b Mental Math
Transcript of Lesson 10-9 Inequalities Systems of

Lesson
Systems of Inequalities 635
Lesson 10-9
Systems of
Inequalities10-9
In Lesson 6-9, you graphed linear inequalities like y < 11 and y ≥ 4x + 3 on a coordinate plane. These inequalities describe half-planes. In this lesson, you will see how to graph regions described by a system of two or more inequalities. Solving a system of inequalities involves fi nding the common solutions of two or more inequalities.
Example 1
Graph all solutions to the system ⎧
⎨
⎩ x ≥ 0
y ≥ 0
.
Solution First graph the solution to x ≥ 0. It is shown at the left below. Then graph the solution y ≥ 0, shown at the right below.
y
x
y
x
The solution to the system is the set of points common to both of the sets above. At the right we show the solutions to the two inequalities superimposed. At the far right is the solution to the system. The solution is the intersection of the two solution sets above shown in green. It consists of the fi rst quadrant and the nonnegative parts of the x- and y-axes.
Recall that in general, the graph of Ax + By < C is a half-plane, and that it lies on one side of the boundary line Ax + By = C.
BIG IDEA The graph of the solutions to a system of linear inequalities is a region bounded by lines.
y
x
y
x
Refer to the fi gure.
Find c if
a c
b
a. a = 75° and b = 40°
b. a = 75° and b = 39°c. a = b
Mental Math
SMP08ALG_NA_SE2_C10_L09.indd 635SMP08ALG_NA_SE2_C10_L09.indd 635 6/4/07 3:17:46 PM6/4/07 3:17:46 PM
636 Linear Systems
Example 2
Graph all solutions to the system ⎧ � ⎨
� ⎩
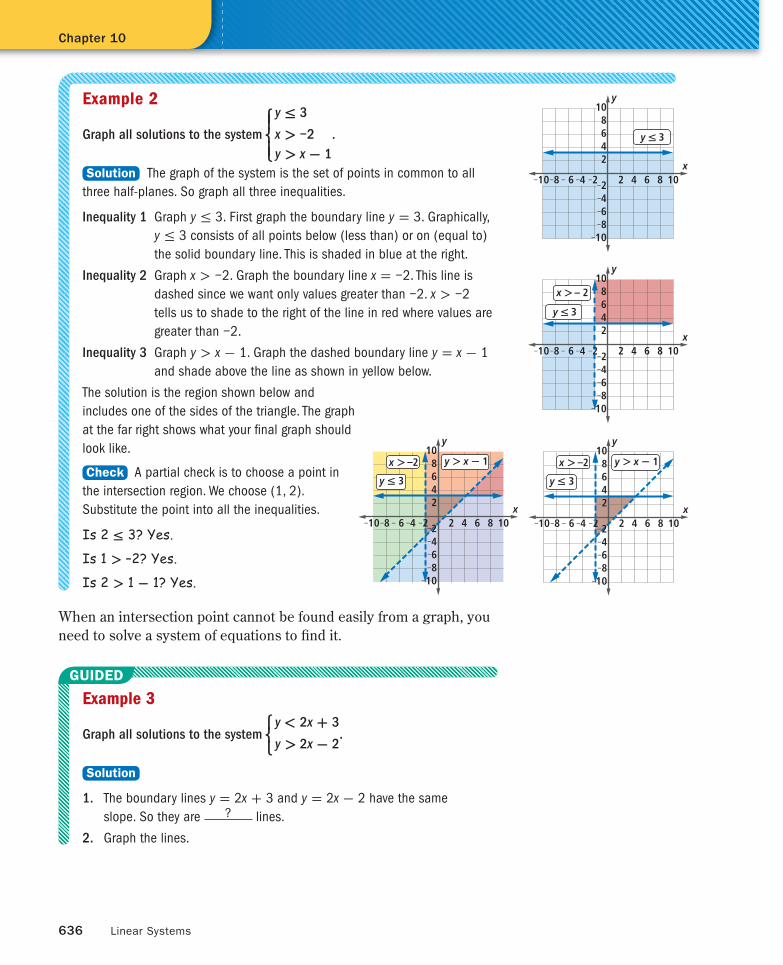
y ≤ 3
x > −2
y > x - 1
.
Solution The graph of the system is the set of points in common to all three half-planes. So graph all three inequalities.
Inequality 1 Graph y ≤ 3. First graph the boundary line y = 3. Graphically, y ≤ 3 consists of all points below (less than) or on (equal to) the solid boundary line. This is shaded in blue at the right.
Inequality 2 Graph x > −2. Graph the boundary line x = −2. This line is dashed since we want only values greater than −2. x > −2 tells us to shade to the right of the line in red where values are greater than −2.
Inequality 3 Graph y > x - 1. Graph the dashed boundary line y = x - 1 and shade above the line as shown in yellow below.
The solution is the region shown below and includes one of the sides of the triangle. The graph at the far right shows what your fi nal graph should look like.
Check A partial check is to choose a point in the intersection region. We choose (1, 2). Substitute the point into all the inequalities.
Is 2 ≤ 3? Yes.
Is 1 > –2? Yes.
Is 2 > 1 - 1? Yes.
When an intersection point cannot be found easily from a graph, you need to solve a system of equations to fi nd it.
Example 3
Graph all solutions to the system ⎧ ⎨
⎩ y < 2x + 3
y > 2x - 2
.
Solution
1. The boundary lines y = 2x + 3 and y = 2x - 2 have the same slope. So they are ? lines.
2. Graph the lines.
Chapter 10
GUIDED
2
42
68
10
468
10
10 8 6 4 2 2 4 6 8 10
y
x
y ≤ 3
2
42
68
10
468
10
10 8 6 4 2 2 4 6 8 10
y
x
y ≤ 3
x > – 2
y > x - 1x > –2
y ≤ 3
2
42
68
10
468
10
10 8 6 4 2 2 4 6 8 10
y
x
y > x - 1x > –2
y ≤ 3
2
42
68
10
468
10
10 8 6 4 2 2 4 6 8 10
y
x
SMP08ALG_NA_SE2_C10_L09.indd 636SMP08ALG_NA_SE2_C10_L09.indd 636 6/4/07 3:17:57 PM6/4/07 3:17:57 PM

Systems of Inequalities 637
3. The solutions to y < 2x + 3 comprise the half-plane ?
the boundary line. The solutions to y > 2x - 2 make up the
half-plane ? the line.
You saw in Lesson 10-6 that a system whose graph is made up of nonintersecting and parallel lines has no solutions. Is this necessarily true for a system of inequalities whose boundary lines are nonintersecting and parallel? Explain. ?
4. Graph the intersection of the two half-planes in Step 3.
Questions
COVERING THE IDEAS
1. The graph of all solutions to ⎧
⎨
⎩
x > 0
y < 0
consists of all points in which quadrant?
2. Graph the solutions to the system ⎧
⎨
⎩
x < 0
y > 0
.
3. Consider the system ⎧
⎨
⎩
y ≤ 4x + 1
y > 2x + 1
.
a. How is the graph of all solutions to the system related to the graphs of y ≤ 4x + 1 and y > 2x + 1?
b. Fill in the Blank The graph of y > 2x + 1 is a ? . c. Why does the graph of y ≤ 4x + 1 include its boundary line? d. Is (2, 5) a solution to this system? How can you tell?
In 4 and 5, graph the solution to the system.
4.
x > 0
y > 0
3x + y < 10
5.
x ≥ −3
y ≤ 4
y ≥ 2x + 1
6. Consider the system
x > 0 y > 0
x + y < 30
x + y > 20
.
a. The graph of all solutions to this system is the interior of a quadrilateral with what vertices?
b. Name two points that are solutions to the system. c. Is (9, 10) a solution to the system? Why or why not?
Lesson 10-9
⎧ �
�
⎨
� �
⎩
⎧
�
⎨
�
⎩
⎧
�
⎨
�
⎩
(above/below)
(above/below)
SMP08ALG_NA_SE2_C10_L09.indd 637SMP08ALG_NA_SE2_C10_L09.indd 637 6/4/07 3:18:07 PM6/4/07 3:18:07 PM

638 Linear Systems
7. The solution to a system of equations that involves different parallel lines is Ø (empty set). You saw in Example 3 this is not necessarily true of a system of inequalities that involves parallel lines. Is it possible to have a system of inequalities whose solution is Ø? Why or why not?
APPLYING THE MATHEMATICS
In 8 and 9, describe the shaded region with a system of inequalities.
8. y
x
2x - y = 10
9. y
x
3x + 7y = 10
10. Write the system of inequalities whose solution is the interior of the rectangle with vertices (−3, 10), (5, 10), (5, −1), and (−3, −1).
11. It takes Tippie about 10 minutes to type a letter of moderate length and about 8 minutes to type a normal double-spaced page.
a. Write a system of inequalities that describes the total number of letters L and pages P Tippie can type in an hour or less. Assume the number of letters typed is greater than or equal to zero, as is the number of pages.
b. Accurately graph the set of points that satisfi es the system.
12. An actress is paid $300 per day to understudy a part and $750 per day to perform the role before an audience. During one run, an actress earned between $4,000 and $7,000.
a. At most, how many times might she have performed the role? b. What is the maximum number of times she might have been
an understudy? c. Graph all possible ways she might have earned her salary.
13. A hockey team is scheduled to play 14 games during a season. Its coach estimates that it needs at least 20 points to make the playoffs. A win is worth 2 points and a tie is worth 1 point.
a. Make a graph of all the combinations of wins w and ties t that will get the team into the playoffs.
b. How many ways are there for the team to make the playoffs?
Chapter 10
Actors’ Equity Association,
founded in 1913, is the labor
union that represents more
than 45,000 actors and
stage managers in the
United States.
Source: Actors’ Equity Association
SMP08ALG_NA_SE2_C10_L09.indd 638SMP08ALG_NA_SE2_C10_L09.indd 638 6/4/07 3:18:16 PM6/4/07 3:18:16 PM
Systems of Inequalities 639
REVIEW
In 14 and 15, a system of equations is given.
a. Write the system in matrix form.
b. Use technology to fi nd the inverse of the coeffi cient matrix.
c. Solve the system. (Lesson 10-8)
14. ⎧
⎨
⎩
y = 3x - 8
4x + 4y = 12
15. ⎧
⎨
⎩
6x + 4y = 14
−2x - 3y = −18
16. Let � be the line with equation y = −4x + 9. Write an equation of a line that (Lesson 10-6)
a. coincides with �. b. does not intersect �.
17. Solve the system ⎧
⎨
⎩
2.5x + y = 6
9x + 4y = 17.5
using any method.
(Lessons 10-5, 10-4, 10-2, 10-1)
In 18–20, use the formula h = −16t2 + 94t + 2 for the height h in
feet of a model rocket t seconds after being fi red straight up from a
stand 2 feet off the ground. (Lessons 9-5, 9-4, 9-3)
18. a. Graph the equation. b. Use the graph to fi nd the maximum height of the
rocket.
19. a. Find the height of the rocket after 6 seconds. b. Interpret your answer to Part a.
20. Use the Quadratic Formula to calculate at what time(s) the rocket is at a height of 100 feet.
EXPLORATION
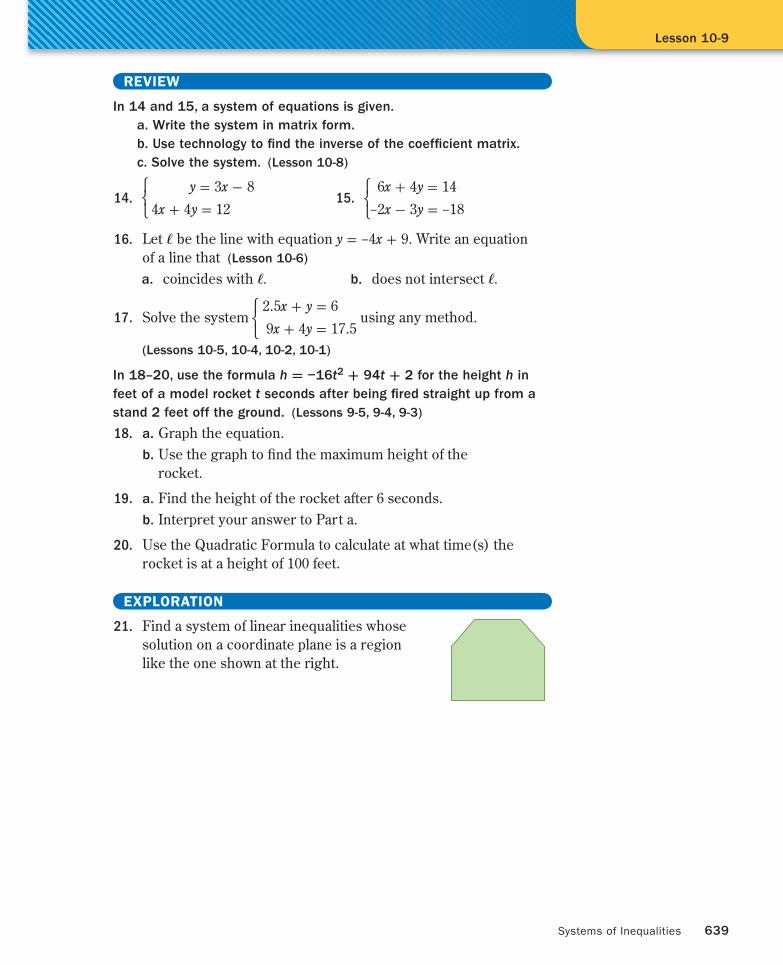
21. Find a system of linear inequalities whose solution on a coordinate plane is a region like the one shown at the right.
Lesson 10-9
SMP08ALG_NA_SE2_C10_L09.indd 639SMP08ALG_NA_SE2_C10_L09.indd 639 6/4/07 3:18:28 PM6/4/07 3:18:28 PM