Leonie Haimson, Class Size Matters District 2 Community Education Council January 20, 2015 HOW...
22
Leonie Haimson, Class Size Matters District 2 Community Education Council January 20, 2015 HOW DOE’S CAPITAL PLAN WILL LEAD TO WORSE OVERCROWDING & LARGER CLASSES IN D2
-
Upload
paulina-mitchell -
Category
Documents
-
view
213 -
download
0
Transcript of Leonie Haimson, Class Size Matters District 2 Community Education Council January 20, 2015 HOW...

Leonie Haimson, Class Size Matters
District 2 Community Education Council
January 20, 2015
HOW DOE’S CAPITAL PLAN WILL LEAD TO WORSE OVERCROWDING & LARGER CLASSES
IN D2

Capital plan has only 1/3 of seats in D2 just to address future enrollment K-8 – nothing to alleviate current overcrowding
*Does not include 4,900 seat as yet unsited and undetermined location and/or grade level seats**Estimated Total Added Enrollment= Averaged DOE Enrollment Projections + Housing Starts Estimated Growth
0
1,000
2,000
3,000
4,000
5,000
6,000
7,000
8,000
9,000
3,190
4,194
2,977
4,840
8,426

Manhattan HS Enrollment Projections of 2,862 but NO seats in Capital Plan to address need
Man
hatta
n HS N
ew S
eats
from
Cap
ital P
lan F
Y 201
5-20
19*
Enroll
men
t Pro
jectio
ns, S
tatis
tical
Forec
astin
g 20
11-2
021
Enroll
men
t Pro
jectio
ns, G
rier P
artn
ersh
ip 20
11-2
021
Housin
g Sta
rts, E
stim
ated
Gro
wth 2
012-
2021
Estim
ated
Tot
al Add
ed E
nroll
men
t 201
2-20
21**
0
500
1,000
1,500
2,000
2,500
3,000
3,500
0
796
7
2,460
2,862
*Does not include 4,900 seat as yet unsited and undetermined location and/or grade level seats**Estimated Total Added Enrollment= Averaged DOE Enrollment Projections + Housing Starts Estimated Growth

Citywide capital plan has 1/3 seats needed just to address projected K-8 Enrollment increases
*Statistical Forecasting does not include D75 students; K-8 Seats in Capital Plan are categorized as Small PS and PS/IS and includes 4,900 seats for class size reduction if Bond issue passes.
Source for Housing Starts: NYSCA Projected New Housing Starts 2012-2021, http://www.nycsca.org/Community/CapitalPlanManagementReportsData/Housing/2012-21HousingWebChart.pdf; Projected public school ratio, https://data.cityofnewyork.us/Education/Projected-Public-School-Ratio/n7ta-pz8k
0
10,000
20,000
30,000
40,000
50,000
60,000
70,000
80,000
90,000
29,482
40,589
51,954
38,244
84,516
*Does not include 4,900 seat as yet unsited and undetermined location and/or grade level seats**Estimated Total Added Enrollment= Averaged DOE Enrollment Projections + Housing Starts Estimated Growth

Citywide capital plan has one tenth of seats needed just to address projected HS enrollment increases citywide
*Statistical Forecasting does not include D75 students; HS Seats in Capital Plan are categorized as IS/HS and does not include seats for class size reduction
Source for Housing Starts: NYSCA Projected New Housing Starts 2012-2021, http://www.nycsca.org/Community/CapitalPlanManagementReportsData/Housing/2012-21HousingWebChart.pdf; Projected public school ratio, https://data.cityofnewyork.us/Education/Projected-Public-School-Ratio/n7ta-pz8k
0
5,000
10,000
15,000
20,000
25,000
30,000
35,000
3,147
19,46118,387
13,483
32,407
*Does not include 4,900 seat as yet unsited and undetermined location and/or grade level seats**Estimated Total Added Enrollment= Averaged DOE Enrollment Projections + Housing Starts Estimated Growth

This doesn’t include at least 32,000 seats currently needed to bring down to 100% in districts averaging over 100%
*These figures are the difference between capacity & enrollment in the organizational target # in 2013-2014 Blue Book
Source: 2013-2014 DOE “Blue Book”
D8 D10 D11 D15 D20 D22 D24 D25 D26 D27 D28 D30 D310
1,000
2,000
3,000
4,000
5,000
6,000
131
3,124
1,966 1,970
4,553
464
5,277
1,9691,678
1,307
864610
1,114
# of Seats Needed in all districts with ES building utilization rates
higher than 100%
Queens HS Staten Island HS0
1,000
2,000
3,000
4,000
5,000
6,000
7,0006274
761
# of Seats Needed in all dis-tricts with building utiliza-tion rates higher than 100%
at HS level

D2 building utilization compared to citywide average
*Calculated by dividing building enrollment by the target capacity
Source: 2013-2014 DOE Blue Book
District 2 Elementary Schools
Citywide Elementary Schools
District 2 Middle Schools
Citywide Middle Schools
Manhattan High Schools
Citywide High Schools
0%
20%
40%
60%
80%
100%
120%
93.4%97.5%
70.4%
81.1%
89.3%92.5%
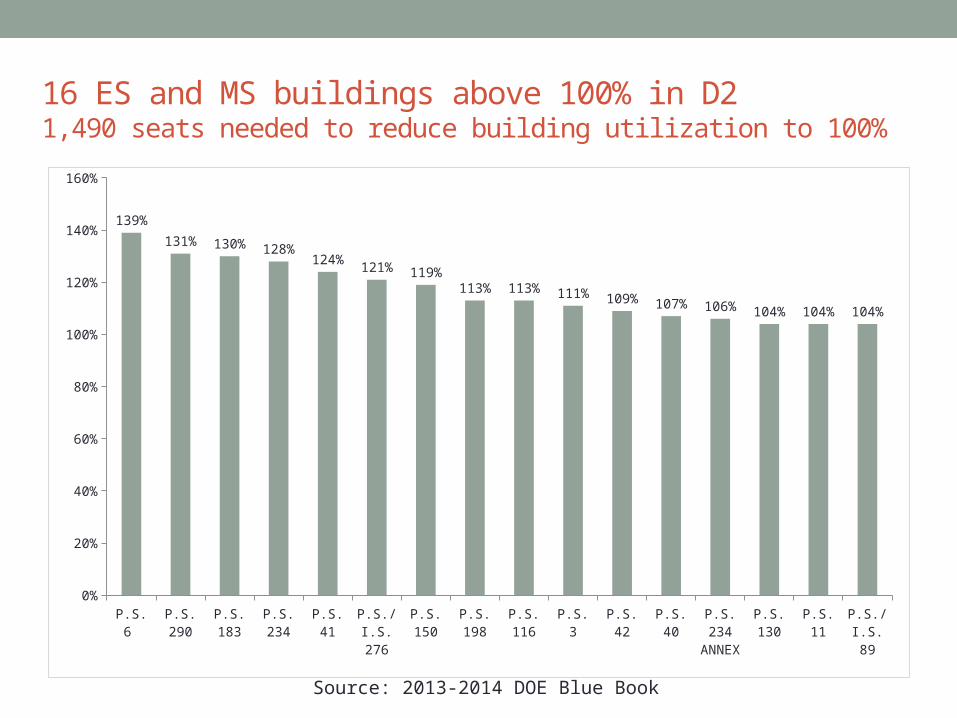
16 ES and MS buildings above 100% in D21,490 seats needed to reduce building utilization to 100%
Source: 2013-2014 DOE Blue Book
P.S. 6 P.S. 290
P.S. 183
P.S. 234
P.S. 41 P.S./I.S. 276
P.S. 150
P.S. 198
P.S. 116
P.S. 3 P.S. 42 P.S. 40 P.S. 234
ANNEX
P.S. 130
P.S. 11 P.S./I.S. 89
0%
20%
40%
60%
80%
100%
120%
140%
160%
139%
131% 130% 128%124%
121% 119%113% 113% 111% 109% 107% 106% 104% 104% 104%
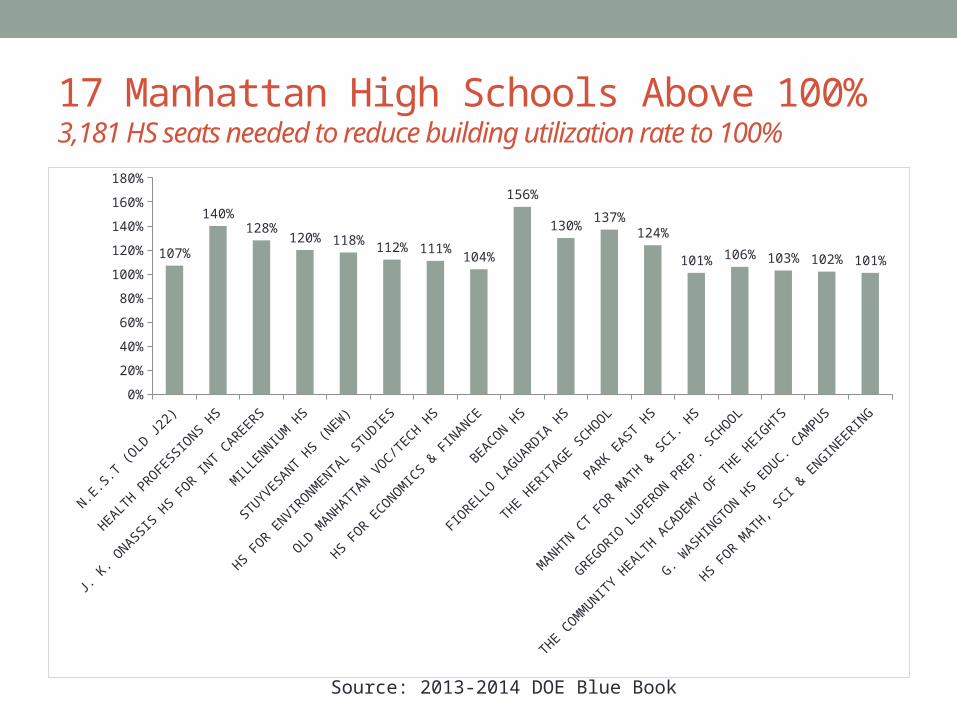
17 Manhattan High Schools Above 100% 3,181 HS seats needed to reduce building utilization rate to 100%
Source: 2013-2014 DOE Blue Book
N.E.S
.T (O
LD J
22)
HEALTH P
ROFESSIONS H
S
J. K
. ONASSIS
HS F
OR INT C
AREERS
MIL
LENNIU
M H
S
STUYVESANT HS (N
EW)
HS FOR E
NVIRONM
ENTAL STUDIE
S
OLD M
ANHATTAN VOC/T
ECH HS
HS FOR E
CONOMIC
S & F
INANCE
BEACON HS
FIORELL
O LAGUARDIA
HS
THE HERIT
AGE SCHOOL
PARK EAST H
S
MANHTN C
T FOR M
ATH & S
CI. HS
GREGORIO L
UPERON PREP. S
CHOOL
THE COM
MUNIT
Y HEALT
H ACADEM
Y OF T
HE HEIG
HTS
G. WASHIN
GTON HS E
DUC. CAM
PUS
HS FOR M
ATH, SCI &
ENGIN
EERING
0%
20%
40%
60%
80%
100%
120%
140%
160%
180%
107%
140%128%
120% 118% 112% 111%104%
156%
130%137%
124%
101% 106% 103% 102% 101%

These estimates Do NOT include the following:
• Does not include 4900 seats added last Feb still undetermined as to district and grade level.
• Does not include need to address neighborhood overcrowding;
• Does not include need to eliminate Kindergarten wait lists;
• Need to expand preK and reduce class size;
• Need to eliminate trailers;
• Need for schools to regain lost cluster rooms and/or space for students to receive their mandated services.

Reducing class size #1 priority of parents citywide and D2Data Source: 2014 NYC School Survey Results
Small
er c
lass
size
Mor
e pr
epar
ation
for s
tate
test
s
Mor
e ha
nds-
on le
arnin
g
Strong
er e
nrich
men
t pro
gram
s
Mor
e ef
fect
ive te
achin
g
Strong
er a
rts p
rogr
ams
Mor
e ef
fect
ive s
choo
l lead
ersh
ip
Mor
e rig
orou
s cu
rricu
lum
Bette
r com
mun
icatio
n with
par
ents
Less
pre
para
tion
for s
tate
test
s0%
5%
10%
15%
20%
25%23%
17%
15%
12%
9%8%
5%4% 4%
2%
23%
14%13%
13%
9% 9%
5%
8%
5%
4%
Citywide
D2

Class size trends this fall• This fall, class sizes overall increased an average .1
student per class citywide, according to the DOE.
• In K-3, class sizes decreased slightly citywide from 24.9 to 24.7 but at this rate would take 24 years to reach C4E goals of 20 students per class.
• In 4-8th grades, average dropped slightly from 26.8 to 26.7 & wd take 30 years to reach C4E goals 23 students per class.
• In HS, average increased from 26.7 to 26.8 students per class.

Class sizes in D2 have increased in grades K-3 by 12.7% since 2007
Data sources: DOE Class Size Reports 2006-2014, 2008 DOE Contracts for Excellence Approved Plan
2006-07 2007-8 2008-9 2009-10 2010-11 2011-12 2012-13 2013-14 2014-1519
20
21
22
23
24
25
26
2120.7
20.520.3
20.119.9 19.9 19.9 19.9
21 20.9
21.4
22.1
22.9
23.9
24.524.86
24.7029350468913
22 21.9
22.3
22.7 23.1
23.7
24.4
23.97
25.1451612903226
C4E goalsCitywide actualD2

D2’s class sizes in grades 4-8 have increased by 4.6% since 2009
Data sources: DOE Class Size Reports 2006-2014, 2008 DOE Contracts for Excellence Approved Plan
2006-07 2007-8 2008-9 2009-10 2010-11 2011-12 2012-13 2013-14 2014-1522
23
24
25
26
27
28
25.6
24.824.6
23.8
23.3
22.9 22.9 22.9 22.9
25.6
25.125.3
25.8
26.326.6 26.7 26.8
26.662623389660426.6
26
26.5
25.9 26
26.426.7
26.89
27.0130208333333
C4E targetCitywide actualD2

Class sizes city-wide increased in core HS classes this year and up 2.6% since 2007
*DOE’s class size data is unreliable & their methodology for calculating HS averages have changed year to year
Data sources: DOE Class Size Reports 2006-2014, 2008 DOE Contracts for Excellence Approved Plan
2007-08 2008-09 2009-10 2010-11 2011-12 2012-13 2013-14 2014-1524.0
24.5
25.0
25.5
26.0
26.5
27.0
26.126.2
26.626.5
26.426.3
26.726.8
26
25.7
25.2
24.8
24.5 24.5 24.5 24.5
Citywide ActualC4E Target

Examples of schools in D2 with large class sizes, K-3
Data source: November 2014 DOE Class Size Report
0
10
20
3032 32 31 30 29 29 28 28 28 27 27 27 26 26 26 26 26 26 25 25
D2 1st Grade
0
10
20
3032 32 31 31 31 31 30 29 29 29 29 28 28 27 27 26 26 26 26 25 25
D2 2nd Grade
0
10
20
3033323232323131303030292928282727272626262625
D2 3rd Grade
2224262830 28 28
2726 26 26 26 26 26
25 25 25 25 25 25
D2 Kindergarten
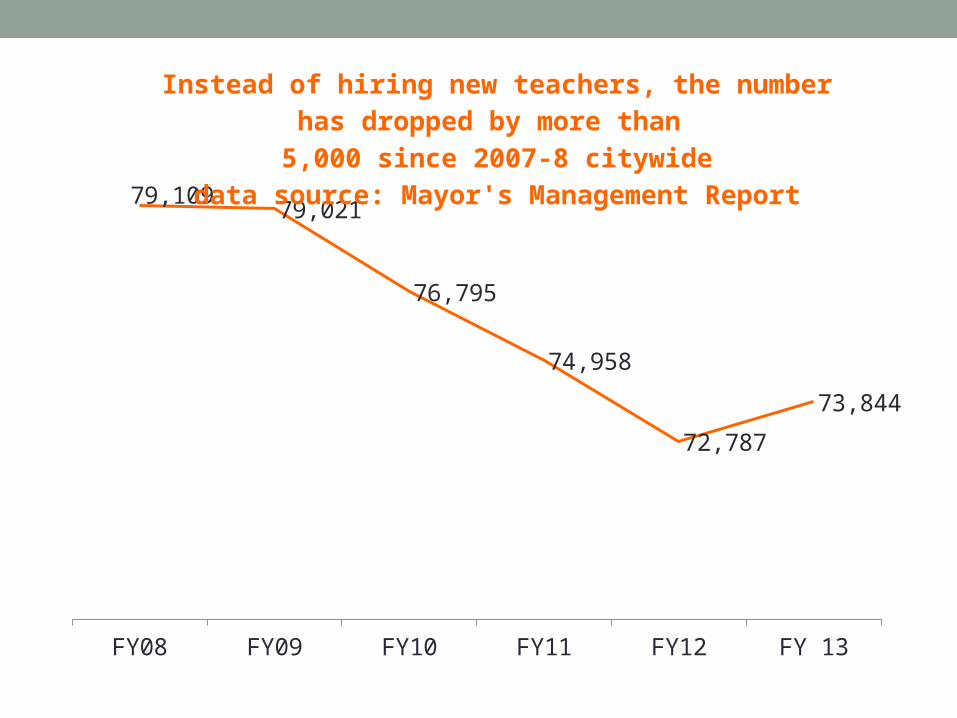
FY08 FY09 FY10 FY11 FY12 FY 13
79,10979,021
76,795
74,958
72,787
73,844
Instead of hiring new teachers, the number has dropped by more than
5,000 since 2007-8 citywidedata source: Mayor's Management Report

Other ways city has encouraged class size increases
• In 2010, the DOE eliminated the early grade class size reduction funding for K-3, despite promising to keep it as part of its C4E plan.
• In 2011, the DOE refused to comply with a side agreement with the UFT to cap class sizes at 28 in grades 1-3, leading to sharp increases in these grades to 30 or more.
• Co-locations have made overcrowding worse, and taken space that instead could have been used to reduce class size.
• When principals try to lower class size, particularly in middle or high schools, DOE often sends them more students.
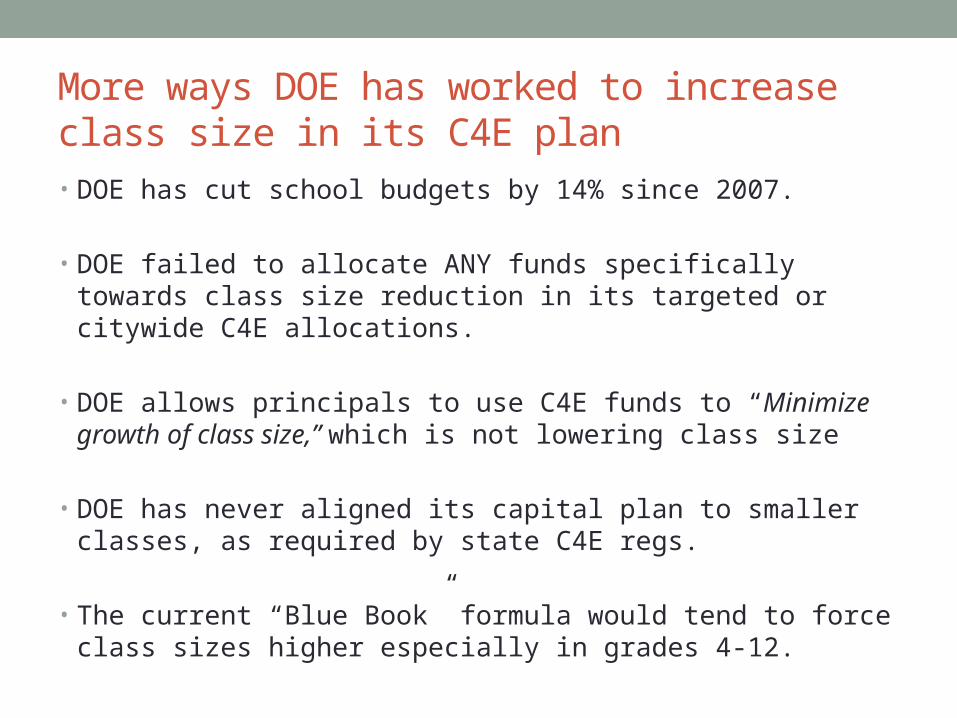
More ways DOE has worked to increase class size in its C4E plan• DOE has cut school budgets by 14% since 2007.
• DOE failed to allocate ANY funds specifically towards class size reduction in its targeted or citywide C4E allocations.
• DOE allows principals to use C4E funds to “Minimize growth of class size,” which is not lowering class size
• DOE has never aligned its capital plan to smaller classes, as required by state C4E regs.
• The current “Blue Book” formula would tend to force class sizes higher especially in grades 4-12.
Bill de Blasio promised to reduce class size while running for Mayor
• During his campaign, Mayor de Blasio promised if elected to abide by the city’s original class size plan approved by the state in 2007.
• The Mayor needs to deliver on his promise and provide what NYC parents want and their children need.
• He also needs to expand the capital plan to alleviate school overcrowding, end ALL co-locations, and build more schools!
• Will you help us by urging your Councilmembers to sign a letter for an expanded capital plan?
What can you do?• Urge Chancellor and your City Councilmembers to
expand capital plan.
• City Council votes on capital plan every June;
• This year they should refuse to do approve the capital plan until it is significantly approved.
• Will you help us urge them to do so?

Comparison of class sizes in Blue book compared to current averages & Contract for excellence goals
Grade levelsUFT Contract
class size limits
Target class sizes in "blue
book"
Current average
class sizes
C4E class Size goals
How many students allowed in 500 Sq ft
classroom according to NYC building code
Kindergarten 25 20 23 19.9 14
1st-3rd 32 20 25.5 19.9 254th-5th 32 28 26 22.9 25
6th-8th
30 (Title I)
33 (non-Title I)
28 27.4 22.9 25
HS (core classes) 34 30 26.7* 24.5 25
*DOE reported HS class sizes unreliable