Deutsche Lehrerfortbildungen und Schülerprogramme Jahresversammlung Deutsche Angestellte am CERN.
Upload
stanley-prestonCategory
view
215download
0
Leif Fagernäs:The Finnish Economic Situation and Challenges
Finnland-Österreich Wirtschaftsklub
Suomi-Itävalta Liikemiesklubi
Jahresversammlung
17.4.2007

17.4.2007 LF/mt
2
Main Economic Forecasts (ETLA)

17.4.2007 LF/mt
3

17.4.2007 LF/mt
4
GDP, index 1995 = 100
Source: OECD

17.4.2007 LF/mt
5
Industrial production, index 1990 = 100

17.4.2007 LF/mt
6
Productivity by Branch
100
150
200
250
300
350
400
450
500
550
600
650
700
750
1985 1987 1989 1991 1993 1995 1997 1999 2001 2003 2005
Electronics and Electrotechnics
Manufacturing
Total Economy
Private Services
Construction
Source: Statistics Finland
Labour productivity, index 1985 = 100

17.4.2007 LF/mt
7
Public Sector Balance, % of GDP

17.4.2007 LF/mt
8

17.4.2007 LF/mt
9
WEF Clobal Competitiveness Index 2006Finland´s ranking (out of 125) in various areas
0 5 10 15 20
Institutions
Higher education and training
Innovation
Health and primary education
Infrastructure
Business sophistication
Macroeconomy
Technological readiness
Market efficiency

17.4.2007 LF/mt
10
Source;: WEF

17.4.2007 LF/mt
11
Economic situation
• Short terms prospects good• Problems in making full use of growth opportunities
– Shortage of qualified labour– Slow growth of fixed investments
• Impediments to growth will increase in the near future– Ageing– Slower productivity growth– Increasing difficulties in raising employment– Strained public finances– Supply and price of energy
• Good short term prospects do not remove the need for structural reforms

17.4.2007 LF/mt
12
The Supply of Labour Decreases
30000
40000
50000
60000
70000
80000
90000
1990 1995 2000 2005 2010 2015 2020 2025 2030
Arrivals to the labour market
Departures from the labourmarket
Source: The Finnish Centre for Pensions

17.4.2007 LF/mt
13
0
50
100
150
200
250
1990 1992 1994 1996 1998 2000 2002 2004 2006e
ind
. 1
99
0=
10
0 DenmarkFinlandSwedenEuro areaUSA
Lähde: OECD Economic Outlook, No 77, 2005
Finland has not been an Attractive Investment TargetFixed Business Investment 1990 – 2006

17.4.2007 LF/mt
14
Stock of Direct Investments, EUR billion

17.4.2007 LF/mt
15
Consumer Prices

17.4.2007 LF/mt
16
Key factors for growth and competitive business environment -challenges of the new government
• Reduction of taxes to increase work and employment
• Strengthening of know-how and competencies
• Renewal of innovation policies
• More and successful entrepreneurs
• Functioning labour market
• Availability of energy at reasonable price and mitigating climate change

17.4.2007 LF/mt
17
Source: OECD

17.4.2007 LF/mt
18
Taxation
• Increase supply and demand of labour
• Lower income tax in all wage categories
• Reduction of highest marginal tax to 50 per cent
• Competitive corporate tax
• Equitable taxation of dividends
• Abolition of inheritance tax of corporate property

17.4.2007 LF/mt
19
International Tax Comparison 2005
31,5 %
37,8 %
47,5 %
33,4 %
40,3 %
24,7 %29,2 %
24,8 %
0 %
5 %
10 %
15 %
20 %
25 %
30 %
35 %
40 %
45 %
50 %
55 %
20000 30600 46600 100000€/v
Finland
Other EuropeanCountries
Income Tax Percentages in Finland and in
13 Other European Countries, Average
Single employee
Euroopan maat: Alankomaat, Belgia, Espanja, Iso-Britannia, Italia, Itävalta, Norja, Ranska, Ruotsi, Saksa, Sveitsi, Tanska ja Viro.

17.4.2007 LF/mt
20
0
1
2
3
4
5
0 10 20 30 40 50 60
USA
Japan
UK
Sweden
Norway
Germany
FranceTanska
Netherlands
Spain
Finland
Italy
Canada
Ireland
Share of High Technology of Exports, %
R&D-intensity, %
R&D Expenditure in Relation to Value Added andthe Share of High Technology of Exports
Lähde: TEKES, OECD, Science, Technology and Industry Scoreboard 2003

17.4.2007 LF/mt
21
Innovation policies
• Increase investments in R&D by 7 per cent annually– Strategic competencies centers– Commercialisation of technological innovations
• Renew the research structures– Stronger universities
• Concentration on key areas, economic autonomy, reform of administration
• Incentives for venture capital in growing SMEs

17.4.2007 LF/mt
22

17.4.2007 LF/mt
23
Willingness to Become an Entrepreneur
0 10 20 30 40 50 60
Finland
Netherlands
Belgium
Sweden
Austria
Denmark
Germany
UK
France
EU15
Greece
Italy
Spain
Ireland
USA
Portugal
%
Source: Flash Eurobarometer 160, 2004
Survey is Based on 21 000 telephone interviews

17.4.2007 LF/mt
24
Functioning labour market
• More flexibility in collective agreements– Wage rises and working-time arrangements decided on company level
• Availability of qualified labour– Vocational training to respond to the needs – Better regional mobility– Removal of unemployment traps– Increase of work-based immigration
• Social security to encourage employment– Reform of unemployment benefits
• Better labour peace

17.4.2007 LF/mt
25

17.4.2007 LF/mt
26
Sustainable energy policy
• Need for electricity will grow by 10-15 per cent by 2020
• Favourable conditions for diversified energy production– in particular emission free energy, including nuclear power
• Strategy for the use of biomass for energy and industry
• Reduction of electricity tax
• Global climate policy– Level playing field– Rewards for energy efficiency
17.4.2007 LF/mt
27
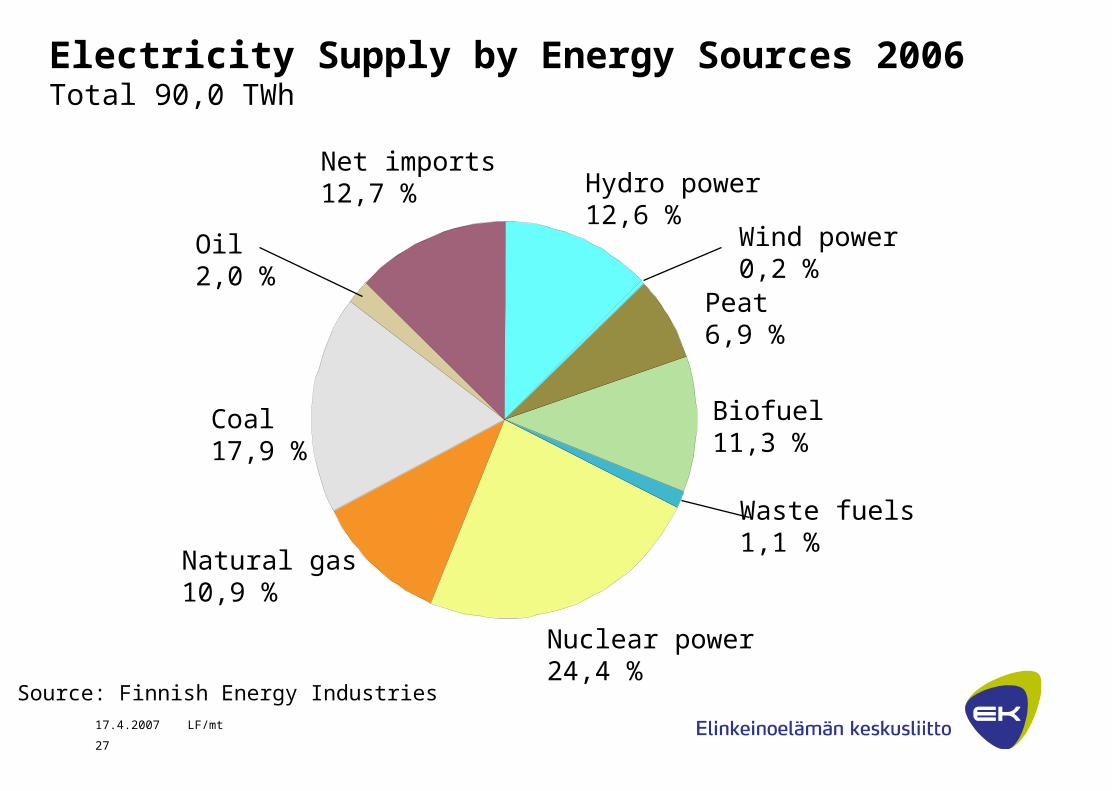
Electricity Supply by Energy Sources 2006Total 90,0 TWh
Hydro power12,6 %
Wind power0,2 %
Peat6,9 %
Biofuel11,3 %
Nuclear power24,4 %
Natural gas10,9 %
Coal17,9 %
Oil2,0 %
Net imports12,7 %
Waste fuels1,1 %
Source: Finnish Energy Industries

17.4.2007 LF/mt
28
World GHG Emissions
GHG emissions in MtCO2-eq.
05000
100001500020000250003000035000400004500050000
2000 2010 2020 2030
Rest of World
Asia
Latin America
USA
EU-25
Source: European Commission