Leica Geosystems Release Notes · Leica Geosystems Release Notes Leica Geosystems AG...
57
Leica Geosystems Release Notes Leica Geosystems AG Heinrich-Wild-Strasse CH-9435 Heerbrugg Schweiz Leica GeoMoS Now! Release Notes www.leica-geosystems.com Product GeoMoS Now! v7.3 SP3 Date 03 rd July 2019 From Michael Rutschmann
Transcript of Leica Geosystems Release Notes · Leica Geosystems Release Notes Leica Geosystems AG...
Leica Geosystems Release Notes
Leica Geosystems AG
Heinrich-Wild-Strasse
CH-9435 Heerbrugg
Schweiz
Leica GeoMoS Now! Release Notes www.leica-geosystems.com
Product GeoMoS Now! v7.3 SP3
Date 03rd July 2019
From Michael Rutschmann

Leica GeoMoS Now! Release Notes
1/57
Leica GeoMoS Now! Release Notes
2/57
CONTENTS
CONTENTS ...................................................................................................................................................... 2
What’s new in Version 7.3 Service Pack 3 released July 2019 .................................................................. 4
What’s new in Version 7.3 Service Pack 2 released May 2019 .................................................................. 5
What’s new in Version 7.3 Service Pack 1 released November 2018 ........................................................ 6
What’s new in Version 7.3 released October 2018 ...................................................................................... 7
What’s new in Version 7.2 Service Pack 2 released May 2018 ................................................................ 11
What’s new in Version 7.2 Service Pack 1 released February 2018 ........................................................ 13
What’s new in Version 7.2 released January 2018 .................................................................................... 14
What’s new in Version 7.1 released August 2017 ..................................................................................... 16
What’s new in Version 7.0 Service Pack 1 released February 2017 ........................................................ 20
What’s new in Version 7.0 released October 2016 .................................................................................... 22
What’s new in Version 6.6 released June 2016 ......................................................................................... 28
What’s new in Version 6.5 released April 2016 ......................................................................................... 31
What’s new in Version 6.4 (build 6.4.0.100) released December 2015 .................................................... 37
What’s new in Version 6.2 (build 6.2.0.600) released March 2015 ........................................................... 40
What’s new in Version 6.1 (build 6.1.0.308) released June 2014 ............................................................. 45
Technical Specifications .............................................................................................................................. 55

Leica GeoMoS Now! Release Notes
3/57
OVERVIEW Leica GeoMoS Now! is a web-based application which provides access to monitoring data anywhere, anytime and with any web-based device. Monitoring data is presented visually with easy-to-interpret maps, graphs, images, deformation scans, tables and automatic reports, which quickly convey knowledge and understanding of a monitoring project to customers. For more detailed product information, please visit: http://www.leica-geosystems.com/geomos_now
Leica GeoMoS Now! Release Notes
4/57
What’s new in Version 7.3 Service Pack 3 released July 2019
OVERVIEW Leica GeoMoS Now! continues to add and improve functionalities. Overview of the highlights:
Deformation legend for scanning graphs General improvements
DEFORMATION LEGEND FOR SCANNING GRAPHS
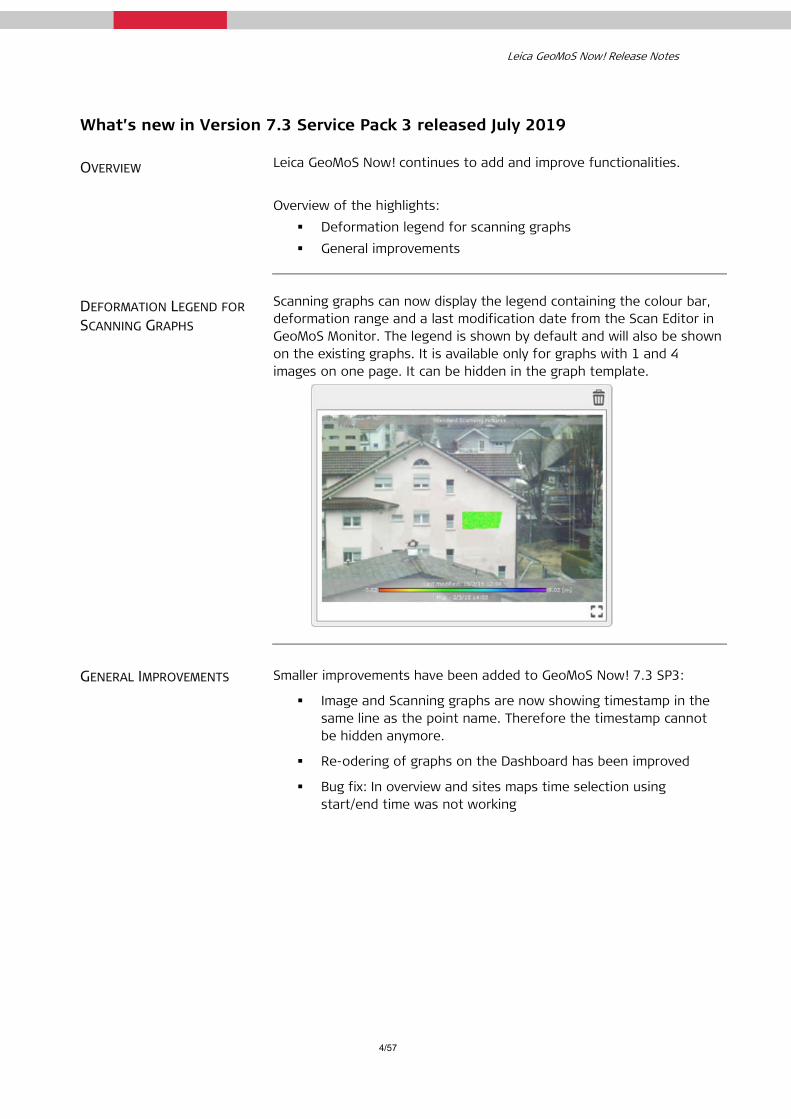
Scanning graphs can now display the legend containing the colour bar, deformation range and a last modification date from the Scan Editor in GeoMoS Monitor. The legend is shown by default and will also be shown on the existing graphs. It is available only for graphs with 1 and 4 images on one page. It can be hidden in the graph template.
GENERAL IMPROVEMENTS Smaller improvements have been added to GeoMoS Now! 7.3 SP3:
Image and Scanning graphs are now showing timestamp in the same line as the point name. Therefore the timestamp cannot be hidden anymore.
Re-odering of graphs on the Dashboard has been improved
Bug fix: In overview and sites maps time selection using start/end time was not working
Leica GeoMoS Now! Release Notes
5/57
What’s new in Version 7.3 Service Pack 2 released May 2019
OVERVIEW Leica GeoMoS Now! continues to add and improve functionalities. Overview of the highlights:
Overview and Site settings stored General improvements
OVERVIEW AND SITE SETTINGS STORED
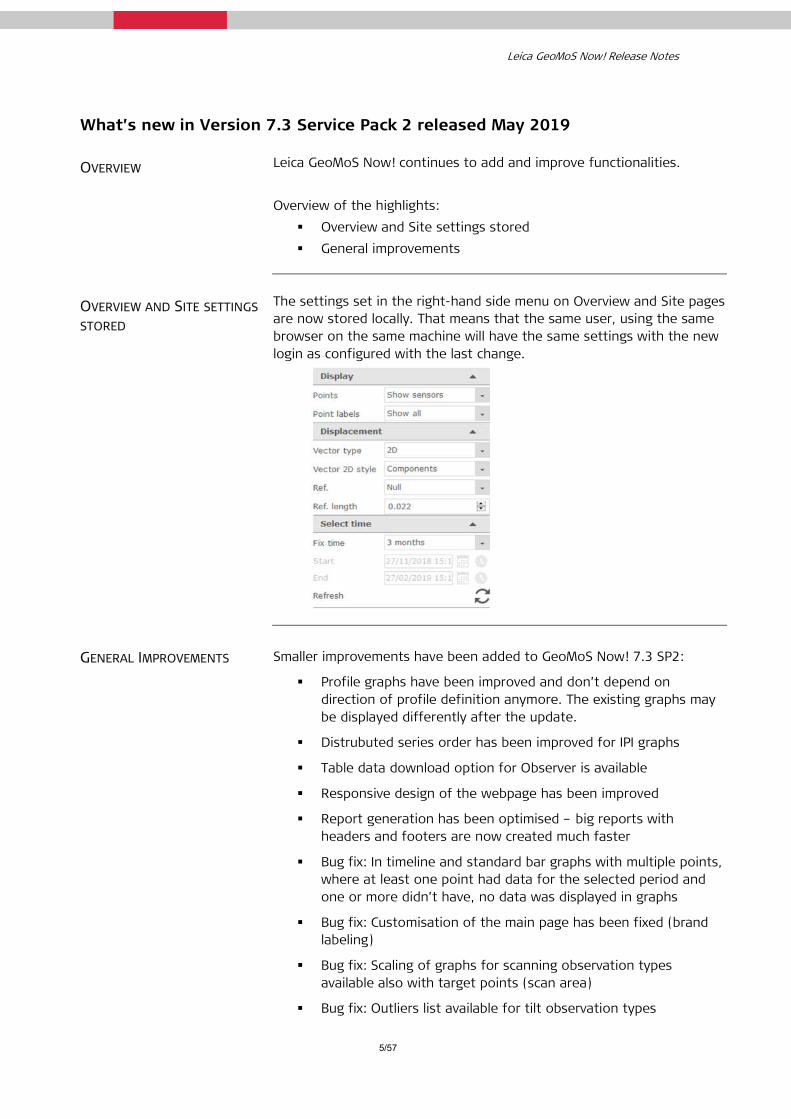
The settings set in the right-hand side menu on Overview and Site pages are now stored locally. That means that the same user, using the same browser on the same machine will have the same settings with the new login as configured with the last change.
GENERAL IMPROVEMENTS Smaller improvements have been added to GeoMoS Now! 7.3 SP2:
Profile graphs have been improved and don’t depend on direction of profile definition anymore. The existing graphs may be displayed differently after the update.
Distrubuted series order has been improved for IPI graphs
Table data download option for Observer is available
Responsive design of the webpage has been improved
Report generation has been optimised – big reports with headers and footers are now created much faster
Bug fix: In timeline and standard bar graphs with multiple points, where at least one point had data for the selected period and one or more didn’t have, no data was displayed in graphs
Bug fix: Customisation of the main page has been fixed (brand labeling)
Bug fix: Scaling of graphs for scanning observation types available also with target points (scan area)
Bug fix: Outliers list available for tilt observation types
Leica GeoMoS Now! Release Notes
6/57
What’s new in Version 7.3 Service Pack 1 released November 2018
OVERVIEW Leica GeoMoS Now! continues to add and improve functionalities. Overview of the highlights:
Improved performance and service stability General improvements
IMPROVED PERFORMANCE AND SERVICE STABILITY
More and more customers are attracted to Leica GeoMoS Now! software, as we introduce and release new features. The new service pack resolves some minor performance issues from the version 7.3 release, loading of the graphs and generating reports is now faster which increases the overall stability of the service.
GENERAL IMPROVEMENTS Smaller improvements have been added to GeoMoS Now! 7.3 SP1:
Bug fix: Limit names were not visible on horizontaly displayed IPI graphs
Bug fix: CSV download from the graphs was delivering empty files
Bug fix: Database size was not visible in User Management for the cloud version
Bug fix: Smoothing time range was not visible for the Dashboard graphs when 1 day of smoothing was selected
Bug fix: 2-axes graphs with reference to Null were in some cases showing the absolute values
Leica GeoMoS Now! Release Notes
7/57
What’s new in Version 7.3 released October 2018
OVERVIEW Leica GeoMoS Now! continues to add and improve functionalities. Overview of the highlights:
In-Place Inclinometer data visualisation Point tree structure changes for CSV Import and Virtual sensors Improvements in displaying limit information in graphs General improvements
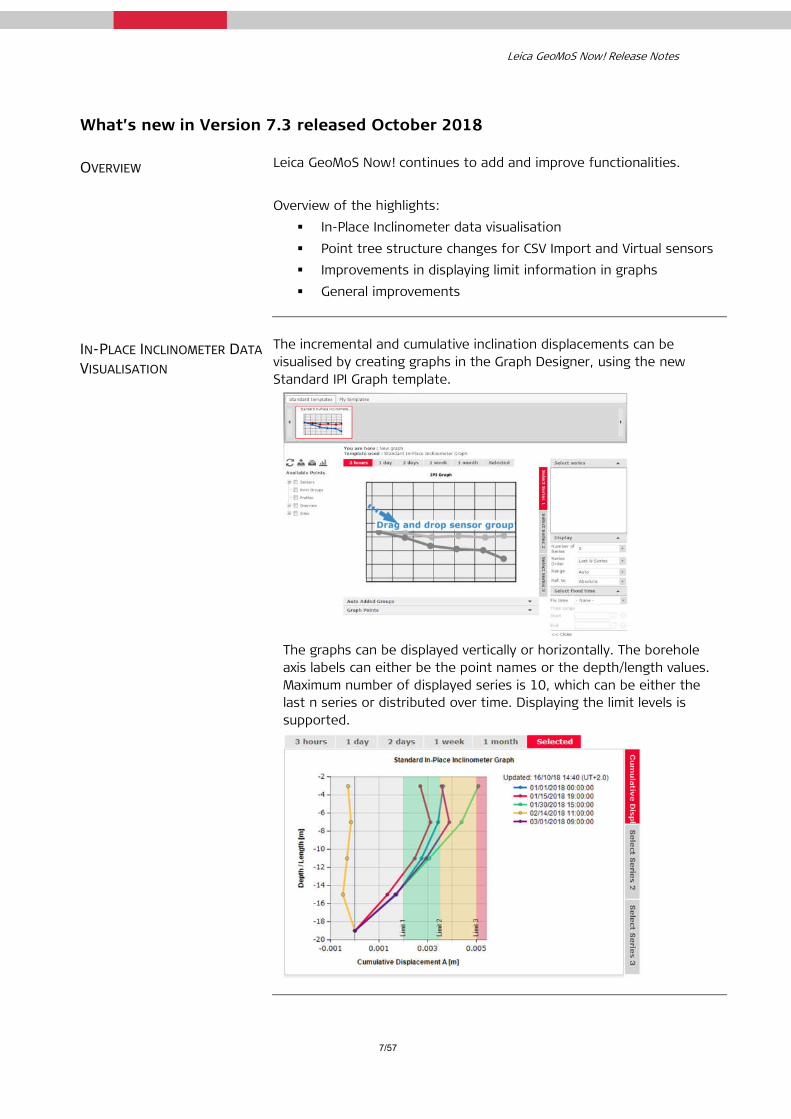
IN-PLACE INCLINOMETER DATA VISUALISATION
The incremental and cumulative inclination displacements can be visualised by creating graphs in the Graph Designer, using the new Standard IPI Graph template.
The graphs can be displayed vertically or horizontally. The borehole axis labels can either be the point names or the depth/length values. Maximum number of displayed series is 10, which can be either the last n series or distributed over time. Displaying the limit levels is supported.
Leica GeoMoS Now! Release Notes
8/57
POINT TREE STRUCTURE CHANGES
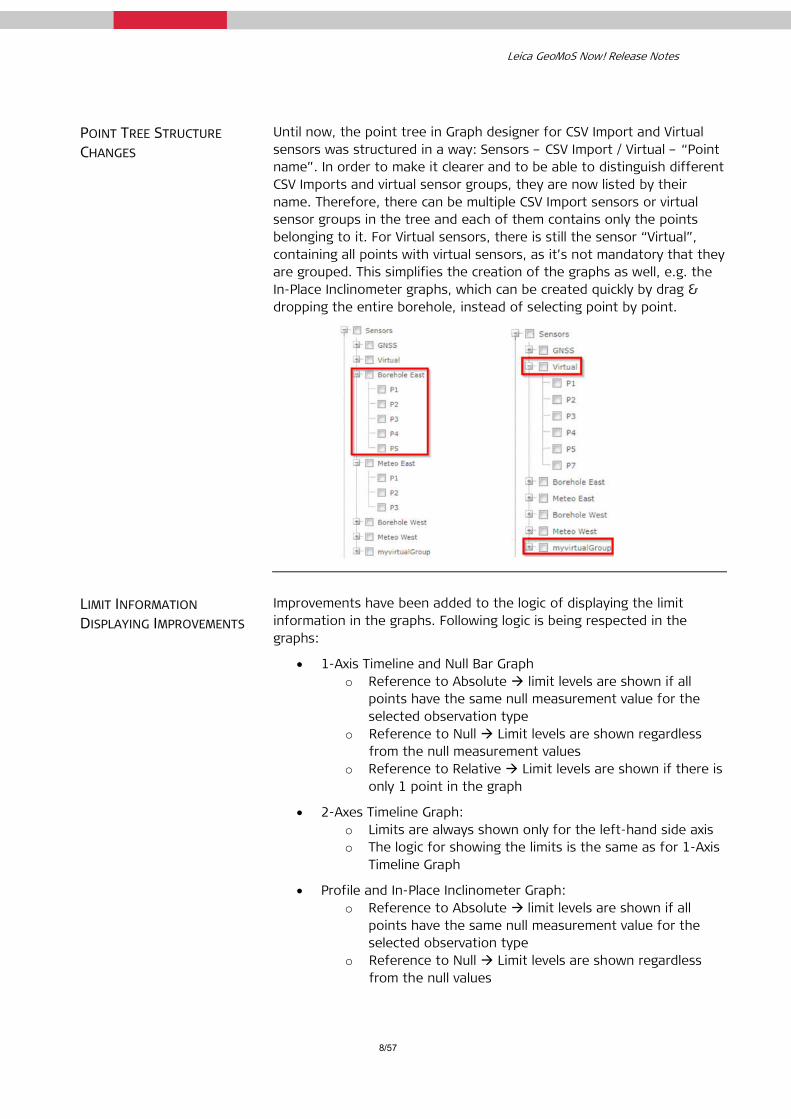
Until now, the point tree in Graph designer for CSV Import and Virtual sensors was structured in a way: Sensors – CSV Import / Virtual – “Point name”. In order to make it clearer and to be able to distinguish different CSV Imports and virtual sensor groups, they are now listed by their name. Therefore, there can be multiple CSV Import sensors or virtual sensor groups in the tree and each of them contains only the points belonging to it. For Virtual sensors, there is still the sensor “Virtual”, containing all points with virtual sensors, as it’s not mandatory that they are grouped. This simplifies the creation of the graphs as well, e.g. the In-Place Inclinometer graphs, which can be created quickly by drag & dropping the entire borehole, instead of selecting point by point.
LIMIT INFORMATION DISPLAYING IMPROVEMENTS
Improvements have been added to the logic of displaying the limit information in the graphs. Following logic is being respected in the graphs:
1-Axis Timeline and Null Bar Graph o Reference to Absolute limit levels are shown if all
points have the same null measurement value for the selected observation type
o Reference to Null Limit levels are shown regardless from the null measurement values
o Reference to Relative Limit levels are shown if there is only 1 point in the graph
2-Axes Timeline Graph: o Limits are always shown only for the left-hand side axis o The logic for showing the limits is the same as for 1-Axis
Timeline Graph
Profile and In-Place Inclinometer Graph: o Reference to Absolute limit levels are shown if all
points have the same null measurement value for the selected observation type
o Reference to Null Limit levels are shown regardless from the null values
Leica GeoMoS Now! Release Notes
9/57
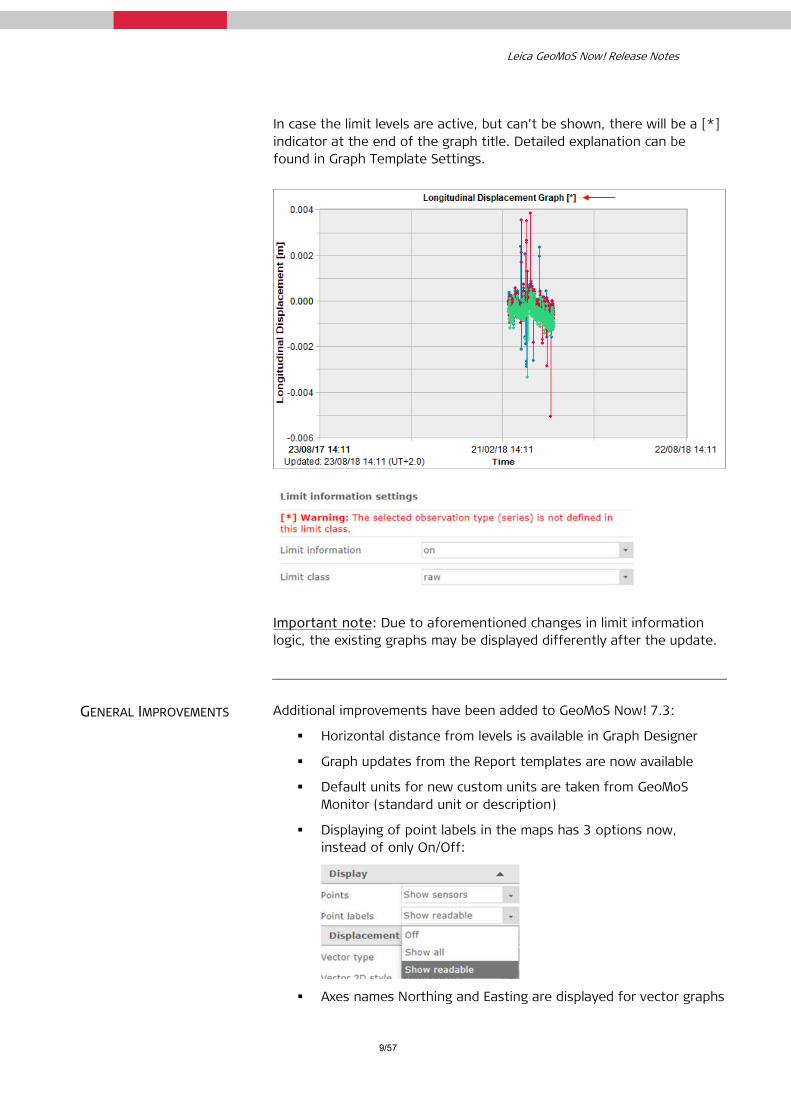
In case the limit levels are active, but can’t be shown, there will be a [*] indicator at the end of the graph title. Detailed explanation can be found in Graph Template Settings.
Important note: Due to aforementioned changes in limit information logic, the existing graphs may be displayed differently after the update.
GENERAL IMPROVEMENTS Additional improvements have been added to GeoMoS Now! 7.3:
Horizontal distance from levels is available in Graph Designer
Graph updates from the Report templates are now available
Default units for new custom units are taken from GeoMoS Monitor (standard unit or description)
Displaying of point labels in the maps has 3 options now, instead of only On/Off:
Axes names Northing and Easting are displayed for vector graphs

Leica GeoMoS Now! Release Notes
10/57
In the View Management, it’s now clearly indicated with red text when the poject database, the view is linked to, has been deleted
Bug fix: Graphs with observation types which belong to TPS raw
measurements (Hz/V angle, slope distance) were showing the same values when using reference to absolute and reference to null in timeline graphs. This has been fixed and it will cause the changes in existing graphs with reference to null after the upgrade.
Bug fix: Changing title in 2-Axes Velocity Graphs was sometimes causing graph range settings going back to default. From this version this issue is fixed.
Bug fix: Site names containing the ‘ character were not displayed correctly in the map. From this version this issue is fixed.
Bug fix: View names starting with space character had problems with Brand labeling. It is not allowed to name the view starting or ending with space character anymore.
Bug fix: Displaying of raster image layers on the maps with defined settings.
Leica GeoMoS Now! Release Notes
11/57
What’s new in Version 7.2 Service Pack 2 released May 2018
OVERVIEW Leica GeoMoS Now! continues to add and improve functionalities. Overview of the highlights:
Visualisation and analysis of adjusted results Improvements in Vaisala precipitation sensor reading General improvements
ADJUSTED RESULTS Adjusted results and statistics can now be visualised and analysed in GeoMoS Now!. Following new data can now be shown in map’s Point Details, graphs, and Tables:
Adjusted 2D and 3D Vector Adjusted Easting / Northing / Height Adjusted Easting / Northing / Height Difference Adjusted Transverse / Longitudinal / Height Displacement Error Ellipse Major / Minor Axis Error Ellipse Major Axis Orientation Significant Deformation
Maps: Show vectors from adjusted results
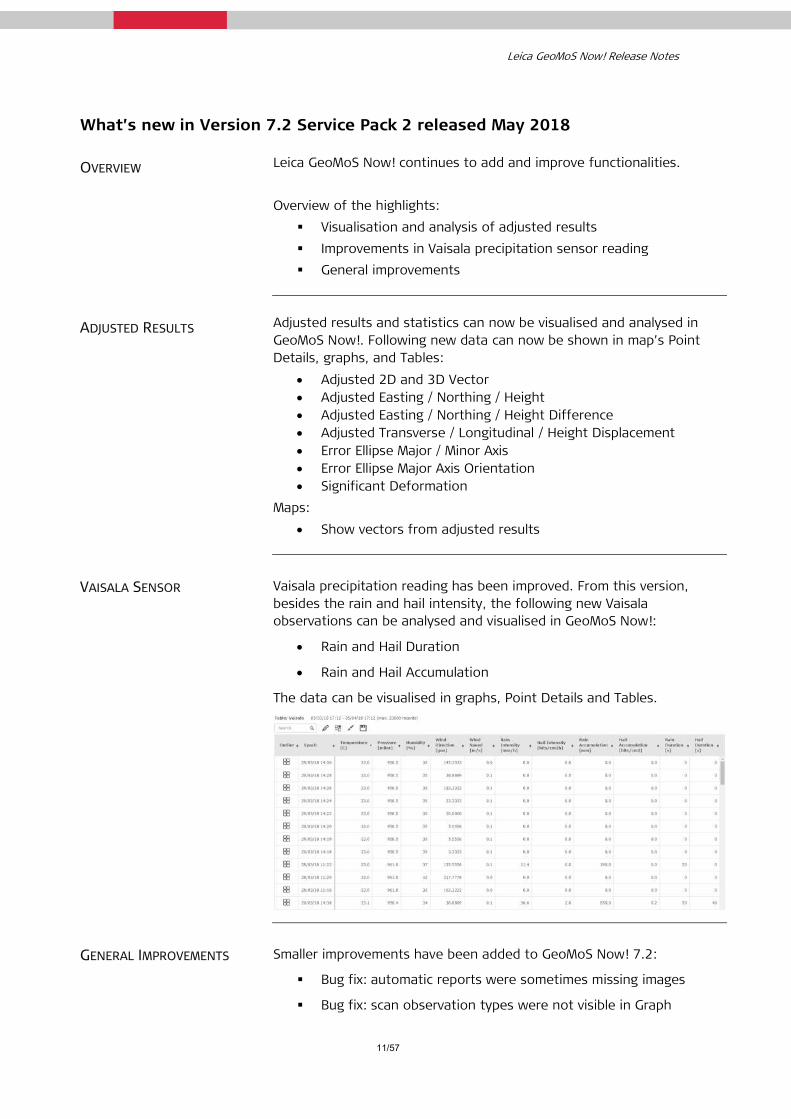
VAISALA SENSOR Vaisala precipitation reading has been improved. From this version, besides the rain and hail intensity, the following new Vaisala observations can be analysed and visualised in GeoMoS Now!:
Rain and Hail Duration
Rain and Hail Accumulation
The data can be visualised in graphs, Point Details and Tables.
GENERAL IMPROVEMENTS Smaller improvements have been added to GeoMoS Now! 7.2:
Bug fix: automatic reports were sometimes missing images
Bug fix: scan observation types were not visible in Graph
Leica GeoMoS Now! Release Notes
12/57
Designer
Stability of the GeoMoS Now! cloud version has been improved

Leica GeoMoS Now! Release Notes
13/57
What’s new in Version 7.2 Service Pack 1 released February 2018
OVERVIEW Leica GeoMoS Now! continues to add and improve functionalities. Overview of the highlights:
Optimisation of outlier calculation performance General improvements
OUTLIER CALCULATION PERFORMANCE
The outlier performance has been significantly improved, up to five times faster calculation. This is particularly noticeable with large amount of data included in the calculation.
GENERAL IMPROVEMENTS Smaller improvements have been added to GeoMoS Now! 7.2:
Bug fix: The paging in outliers section in graphs with custom observations has been fixed.
Performance for graphs with reference to null value has been optimised.
Leica GeoMoS Now! Release Notes
14/57
What’s new in Version 7.2 released January 2018
OVERVIEW Leica GeoMoS Now! continues to add and improve functionalities. Overview of the highlights:
New: Tables General improvements
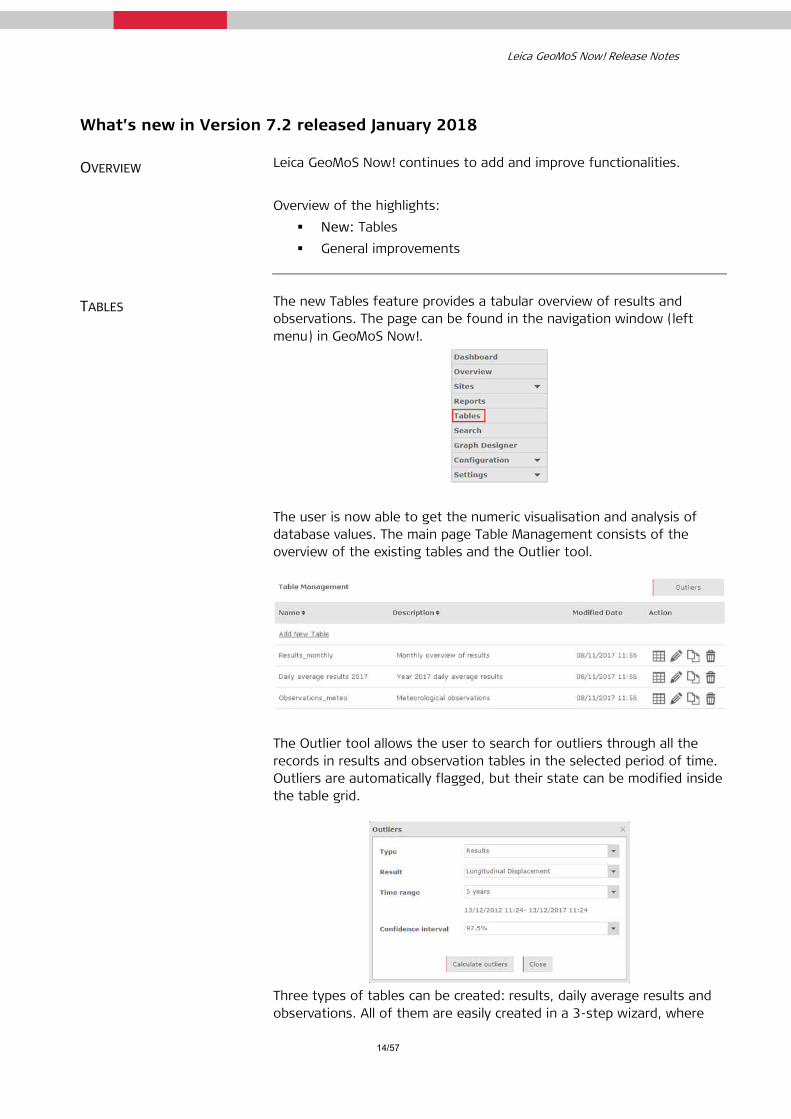
TABLES The new Tables feature provides a tabular overview of results and observations. The page can be found in the navigation window (left menu) in GeoMoS Now!.
The user is now able to get the numeric visualisation and analysis of database values. The main page Table Management consists of the overview of the existing tables and the Outlier tool.
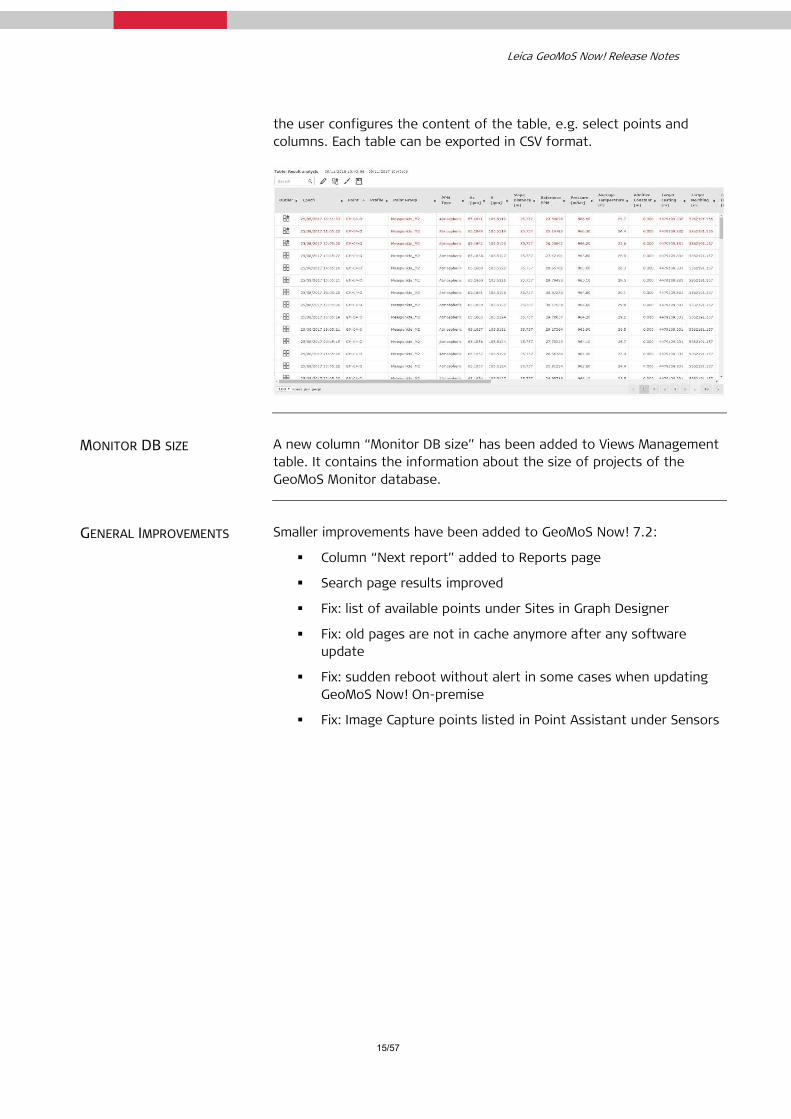
The Outlier tool allows the user to search for outliers through all the records in results and observation tables in the selected period of time. Outliers are automatically flagged, but their state can be modified inside the table grid.
Three types of tables can be created: results, daily average results and observations. All of them are easily created in a 3-step wizard, where
Leica GeoMoS Now! Release Notes
15/57
the user configures the content of the table, e.g. select points and columns. Each table can be exported in CSV format.
MONITOR DB SIZE A new column “Monitor DB size” has been added to Views Management table. It contains the information about the size of projects of the GeoMoS Monitor database.
GENERAL IMPROVEMENTS Smaller improvements have been added to GeoMoS Now! 7.2:
Column “Next report” added to Reports page
Search page results improved
Fix: list of available points under Sites in Graph Designer
Fix: old pages are not in cache anymore after any software update
Fix: sudden reboot without alert in some cases when updating GeoMoS Now! On-premise
Fix: Image Capture points listed in Point Assistant under Sensors
Leica GeoMoS Now! Release Notes
16/57
What’s new in Version 7.1 released August 2017
OVERVIEW Leica GeoMoS Now! continues to add and improve functionalities. Overview of the highlights:
New: GeoMoS Image Capture Improvement: Point Management Announcement: GeoMoS Now! limit for the database size Limit check comparison method General improvements
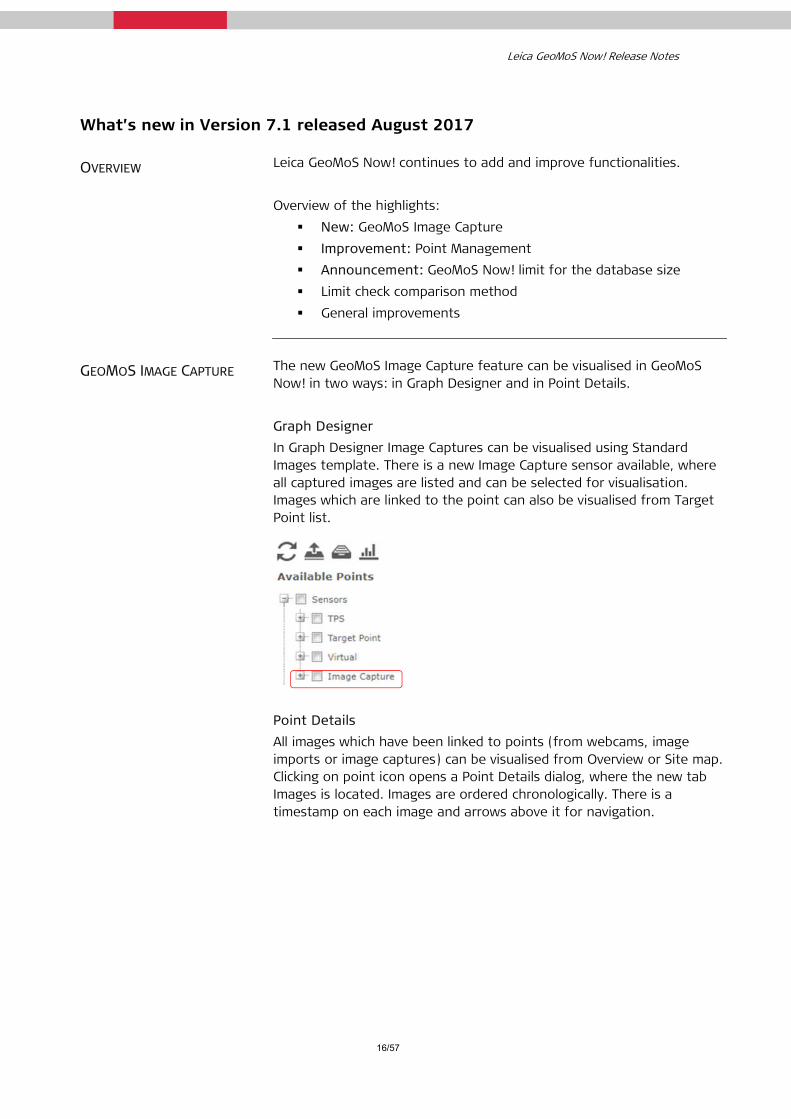
GEOMOS IMAGE CAPTURE The new GeoMoS Image Capture feature can be visualised in GeoMoS Now! in two ways: in Graph Designer and in Point Details. Graph Designer In Graph Designer Image Captures can be visualised using Standard Images template. There is a new Image Capture sensor available, where all captured images are listed and can be selected for visualisation. Images which are linked to the point can also be visualised from Target Point list.
Point Details All images which have been linked to points (from webcams, image imports or image captures) can be visualised from Overview or Site map. Clicking on point icon opens a Point Details dialog, where the new tab Images is located. Images are ordered chronologically. There is a timestamp on each image and arrows above it for navigation.

Leica GeoMoS Now! Release Notes
17/57
POINT MANAGEMENT Complete reengineering of Point management has been done for simpler and more intuitive use.
Organisation
The main page of Point Management consists of two parts: on the left side there is the settings table, with a list of points added to the overview/site, and on the right side there is the 2D map/image over which the Point selector can be overlaid.
Point selector
In Point selector it is very easy to filter and select points to be added to the site or overview. All points which have been added are automatically positioned on the map or can be positioned manually on image background.
Leica GeoMoS Now! Release Notes
18/57
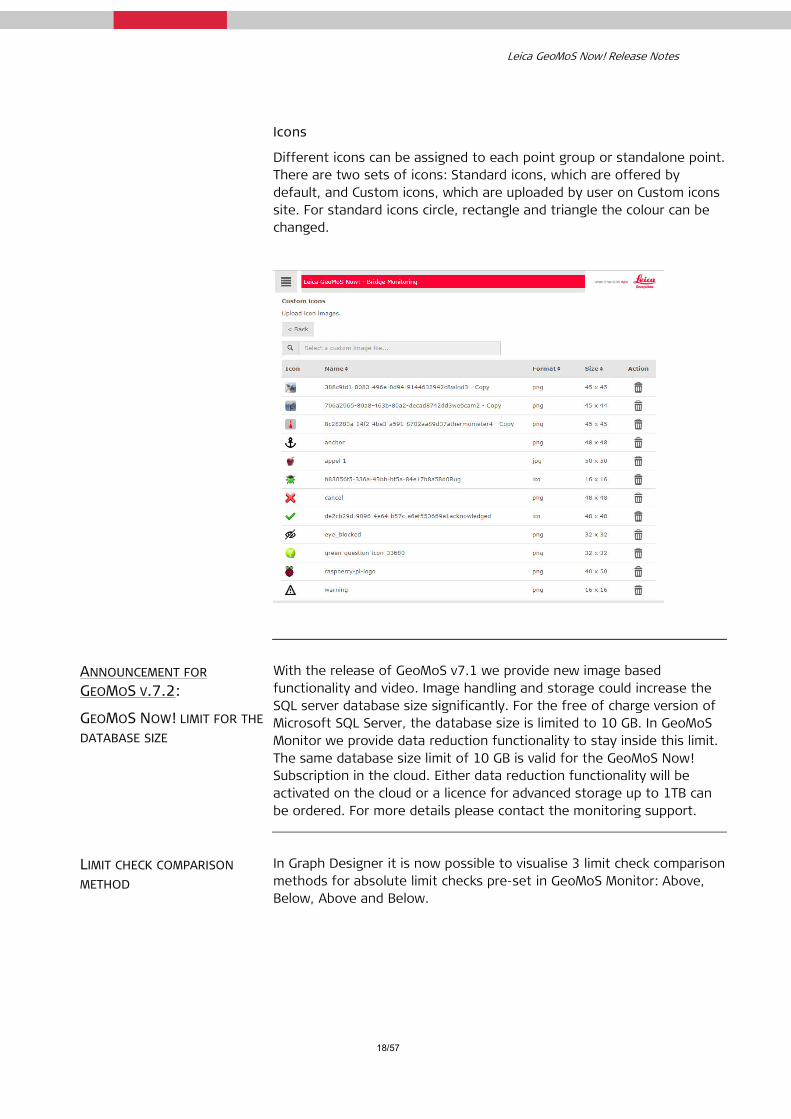
Icons
Different icons can be assigned to each point group or standalone point. There are two sets of icons: Standard icons, which are offered by default, and Custom icons, which are uploaded by user on Custom icons site. For standard icons circle, rectangle and triangle the colour can be changed.
ANNOUNCEMENT FOR GEOMOS V.7.2:
GEOMOS NOW! LIMIT FOR THE DATABASE SIZE
With the release of GeoMoS v7.1 we provide new image based functionality and video. Image handling and storage could increase the SQL server database size significantly. For the free of charge version of Microsoft SQL Server, the database size is limited to 10 GB. In GeoMoS Monitor we provide data reduction functionality to stay inside this limit. The same database size limit of 10 GB is valid for the GeoMoS Now! Subscription in the cloud. Either data reduction functionality will be activated on the cloud or a licence for advanced storage up to 1TB can be ordered. For more details please contact the monitoring support.
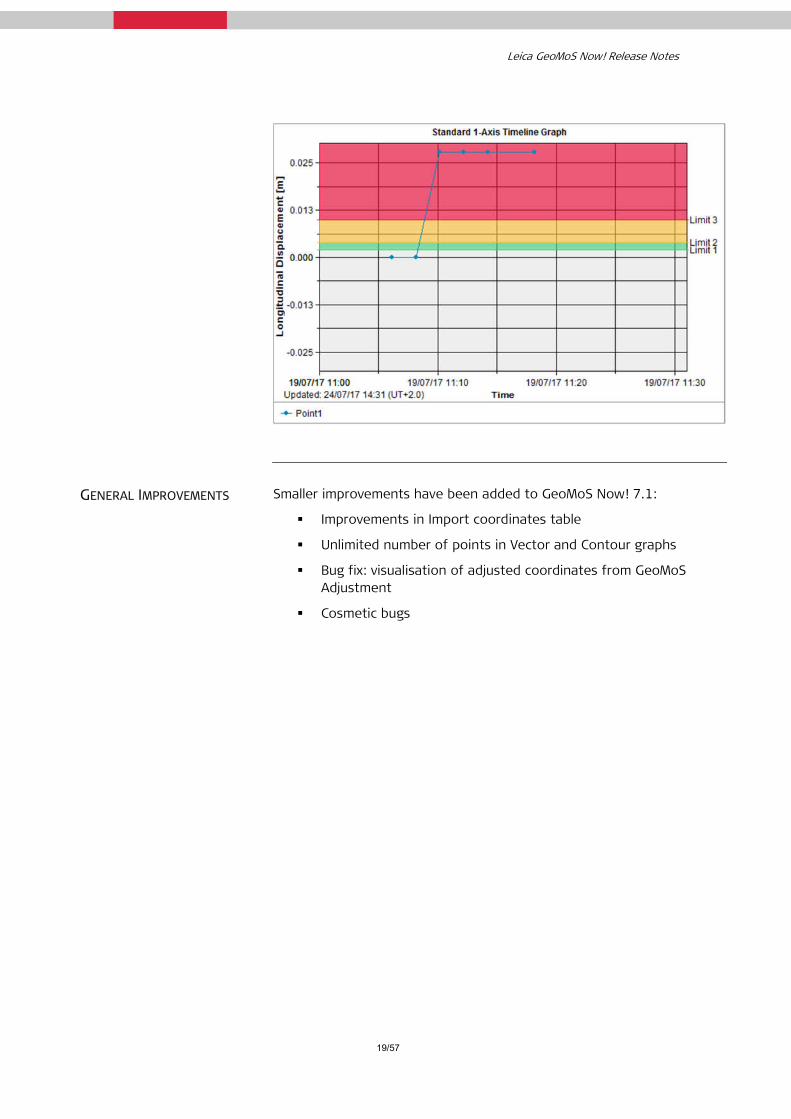
LIMIT CHECK COMPARISON METHOD
In Graph Designer it is now possible to visualise 3 limit check comparison methods for absolute limit checks pre-set in GeoMoS Monitor: Above, Below, Above and Below.
Leica GeoMoS Now! Release Notes
19/57
GENERAL IMPROVEMENTS Smaller improvements have been added to GeoMoS Now! 7.1:
Improvements in Import coordinates table
Unlimited number of points in Vector and Contour graphs
Bug fix: visualisation of adjusted coordinates from GeoMoS Adjustment
Cosmetic bugs
Leica GeoMoS Now! Release Notes
20/57
What’s new in Version 7.0 Service Pack 1 released February 2017
OVERVIEW Leica GeoMoS Now! continues to add and improve functionalities. Overview of the highlights:
New: Limit classes for GeoMoS Now! Survey Edition Setup menu renamed to Configuration menu General improvements
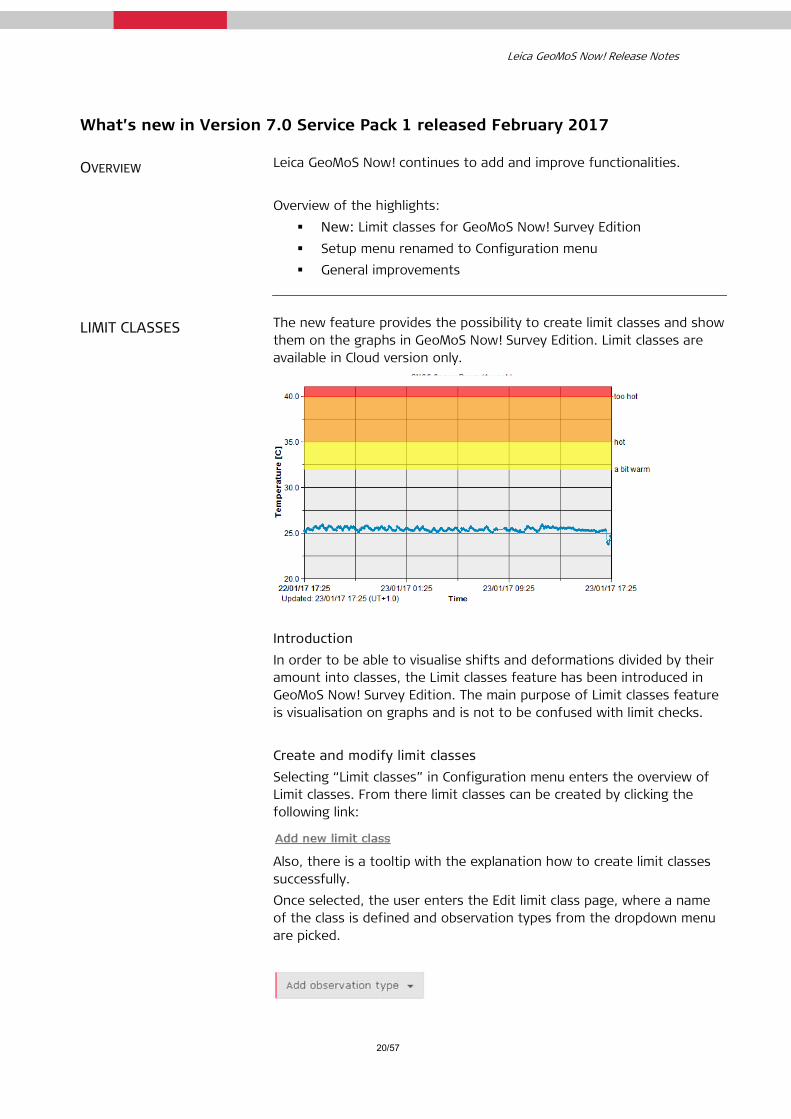
LIMIT CLASSES The new feature provides the possibility to create limit classes and show them on the graphs in GeoMoS Now! Survey Edition. Limit classes are available in Cloud version only.
Introduction In order to be able to visualise shifts and deformations divided by their amount into classes, the Limit classes feature has been introduced in GeoMoS Now! Survey Edition. The main purpose of Limit classes feature is visualisation on graphs and is not to be confused with limit checks. Create and modify limit classes Selecting “Limit classes” in Configuration menu enters the overview of Limit classes. From there limit classes can be created by clicking the following link:
Also, there is a tooltip with the explanation how to create limit classes successfully. Once selected, the user enters the Edit limit class page, where a name of the class is defined and observation types from the dropdown menu are picked.

Leica GeoMoS Now! Release Notes
21/57
For each observation type 3 limit values can be set. Selecting Save button leads the user back to the overview page, where limit classes can be edited, copied as a new class or deleted.
CONFIGURATION MENU The old Setup menu has been renamed to Configuration menu in order to distinguish it more easily from Settings menu.
GENERAL IMPROVEMENTS Smaller improvements have been added to GeoMoS Now! 7.0:
Bug fix: In Graph designer for GeoMoS Now! Survey Edition it is now possible to select minimum/maximum values for any observation result type.
Cosmetic bugs

Leica GeoMoS Now! Release Notes
22/57
What’s new in Version 7.0 released October 2016
OVERVIEW Leica GeoMoS Now! continues to add and improve functionalities. Overview of the highlights:
New: GeoMoS Now! Survey Edition TPS Monitoring App Change in user rights for Administrators Change project functionality New licenses for On-premises installation
Important: To use the Leica GeoMoS Now! On-premises version 7.0, install or upgrade to Leica GeoMoS Monitor version 7.0.
GEOMOS NOW! SURVEY EDITION
The modified version of GeoMoS Now! visualisation and reporting tool has been introduced for the surveying community. Introduction Many surveyors deal with campaign projects where control measurements of points or objects are daily routine. In many cases these projects include one or only a few sensors and normally do not require any sort of communication infrastructure between the instrument and processing software. Measurements are performed with surveyors actively using the total station or digital level and storing the data for processing and visualisation back in the office. This process usually includes spread sheets or in-house developed tools, and requires considerable time and effort to produce a report to interested parties. GeoMoS Now! Survey Edition has been introduced for all campaign or control measurements tasks, which do not require a permanent and complex monitoring installation. This tool offers all the visualisation and reporting functionalities of the standard GeoMoS Now! yet does not require the installation of GeoMoS Monitor. Instead, data can now be uploaded directly to GeoMoS Now! service. Data GeoMoS Now! Survey Edition supports the coordinate files from any total station, be it Leica Geosystems or third party, provided that the data has been stored in Leica Geosystems format. It supports comma separated ascii files with the following structure.

Leica GeoMoS Now! Release Notes
23/57
In addition to total station measurement data, GeoMoS Now! Survey Edition supports the measurement data from Leica Geosystems digital levels. Subscription and licenses To begin using GeoMoS Now! Survey Edition in the cloud version, a valid subscription ID has to be purchased. For the On-premises variant, the functionality is included in the standard license. A trial license is available for cloud users to test and get used to the tool. Note: The subscription period starts from the date of purchase, and not from the first activation date! First time use of GeoMoS Now! Survey Edition Upon successful activation and log in, users can begin by creating a new project, or selecting an already created project view. When logging in for the first time, a user will log in with Administrator credentials. An Administrator can create new projects as well as new users with Editor and Viewer roles. To do so, an Administrator can click on the user icon in the upper right corner of the GeoMoS Now!.
The standard user and view management window will open. Clicking on the Home button in the upper left corner the Administrator can go back to the start screen. On the start screen two options are available:
Project management Project view selection

Leica GeoMoS Now! Release Notes
24/57
Project management Project management allows the user to create a new project. The following entries are required to successfully create a new project:
Project name Distance unit Time zone.
A project description is optional. The distance unit can be changed later within the project when the selected time zone is fixed. When a new project is created, a view with the same name will be added to the list below. To create another view of the same project, please use the User and Views management described above. The project management table offers action icons, such as edit, delete and backup of the project database, to manage the created project. Project view selection Created project views will be listed here. This section offers two actions:
Start GeoMoS Now! Import coordinates
When using the view for the first time, no content is available as no data has been imported. Hence, the first step will be to click on the Import coordinates button. Alternatively, user can also click on Start GeoMoS Now! and import coordinates by using the left hand menu. Note: An Administrator can see all project views, even those assigned to Editors and Viewers. Import coordinates The Import coordinates page allows the user to import measurement data. All data files that have been imported but not stored in GeoMoS database will be listed here. The files sent directly using the TPS Monitoring App (see in following chapters) will be also shown here. Note: If the data files are listed here, this means that they are not yet used in GeoMoS Now! and not stored in GeoMoS database. With the Upload new file link users can add the coordinate file to the file list.
The file will be validated for the format before being added to the list. All uploaded files are listed in the table below. Click on the file name if you want to download it. This useful functionality applies to all files but particularly the files sent directly from the TPS that are not yet stored in the file system. Use the delete icon to remove the uploaded file. Imported, but not yet stored files from other projects will be also visible here for the Adminstrator. To store and visualise data, mark the check box and click on the Next button. Make sure you have selected the correct units for the selected
Leica GeoMoS Now! Release Notes
25/57
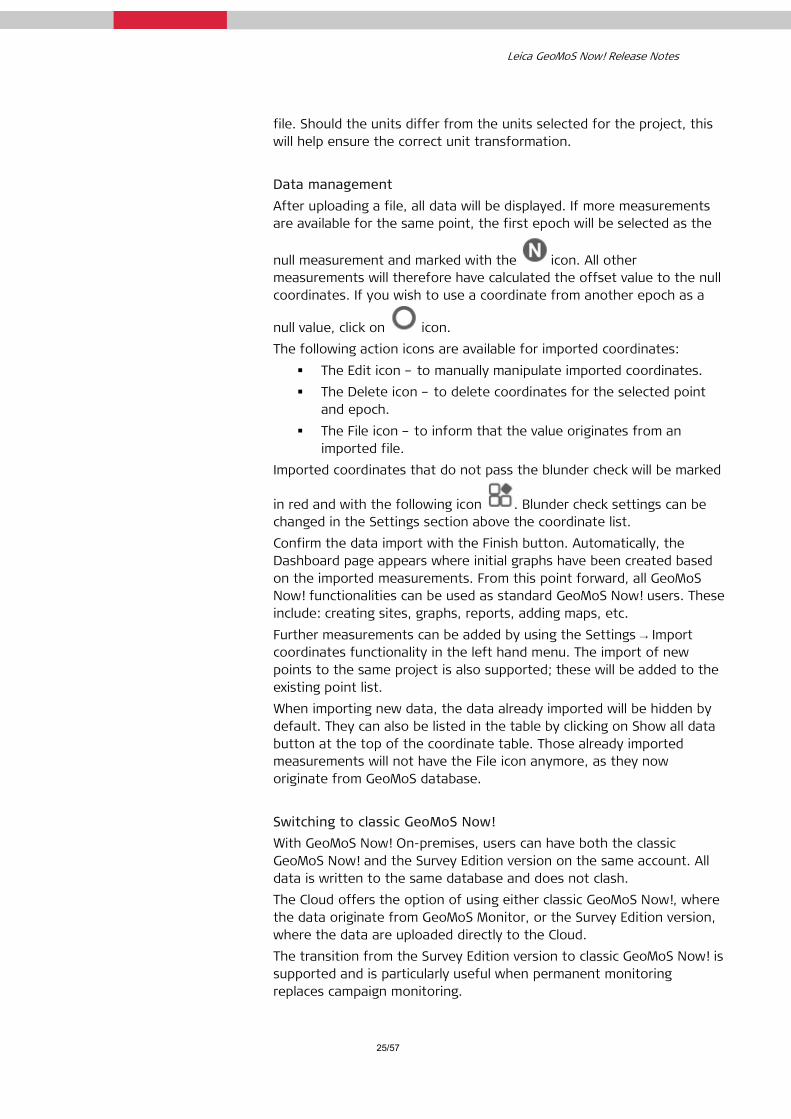
file. Should the units differ from the units selected for the project, this will help ensure the correct unit transformation. Data management After uploading a file, all data will be displayed. If more measurements are available for the same point, the first epoch will be selected as the
null measurement and marked with the icon. All other measurements will therefore have calculated the offset value to the null coordinates. If you wish to use a coordinate from another epoch as a
null value, click on icon. The following action icons are available for imported coordinates:
The Edit icon – to manually manipulate imported coordinates. The Delete icon – to delete coordinates for the selected point
and epoch. The File icon – to inform that the value originates from an
imported file. Imported coordinates that do not pass the blunder check will be marked
in red and with the following icon . Blunder check settings can be changed in the Settings section above the coordinate list. Confirm the data import with the Finish button. Automatically, the Dashboard page appears where initial graphs have been created based on the imported measurements. From this point forward, all GeoMoS Now! functionalities can be used as standard GeoMoS Now! users. These include: creating sites, graphs, reports, adding maps, etc. Further measurements can be added by using the Settings → Import coordinates functionality in the left hand menu. The import of new points to the same project is also supported; these will be added to the existing point list. When importing new data, the data already imported will be hidden by default. They can also be listed in the table by clicking on Show all data button at the top of the coordinate table. Those already imported measurements will not have the File icon anymore, as they now originate from GeoMoS database. Switching to classic GeoMoS Now! With GeoMoS Now! On-premises, users can have both the classic GeoMoS Now! and the Survey Edition version on the same account. All data is written to the same database and does not clash. The Cloud offers the option of using either classic GeoMoS Now!, where the data originate from GeoMoS Monitor, or the Survey Edition version, where the data are uploaded directly to the Cloud. The transition from the Survey Edition version to classic GeoMoS Now! is supported and is particularly useful when permanent monitoring replaces campaign monitoring.
Leica GeoMoS Now! Release Notes
26/57
In order to move to permanent monitoring, it is necessary to: Back-up the GeoMoS Now! Survey Edition projects (databases). Import the database in local GeoMoS Monitor Purchase a valid subscription ID and push the data to new
subscription. With help from the Monitoring Support team, already set View from the GeoMoS Now! SE can be moved to the new subscription.
TPS MONITORING APPLICATION A new application is available for high-end Leica total stations, for the following Captivate and SmartWorx sensors:
MS/TS60
MS/TM/TS50
TS15/TS16
If Internet communication is available, measurement data can be sent directly from the instrument to the GeoMOS Now! account. Depending on the account used, data will be sent either to the Administrator or Editor account.
Note: Administrator can see and access all uploaded files, whereas the Editor can only access the files sent to Editor’s account.
Sent data will be listed in the Upload coordinates area under the following name structure:
YYYYMMDD_HHmmss_<jobname>.txt
If needed, data can be downloaded and stored from here.
CHANGE IN USER RIGHTS FOR ADMINISTRATORS
The access to Users and Views management has changed even for classic GeoMoS Now! users.
As of this version, the Administrator can edit the project view. Hence, when logging in with the Administrator credentials, the user can choose a view to edit from the dropdown list. Here the Adminstrator can see all available Editor views under his supervision.
To access the Users and View management, click on the icon in the upper right corner.
Leica GeoMoS Now! Release Notes
27/57
The classic Users and Views management page will open, and the Administrator can create additional users, views and links between them.
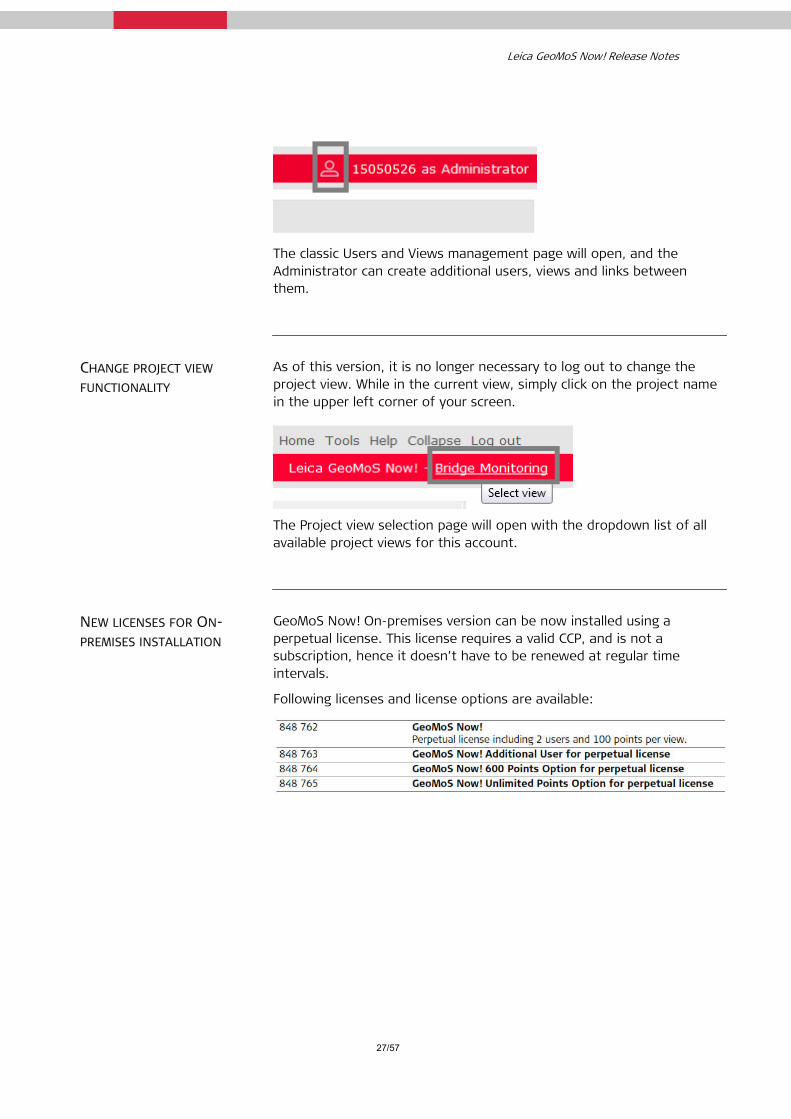
CHANGE PROJECT VIEW FUNCTIONALITY
As of this version, it is no longer necessary to log out to change the project view. While in the current view, simply click on the project name in the upper left corner of your screen.
The Project view selection page will open with the dropdown list of all available project views for this account.
NEW LICENSES FOR ON-PREMISES INSTALLATION
GeoMoS Now! On-premises version can be now installed using a perpetual license. This license requires a valid CCP, and is not a subscription, hence it doesn’t have to be renewed at regular time intervals.
Following licenses and license options are available:
Leica GeoMoS Now! Release Notes
28/57
What’s new in Version 6.6 released June 2016
OVERVIEW Leica GeoMoS Now! continues to add and improve functionalities. Overview of the highlights:
View shape files on Overview and Site maps and images Enlarge the view of Dashboard graphs
Important note: To use the Leica GeoMoS Now! On-premises version 6.6, install or upgrade to Leica GeoMoS Monitor version 6.6!
VIEW SHAPE FILES ON OVERVIEW AND SITE MAPS AND IMAGES
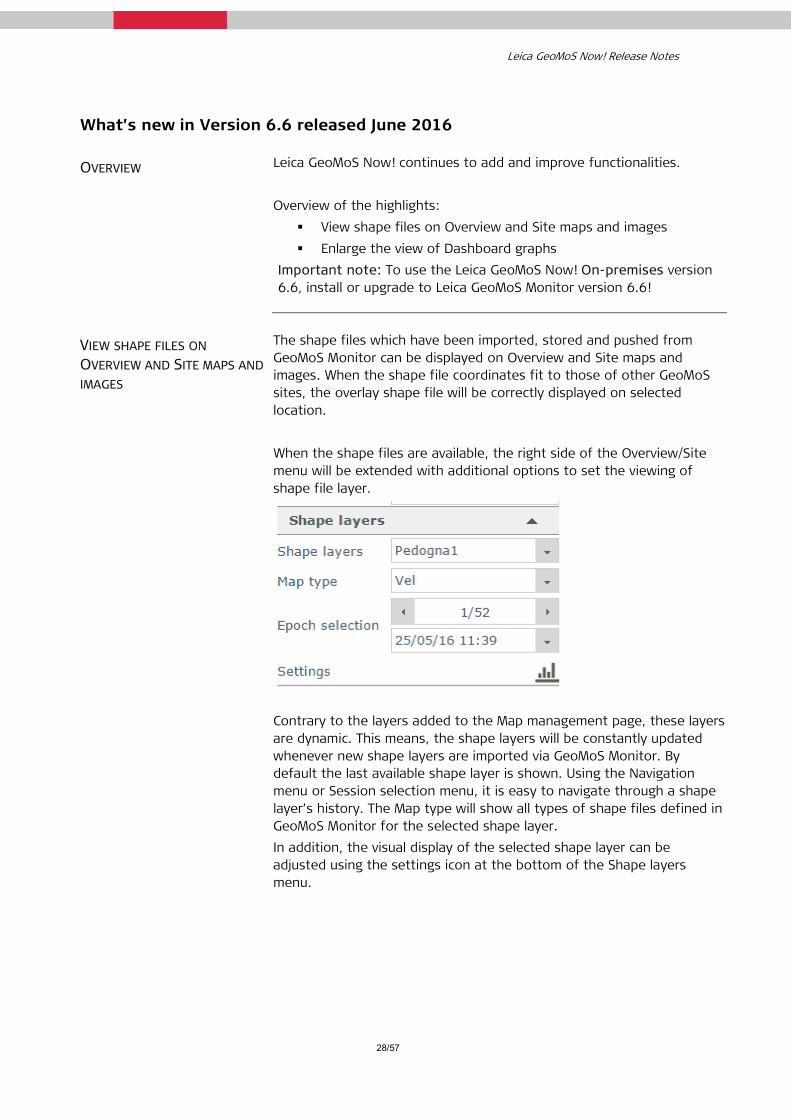
The shape files which have been imported, stored and pushed from GeoMoS Monitor can be displayed on Overview and Site maps and images. When the shape file coordinates fit to those of other GeoMoS sites, the overlay shape file will be correctly displayed on selected location. When the shape files are available, the right side of the Overview/Site menu will be extended with additional options to set the viewing of shape file layer.
Contrary to the layers added to the Map management page, these layers are dynamic. This means, the shape layers will be constantly updated whenever new shape layers are imported via GeoMoS Monitor. By default the last available shape layer is shown. Using the Navigation menu or Session selection menu, it is easy to navigate through a shape layer’s history. The Map type will show all types of shape files defined in GeoMoS Monitor for the selected shape layer. In addition, the visual display of the selected shape layer can be adjusted using the settings icon at the bottom of the Shape layers menu.

Leica GeoMoS Now! Release Notes
29/57
Settings for shape layer transparency and color map can be set. The latter will cause the dynamic change of parameters to be set, depending which color map type (discrete or gradient) has been chosen. Keep in mind that the Shape layer menu takes into account the time selection in the lower right of the menu. To see more of the shape layer’s history, simply increase the time range of the Overview or Site.
ENLARGE THE VIEW OF DASHBOARD GRAPHS
Zoom functionality has been added to Dashboard graphs. The zoom icon is found at the bottom of the graph.
When clicked, the selected graph will fill the screen. This functionality provides a better, more detailed view of the graphs, and therefore better measurement analysis.
Leica GeoMoS Now! Release Notes
30/57
Paging functionality is also available in zoomed form. Navigation through graph pages is done via icons located in the upper left corner. To close the zoom mode, click either on the close icon in upper right corner or click outside of the image.
Leica GeoMoS Now! Release Notes
31/57
What’s new in Version 6.5 released April 2016
OVERVIEW Leica GeoMoS Now! continues to add and improve functionalities. Overview of highlights:
Support of image import, new graph type Standard Images Improved viewing of images Displacement vectors on Overview and Site maps and images Point labels on Overview and Site maps and images
Important note: To use the Leica GeoMoS Now! On-premises version 6.5, install or upgrade to Leica GeoMoS Monitor version 6.5!
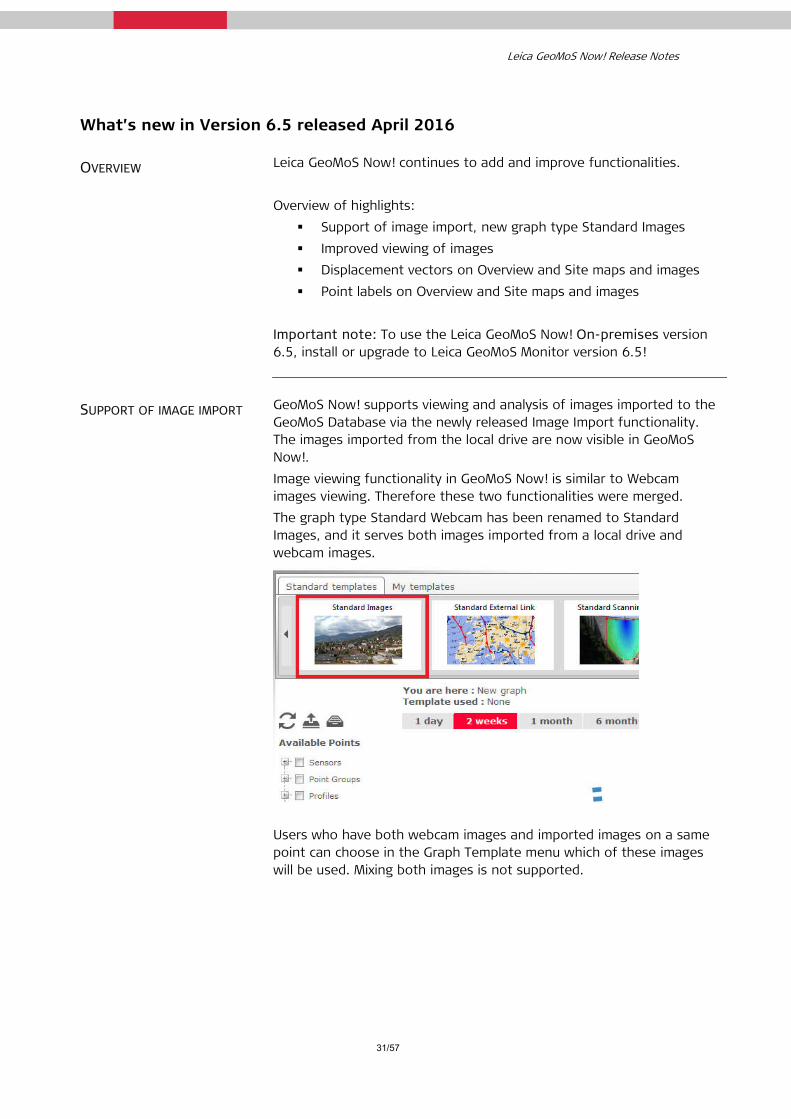
SUPPORT OF IMAGE IMPORT GeoMoS Now! supports viewing and analysis of images imported to the GeoMoS Database via the newly released Image Import functionality. The images imported from the local drive are now visible in GeoMoS Now!. Image viewing functionality in GeoMoS Now! is similar to Webcam images viewing. Therefore these two functionalities were merged. The graph type Standard Webcam has been renamed to Standard Images, and it serves both images imported from a local drive and webcam images.
Users who have both webcam images and imported images on a same point can choose in the Graph Template menu which of these images will be used. Mixing both images is not supported.

Leica GeoMoS Now! Release Notes
32/57
The available type will be automatically selected. For customers who have already created graphs with webcam images, the notation of the old graph template will be preserved.
Please note: It is important for customers already using the GeoMoS Monitor Image Import functionality to create a Manual Push of the database to GeoMoS Now! Cloud. After completing this action, it will be possible to see the images that were imported into the GeoMoS Database. This does not apply for customers using GeoMoS Now! On-premise version.
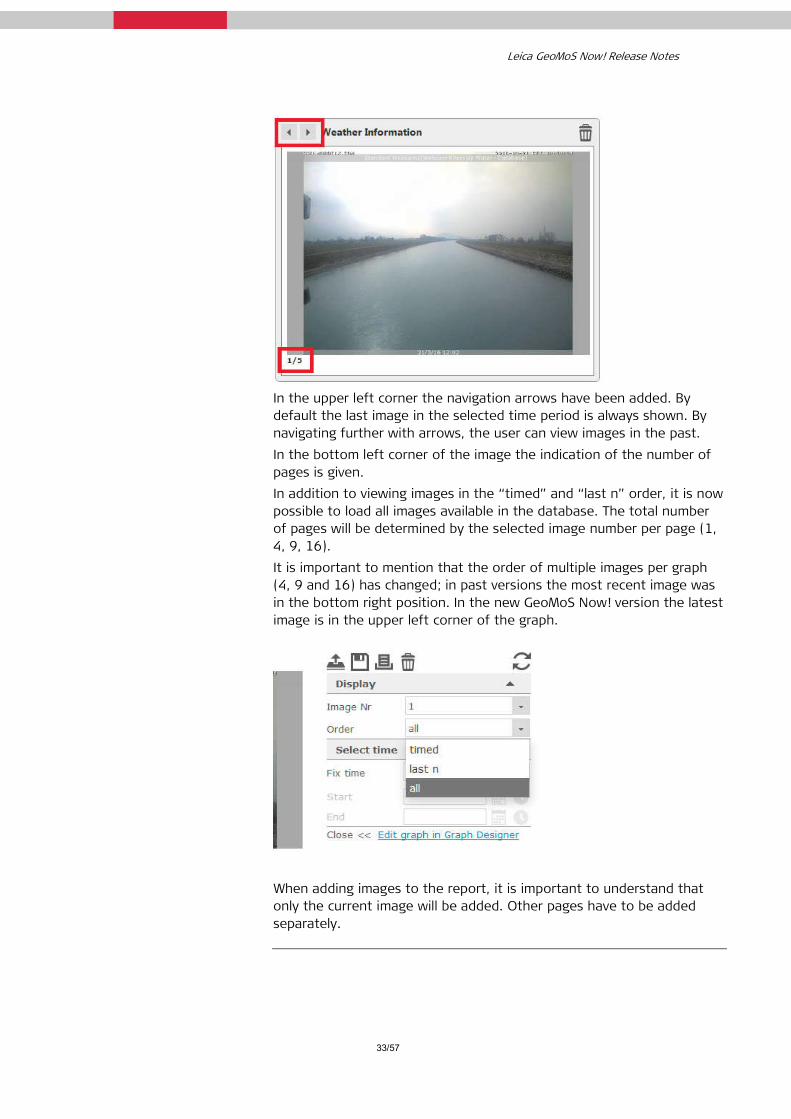
IMPROVED VIEWING OF IMAGES Several improvements have been implemented for easier and more intuitive viewing of the imported and webcam images. The paging function is implemented on images that are added to Dashboard.
Leica GeoMoS Now! Release Notes
33/57
In the upper left corner the navigation arrows have been added. By default the last image in the selected time period is always shown. By navigating further with arrows, the user can view images in the past. In the bottom left corner of the image the indication of the number of pages is given. In addition to viewing images in the “timed” and “last n” order, it is now possible to load all images available in the database. The total number of pages will be determined by the selected image number per page (1, 4, 9, 16). It is important to mention that the order of multiple images per graph (4, 9 and 16) has changed; in past versions the most recent image was in the bottom right position. In the new GeoMoS Now! version the latest image is in the upper left corner of the graph.
When adding images to the report, it is important to understand that only the current image will be added. Other pages have to be added separately.
Leica GeoMoS Now! Release Notes
34/57
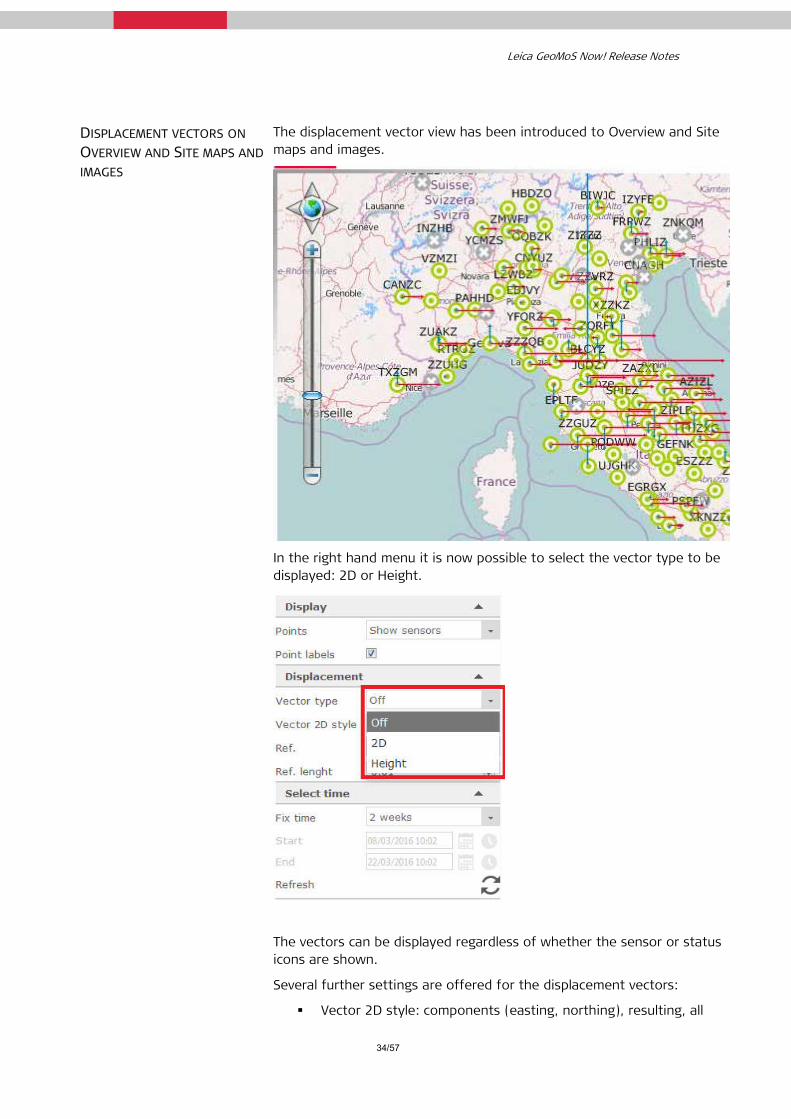
DISPLACEMENT VECTORS ON OVERVIEW AND SITE MAPS AND IMAGES
The displacement vector view has been introduced to Overview and Site maps and images.
In the right hand menu it is now possible to select the vector type to be displayed: 2D or Height.
The vectors can be displayed regardless of whether the sensor or status icons are shown.
Several further settings are offered for the displacement vectors:
Vector 2D style: components (easting, northing), resulting, all
Leica GeoMoS Now! Release Notes
35/57
Reference: start time (with respect to the time selection below) and null (with respect to the null measurement)
Reference length: length of the reference vector
Changing the settings is done on the fly.
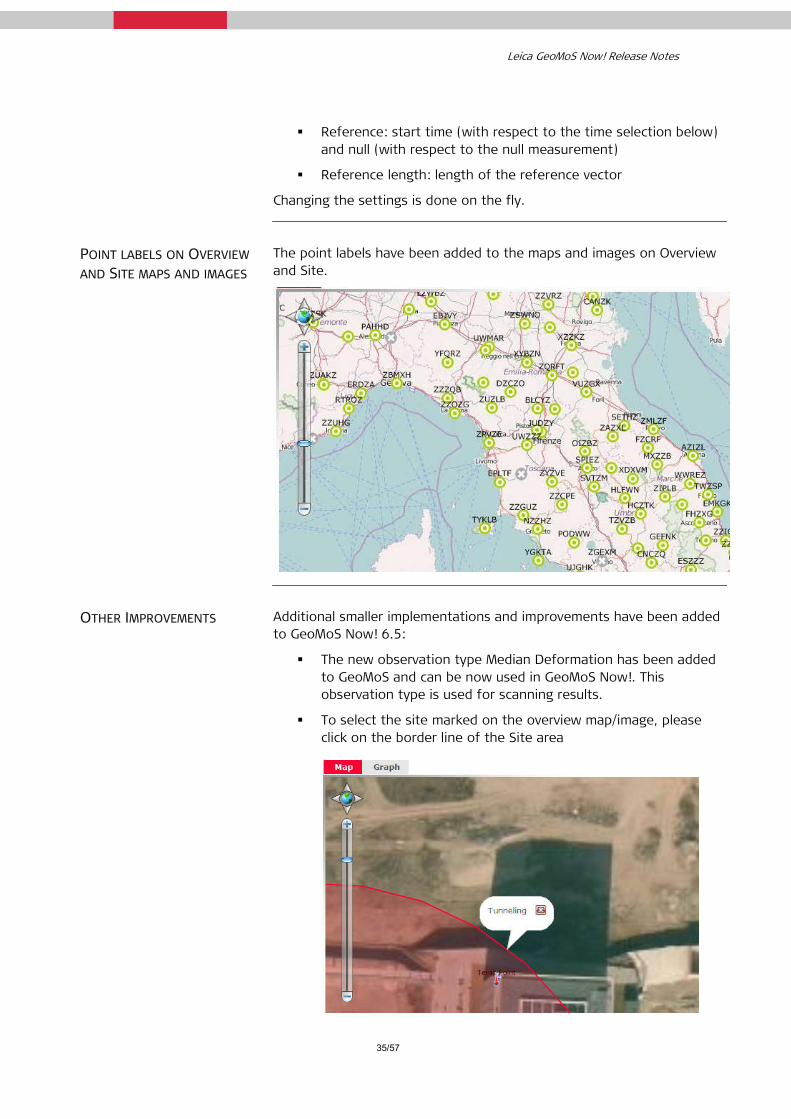
POINT LABELS ON OVERVIEW AND SITE MAPS AND IMAGES
The point labels have been added to the maps and images on Overview and Site.
OTHER IMPROVEMENTS Additional smaller implementations and improvements have been added to GeoMoS Now! 6.5:
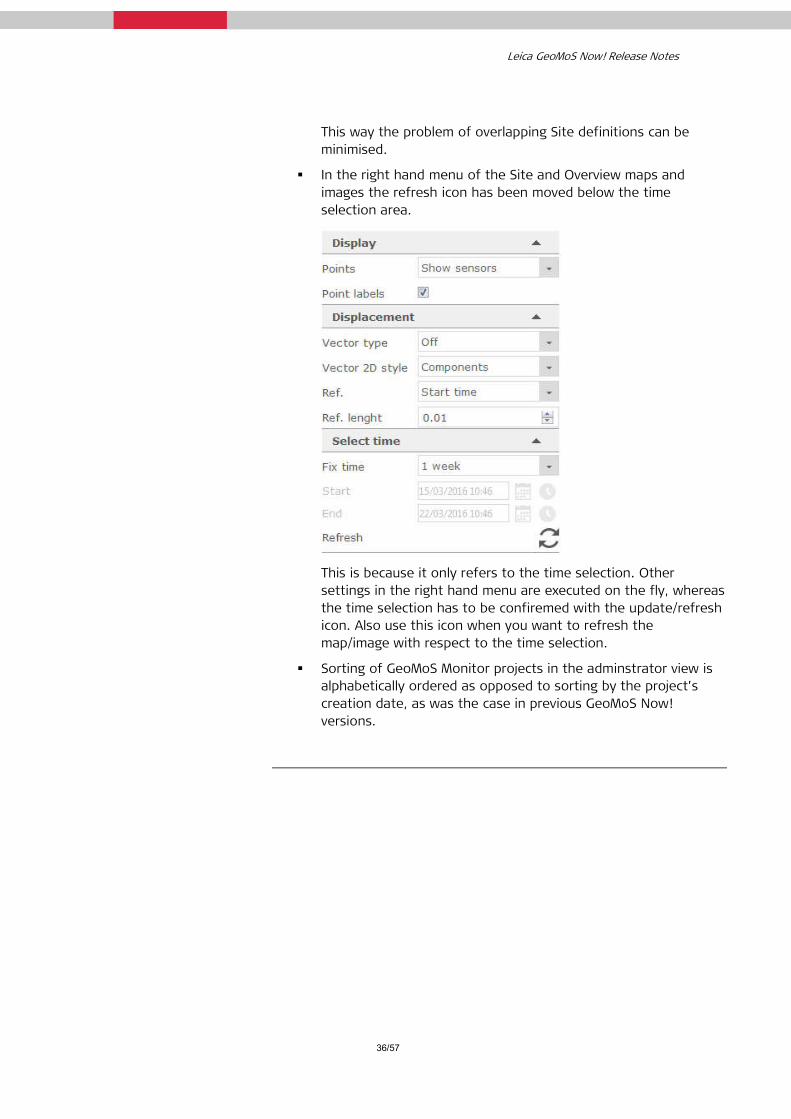
The new observation type Median Deformation has been added to GeoMoS and can be now used in GeoMoS Now!. This observation type is used for scanning results.
To select the site marked on the overview map/image, please click on the border line of the Site area
Leica GeoMoS Now! Release Notes
36/57
This way the problem of overlapping Site definitions can be minimised.
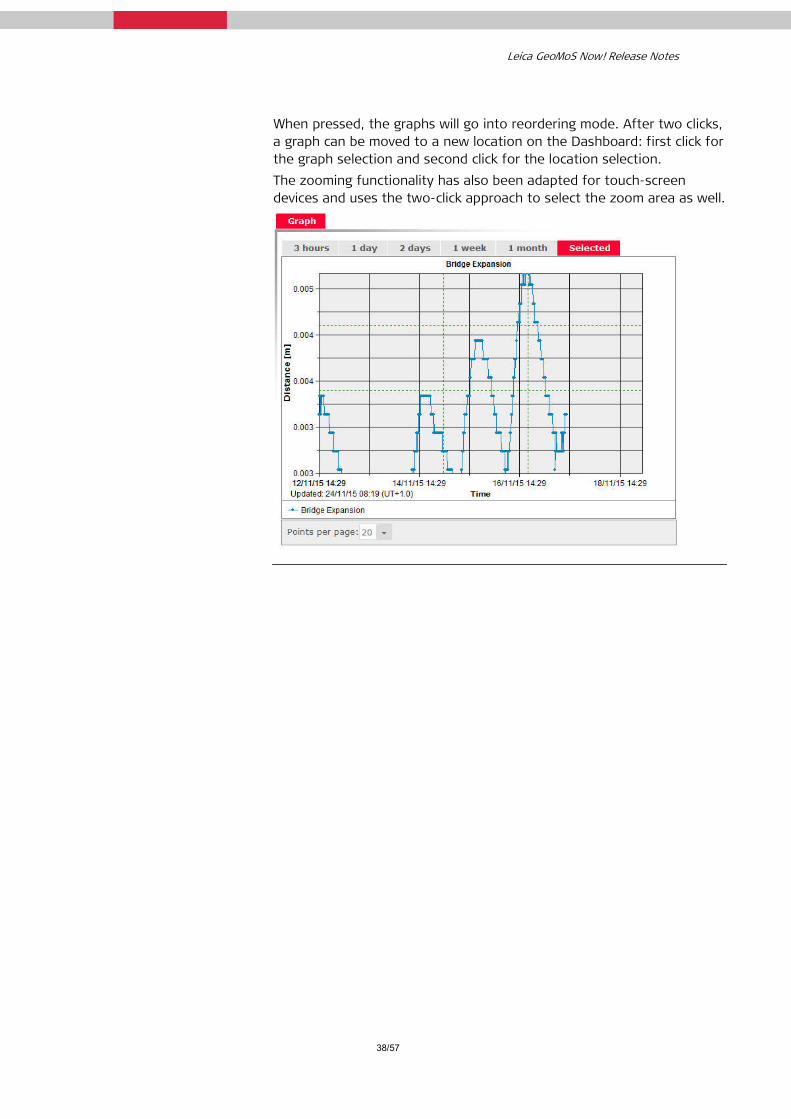
In the right hand menu of the Site and Overview maps and images the refresh icon has been moved below the time selection area.
This is because it only refers to the time selection. Other settings in the right hand menu are executed on the fly, whereas the time selection has to be confiremed with the update/refresh icon. Also use this icon when you want to refresh the map/image with respect to the time selection.
Sorting of GeoMoS Monitor projects in the adminstrator view is alphabetically ordered as opposed to sorting by the project’s creation date, as was the case in previous GeoMoS Now! versions.

Leica GeoMoS Now! Release Notes
37/57
What’s new in Version 6.4 (build 6.4.0.100) released December 2015
OVERVIEW Leica GeoMoS Now! continues to add and improve functionalities. Overview of highlights:
Significantly improved performance of GeoMoS Now! service. Automatic import of the coordinate definition from GeoMoS
Monitor. The GeoMoS Now! Dashboard is now mobile-device ready. Graph
reordering and zooming functionalities have been adapted for touch-screen devices.
Improved data filtering for outlier detection. Overview and site setup improved with automatic zoom to all
points in project. Please note: Due to changes in the Map settings management, it is necessary to update GeoMoS Monitor to at least version 6.2.0.651 in order to take advantage of all the new functionalities in GeoMoS Now!. Since this build, SQL Server Express 2005 is not supported any more. The GeoMoS Monitor installation can be downloaded from myWorld.
GEOMOS NOW! PERFORMANCE
The latest version of GeoMoS Now! has significantly improved performance with up to ten times faster page loading and speed of response. This is particularly noticeable on the Dashboard and Site Graph pages, which can contain numerous graphs with instantly updated content.
AUTOMATIC IMPORT OF COORDINATE DEFINITION
GeoMoS Now! automatically imports the coordinate system of a project assigned in GeoMoS Monitor. The coordinate definition (TRFSET.DAT file) is pushed to the service within the database, which significantly speeds up setup time of GeoMoS Now! projects. Any change to the coordinate system definition in GeoMoS Monitor will automatically apply to GeoMoS Now! when the next data push occurs.
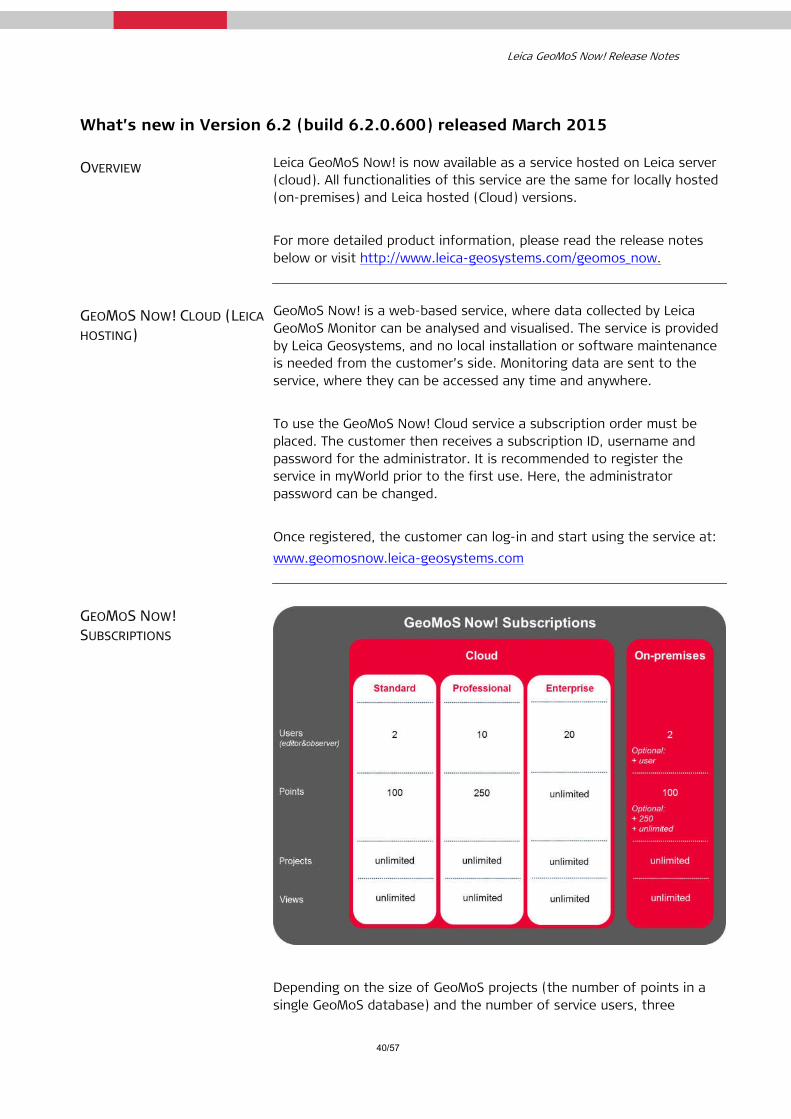
MOBILE-DEVICE READY The Dashboard and Graph pages have been adapted for use on touch-screen devices. This particularly applies to the reordering of graphs on Dashboard and zooming in graphs. A new button has been added to the Dashboard, which activates the reordering functionality.
Leica GeoMoS Now! Release Notes
38/57
When pressed, the graphs will go into reordering mode. After two clicks, a graph can be moved to a new location on the Dashboard: first click for the graph selection and second click for the location selection. The zooming functionality has also been adapted for touch-screen devices and uses the two-click approach to select the zoom area as well.

Leica GeoMoS Now! Release Notes
39/57
IMPROVED DATA FILTERING FOR OUTLIER DETECTION
Navigation and outlier selection is now easier and more user-friendly. Removing multiple outliers can be completed faster with the new “Select all in page” button and the new paging implementation.
OVERVIEW AND SITE SETUP IMPROVEMENTS
Based on the coordinate system delivered from GeoMoS Monitor and coordinates of the points, the Overview map will automatically zoom to the area of the project, and all project points automatically added. This shortens the time needed for setting up a View and allows easier Site creation. In case a user does not want to see particular points on overview or site map, those can be excluded using the Point management tool.
Leica GeoMoS Now! Release Notes
40/57
What’s new in Version 6.2 (build 6.2.0.600) released March 2015
OVERVIEW Leica GeoMoS Now! is now available as a service hosted on Leica server (cloud). All functionalities of this service are the same for locally hosted (on-premises) and Leica hosted (Cloud) versions. For more detailed product information, please read the release notes below or visit http://www.leica-geosystems.com/geomos_now.
GEOMOS NOW! CLOUD (LEICA HOSTING)
GeoMoS Now! is a web-based service, where data collected by Leica GeoMoS Monitor can be analysed and visualised. The service is provided by Leica Geosystems, and no local installation or software maintenance is needed from the customer’s side. Monitoring data are sent to the service, where they can be accessed any time and anywhere. To use the GeoMoS Now! Cloud service a subscription order must be placed. The customer then receives a subscription ID, username and password for the administrator. It is recommended to register the service in myWorld prior to the first use. Here, the administrator password can be changed. Once registered, the customer can log-in and start using the service at: www.geomosnow.leica-geosystems.com
GEOMOS NOW! SUBSCRIPTIONS
Depending on the size of GeoMoS projects (the number of points in a single GeoMoS database) and the number of service users, three

Leica GeoMoS Now! Release Notes
41/57
subscription packages are offered. Alternatively, if the user wishes to install the service locally or within the company’s infrastructure, the GeoMoS Now! On-premises version is available for local installation.
EASY BROWSER-BASED USER AND VIEW MANAGEMENT
The Users and Views Management tool allows the administrator of the Leica GeoMoS Now! to configure views (projects) and users with different user rights for a specific Leica GeoMoS Monitor project. The Users and Views tool can be accessed when logged in to GeoMoS Now! with administrator credentials.
Once the user is created, the administrator can assign multiple projects to this user, either as an editor or an observer. One project can be assigned to multiple users.
GEOMOS NOW! ON-PREMISES (LOCAL HOSTING)
To use the GeoMoS Now! On-premises (locally hosted) software customer defines administrator credentials upon the software installation. Administrator’s password can be changed using the Leica.GeoMoSWeb.Ui.AdministratorLogin.exe program delivered with the software (DVD or myWorld download).
Leica GeoMoS Now! Release Notes
42/57
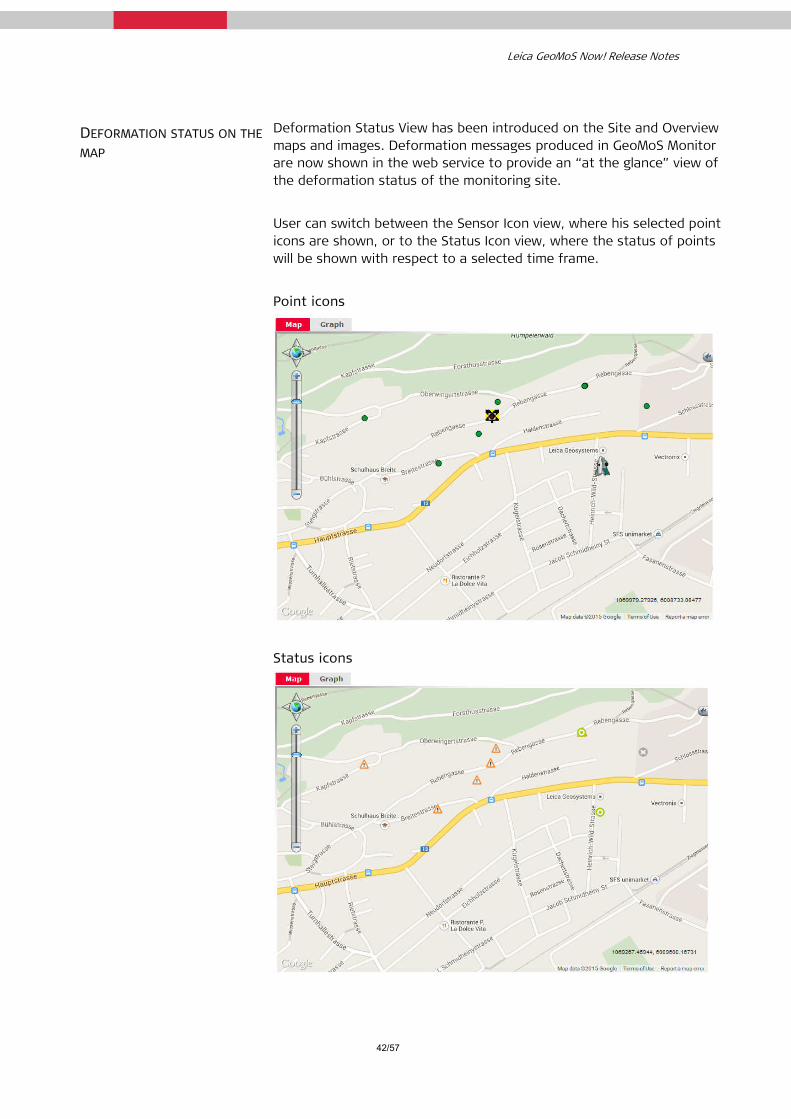
DEFORMATION STATUS ON THE MAP
Deformation Status View has been introduced on the Site and Overview maps and images. Deformation messages produced in GeoMoS Monitor are now shown in the web service to provide an “at the glance” view of the deformation status of the monitoring site. User can switch between the Sensor Icon view, where his selected point icons are shown, or to the Status Icon view, where the status of points will be shown with respect to a selected time frame. Point icons
Status icons
Leica GeoMoS Now! Release Notes
43/57
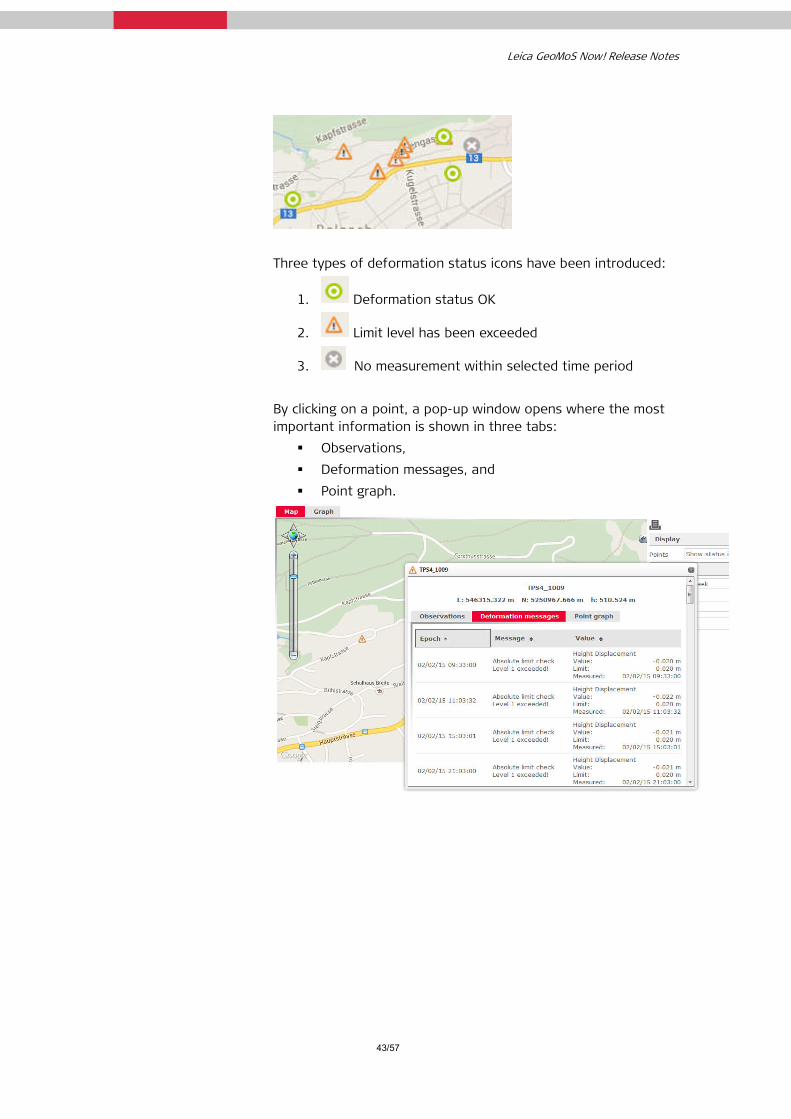
Three types of deformation status icons have been introduced:
1. Deformation status OK
2. Limit level has been exceeded
3. No measurement within selected time period By clicking on a point, a pop-up window opens where the most important information is shown in three tabs:
Observations, Deformation messages, and Point graph.

Leica GeoMoS Now! Release Notes
44/57
NEW EQUIPMENT LIST The Structural Monitoring Equipment List is updated and can be downloaded from the Leica Geosystems homepage.
www.leica-geosystems.com/geomos select the Download tab
VERSION COMPATIBILITY WITH GEOMOS MONITOR
Leica GeoMoS Now! can be used only with Leica GeoMoS Monitor v6.2 and higher.
CLM VERSION GeoMoS software uses CLM build 1.4.1002. This version is part of the installation and update process of the software. This information is only relevant for GeoMoS Now! On-premises version.
Leica GeoMoS Now! Release Notes
45/57
What’s new in Version 6.1 (build 6.1.0.308) released June 2014
OVERVIEW Leica GeoMoS Now! is a web-based application which provides access to monitoring data anywhere, anytime and with any web based device. Monitoring data is presented visually with easy to interpret maps, graphs, images, tables and automatic reports and deformation scans, which quickly convey knowledge and understanding of a monitoring project to customers. For more detailed product information, please visit: http://www.leica-geosystems.com/geomos_now
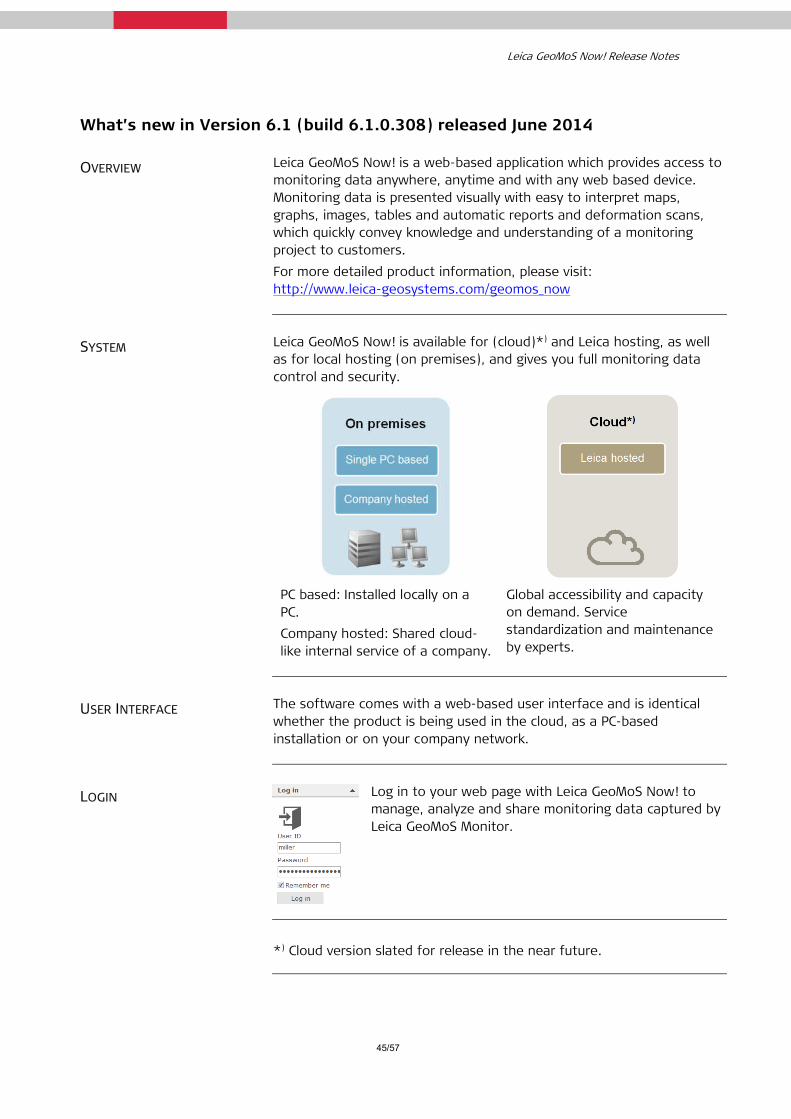
SYSTEM Leica GeoMoS Now! is available for (cloud)*) and Leica hosting, as well as for local hosting (on premises), and gives you full monitoring data control and security.
PC based: Installed locally on a PC. Company hosted: Shared cloud-like internal service of a company.
Global accessibility and capacity on demand. Service standardization and maintenance by experts.
USER INTERFACE The software comes with a web-based user interface and is identical whether the product is being used in the cloud, as a PC-based installation or on your company network.
LOGIN Log in to your web page with Leica GeoMoS Now! to manage, analyze and share monitoring data captured by Leica GeoMoS Monitor.
*) Cloud version slated for release in the near future.
Leica GeoMoS Now! Release Notes
46/57
USERS User management provides full control over user access rights and authorization levels. There are three user group access levels: administrator, editor and observer.
User level Description
Administrator The “administrator” is solely responsible for software installation, license activation and user and view management.
Editor
The “editor” of the project can follow the available wizards step-by-step to set up units or time settings or to upload images or geo-reference maps and create graphs for customers needs and project requirements. The “editor” configures the web page content of the views.
Observer
An “observer” has basic-level access to the monitoring data. An “observer” can navigate through graphs (on the dashboard, in the overview and on sites) and receive reports.
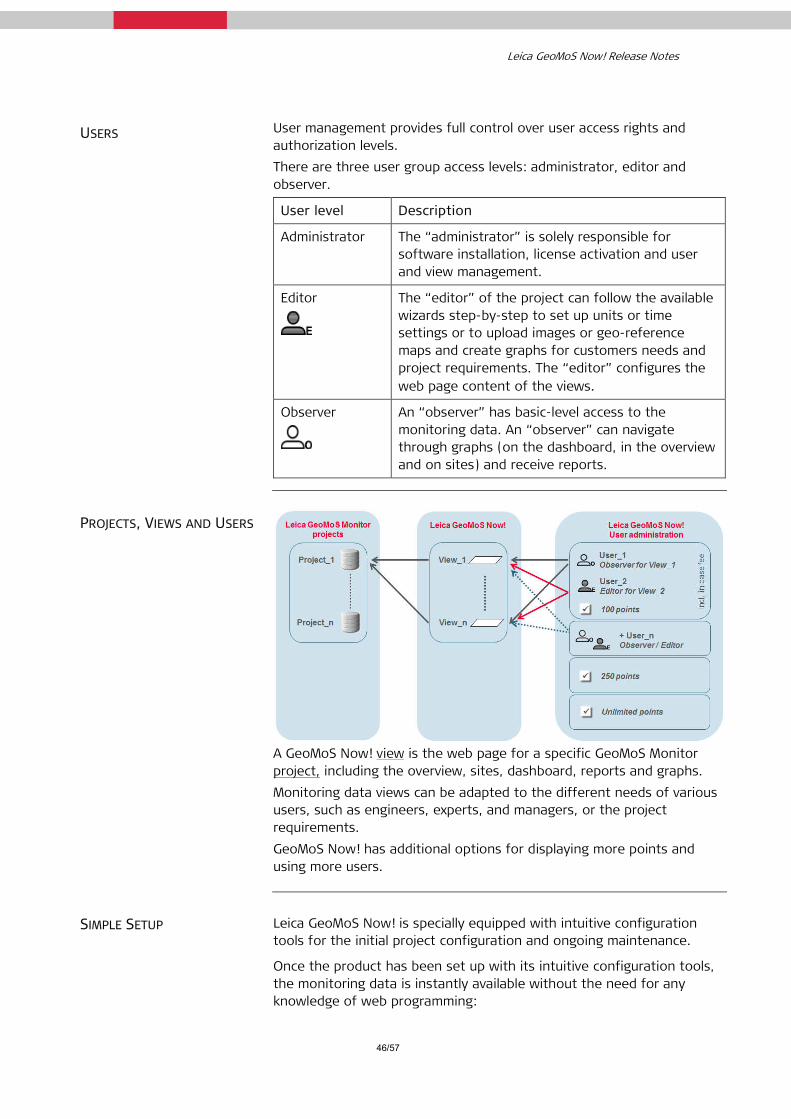
PROJECTS, VIEWS AND USERS
A GeoMoS Now! view is the web page for a specific GeoMoS Monitor project, including the overview, sites, dashboard, reports and graphs. Monitoring data views can be adapted to the different needs of various users, such as engineers, experts, and managers, or the project requirements. GeoMoS Now! has additional options for displaying more points and using more users.
SIMPLE SETUP Leica GeoMoS Now! is specially equipped with intuitive configuration tools for the initial project configuration and ongoing maintenance.
Once the product has been set up with its intuitive configuration tools, the monitoring data is instantly available without the need for any knowledge of web programming:
Leica GeoMoS Now! Release Notes
47/57
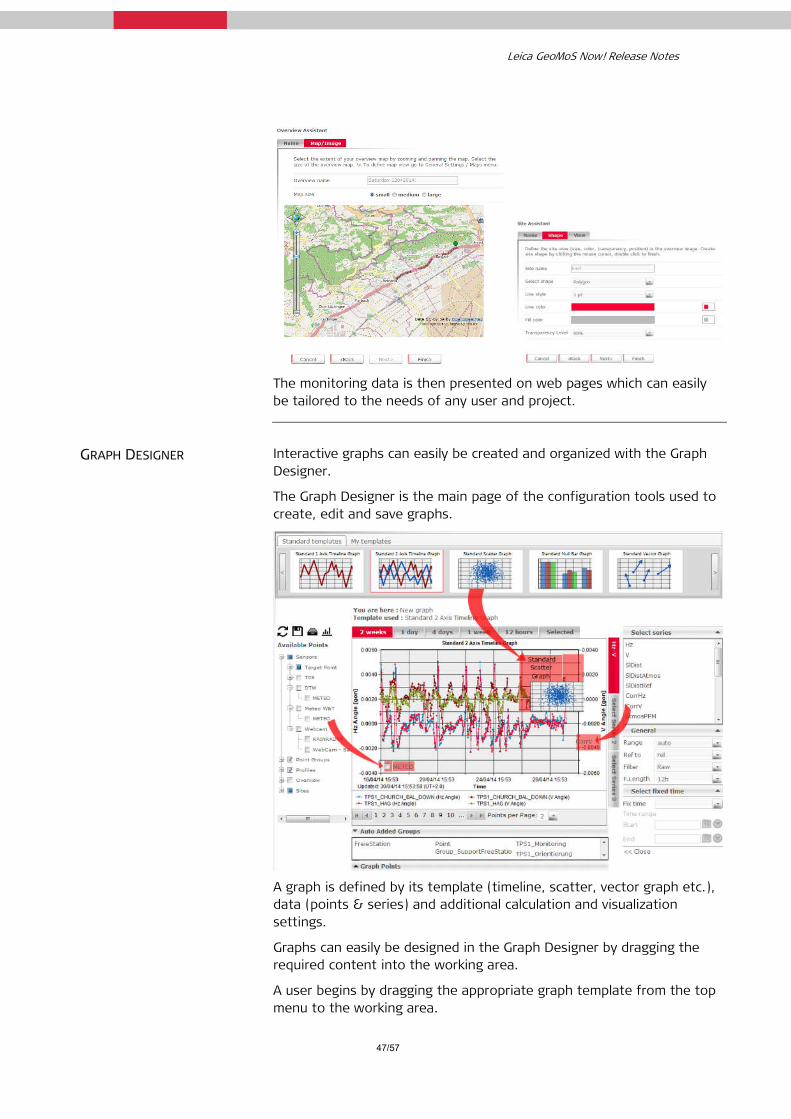
The monitoring data is then presented on web pages which can easily be tailored to the needs of any user and project.
GRAPH DESIGNER Interactive graphs can easily be created and organized with the Graph Designer.
The Graph Designer is the main page of the configuration tools used to create, edit and save graphs.
A graph is defined by its template (timeline, scatter, vector graph etc.), data (points & series) and additional calculation and visualization settings.
Graphs can easily be designed in the Graph Designer by dragging the required content into the working area.
A user begins by dragging the appropriate graph template from the top menu to the working area.

Leica GeoMoS Now! Release Notes
48/57
Then the user defines the points to be visualized with the previously selected graph template using the menu on the left-hand side.
The graph is finalized by making various display settings, such as the data series, viewing options (relative or absolute) and filter options,
using the menu on the right-hand side. Using the menu, advanced users can also change more detailed settings, such as colors, pre-defined scale ranges etc.
Graphs can be saved in various locations by being added to an overview, any of the sites, the dashboard, a report template or a “My Graphs” folder for later reuse.
REAL-TIME ANALYSIS WITH A VARIETY OF GRAPHS
Display monitoring data quickly using interactive graphs like these:
Timeline graphs (with one or two series and limit information)
Scatter graphs (monochrome or color-coded)
Vector graphs (2D or height)
Webcam images and live web images from the Internet
Bar graphs
Circular level graphs
Leica GeoMoS Now! Release Notes
49/57
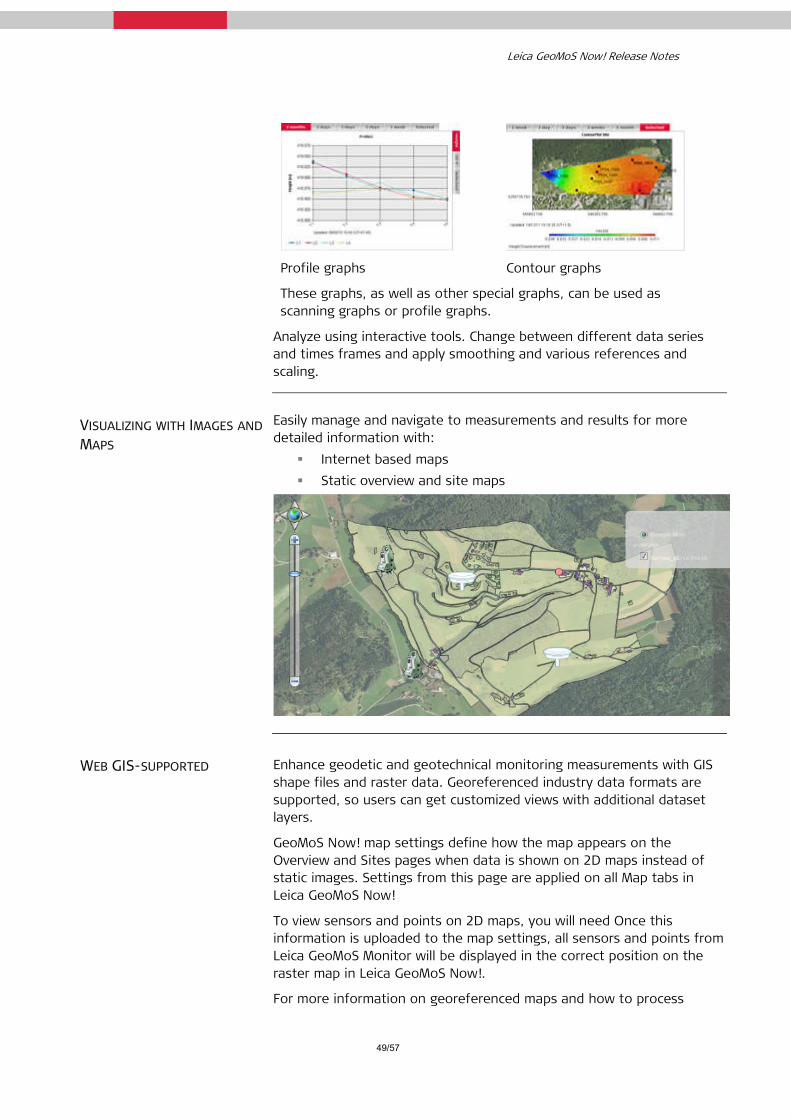
Profile graphs
Contour graphs
These graphs, as well as other special graphs, can be used as scanning graphs or profile graphs.
Analyze using interactive tools. Change between different data series and times frames and apply smoothing and various references and scaling.
VISUALIZING WITH IMAGES AND MAPS
Easily manage and navigate to measurements and results for more detailed information with:
Internet based maps Static overview and site maps
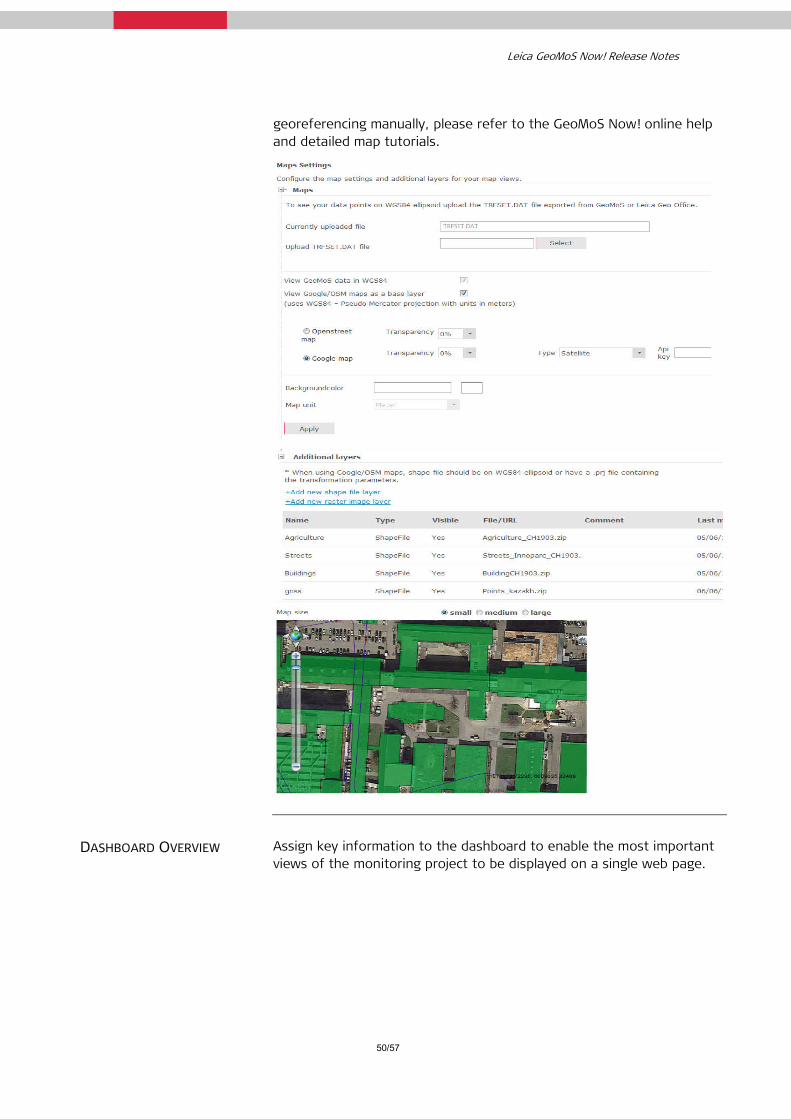
WEB GIS-SUPPORTED Enhance geodetic and geotechnical monitoring measurements with GIS shape files and raster data. Georeferenced industry data formats are supported, so users can get customized views with additional dataset layers.
GeoMoS Now! map settings define how the map appears on the Overview and Sites pages when data is shown on 2D maps instead of static images. Settings from this page are applied on all Map tabs in Leica GeoMoS Now!
To view sensors and points on 2D maps, you will need Once this information is uploaded to the map settings, all sensors and points from Leica GeoMoS Monitor will be displayed in the correct position on the raster map in Leica GeoMoS Now!.
For more information on georeferenced maps and how to process
Leica GeoMoS Now! Release Notes
50/57
georeferencing manually, please refer to the GeoMoS Now! online help and detailed map tutorials.
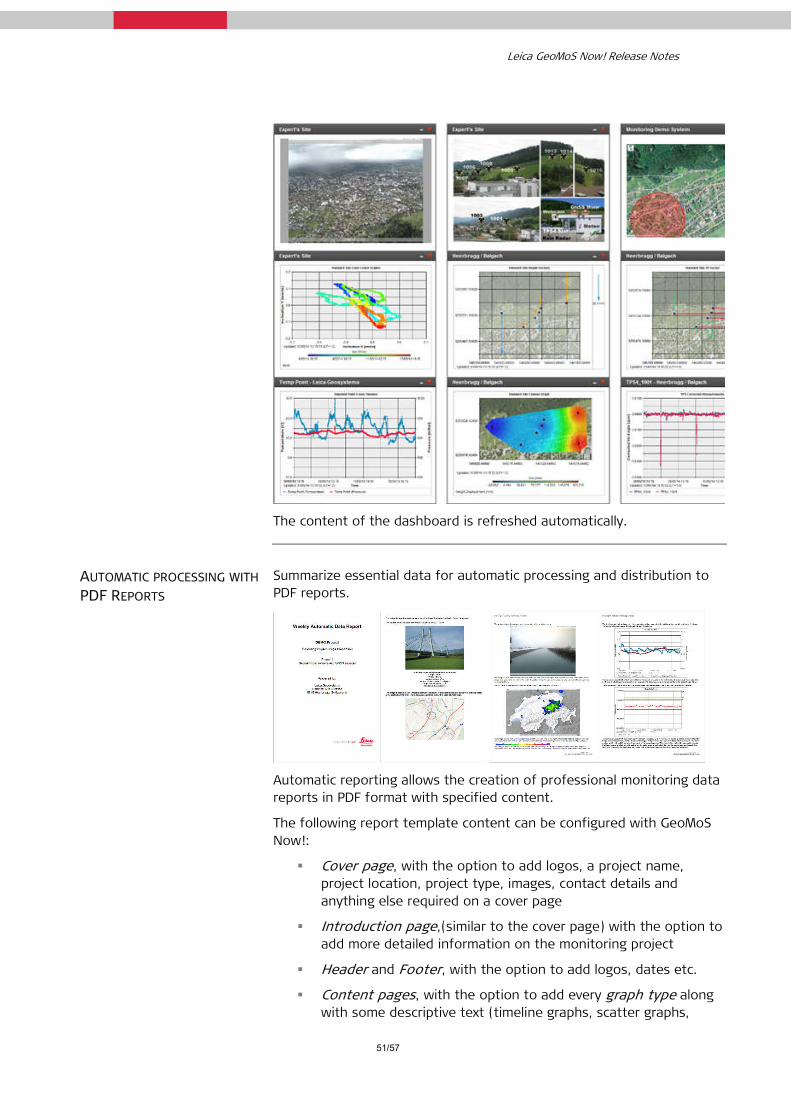
DASHBOARD OVERVIEW Assign key information to the dashboard to enable the most important views of the monitoring project to be displayed on a single web page.
Leica GeoMoS Now! Release Notes
51/57
The content of the dashboard is refreshed automatically.
AUTOMATIC PROCESSING WITH PDF REPORTS
Summarize essential data for automatic processing and distribution to PDF reports.
Automatic reporting allows the creation of professional monitoring data reports in PDF format with specified content.
The following report template content can be configured with GeoMoS Now!:
Cover page, with the option to add logos, a project name, project location, project type, images, contact details and anything else required on a cover page
Introduction page,(similar to the cover page) with the option to add more detailed information on the monitoring project
Header and Footer, with the option to add logos, dates etc.
Content pages, with the option to add every graph type along with some descriptive text (timeline graphs, scatter graphs,
Leica GeoMoS Now! Release Notes
52/57
vector graphs, images etc.) showing the current monitoring data measured in GeoMoS Now!. Historical information can also be added to the content.
Back page, with the option to add company information, legal details etc.
For example, users can import existing MS Word report content into a GeoMoS Now! report via HTML.
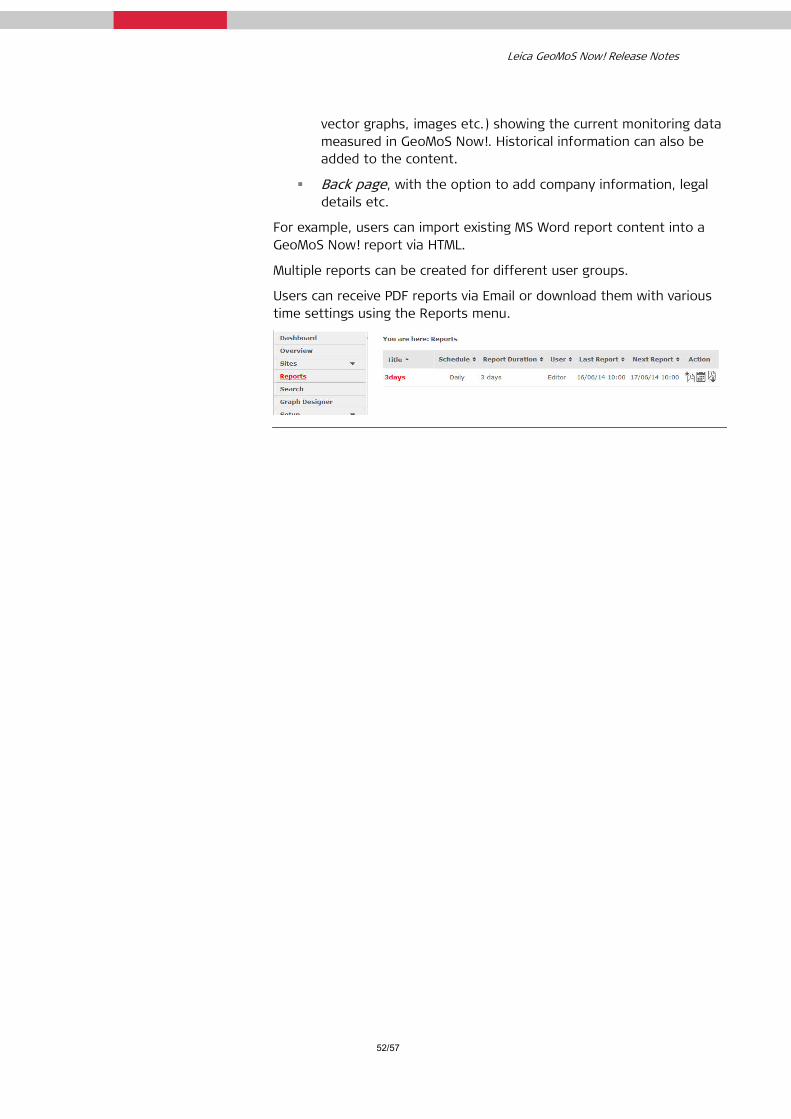
Multiple reports can be created for different user groups.
Users can receive PDF reports via Email or download them with various time settings using the Reports menu.
Leica GeoMoS Now! Release Notes
53/57
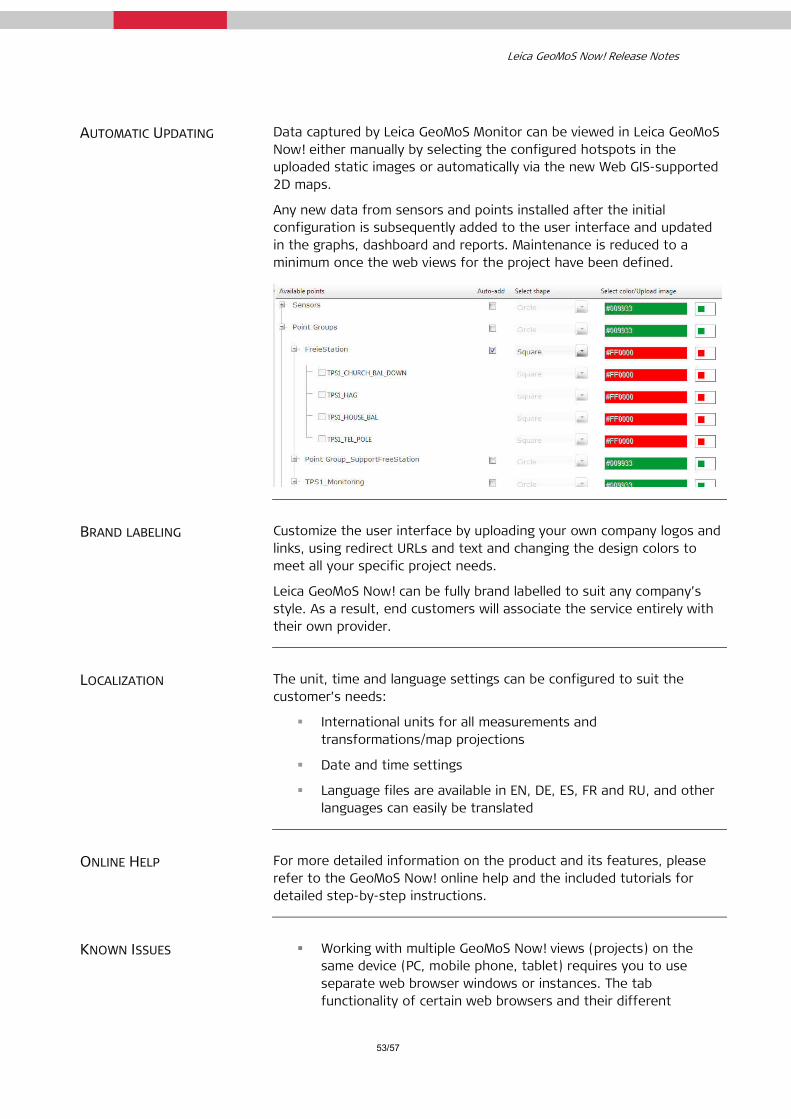
AUTOMATIC UPDATING Data captured by Leica GeoMoS Monitor can be viewed in Leica GeoMoS Now! either manually by selecting the configured hotspots in the uploaded static images or automatically via the new Web GIS-supported 2D maps.
Any new data from sensors and points installed after the initial configuration is subsequently added to the user interface and updated in the graphs, dashboard and reports. Maintenance is reduced to a minimum once the web views for the project have been defined.
BRAND LABELING Customize the user interface by uploading your own company logos and links, using redirect URLs and text and changing the design colors to meet all your specific project needs.
Leica GeoMoS Now! can be fully brand labelled to suit any company’s style. As a result, end customers will associate the service entirely with their own provider.
LOCALIZATION The unit, time and language settings can be configured to suit the customer’s needs:
International units for all measurements and transformations/map projections
Date and time settings
Language files are available in EN, DE, ES, FR and RU, and other languages can easily be translated
ONLINE HELP For more detailed information on the product and its features, please refer to the GeoMoS Now! online help and the included tutorials for detailed step-by-step instructions.
KNOWN ISSUES Working with multiple GeoMoS Now! views (projects) on the same device (PC, mobile phone, tablet) requires you to use separate web browser windows or instances. The tab functionality of certain web browsers and their different

Leica GeoMoS Now! Release Notes
54/57
versions may have issues handling different methods of access correctly.

Leica GeoMoS Now! Release Notes
55/57
Technical Specifications
ONE PRODUCT – TWO PLATFORMS
Leica GeoMoS Now! On-premises can be installed locally, on your PC or network. The user interface for end customers is identical in each case.
WHEN TO USE IT Leica GeoMoS Now! can be used to display GeoMoS Monitor data with various images, maps and graphs.
At a minimum, Leica GeoMoS Monitor version 6.3 is required for data acquisition.
SUPPORTED OPERATING SYSTEMS FOR GEOMOS NOW! ON-PREMISES
Operating system Min. service pack GeoMoS Now! version
Windows 10 -
Windows 8 -
Windows 7 SP1
Windows Server 2012 R2 -
Windows Server 2012 -
Windows Server 2008 R2 -
When using Windows 7, 8 or any of the Server platforms, GeoMoS Now! can only be sucessfully installed if the user is logged in as “Users” and enters an administrator password when starting the installation procedure.
SUPPORTED WEB BROWSERS Leica GeoMoS Now! supports the following web browsers:
Recommended web browsers Minimum version
Internet Explorer 10 or higher (recommended version: 11 or higher)
Mozilla Firefox 28.0 or higher
Chrome 34.0.1847.116 or higher
Partially supported web browsers
Minimum version
Opera 9.5 or higher
Safari 3.1 or higher
Note: Other web browsers may slightly alter the appearance of the user interface.
Leica GeoMoS Now! Release Notes
56/57
Leica Geosystems AG Geomatics Division GNSS Reference Stations and Structural Monitoring Group www.leica-geosystems.com
Leica Geosystems AG, Heerbrugg,
Switzerland, has been certified as
being equipped with a quality
system which meets the
International Standards of Quality
Management and Quality Systems
(ISO standard 9001) and
Environmental Management
Systems (ISO standard 14001).
Total Quality Management-
Our commitment to total customer
satisfaction.
Ask your local Leica agent for
more information about our
TQM program