Lehrstuhl für Physiologie - mediaTUMmediatum.ub.tum.de/doc/1127932/1127932.pdf · TECHNISCHE...
117
TECHNISCHE UNIVERSITÄT MÜNCHEN Lehrstuhl für Physiologie Functional characterization and comparison of the intra-mammary immune system of ancient and modern cattle breeds Diana Anna Clara Sorg Vollständiger Abdruck der von der Fakultät Wissenschaftszentrum Weihenstephan für Ernährung, Landnutzung und Umwelt der Technischen Universität München zur Erlangung des akademischen Grades eines Doktors der Naturwissenschaften genehmigten Dissertation. Vorsitzender: Univ.-Prof. Dr. M. Klingenspor Prüfer der Dissertation: 1. Univ.-Prof. Dr. M. W. Pfaffl 2. Priv.-Doz. Dr. Dr. K. Frölich (Universität Hildesheim) Die Dissertation wurde am 18.12.2012 bei der Technischen Universität München eingereicht und durch die Fakultät Wissenschaftszentrum Weihenstephan für Ernährung, Landnutzung und Umwelt am 08.04.2013 angenommen.
-
Upload
nguyenlien -
Category
Documents
-
view
216 -
download
0
Transcript of Lehrstuhl für Physiologie - mediaTUMmediatum.ub.tum.de/doc/1127932/1127932.pdf · TECHNISCHE...

TECHNISCHE UNIVERSITÄT MÜNCHEN
Lehrstuhl für Physiologie
Functional characterization and comparison
of the intra-mammary immune system
of ancient and modern cattle breeds
Diana Anna Clara Sorg
Vollständiger Abdruck der von der Fakultät Wissenschaftszentrum Weihenstephan
für Ernährung, Landnutzung und Umwelt der Technischen Universität München zur
Erlangung des akademischen Grades eines
Doktors der Naturwissenschaften
genehmigten Dissertation.
Vorsitzender: Univ.-Prof. Dr. M. Klingenspor
Prüfer der Dissertation:
1. Univ.-Prof. Dr. M. W. Pfaffl
2. Priv.-Doz. Dr. Dr. K. Frölich
(Universität Hildesheim)
Die Dissertation wurde am 18.12.2012 bei der Technischen Universität München
eingereicht und durch die Fakultät Wissenschaftszentrum Weihenstephan für
Ernährung, Landnutzung und Umwelt am 08.04.2013 angenommen.
Table of contents
1
Table of contents
Table of contents ................................................................................................................... 1
Abbreviations ........................................................................................................................ 3
Summary ............................................................................................................................... 6
Zusammenfassung ................................................................................................................ 8
1. Introduction ...................................................................................................................10
1.1. Bovine Mastitis .................................................................................................. 10
1.2. Innate immune response .................................................................................... 11
1.3. Genetic resistance to mastitis ............................................................................ 15
1.4. Cattle breeds ..................................................................................................... 16
1.4.1. White Park cattle .............................................................................................16
1.4.2. Highland cattle ................................................................................................17
1.4.3. Brown Swiss ...................................................................................................18
1.4.4. Red Holstein ...................................................................................................19
2. Aim of the study.............................................................................................................21
3. Material and methods ....................................................................................................22
3.1. Animals ............................................................................................................. 22
3.2. Bacteria ............................................................................................................. 22
3.3. Cell culture ........................................................................................................ 23
3.4. Immunocytochemistry ....................................................................................... 26
3.5. Total RNA extraction and reverse transcription .................................................. 27
3.6. Gene expression with reverse transcription quantitative PCR (RT-qPCR) ......... 27
3.7. Data analysis of the RT-qPCR ........................................................................... 33
3.8. Protein quantification with ELISA....................................................................... 34
3.9. Data analysis of the ELISA ................................................................................ 37

Table of contents
2
4. Results and discussion ..................................................................................................39
4.1. Cell culture and immunocytochemistry .............................................................. 39
4.2. Gene expression of the cell culture comparison ................................................ 41
4.3. Technical evaluation of the Fluidigm BioMark HD™ measurements .................. 44
4.4. Gene expression and protein production of the innate immune response .......... 47
5. Conclusions ...................................................................................................................64
6. References ....................................................................................................................65
Acknowledgments ................................................................................................................74
Scientific communications ....................................................................................................75
Curriculum Vitae ...................................................................................................................77
Appendix ..............................................................................................................................78
Abbreviations
3
Abbreviations
ACTG1 Actin, gamma 1
AMP Antimicrobial peptide
ANOVA Analysis of variance
BCA Bicin chinoninic acid
BCMS British Cattle Movement Service
BS Brown Swiss
BSA Bovine serum albumin
C Celsius
C1QA Complement component 1,
q subcomponent, A chain (gene)
C3 Complement component 3
C3AR C3a anaphylatoxin chemotactic receptor
(protein)
C3AR1 Complement component 3a receptor 1
(gene)
C5 Complement component 5
C5AR C5a anaphylatoxin chemotactic receptor
(protein)
C5AR1 Complement component 5a receptor 1
(gene)
C6 Complement component 6
C7 Complement component 7
C8 Complement component 8
C9 Complement component 9
CASP1 Caspase 1
CASP8 Caspase 8
CCL2 Chemokine (C-C motif) ligand 2
CCL5 Chemokine (C-C motif) ligand 5
CCL20 Chemokine (C-C motif) ligand 20
CD14 Monocyte differentiation antigen CD14
CD68 Macrosialin
CD163 Scavenger receptor cysteine-rich type 1
protein M130
cDNA Complementary DNA
Cq Cycle of quantification
CXCL5 Chemokine (C-X-C motif) ligand 5
DAB 3,3’-diaminobenzidine
DMEM Dulbecco’s Modified Eagle’s Medium
DMSO Dimethyl sulfoxide
DNA Deoxyribonucleic acid
DNAse Deoxyribonuclease
dNTP Deoxyribonucleotide
ELISA Enzyme-linked immunosorbent assay
FAO Food and Agriculture Organization
FBS Fetal bovine serum
g Gram
g Standard gravity
GAPDH Glyceraldehyd-3-phosphate
dehydrogenase
h Hour
H3F3A H3 histone, family 3A
HBSS Hank’s balanced salt solution
HLD Highland
HRP Horseradish peroxidase
HP Haptoglobin
IL1B Interleukin 1, beta (gene)
IL-1b Interleukin-1, beta (protein)
IL6 Interleukin 6 (gene)
IL-6 Interleukin-6 (protein)
IL8 Interleukin 8 (gene)
IL-8 Interleukin-8 (protein)
IL10 Interleukin 10 (gene)
Abbreviations
4
IL-10 Interleukin-10 (protein)
IRF3 Interferon regulatory factor 3
ITS Insulin, transferrin, sodium selenite
IU International units
KRT8 Keratin 8
l Litre
LAM Lipoarabinomannan
LAP Lingual antimicrobial peptide
LBP Lipopolysaccharide binding protein
LF Lactoferrin
LP Lipoprotein
LPO Lactoperoxidase
LTA Lipoteichoic acid
LY96 Lymphocyte antigen 96
LYZ1 Lysozyme 1, milk isozyme
mg Milligram
min Minute
MOI Multiplicity of infection
MYD88 Myeloid differentiation primary response
gene (88)
MyD88 Myeloid differentiation primary response
protein (88)
µg Microgram
µl Microlitre
MX1 Myxovirus (influenza virus) resistance 1,
interferon inducible protein p78 (mouse)
(gene)
Mx1 Interferon-induced GTP-binding protein
Mx1
MX2 Myxovirus (influenza virus) resistance 2
(mouse) (gene)
Mx2 Interferon-induced GTP-binding protein
Mx2
NF-kB Nuclear factor kappa B
ng Nanogram
NLRP1 NLR family, pyrin domain containing 1
(gene); NACHT, LRR and PYD domains-
containing protein 1 (protein)
NLRP3 NLR family, pyrin domain containing 3
(gene); NACHT, LRR and PYD domains-
containing protein 3 (protein)
nm Nanometre
OD Optical density
p65 Transcription factor p65
pbMEC primary bovine mammary epithelial cells
pbMEC I pbMEC for comparison of tissue and milk
extraction
pbMEC II pbMEC for comparison of modern and
ancient cattle breeds
PBS Phosphate buffered saline
PBST PBS-Tween20
PCA Principal component analysis
PGS Peptidoglycans
RBST Rare Breeds Survival Trust
RELA V-rel reticuloendotheliosis viral oncogene
homolog A (avian)
RH Red Holstein
RNA Ribonucleic acid
ROS Reactive oxygen species
RT Reverse transcription
RT-qPCR Reverse transcription quantitative
polymerase chain reaction
S100A9 S100 calcium binding protein A9 (gene)
S100-A9 S100 calcium binding protein A9
S100A12 S100 calcium binding protein A12 (gene)
S100-A12 S100 calcium binding protein A12
Abbreviations
5
SAA Serum amyloid A (protein)
SAA3 Serum Amyloid A3 (gene)
SCC Somatic cell count
sec Second
SHRP Streptavidin horseradish peroxidase
TAP Tracheal antimicrobial peptide
TGFB1 Transforming growth factor beta 1 (gene)
TGFb-1 Transforming growth factor beta 1 (protein)
TLR Toll-like receptor
TLR2 Toll-like receptor 2
TLR4 Toll-like receptor 4
TNF Tumor necrosis factor
U Units
UBB Ubiquitine B
VIM Vimentin
TGRDEU Central Documentation on Animal
Genetic Resources in Germany
TMB 3,3,5,5-tetramethylbenzidine
WP White Park
YWHAZ Tyrosine 3-monooxygenase/tryptophan 5-
monooxygenase activation protein, zeta
polypeptide
Summary
6
Summary
Mastitis, or inflammation of the udder, is a common disease of modern dairy cows. Invading
pathogens like Escherichia coli (E. coli) and Staphylococcus aureus (S. aureus) often cause
acute or chronic infections which lead to financial losses for the farmer and diminished
welfare of the animal. Beside antibiotic therapy and improved milking and bedding hygiene,
one approach is to breed animals that are genetically less susceptible. Ancient cattle breeds
that have not intensively been selected for high milk yield are observed to show less
symptoms of mastitis and are suspected to be less susceptible to this disease. We chose the
ancient Highland (HLD) and White Park (WP) cattle (n=5) and the modern dairy breeds
Brown Swiss (BS) and Red Holstein (RH) (n=6) to investigate possible breed differences in
the innate immune response of their primary bovine mammary epithelial cells (pbMEC) in
vitro. These were cultivated from milk and stimulated with heat-inactivated E. coli and S.
aureus. Gene expression of 28 innate immune genes (complement system, inflammatory
cytokines, chemokines, TLR pathway, acute phase proteins, scavenger receptors and others)
was measured via reverse transcription quantitative polymerase chain reaction (RT-qPCR)
on a high-throughput platform. The antimicrobial peptide lactoferrin (LF), the anti-
inflammatory cytokine interleukin-10 (IL-10) and the acute phase protein serum amyloid A
(SAA) were quantified in the cell protein extract with the enzyme-linked immunosorbent
assay (ELISA). The breeds activated generally the same pathways at comparable levels.
Differences in basal expression were observed in 16 genes (P<0.05), but no consistent
ranking of the breeds could be made except for the finding that the TLR pathway
components were more highly expressed in the ancient breeds. However, a principal
component analysis (PCA) on basal gene expression levels showed a visible separation of
the ancient from the modern breeds and from BS and RH. Fold changes of expression were
only significantly different in complement component 3 (C3), chemokine (C-C motif) ligand 2
(CCL2), lactoperoxidase (LPO), caspase 8 (CASP8), monocyte differentiation antigen CD14
(CD14), lymphocyte antigen 96 (LY96), transforming growth factor beta 1 (TGFB1) and S100
calcium binding protein A12 (S100A12) (P<0.05). While the PCA on the regulation of gene
expression after stimulation revealed no visible clustering of the breeds, there was a higher
number of up regulated genes (P<0.05) in the modern breeds. HLD had higher basal and E.
coli treated levels of LF protein and higher basal and S. aureus treated levels of SAA protein
than the modern breeds. In addition to that, there was considerable between-cow variation in
gene expression and protein production. Generally, the picture of the immune responses of
the different breeds remains heterogeneous and diffuse, but it could be suspected that in the
ancient breeds a higher basal level of a part of the innate immune system lead to a less

Summary
7
pronounced response. Breed differences in details of the innate immune system, but also
breed-conserved activation of innate immune pathways have been previously described, as
well as the large animal-to-animal variation that we found which remains subject to further
research.
Zusammenfassung
8
Zusammenfassung
Mastitis, auch Euterentzündung genannt, ist eine häufige Erkrankung bei modernen
Milchkühen. Eindringende Pathogene wie Escherichia coli (E. coli) und Staphylococcus
aureus (S. aureus) rufen oft akute oder chronische Infektionen hervor, die zu finanziellen
Einbußen bei den Landwirten und zur Beeinträchtigung des Tierwohls führen. Neben der
Behandlung mit Antibiotika und verbesserter Melk- und Stallhygiene ist es ein Ansatz, Tiere
zu züchten, die genetisch weniger anfällig gegenüber Mastitis sind. Alte Rinderrassen, die
weniger auf hohe Milchleistung selektiert wurden, zeigen weniger Symptome von Mastitis
und sind vermutlich weniger anfällig für diese Krankheit. Wir wählten die alten Rassen
Schottisches Hochlandrind (HLD) und Englisches Parkrind (WP) (n=5), sowie die modernen
Milchrassen Braunvieh (BS) und rot-weißes Holstein (RH), um mögliche Unterschiede in der
angeborenen Immunantwort ihrer primären bovinen Euterepithelzellen (pbMEC) in vitro zu
untersuchen. Diese wurden aus der Milch kultiviert und mit Hitze-inaktivierten E. coli und S.
aureus stimuliert. Die Expression von 28 Genen des angeborenen Immunsystems
(Komplementsystem, inflammatorische Zytokine, Chemokine, TLR-Signalübertragung, Akut-
Phase-Proteine, Scavenger-Rezeptoren und andere) wurde mittels Reverser Transkriptase-
quantitativer Polymerase-Kettenreaktion (RT-qPCR) auf einer Hochdurchsatz-Plattform
gemessen. Das antimikrobielle Peptid Lactoferrin (LF), das anti-inflammatorische Zytokin
Interleukin-10 (IL-10) und das Akut-Phase-Protein Serum Amyloid A (SAA) wurden im
Zellproteinextrakt mit einem Enzyme Linked Immunosorbent Assay (ELISA) quantifiziert. Die
Rassen aktivierten generell dieselben Immunsystemkomponenten auf vergleichbaren
physiologischen Niveaus. Unterschiede in der Basalexpression wurden in 16 Genen
beobachtet (P<0.05), aber es ergab sich keine einheitliche Rangabfolge der Rassen nach
diesen Unterschieden, außer dem Befund, dass die Komponenten des TLR-
Signalübertragungswegs in den alten Rassen höher exprimiert waren. Eine
Hauptkomponentenanalyse (PCA) der basalen Genexpressionsniveaus zeigte jedoch eine
sichtbare Trennung der alten von den modernen Rassen und eine Trennung zwischen BS
und RH. Die Veränderungen der Expression nach Stimulation unterschieden sich zwischen
den Rassen signifikant (P<0.05) nur in den Genen complement component 3 (C3),
chemokine (C-C motif) ligand 2 (CCL2), lactoperoxidase (LPO), caspase 8 (CASP8),
monocyte differentiation antigen CD14 (CD14), lymphocyte antigen 96 (LY96), transforming
growth factor beta 1 (TGFB1) und S100 calcium binding protein A12 (S100A12). Während
die PCA der Regulation der Genexpression nach Stimulation keine sichtbare Gruppierung
Zusammenfassung
9
der Rassen hervorbrachte, fand sich in den modernen Rassen eine größere Anzahl
signifikant (P<0.05) hochregulierter Gene. HLD hatte höhere Basal- und E. coli-behandelte
Werte von LF-Protein und höhere Basal- und S. aureus-behandelte Werte von SAA-Protein
als die modernen Rassen. Ferner gab es eine beträchtliche Variation der Genexpressions-
und Proteinwerte zwischen den einzelnen Tieren. Im Allgemeinen bleibt das Bild der
Immunantwort der verschiedenen Rassen heterogen und diffus, aber es kann vermutet
werden, dass höhere Basalwerte eines Teils des angeborenen Immunsystems in den alten
Rassen zu einer weniger ausgeprägten Immunantwort führten. Rassenunterschiede in
einzelnen Elementen des angeborenen Immunsystems, aber auch die Rassen-konservierte
Aktivierung von Elementen des angeborenen Immunsystems waren bereits vorher
beschrieben worden, genau wie die große Tier-zu-Tier-Variation, die wir fanden und die
Gegenstand weiterer Forschung bleibt.

Introduction
10
1. Introduction
1.1. Bovine Mastitis
Bovine mastitis is the inflammation of the udder of the cow. This disease not only
compromises the welfare of the animal, but it is also one of the most frequent and costly
diseases dairy farmers have to deal with worldwide (Halasa et al., 2007). Losses occur
through direct costs such as decreased milk yield, decreased milk quality, discarded milk,
medical treatment costs, penalties for antibiotic contaminated milk and excess labour
demand. But also indirect costs such as premature killing of cows and rearing of new heifers
to replace them have been taken into account. It is even expected that mastitis increases
susceptibility to other diseases (Heikkilä et al., 2012).
Mastitis comprises the ducts and alveoli of the milk producing parenchyma plus the milk
collecting cistern and the teat. It happens when the inflammation response of the immune
system is triggered. This is mostly done by invading pathogens. Known udder pathogens are
found amongst bacteria, viruses and fungi, of which bacteria are by far the most frequent.
Clinical mastitis is generally marked by acute inflammation symptoms that range from mild to
severe and from local to systemic. These can be pain, swelling and hardening of the infected
udder quarter, elevated body temperature, decreased milk synthesis, altered milk texture
(flakiness), loss of rumen motility, general sickness of the animal and even death (Marek and
Mócsy, 1956, Schulz, 1994). This type of mastitis is mostly elicited by gram-negative
bacteria, amongst which the most frequent are coliforms (Hogan and Smith, 2003). These
are Escherichia, Klebsiella and Enterobacter (Koneman et al., 1983). They have an
environmental reservoir in the intestinal tract, soil and bedding material (Schukken et al.,
2011). The other type of mastitis is the subclinical form that often remains without visible
symptoms except elevated somatic cell count (SCC) and can become chronic (Schulz,
1994). It is often caused by the gram-positive Staphylococcus aureus (S. aureus) which is
present on the skin surface and can be transferred from animal to animal by contact or
milking machine and even into raw milk products for human consumption (Sutra and Poutrel,
1994). Many studies have shown the difference in bovine mammary immune responses to
the gram-negative Escherichia coli (E. coli) and gram-positive S. aureus in vivo (Bannerman,
2004, Lee et al., 2006, Petzl et al., 2008) and in vitro (Griesbeck-Zilch et al., 2008, Yang et
al., 2008, Gunther et al., 2011).
Introduction
11
1.2. Innate immune response
The innate immune system responds to a specific set of conserved pathogen patterns while
the adaptive immune system adapts to recognize any pathogenic antigen throughout life
(Vivier and Malissen, 2005). The innate immune system is the first and more or less
unspecific response to invading pathogens in the udder. The cellular defence part consists of
leucocytes (macrophages, neutrophils, natural killer cells and dendritic cells) and mammary
epithelial cells, while the humoral part involves antimicrobial peptides (AMPs), acute phase
proteins and the complement system (Rainard and Riollet, 2006).
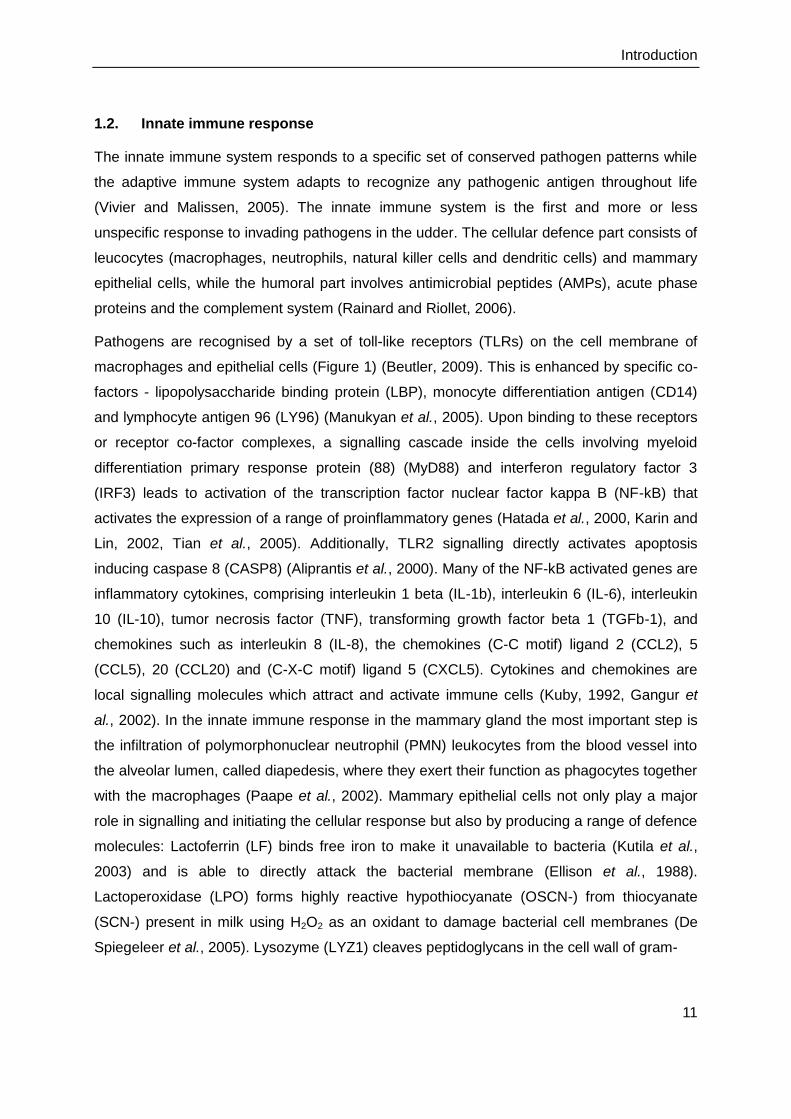
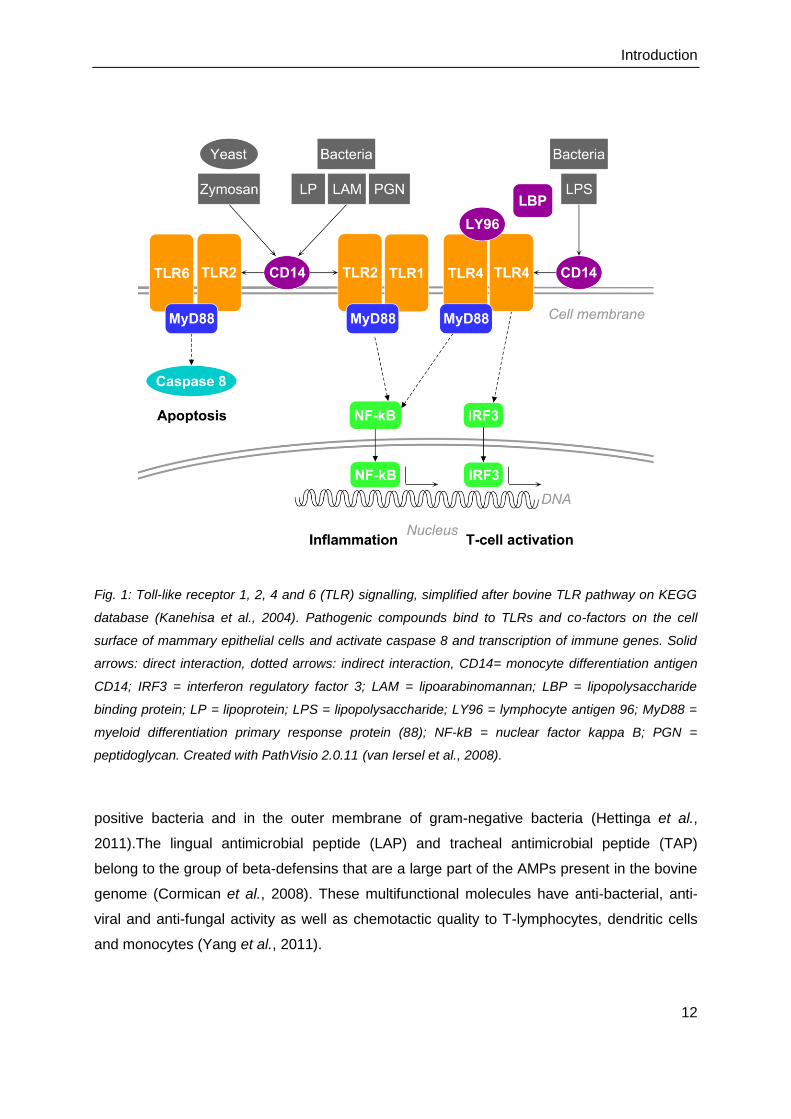
Pathogens are recognised by a set of toll-like receptors (TLRs) on the cell membrane of
macrophages and epithelial cells (Figure 1) (Beutler, 2009). This is enhanced by specific co-
factors - lipopolysaccharide binding protein (LBP), monocyte differentiation antigen (CD14)
and lymphocyte antigen 96 (LY96) (Manukyan et al., 2005). Upon binding to these receptors
or receptor co-factor complexes, a signalling cascade inside the cells involving myeloid
differentiation primary response protein (88) (MyD88) and interferon regulatory factor 3
(IRF3) leads to activation of the transcription factor nuclear factor kappa B (NF-kB) that
activates the expression of a range of proinflammatory genes (Hatada et al., 2000, Karin and
Lin, 2002, Tian et al., 2005). Additionally, TLR2 signalling directly activates apoptosis
inducing caspase 8 (CASP8) (Aliprantis et al., 2000). Many of the NF-kB activated genes are
inflammatory cytokines, comprising interleukin 1 beta (IL-1b), interleukin 6 (IL-6), interleukin
10 (IL-10), tumor necrosis factor (TNF), transforming growth factor beta 1 (TGFb-1), and
chemokines such as interleukin 8 (IL-8), the chemokines (C-C motif) ligand 2 (CCL2), 5
(CCL5), 20 (CCL20) and (C-X-C motif) ligand 5 (CXCL5). Cytokines and chemokines are
local signalling molecules which attract and activate immune cells (Kuby, 1992, Gangur et
al., 2002). In the innate immune response in the mammary gland the most important step is
the infiltration of polymorphonuclear neutrophil (PMN) leukocytes from the blood vessel into
the alveolar lumen, called diapedesis, where they exert their function as phagocytes together
with the macrophages (Paape et al., 2002). Mammary epithelial cells not only play a major
role in signalling and initiating the cellular response but also by producing a range of defence
molecules: Lactoferrin (LF) binds free iron to make it unavailable to bacteria (Kutila et al.,
2003) and is able to directly attack the bacterial membrane (Ellison et al., 1988).
Lactoperoxidase (LPO) forms highly reactive hypothiocyanate (OSCN-) from thiocyanate
(SCN-) present in milk using H2O2 as an oxidant to damage bacterial cell membranes (De
Spiegeleer et al., 2005). Lysozyme (LYZ1) cleaves peptidoglycans in the cell wall of gram-
Introduction
12
Fig. 1: Toll-like receptor 1, 2, 4 and 6 (TLR) signalling, simplified after bovine TLR pathway on KEGG
database (Kanehisa et al., 2004). Pathogenic compounds bind to TLRs and co-factors on the cell
surface of mammary epithelial cells and activate caspase 8 and transcription of immune genes. Solid
arrows: direct interaction, dotted arrows: indirect interaction, CD14= monocyte differentiation antigen
CD14; IRF3 = interferon regulatory factor 3; LAM = lipoarabinomannan; LBP = lipopolysaccharide
binding protein; LP = lipoprotein; LPS = lipopolysaccharide; LY96 = lymphocyte antigen 96; MyD88 =
myeloid differentiation primary response protein (88); NF-kB = nuclear factor kappa B; PGN =
peptidoglycan. Created with PathVisio 2.0.11 (van Iersel et al., 2008).
positive bacteria and in the outer membrane of gram-negative bacteria (Hettinga et al.,
2011).The lingual antimicrobial peptide (LAP) and tracheal antimicrobial peptide (TAP)
belong to the group of beta-defensins that are a large part of the AMPs present in the bovine
genome (Cormican et al., 2008). These multifunctional molecules have anti-bacterial, anti-
viral and anti-fungal activity as well as chemotactic quality to T-lymphocytes, dendritic cells
and monocytes (Yang et al., 2011).
Introduction
13
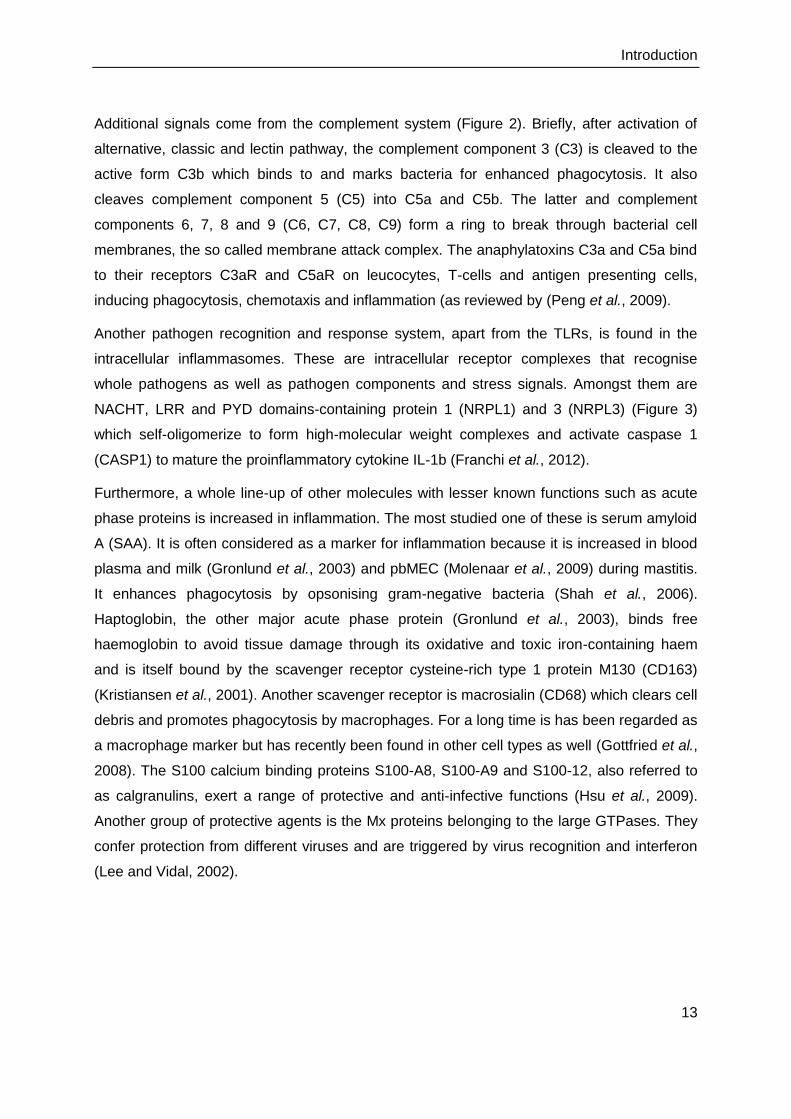
Additional signals come from the complement system (Figure 2). Briefly, after activation of
alternative, classic and lectin pathway, the complement component 3 (C3) is cleaved to the
active form C3b which binds to and marks bacteria for enhanced phagocytosis. It also
cleaves complement component 5 (C5) into C5a and C5b. The latter and complement
components 6, 7, 8 and 9 (C6, C7, C8, C9) form a ring to break through bacterial cell
membranes, the so called membrane attack complex. The anaphylatoxins C3a and C5a bind
to their receptors C3aR and C5aR on leucocytes, T-cells and antigen presenting cells,
inducing phagocytosis, chemotaxis and inflammation (as reviewed by (Peng et al., 2009).
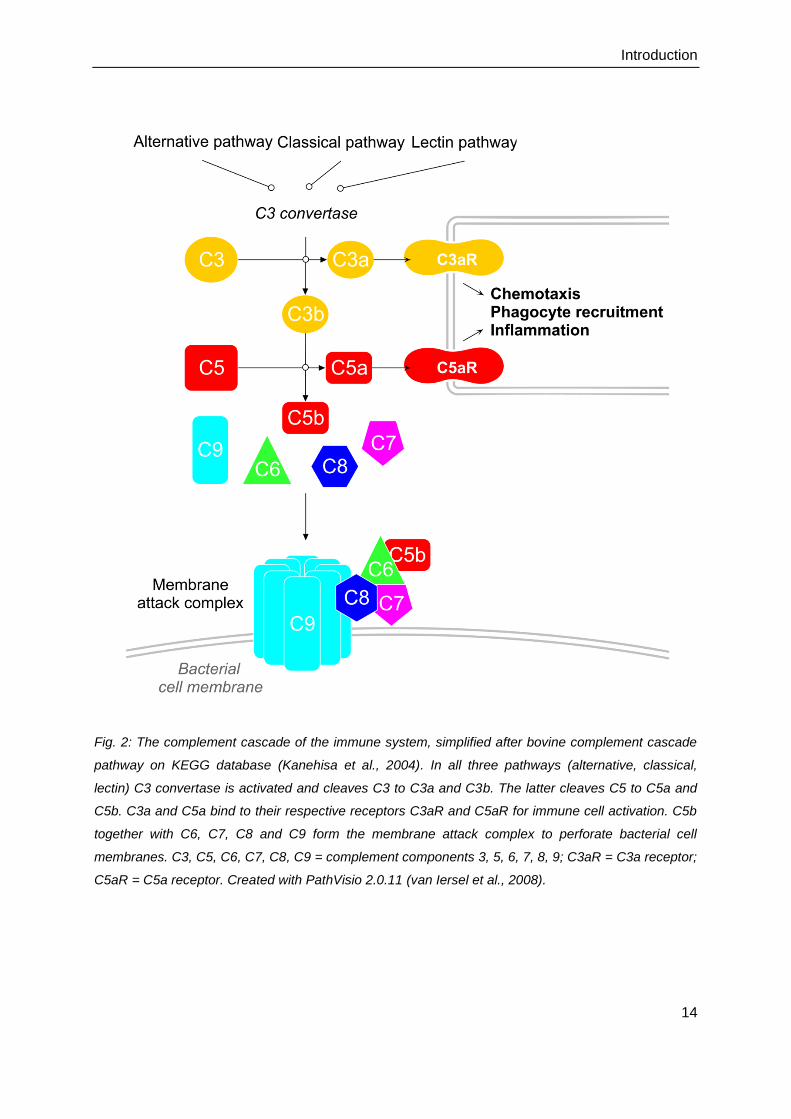
Another pathogen recognition and response system, apart from the TLRs, is found in the
intracellular inflammasomes. These are intracellular receptor complexes that recognise
whole pathogens as well as pathogen components and stress signals. Amongst them are
NACHT, LRR and PYD domains-containing protein 1 (NRPL1) and 3 (NRPL3) (Figure 3)
which self-oligomerize to form high-molecular weight complexes and activate caspase 1
(CASP1) to mature the proinflammatory cytokine IL-1b (Franchi et al., 2012).
Furthermore, a whole line-up of other molecules with lesser known functions such as acute
phase proteins is increased in inflammation. The most studied one of these is serum amyloid
A (SAA). It is often considered as a marker for inflammation because it is increased in blood
plasma and milk (Gronlund et al., 2003) and pbMEC (Molenaar et al., 2009) during mastitis.
It enhances phagocytosis by opsonising gram-negative bacteria (Shah et al., 2006).
Haptoglobin, the other major acute phase protein (Gronlund et al., 2003), binds free
haemoglobin to avoid tissue damage through its oxidative and toxic iron-containing haem
and is itself bound by the scavenger receptor cysteine-rich type 1 protein M130 (CD163)
(Kristiansen et al., 2001). Another scavenger receptor is macrosialin (CD68) which clears cell
debris and promotes phagocytosis by macrophages. For a long time is has been regarded as
a macrophage marker but has recently been found in other cell types as well (Gottfried et al.,
2008). The S100 calcium binding proteins S100-A8, S100-A9 and S100-12, also referred to
as calgranulins, exert a range of protective and anti-infective functions (Hsu et al., 2009).
Another group of protective agents is the Mx proteins belonging to the large GTPases. They
confer protection from different viruses and are triggered by virus recognition and interferon
(Lee and Vidal, 2002).
Introduction
14
Fig. 2: The complement cascade of the immune system, simplified after bovine complement cascade
pathway on KEGG database (Kanehisa et al., 2004). In all three pathways (alternative, classical,
lectin) C3 convertase is activated and cleaves C3 to C3a and C3b. The latter cleaves C5 to C5a and
C5b. C3a and C5a bind to their respective receptors C3aR and C5aR for immune cell activation. C5b
together with C6, C7, C8 and C9 form the membrane attack complex to perforate bacterial cell
membranes. C3, C5, C6, C7, C8, C9 = complement components 3, 5, 6, 7, 8, 9; C3aR = C3a receptor;
C5aR = C5a receptor. Created with PathVisio 2.0.11 (van Iersel et al., 2008).
Introduction
15
Fig. 3: The inflammasome NRPL3, simplified after bovine inflammasome pathway on KEGG database
(Kanehisa et al., 2004). Upon recognition of pathogenic compounds and other danger signals the
NLRP3 complex dimerizes and cleaves pro-caspase-1 to active caspase-1. The latter matures the
inflammatory cytokine pro-interleukin-1, beta (pro-IL-1b) to active interleukin-1, beta (IL-1b) and
induces apoptosis. NLRP3 = NACHT, LRR and PYD domains-containing protein 3; PGN =
peptidoglycans; ROS = reactive oxygen species. Created with PathVisio 2.0.11 (van Iersel et al.,
2008).
1.3. Genetic resistance to mastitis
It is well known that susceptibility to mastitis is determined by a combination of many factors:
bacterial virulence, environmental conditions (housing, management, feeding, milking
technique) and cow factors (milk yield, genetics). These are interdependent from each other
and their impact depends on the type of pathogen (Burvenich et al., 2003). The reason for
the high prevalence of mastitis in modern dairy breeds seems to be a positive genetic
correlation of milk yield and mastitis (Strandberg and Shook, 1989, Heringstad et al., 2003).
After this fact had been neglected for decades of intensive selection on milk yield, there are
now many approaches of breeding for mastitis resistant cows. New phenotypic breeding
goals have been defined (Boichard and Brochard, 2012). Intensive research is going on to
Introduction
16
identify genomic markers for mastitis resistance in the Holstein breed (Griesbeck-Zilch et al.,
2009, Liu et al., 2012, Russell et al., 2012). Even a database of cattle candidate genes and
genetic markers for milk production and mastitis is now available (Ogorevc et al., 2009).
However, prediction of a phenotypic trait by genetic markers is only accurate if this trait is
influenced by few large loci on the genome, not by many small loci (Hayes et al., 2010). The
latter seems to be the case for mastitis resistance. Furthermore, there is only low heritability
of conventionally estimated breeding values for mastitis resistance (Heringstad et al., 2003).
So it remains difficult to link phenotypic resistance to certain genetic factors when only the
genomic architecture but not the physiological effect of it is studied.
1.4. Cattle breeds
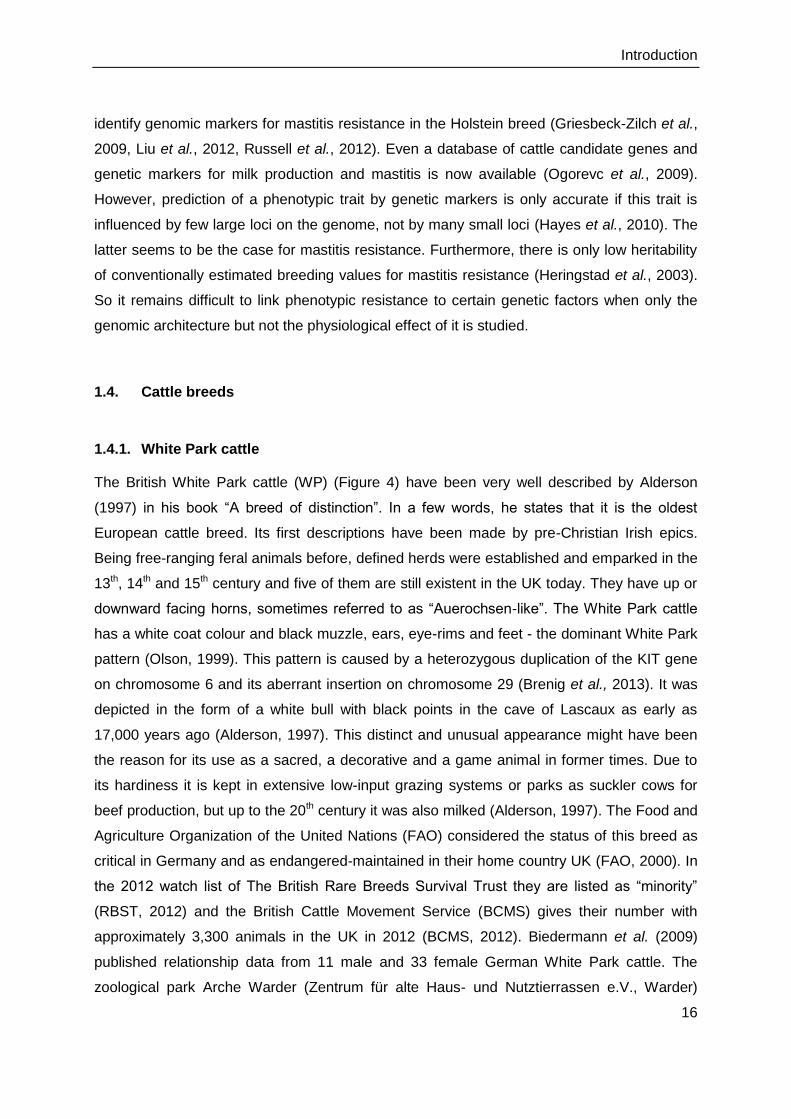
1.4.1. White Park cattle
The British White Park cattle (WP) (Figure 4) have been very well described by Alderson
(1997) in his book “A breed of distinction”. In a few words, he states that it is the oldest
European cattle breed. Its first descriptions have been made by pre-Christian Irish epics.
Being free-ranging feral animals before, defined herds were established and emparked in the
13th, 14th and 15th century and five of them are still existent in the UK today. They have up or
downward facing horns, sometimes referred to as “Auerochsen-like”. The White Park cattle
has a white coat colour and black muzzle, ears, eye-rims and feet - the dominant White Park
pattern (Olson, 1999). This pattern is caused by a heterozygous duplication of the KIT gene
on chromosome 6 and its aberrant insertion on chromosome 29 (Brenig et al., 2013). It was
depicted in the form of a white bull with black points in the cave of Lascaux as early as
17,000 years ago (Alderson, 1997). This distinct and unusual appearance might have been
the reason for its use as a sacred, a decorative and a game animal in former times. Due to
its hardiness it is kept in extensive low-input grazing systems or parks as suckler cows for
beef production, but up to the 20th century it was also milked (Alderson, 1997). The Food and
Agriculture Organization of the United Nations (FAO) considered the status of this breed as
critical in Germany and as endangered-maintained in their home country UK (FAO, 2000). In
the 2012 watch list of The British Rare Breeds Survival Trust they are listed as “minority”
(RBST, 2012) and the British Cattle Movement Service (BCMS) gives their number with
approximately 3,300 animals in the UK in 2012 (BCMS, 2012). Biedermann et al. (2009)
published relationship data from 11 male and 33 female German White Park cattle. The
zoological park Arche Warder (Zentrum für alte Haus- und Nutztierrassen e.V., Warder)
Introduction
17
which is dedicated to the conservation and research of ancient domestic animal breeds
keeps the largest herd in Germany (Biedermann et al., 2009).
Fig. 4: White Park cow on pasture (Tierpark Arche Warder, Warder, Germany; photo: Diana Sorg).
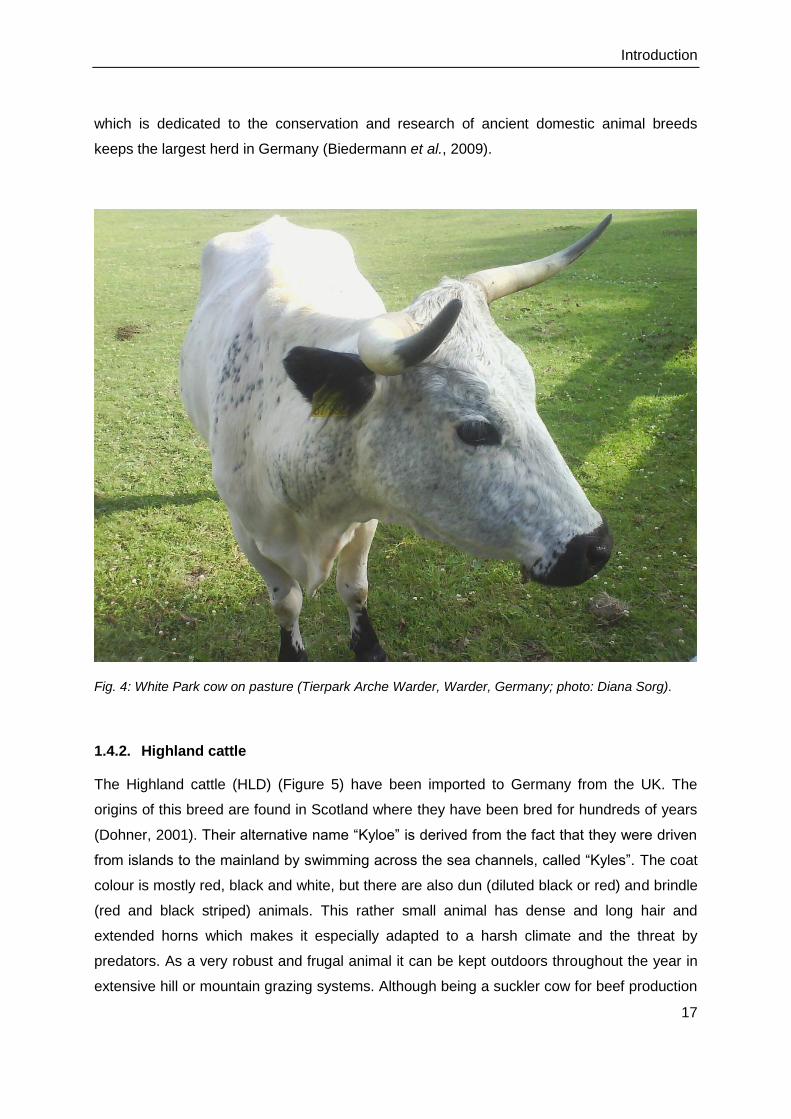
1.4.2. Highland cattle
The Highland cattle (HLD) (Figure 5) have been imported to Germany from the UK. The
origins of this breed are found in Scotland where they have been bred for hundreds of years
(Dohner, 2001). Their alternative name “Kyloe” is derived from the fact that they were driven
from islands to the mainland by swimming across the sea channels, called “Kyles”. The coat
colour is mostly red, black and white, but there are also dun (diluted black or red) and brindle
(red and black striped) animals. This rather small animal has dense and long hair and
extended horns which makes it especially adapted to a harsh climate and the threat by
predators. As a very robust and frugal animal it can be kept outdoors throughout the year in
extensive hill or mountain grazing systems. Although being a suckler cow for beef production
Introduction
18
nowadays, it has been reported that it was additionally milked in former times (Dohner,
2001). Its herd book was established in 1885 and so it is one of the oldest registered cattle
breeds (Mason, 2002). This ancient breed is not considered as a rare breed. In Germany
there were 2,785 female and 385 male animals registered in 2010 (BLE, 2012) and
approximately 38,000 Highland cattle in Great Britain (BCMS, 2012). Many farmers value this
breed for landscape conservation and high-quality beef production and so there are folds, as
Highland herds are called, in many countries around the world.
Fig. 5: Highland cow and calf on pasture (Rattenweiler, Germany; photo: Diana Sorg).
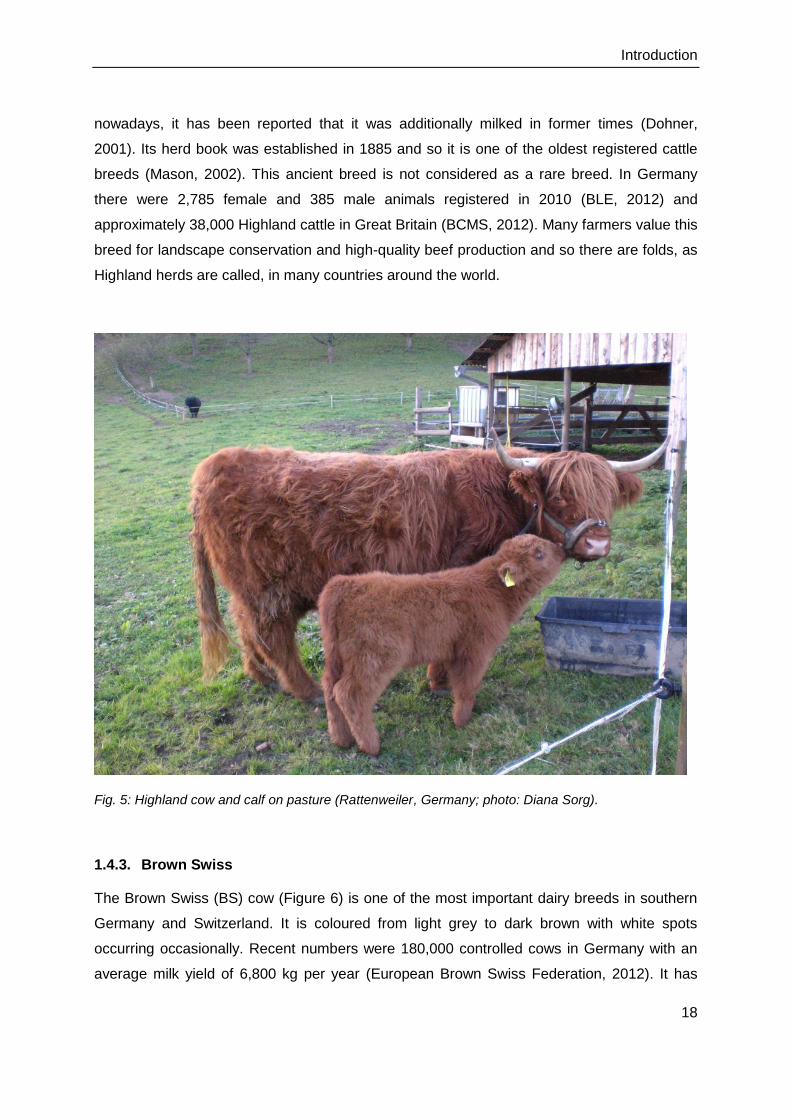
1.4.3. Brown Swiss
The Brown Swiss (BS) cow (Figure 6) is one of the most important dairy breeds in southern
Germany and Switzerland. It is coloured from light grey to dark brown with white spots
occurring occasionally. Recent numbers were 180,000 controlled cows in Germany with an
average milk yield of 6,800 kg per year (European Brown Swiss Federation, 2012). It has
Introduction
19
been bred in the USA at the end of the 19th century from 155 animals of the sturdy triple-
purpose (dairy, meat and draught) Swiss Brown Mountain cow to produce a high-yielding
dairy breed that can still be used as a dual-purpose animal for additional meat production
(Mason, 2002). One of its main characteristics is the high percentage of BB genotypes for κ-
casein, which is favourable for a high cheese yield (European Brown Swiss Federation,
2012).
Fig. 6: Brown Swiss cow at a breeding exhibition (photo: European Brown Swiss Federation,
Bussolengo, Italy).
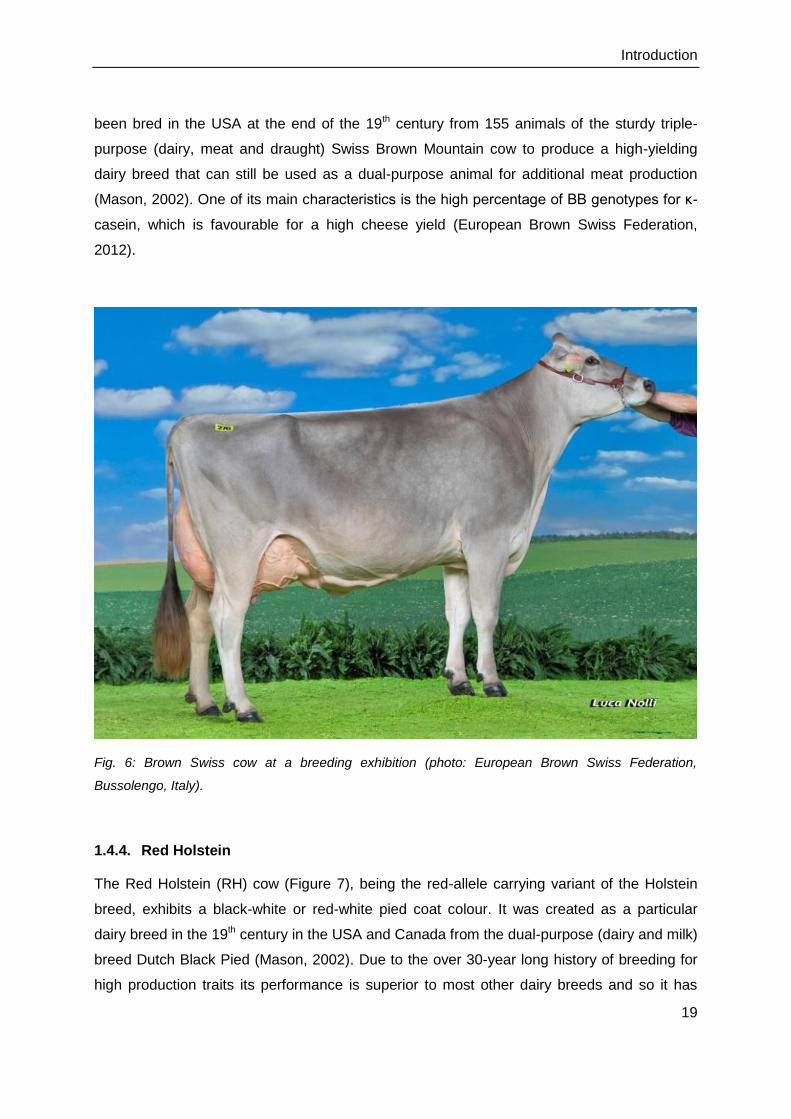
1.4.4. Red Holstein
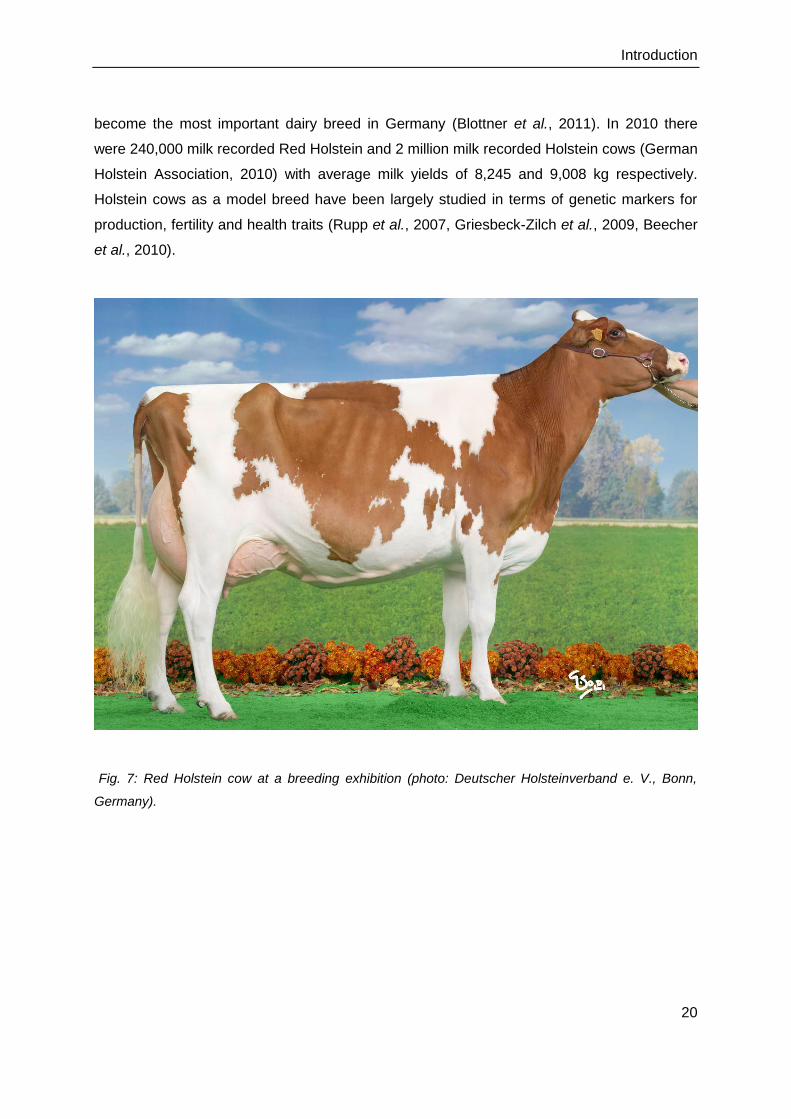
The Red Holstein (RH) cow (Figure 7), being the red-allele carrying variant of the Holstein
breed, exhibits a black-white or red-white pied coat colour. It was created as a particular
dairy breed in the 19th century in the USA and Canada from the dual-purpose (dairy and milk)
breed Dutch Black Pied (Mason, 2002). Due to the over 30-year long history of breeding for
high production traits its performance is superior to most other dairy breeds and so it has
Introduction
20
become the most important dairy breed in Germany (Blottner et al., 2011). In 2010 there
were 240,000 milk recorded Red Holstein and 2 million milk recorded Holstein cows (German
Holstein Association, 2010) with average milk yields of 8,245 and 9,008 kg respectively.
Holstein cows as a model breed have been largely studied in terms of genetic markers for
production, fertility and health traits (Rupp et al., 2007, Griesbeck-Zilch et al., 2009, Beecher
et al., 2010).
Fig. 7: Red Holstein cow at a breeding exhibition (photo: Deutscher Holsteinverband e. V., Bonn,
Germany).
Aim of the study
21
2. Aim of the study
The aim of this study was to compare the innate immune response of pbMEC from ancient
and modern cattle breeds to a mastitis challenge with E. coli and S. aureus in vitro.
Functional differences in the innate immune response should be described and possible
reasons thereof discussed.
For that pbMEC cultures out of the milk from two ancient breeds and two modern dairy
breeds were to be established. Heat-inactivated E. coli 1303 and S. aureus 1027 should be
used to elicit the innate immune response of these cells in vitro. This response was to be
measured in terms of mRNA expression of 39 target genes of the innate immune system via
reverse transcription quantitative polymerase chain reaction (RT-qPCR). The target genes
included representatives of the complement system, chemokines, inflammatory cytokines,
antimicrobial peptides, acute phase proteins, TLR-signaling, scavenger receptors and others.
In addition to this, the antimicrobial peptide LF, the anti-inflammatory cytokine IL-10 and the
acute phase protein SAA were to be quantified as protein in the cell protein extract using
enzyme linked immunosorbent assay (ELISA).
By studying the intra-mammary immune system of ancient breeds that have never been
selected for high milk yield there is the hope to better understand the underlying genetic
mechanisms of their frequently observed higher phenotypic resistance to mastitis and to
identify possible candidate genes that could later on be used for genomic selection and the
breeding of healthier animals.
Material and methods
22
3. Material and methods
3.1. Animals
To compare the cultivation of pbMEC from udder tissue and milk (pbMEC I), four healthy
lactating RH cows on the research station Veitshof (Technische Universität München,
Freising, Germany) were milked around the 150th day in milk. After slaughtering around the
150th day in milk, udder tissue from the same animals was obtained. Additionally one healthy
BS cow was used to obtain a tendon sample after slaughtering. To compare the immune
response of milk-derived pbMEC from different cattle breeds (pbMEC II), milk samples from
four different cattle breeds were taken. Six healthy mid-to-late-lactation BS cows from
research station Veitshof (Technische Universität München, Freising, Germany) and six
healthy mid-to-late-lactation RH cows from research station Hirschau (Technische Universität
München, Freising, Germany) were taken as examples for modern dairy breeds. The ancient
breeds were represented by five healthy mid-to-late-lactation WP cows and three healthy
mid-to-late-lactation HLD cows from the zoological park Tierpark Arche Warder (Zentrum für
alte Nutz- und Haustierrassen e. V., Warder, Germany) as well as by two healthy mid-to-late
lactation HLD cows from a private farm (Franz Sorg, Rattenweiler, Germany).
3.2. Bacteria
Samples of frozen E. coli and S. aureus (Petzl et al., 2008) were used to establish bacterial
cultures as described in Danowski et al. (2012a). E. coli was cultivated at 37°C in LB-medium
containing 10 g/L yeast extract (Sigma-Aldrich, Munich, Germany), 10 g/L NaCl and 5 g/L
trypton (Sigma-Aldrich). S. aureus was cultivated in CASO-broth (Sigma-Aldrich) at 37°C to
the log-phase of growth. Bacterial density was determined photometrically at 600 nm. At
several densities a dilution series of E. coli was plated on LB-agar (Roth, Karlsruhe,
Germany) and a dilution series of S. aureus was plated on blood agar (Oxoid, Wesel,
Germany, with sheep blood from Fiebig, Idstein-Niederauroff, Germany), cultivated over night
at 37°C and counted. Under the hypothesis that from one bacterium one colony had arisen,
the desired cell density and corresponding optical density (OD) was determined and the
cultivation was repeated up to the desired OD. Cultivation was stopped by placing the
solutions on ice and a centrifugation step of 10 min at 1,850 x g. The bacteria were washed
with sterile PBS, centrifuged again and inactivated for 30 min at 63°C in a water bath. A
diluted sample of both harvested batches was cultivated on a plate at 37°C over night to
verify inactivation.
Material and methods
23
3.3. Cell culture
Cell isolation from milk
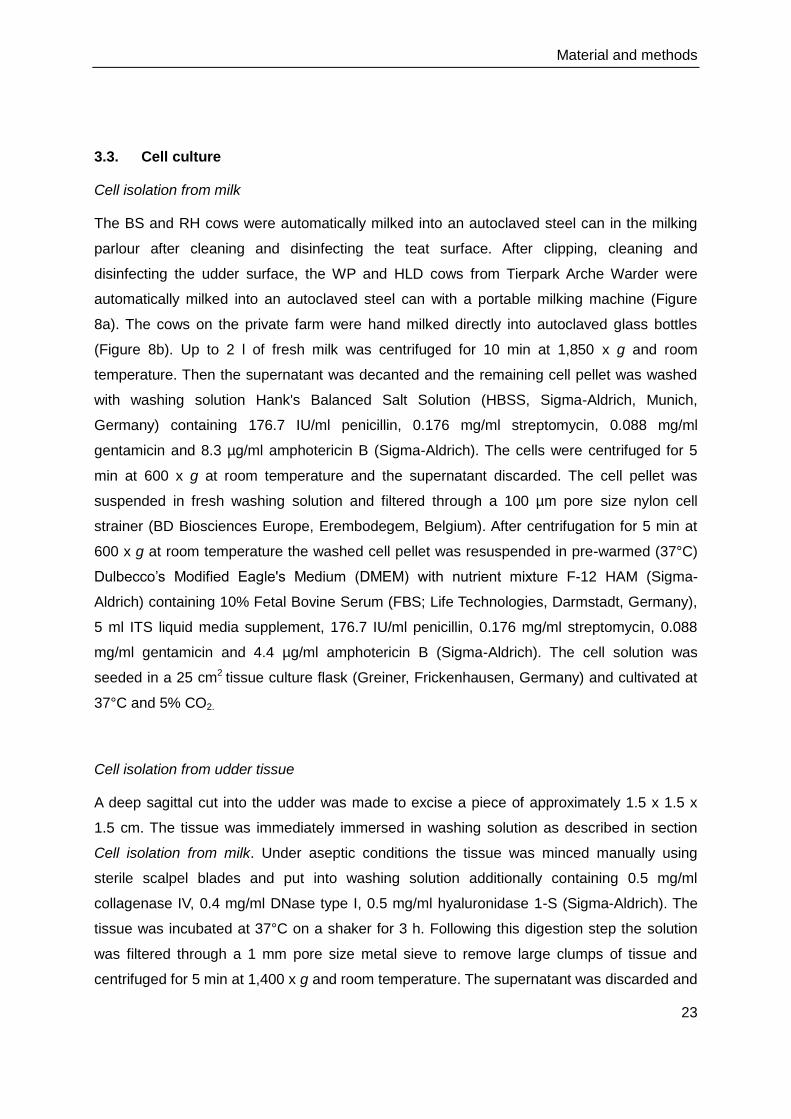
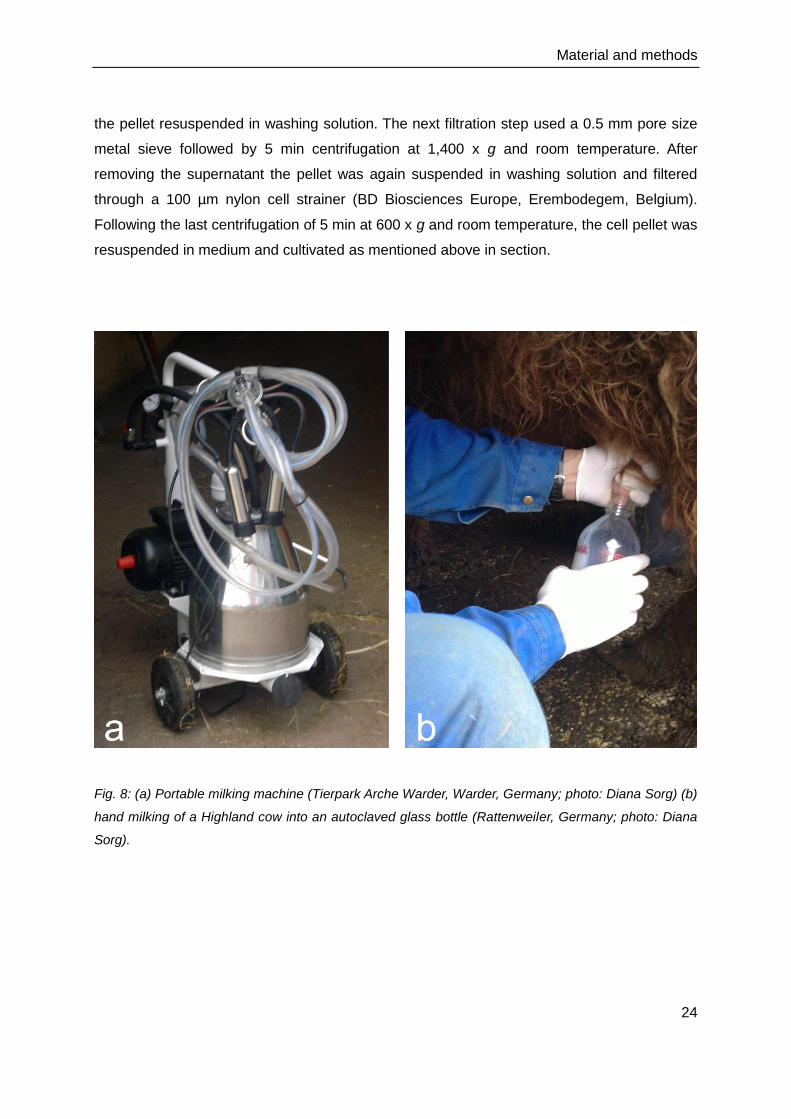
The BS and RH cows were automatically milked into an autoclaved steel can in the milking
parlour after cleaning and disinfecting the teat surface. After clipping, cleaning and
disinfecting the udder surface, the WP and HLD cows from Tierpark Arche Warder were
automatically milked into an autoclaved steel can with a portable milking machine (Figure
8a). The cows on the private farm were hand milked directly into autoclaved glass bottles
(Figure 8b). Up to 2 l of fresh milk was centrifuged for 10 min at 1,850 x g and room
temperature. Then the supernatant was decanted and the remaining cell pellet was washed
with washing solution Hank's Balanced Salt Solution (HBSS, Sigma-Aldrich, Munich,
Germany) containing 176.7 IU/ml penicillin, 0.176 mg/ml streptomycin, 0.088 mg/ml
gentamicin and 8.3 µg/ml amphotericin B (Sigma-Aldrich). The cells were centrifuged for 5
min at 600 x g at room temperature and the supernatant discarded. The cell pellet was
suspended in fresh washing solution and filtered through a 100 µm pore size nylon cell
strainer (BD Biosciences Europe, Erembodegem, Belgium). After centrifugation for 5 min at
600 x g at room temperature the washed cell pellet was resuspended in pre-warmed (37°C)
Dulbecco’s Modified Eagle's Medium (DMEM) with nutrient mixture F-12 HAM (Sigma-
Aldrich) containing 10% Fetal Bovine Serum (FBS; Life Technologies, Darmstadt, Germany),
5 ml ITS liquid media supplement, 176.7 IU/ml penicillin, 0.176 mg/ml streptomycin, 0.088
mg/ml gentamicin and 4.4 µg/ml amphotericin B (Sigma-Aldrich). The cell solution was
seeded in a 25 cm2 tissue culture flask (Greiner, Frickenhausen, Germany) and cultivated at
37°C and 5% CO2.
Cell isolation from udder tissue
A deep sagittal cut into the udder was made to excise a piece of approximately 1.5 x 1.5 x
1.5 cm. The tissue was immediately immersed in washing solution as described in section
Cell isolation from milk. Under aseptic conditions the tissue was minced manually using
sterile scalpel blades and put into washing solution additionally containing 0.5 mg/ml
collagenase IV, 0.4 mg/ml DNase type I, 0.5 mg/ml hyaluronidase 1-S (Sigma-Aldrich). The
tissue was incubated at 37°C on a shaker for 3 h. Following this digestion step the solution
was filtered through a 1 mm pore size metal sieve to remove large clumps of tissue and
centrifuged for 5 min at 1,400 x g and room temperature. The supernatant was discarded and
Material and methods
24
the pellet resuspended in washing solution. The next filtration step used a 0.5 mm pore size
metal sieve followed by 5 min centrifugation at 1,400 x g and room temperature. After
removing the supernatant the pellet was again suspended in washing solution and filtered
through a 100 µm nylon cell strainer (BD Biosciences Europe, Erembodegem, Belgium).
Following the last centrifugation of 5 min at 600 x g and room temperature, the cell pellet was
resuspended in medium and cultivated as mentioned above in section.
Fig. 8: (a) Portable milking machine (Tierpark Arche Warder, Warder, Germany; photo: Diana Sorg) (b)
hand milking of a Highland cow into an autoclaved glass bottle (Rattenweiler, Germany; photo: Diana
Sorg).
Material and methods
25
Isolation of fibroblasts
With the same protocol as for the udder tissue, a piece of 1 cm length of tendon was taken
aseptically after slaughtering and extracted to establish a reference fibroblast culture for the
fibroblast contamination check on the epithelial cultures.
Cell cultivation
The pbMEC I from four RH cows from the research station Veitshof (Technische Universität
München, Freising, Germany) were used to compare pbMEC from udder tissue and milk.
The pbMEC II from the ancient and moderns breeds were used for the stimulation
experiment with mastitis pathogens. Growth and morphology of all pbMEC and fibroblasts
were monitored daily by light microscopy. Medium was changed twice a week. When
reaching about 70 to 80% confluence cells were detached using accutase (PAA, Pasching,
Austria) and centrifuged for 5 min at 600 x g and room temperature. In the pbMEC I cultures,
two wells of a six-well plate (Greiner, Frickenhausen, Germany) were seeded with 100,000
cells after the first, second and third passage. The rest was reseeded in tissue culture flasks
for further cultivation. To compare frozen and non-frozen third passage cells an aliquot of the
second passage pbMEC I was additionally stored in freezing medium consisting of 70 %
DMEM/F-12 HAM, 20 % FBS and 10 % DMSO in liquid nitrogen. These cells were also
reseeded at 100,000 cells per well in a six-well plate after 3 weeks storage. Fibroblasts were
cultivated until second passage and cryopreserved in liquid nitrogen before reseeding at
100,000 cells per well in a six-well plate. PbMEC II were cultivated until third passage and
stored in liquid nitrogen for further experiments. Additionally, a 16-well chamber slide (Nunc,
Langenselbold, Germany) or a flexiPerm reusable cell culture chamber on a glass slide
(Greiner) was seeded with 10,000 cells per well of each pbMEC and the fibroblast culture for
immunocytochemistry.
Cell stimulation
PbMEC II from each of the animals in the breed comparison experiment were seeded at
30,000 cells per well in 12-well plates (Greiner). After reaching 70-80 % confluence the
medium was removed and replaced with medium without FBS and antibiotics. On the
following day three wells were detached and counted manually to determine an estimate of
the cell count in the other wells. The other wells were washed with PBS and given fresh
medium without FBS and antibiotics. Heat-inactivated E. coli 1303 and S. aureus 1027 (Petzl
Material and methods
26
et al., 2008) were added in a multiplicity of infection (MOI) of 30 colony forming units per cell
to ensure the same bacterial load in every well. This MOI was chosen as a typical bacterial
load used in other experiments with pbMEC (Gunther et al., 2009, Danowski et al., 2012a).
Control wells were left untreated. Two wells of E. coli treated cells were each sampled after 6
and 30 h, two wells of S. aureus treated cells were each sampled after 30 and 78 h and two
wells of control cells were each sampled at 6, 30 and 78 h.
3.4. Immunocytochemistry
To check for contamination by non-epithelial cells, a staining of the epithelial-specific
keratins, also called cytokeratins, was performed in all pbMEC cultures and a fibroblast
sample as described in Danowski et al (2012a). In pbMEC I also a staining of the milk protein
casein was performed to show their ongoing functionality. The cells that had been cultivated
on chamber slides were washed with phosphate buffered saline (PBS) and fixed in ice cold
methanol/acetone (1:1) for 10 min. After air drying at room temperature endogenous
peroxidases were blocked in PBS with 1 % H2O2 for 30 min at room temperature and
protected from light. Then the slides were washed in PBS with 0.05 % Tween20 (Sigma-
Aldrich) (PBST) three times for 5 min each. Background staining by unspecific binding of the
antibody was reduced by adding 30 µl goat serum (DAKO, Glostrup, Denmark) 1:10 diluted
in PBST per well and incubating at room temperature for 30 min. Afterwards the liquid was
decanted and fresh diluted goat serum was added to the negative control wells. The other
wells were covered with the primary antibody and incubated over night at 4°C in moist
atmosphere protected from light. For cytokeratin staining we used the monoclonal mouse
anti-cytokeratin pan antibody clone C-11 (diluted 1:400 in PBST) (Sigma-Aldrich) and for
casein staining we used the polyclonal rabbit anti-casein antibody (1:50 in PBST) (Genetex,
Irvine, CA, USA). After washing as described above, the secondary antibody, horseradish
peroxidase (HRP) labelled goat anti-mouse-immunoglobulin (DAKO) diluted 1:400 in PBST,
was added and incubated for 1 h at room temperature protected from light. After washing,
HRP was visualized by immersing the slides in PBS with 0.01 % 3,3’-diaminobenzidine
(DAB; Sigma-Aldrich) and 0.01 % H2O2 for 15 min at room temperature protected from light.
Subsequently the slides were washed and nuclei were stained with Haemalaun after Mayer
(Roth, Karlsruhe, Germany) for 15 sec, following rinsing with tap water for 45 s. For 2 min
each, the slides were dehydrated in 50 % ethanol, 100 % ethanol and Rotihistol (Roth). For
storage they were covered with a cover slip and Eukitt (Roth).
Material and methods
27
3.5. Total RNA extraction and reverse transcription
PbMEC I and fibroblasts in the six-well plates were sampled after 5 days. Their total RNA
was extracted with the NucleoSpin RNA II kit (Macherey-Nagel, Düren, Germany) according
to manufacturer’s instructions. The pbMEC II in 12-well plates were harvested with the
Allprep RNA/Protein kit (Qiagen, Hilden, Germany). Their total RNA and protein was
extracted with an additional DNA digestion using the RNAse-free DNAse set (Qiagen) as
indicated in the manual. RNA and protein were stored at -80°C. RNA concentration and purity
was measured with the NanoDrop ND-1000 photometer (Peqlab, Erlangen, Germany) at 260
nm. RNA integrity was analysed with the Bioanalyzer 2100 and the RNA 6000 Nano Assay kit
(Agilent, Waldbronn, Germany). 500 ng of pbMEC I and fibroblast RNA was transcribed to
complementary DNA (cDNA) with 200 IU M-MLV (H-) Point Mutant Reverse Transcriptase
(Promega, Mannheim, Germany), 5x buffer (Promega), 50 µM random hexamer primers
(Invitrogen, Darmstadt, Germany) and 10 mM dNTPs (Fermentas, St. Leon-Roth, Germany)
in a total volume of 60 µl. 100 ng of pbMEC II RNA was transcribed with 100 IU M-MLV (H-)
Point Mutant Reverse Transcriptase (Promega), 5x buffer (Promega), 2.5 µM random
hexamer primers (Invitrogen), 0.5 mM dNTPs (Fermentas) and 0.5 μM oligo-d(T) primer
(Fermentas) in a total volume of 30 µl. A negative control containing pooled RNA from each
RNA extraction run and no reverse transcriptase was created to detect contamination by
genomic DNA. The temperature profile was 10 min at 21°C for annealing, 50 min at 48°C for
transcription and 2 min at 90°C for degradation. CDNA was stored at -20°C.
3.6. Gene expression with reverse transcription quantitative PCR (RT-qPCR)
Comparison of milk and tissue-derived pbMEC I and fibroblasts
To avoid measuring gene expression of eventually contaminating fibroblasts only mammary
epithelial cell-specific genes were chosen. Those were keratin 8 (KRT8), which is an
intermediate filament protein of the cytoskeleton. It is generally used as a marker for
epithelial cells (Karantza, 2011). Kappa casein (CSN3) is a major milk protein that is secreted
by pbMEC (Threadgill and Womack, 1990). LAP, LF and LYZ1 encode for the antimicrobial
peptides lingual antimicrobial peptide, lactoferrin and lysozyme which are produced by
pbMEC to attack pathogens in the innate immune response (Carlsson et al., 1989, Irwin,
2004, Huang et al., 2012). The lactogenic hormone prolactin binds to the prolactin receptor
PRLR (Bole-Feysot et al., 1998, Viitala et al., 2006). Vimentin (VIM), another filament protein
of the cytoskeleton, is commonly used as a marker of mesenchymal cells, such as fibroblasts

Material and methods
28
(Herrmann and Aebi, 2004). Its expression was used to validate the reference fibroblast
culture. Primer pairs were designed applying the HUSAR software (German Cancer research
Center, Heidelberg, Germany) and PrimerBLAST (National Center of Biotechnology
Information (NCBI), National Library of Medicine, National Institutes of Health, Bethesda, MA,
USA). Primer details are given in table 1.
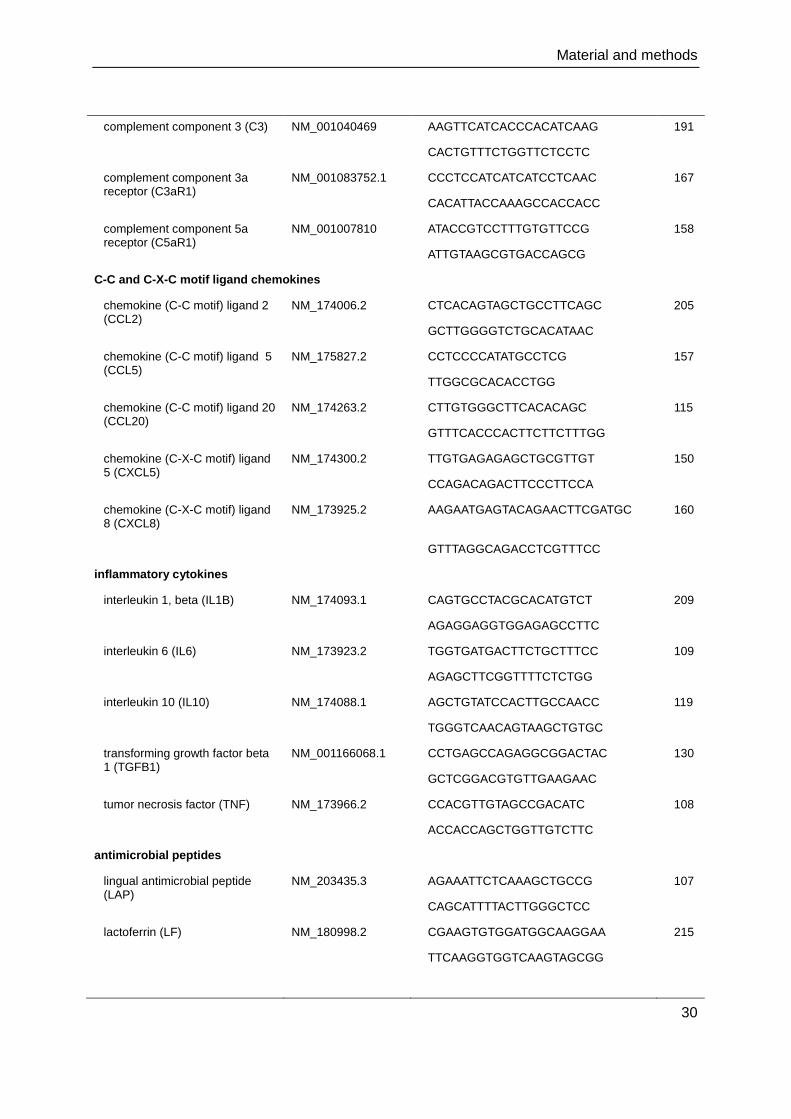
Table 1: Names, symbols, NCBI reference sequence number, sequences, amplicon lengths (L) and
annealing temperatures (T) of the primers used to compare gene expression of tissue and milk-
derived pbMEC (pbMEC I).
gene name
(symbol)
NCBI reference
sequence number
primer sequences (5’→ 3’)
forward
reverse
L1
(bp)
T2
(°C)
keratin 8 (KRT8)
NM_001033610.1
ACTGGCTACGCAGGTGGACT
181
62
CCGCAAGAGCCTTTCACTTG
kappa casein (CSN3)
NM_174294.1 TGCAATGATGAAGAGTTTTTTCCTAG 151 54
GATTGGGATATATTTGGCTATTTTGT
lingual antimicrobial peptide (LAP)
NM_203435.3 AGAAATTCTCAAAGCTGCCG 107 62
CAGCATTTTACTTGGGCTCC
lactoferrin (LF) NM_180998.2 CGAAGTGTGGATGGCAAGGAA 215 60
TTCAAGGTGGTCAAGTAGCGG
lysozyme 1 (LYZ1) NM_001077829.1 AAGAAACTTGGATTGGATGGC 185 60
ACTGCTTTTGGGGTTTTGC
prolactin receptor (PRLR)
NM_001039726.1 TGATGTTCATCTGCTGGAGAAGGGC 195 64
TCCAGGTGCATGGGCTTCACG
vimentin (VIM) NM_173969.3 TGGAGCGTAAAGTGGAATCC 104 60
GACATGCTGTTCTTGAATCTGG
1Amplicon length
2Annealing and elongation temperature in qPCR
Real-time quantitative PCR (RT-qPCR) was done on the Rotorgene Q cycler (Qiagen) using
1 µl cDNA template, 5 µl SsoFast EvaGreen Supermix (Bio-Rad, Munich, Germany), water
and a final concentration of 400 nM forward and reverse primers (Metabion, Martinsried,
Germany) in a total volume of 10 µl. The temperature profile was 30 sec at 98°C, followed by

Material and methods
29
40 cycles with the two phases of 5 sec at 95°C and 20 sec at the primer-specific annealing
temperature.
Comparison of cattle breeds with pbMEC II
39 target genes of the innate immune response and 6 putative reference genes were
measured. Primer details are given in table 2. Primer specifity was checked as described for
the pbMEC I. A 5-point dilution series of 3 representative cDNA samples from the experiment
and untreated bovine spleen tissue cDNA was used to determine PCR efficiencies as
described in the MIQE Guidelines for RT-qPCR (Bustin et al., 2009) using one BioMark™ HD
Gene Expression (GE) 48.48 Dynamic Array chip (Fluidigm, San Francisco, CA, USA).
Table 2: Names, symbols, NCBI reference sequence number, sequences and amplicon lengths of the
primers used to compare gene expression of pbMEC from different cattle breeds (pbMEC II).
gene name (symbol) NCBI reference sequence number
primer sequence (5’ → 3’)
forward
reverse
L1
(bp)
reference genes
actin, gamma 1 (ACTG1) NM_001033618 AACTCCATCATGAAGTGTGAC 234
GATCCACATCTGCTGGAAGG
keratin 8 (KRT8) NM_001033610 TGGTGGAGGACTTCAAGACC 215
CGTGTCAGAAATCTGAGACTGC
glyceraldehyd-3-phosphate dehydrogenase (GAPDH)
NM_001034034.1 GTCTTCACTACCATGGAGAAGG 197
TCATGGATGACCTTGGCCAG
H3 histone, family 3A (H3F3A) NM_001014389.2 ACTCGCTACAAAAGCCGCT 232
ACTTGCCTCCTGCAAAGC
ubiquitine B (UBB) NM_174133.2 AGATCCAGGATAAGGAAGGCAT 426
GCTCCACCTCCAGGGTGAT
tyrosine 3-monoxygenase/tryptophan 5-monoxygenase activation protein, zeta polypeptide (YWHAZ)
NM_174814.2 CAGGCTGAGCGATATGATGA 141
GACCCTCCAAGATGACCTAC
complement system
complement component 1, q subcomponent, A chain (C1QA)
NM_001014945.1 CGTTGGACCGAATTCTGTCTC 224
TGCTGTTGAAGTCACAGAAGCC
Material and methods
30
complement component 3 (C3) NM_001040469 AAGTTCATCACCCACATCAAG 191
CACTGTTTCTGGTTCTCCTC
complement component 3a receptor (C3aR1)
NM_001083752.1 CCCTCCATCATCATCCTCAAC 167
CACATTACCAAAGCCACCACC
complement component 5a receptor (C5aR1)
NM_001007810 ATACCGTCCTTTGTGTTCCG 158
ATTGTAAGCGTGACCAGCG
C-C and C-X-C motif ligand chemokines
chemokine (C-C motif) ligand 2 (CCL2)
NM_174006.2 CTCACAGTAGCTGCCTTCAGC 205
GCTTGGGGTCTGCACATAAC
chemokine (C-C motif) ligand 5 (CCL5)
NM_175827.2 CCTCCCCATATGCCTCG 157
TTGGCGCACACCTGG
chemokine (C-C motif) ligand 20 (CCL20)
NM_174263.2 CTTGTGGGCTTCACACAGC 115
GTTTCACCCACTTCTTCTTTGG
chemokine (C-X-C motif) ligand 5 (CXCL5)
NM_174300.2 TTGTGAGAGAGCTGCGTTGT 150
CCAGACAGACTTCCCTTCCA
chemokine (C-X-C motif) ligand 8 (CXCL8)
NM_173925.2 AAGAATGAGTACAGAACTTCGATGC 160
GTTTAGGCAGACCTCGTTTCC
inflammatory cytokines
interleukin 1, beta (IL1B) NM_174093.1 CAGTGCCTACGCACATGTCT 209
AGAGGAGGTGGAGAGCCTTC
interleukin 6 (IL6) NM_173923.2 TGGTGATGACTTCTGCTTTCC 109
AGAGCTTCGGTTTTCTCTGG
interleukin 10 (IL10) NM_174088.1 AGCTGTATCCACTTGCCAACC 119
TGGGTCAACAGTAAGCTGTGC
transforming growth factor beta 1 (TGFB1)
NM_001166068.1 CCTGAGCCAGAGGCGGACTAC 130
GCTCGGACGTGTTGAAGAAC
tumor necrosis factor (TNF) NM_173966.2 CCACGTTGTAGCCGACATC 108
ACCACCAGCTGGTTGTCTTC
antimicrobial peptides
lingual antimicrobial peptide (LAP)
NM_203435.3 AGAAATTCTCAAAGCTGCCG 107
CAGCATTTTACTTGGGCTCC
lactoferrin (LF) NM_180998.2 CGAAGTGTGGATGGCAAGGAA 215
TTCAAGGTGGTCAAGTAGCGG
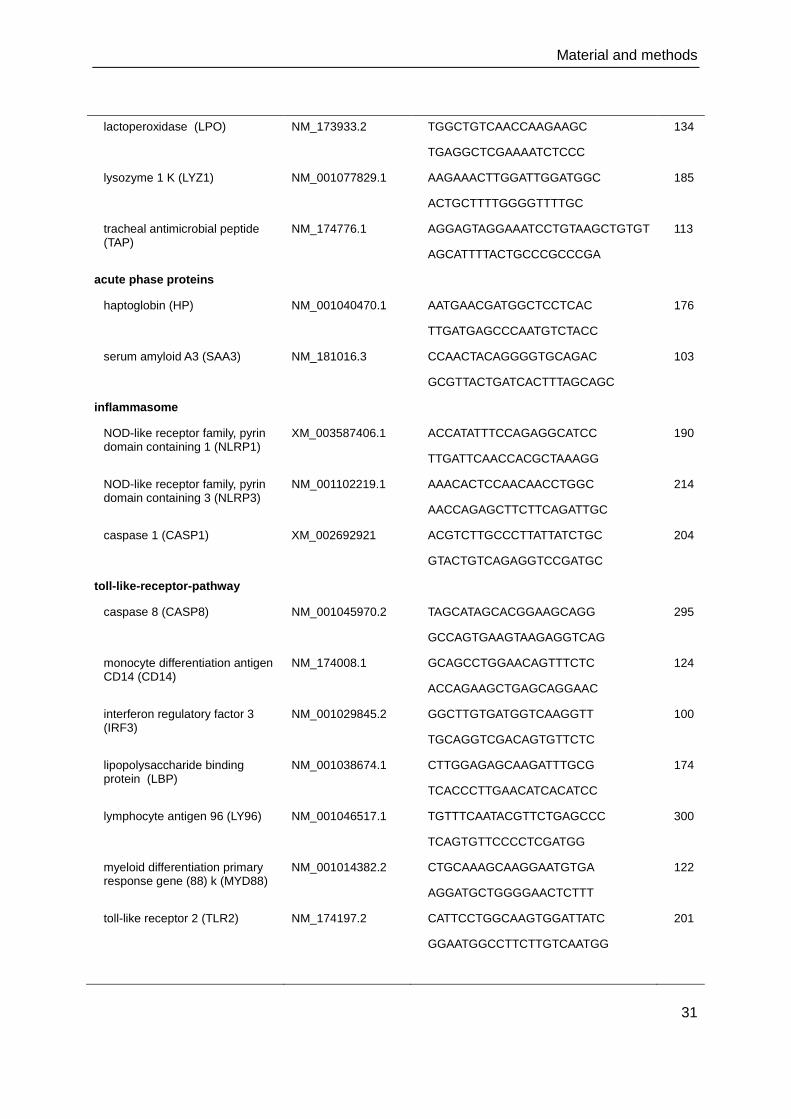
Material and methods
31
lactoperoxidase (LPO) NM_173933.2 TGGCTGTCAACCAAGAAGC 134
TGAGGCTCGAAAATCTCCC
lysozyme 1 K (LYZ1) NM_001077829.1 AAGAAACTTGGATTGGATGGC 185
ACTGCTTTTGGGGTTTTGC
tracheal antimicrobial peptide (TAP)
NM_174776.1 AGGAGTAGGAAATCCTGTAAGCTGTGT 113
AGCATTTTACTGCCCGCCCGA
acute phase proteins
haptoglobin (HP) NM_001040470.1 AATGAACGATGGCTCCTCAC 176
TTGATGAGCCCAATGTCTACC
serum amyloid A3 (SAA3) NM_181016.3 CCAACTACAGGGGTGCAGAC 103
GCGTTACTGATCACTTTAGCAGC
inflammasome
NOD-like receptor family, pyrin domain containing 1 (NLRP1)
XM_003587406.1 ACCATATTTCCAGAGGCATCC 190
TTGATTCAACCACGCTAAAGG
NOD-like receptor family, pyrin domain containing 3 (NLRP3)
NM_001102219.1 AAACACTCCAACAACCTGGC 214
AACCAGAGCTTCTTCAGATTGC
caspase 1 (CASP1) XM_002692921 ACGTCTTGCCCTTATTATCTGC 204
GTACTGTCAGAGGTCCGATGC
toll-like-receptor-pathway
caspase 8 (CASP8) NM_001045970.2 TAGCATAGCACGGAAGCAGG 295
GCCAGTGAAGTAAGAGGTCAG
monocyte differentiation antigen CD14 (CD14)
NM_174008.1 GCAGCCTGGAACAGTTTCTC 124
ACCAGAAGCTGAGCAGGAAC
interferon regulatory factor 3 (IRF3)
NM_001029845.2 GGCTTGTGATGGTCAAGGTT 100
TGCAGGTCGACAGTGTTCTC
lipopolysaccharide binding protein (LBP)
NM_001038674.1 CTTGGAGAGCAAGATTTGCG 174
TCACCCTTGAACATCACATCC
lymphocyte antigen 96 (LY96) NM_001046517.1 TGTTTCAATACGTTCTGAGCCC 300
TCAGTGTTCCCCTCGATGG
myeloid differentiation primary response gene (88) k (MYD88)
NM_001014382.2 CTGCAAAGCAAGGAATGTGA 122
AGGATGCTGGGGAACTCTTT
toll-like receptor 2 (TLR2) NM_174197.2 CATTCCTGGCAAGTGGATTATC 201
GGAATGGCCTTCTTGTCAATGG
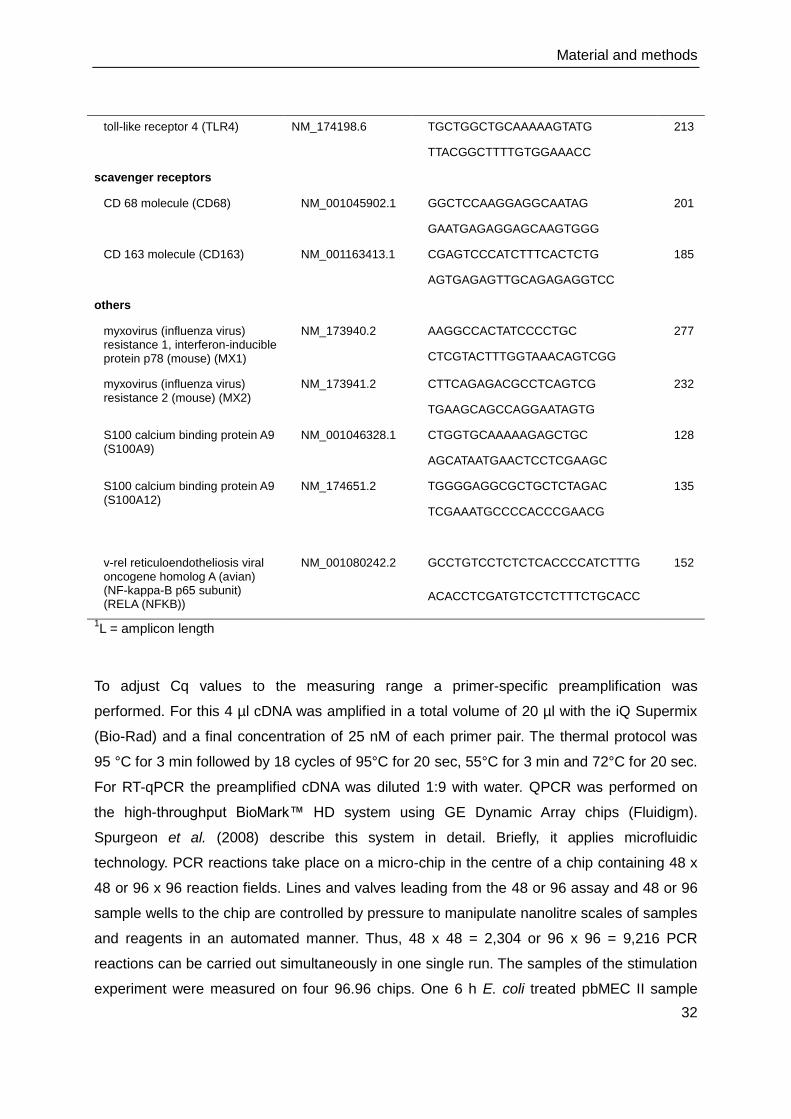
Material and methods
32
toll-like receptor 4 (TLR4) NM_174198.6 TGCTGGCTGCAAAAAGTATG 213
TTACGGCTTTTGTGGAAACC
scavenger receptors
CD 68 molecule (CD68) NM_001045902.1 GGCTCCAAGGAGGCAATAG 201
GAATGAGAGGAGCAAGTGGG
CD 163 molecule (CD163) NM_001163413.1 CGAGTCCCATCTTTCACTCTG 185
AGTGAGAGTTGCAGAGAGGTCC
others
myxovirus (influenza virus) resistance 1, interferon-inducible protein p78 (mouse) (MX1)
NM_173940.2 AAGGCCACTATCCCCTGC 277
CTCGTACTTTGGTAAACAGTCGG
myxovirus (influenza virus) resistance 2 (mouse) (MX2)
NM_173941.2 CTTCAGAGACGCCTCAGTCG 232
TGAAGCAGCCAGGAATAGTG
S100 calcium binding protein A9 (S100A9)
NM_001046328.1 CTGGTGCAAAAAGAGCTGC 128
AGCATAATGAACTCCTCGAAGC
S100 calcium binding protein A9 (S100A12)
NM_174651.2 TGGGGAGGCGCTGCTCTAGAC 135
TCGAAATGCCCCACCCGAACG
v-rel reticuloendotheliosis viral oncogene homolog A (avian) (NF-kappa-B p65 subunit) (RELA (NFKB))
NM_001080242.2 GCCTGTCCTCTCTCACCCCATCTTTG 152
ACACCTCGATGTCCTCTTTCTGCACC
1L = amplicon length
To adjust Cq values to the measuring range a primer-specific preamplification was
performed. For this 4 µl cDNA was amplified in a total volume of 20 µl with the iQ Supermix
(Bio-Rad) and a final concentration of 25 nM of each primer pair. The thermal protocol was
95 °C for 3 min followed by 18 cycles of 95°C for 20 sec, 55°C for 3 min and 72°C for 20 sec.
For RT-qPCR the preamplified cDNA was diluted 1:9 with water. QPCR was performed on
the high-throughput BioMark™ HD system using GE Dynamic Array chips (Fluidigm).
Spurgeon et al. (2008) describe this system in detail. Briefly, it applies microfluidic
technology. PCR reactions take place on a micro-chip in the centre of a chip containing 48 x
48 or 96 x 96 reaction fields. Lines and valves leading from the 48 or 96 assay and 48 or 96
sample wells to the chip are controlled by pressure to manipulate nanolitre scales of samples
and reagents in an automated manner. Thus, 48 x 48 = 2,304 or 96 x 96 = 9,216 PCR
reactions can be carried out simultaneously in one single run. The samples of the stimulation
experiment were measured on four 96.96 chips. One 6 h E. coli treated pbMEC II sample
Material and methods
33
was measured repeatedly on all chips as between-chip calibrator. It was chosen as a
representative and stable sample that expressed all genes of interest to provide similar
reaction conditions and expression levels as in the other samples. The sample mix used 1.25
µl 1:9 diluted cDNA in a total volume of 5 µl consisting of 2.5 µl SsoFast EvaGreen Supermix
(Bio-Rad), 0.25 µl sample loading reagent (Fluidigm), 0.1 µl ROX diluted 1:3 (Life
Technologies, Darmstadt, Germany) and water. The assay mix contained 2.5 µl assay
loading reagent (Fluidigm), a final concentration of 4 µM of forward and reverse primer and
water in a total volume of 5 µl. The final primer concentration in the PCR reaction was 400
nM. Assay and sample mix were transferred to the primed GE Dynamic Array 48.48 or 96.96.
The samples and assays were mixed inside the chip by the Nanoflex IFC controller
(Fluidigm). The PCR temperature profile was 40 sec at 98°C, followed by 40 cycles of 10 sec
at 95°C and 40 sec at 60°C. Afterwards a melting curve of the amplified products was
determined. Data was collected using BioMark Data Collection Software 2.1.1. built
20090519.0926 (Fluidigm) as the cycle of quantification (Cq) where the fluorescence signal
of the amplified DNA intersected with the background noise.
3.7. Data analysis of the RT-qPCR
Comparison of milk and tissue-derived pbMEC I and fibroblasts
Primer specifity was checked by inspecting the melting curve of the PCR product for the
existence of one single peak, indicating that only one product was present, and by running a
1.5 % agarose gel of the product to ensure that the fragment length was correct. Gene
expression was measured in terms of cycle of quantification (Cq), the PCR cycle where the
fluorescence signal intersected with the threshold. This was automatically detected by the
Rotorgene Q PCR software version 1.7 (Build 94) (Qiagen). KRT8 was used as a reference
gene for normalization of the target genes. It belongs to the cytoskeleton and was therefore
suspected and confirmed to be stably expressed. Cq was subtracted from the target genes’
Cq to obtain the dCq, the relative level of gene expression. Statistics and charts were
produced with SigmaPlot 11.0 (Systat, Chicago, IL, USA) or SPSS Statistics Standard 19.0
(IBM, Armonk, NY, USA).
Comparison of cattle breeds with pbMEC II
The valid qPCR reactions were detected with Fluidigm Melting Curve Analysis Software
1.1.0. built 20100514.1234 and Real-time PCR Analysis Software 2.1.1. built 20090521.1135
Material and methods
34
(Fluidigm). Invalid reactions were not used and treated as missing data. Raw Cq values were
processed with Genex 5.3.2 (MultID Analyses AB, Gothenburg, Sweden) applying between-
chip calibration and reference gene normalization. Six putative reference genes were chosen
upon literature review. With the Normfinder tool in Genex 5.3.2 (MultID), actin, gamma 1
(ACTG1), H3 histone, family 3A (H3F3A) and KRT8 were identified as stably expressed and
afterwards used for target gene normalization. Cq values higher than 30 were regarded as
invalid and treated as missing data. For the gene regulation analysis, but not for the replicate
deviations, Cq values higher than 25 were regarded as invalid and replaced by 25 due to
loss of measurement precision as suggested by the manufacturer. The raw Cq value was
subtracted from the average of the reference genes' Cq to calculate the dCq value. The
ddCq value was obtained by subtracting the dCq of the treated from the dCq of the control
sample. Principal component analysis (PCA) on autoscaled dCq and autoscaled ddCq
values was done with Genex 5.3.2 (MultID). Distribution of the qPCR and cell culture
replicate deviations, termed as “within-chip variation”, was calculated with gnuplot 4.4.0
(Sourceforge.net, Geeknet Inc., Fairfax, VA, USA). Between-chip deviations of the calibrator
sample and within-chip deviations were calculated separately for high expression genes with
an overall mean Cq below 20 and low expression genes with an overall mean Cq above 20,
respectively. Statistics and charts were produced with SigmaPlot 11 (Systat) or SPSS
Statistics Standard 19.0 (IBM). Genes were regarded as differentially expressed for P<0.05
in a paired t-test or signed rank test on dCq values between treatment and corresponding
control. Fold changes of gene expression were calculated as 2-ddCq according to Livak and
Schmittgen (2001) for each sample and then expressed as a mean of all these fold changes
to show the amount of regulation in each gene. Expression fold changes were compared
between breeds with independent t-tests in SPSS (IBM).
3.8. Protein quantification with ELISA
Total protein content
Total protein content in the cell protein samples of pbMEC II was measured with the BCA
assay. In this reaction Cu2+ is reduced to Cu+ by the peptide bonds in the protein in a
proportional manner. It then forms a chelate complex with two BCA molecules. This complex
exhibits a purple colour and its OD is measured photometrically at 562 nm (Smith et al.,
1985). Briefly, CuSO4 and bicin choninic acid (BCA) solution (Sigma-Aldrich) mixed 1:50
were incubated together with the protein samples (1:1 diluted in PBST) or a standard curve
Material and methods
35
of diluted bovine serum albumin (BSA) for 40 min at 37°C and measured with the Sunrise
photometer (Tecan, Männedorf, Switzerland).
Lactoferrin
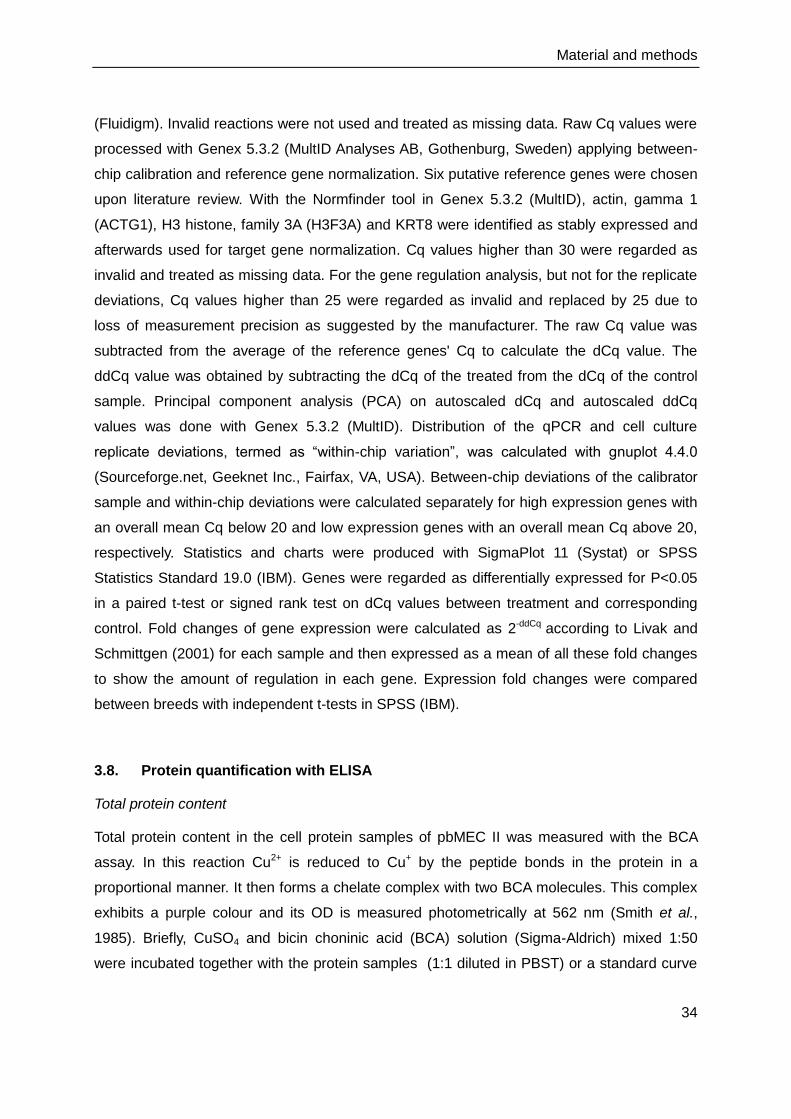
Lactoferrin (LF) was quantified using a competitive ELISA (Figure 9) as described in
Danowski et al. (2012b). A 96-well microtiter plate (Nunc) was coated with 1 µg/well of a
polyclonal goat anti-rabbit IgG antibody as primary antibody (immunised with rabbit IgG,
Sigma-Aldrich) and stored at -20°C until use. After thawing at room temperature and washing
four times with PBST 20 µl of cell protein sample were incubated at 4°C on a shaker
overnight together with a polyclonal rabbit anti-bovine LF antibody as secondary antibody,
diluted 1:400,000 in PBST. A standard curve of LF (Sigma-Aldrich) diluted in PBST was run
on each plate. On the next day biotinylated LF (Sigma-Aldrich) diluted 1:400,000 in PBST
was added and incubated at room temperature on a shaker and protected from light for 2 h.
After washing streptavidin labelled horseradish peroxidase (SHRP) diluted 1:20,000 in PBST
was added and incubated at room temperature on a shaker and protected from light for 15
min.
Fig. 9: Scheme of the competitive lactoferrin (LF) ELISA used for LF quantification in cell protein.
Material and methods
36
The plate was washed again before the chromogenic substrate 3,3,5,5-tetramethylbenzidine
(TMB) was added and incubated at 37°C on a shaker protected from light for 40 min. Then
the reaction was stopped with H2SO4 and the OD measured with the Sunrise photometer
(Tecan) at 450 nm.
Interleukin-10
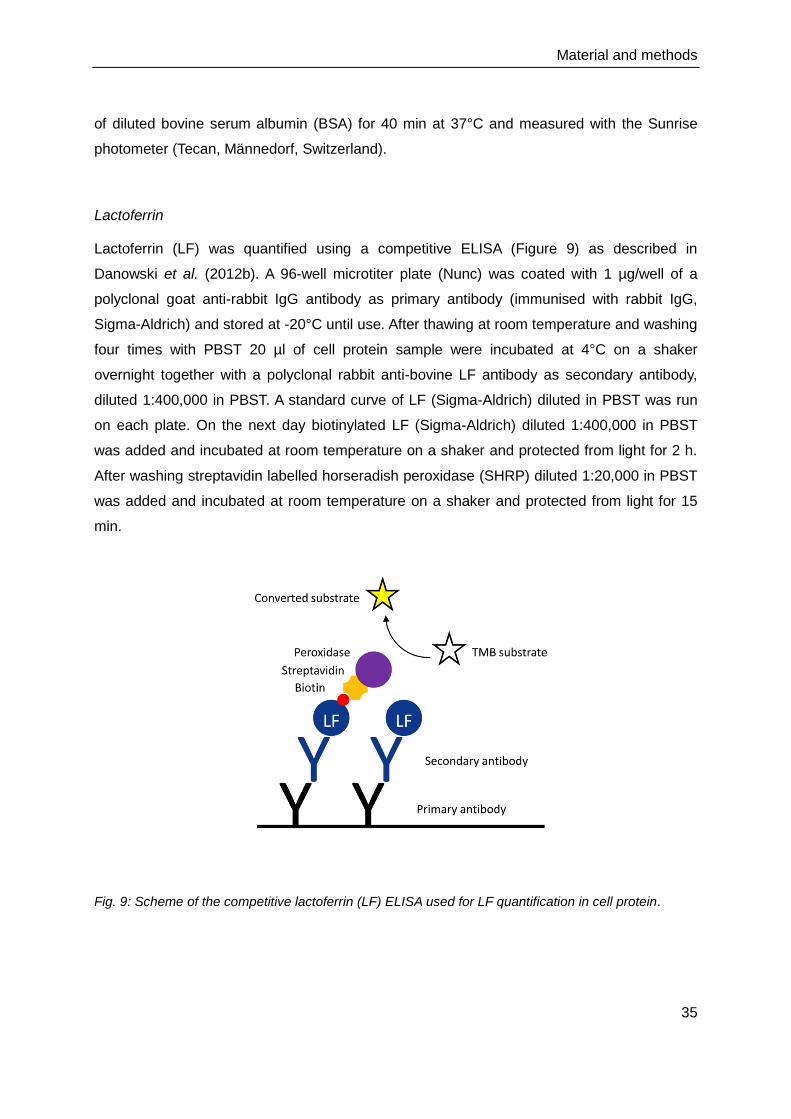
Interleukin-10 (IL-10) was measured with a sandwich ELISA (Figure 10) as described in
Groebner et al. (2011). Briefly, 96-well microtiter plates (Nunc) were coated with monoclonal
mouse anti-bovine IL-10 antibody clone CC318 (AbD Serotec, Düsseldorf, Germany) as
capture antibody at 5 µg/ml in carbonate-bicarbonate buffer at 4°C on a shaker over night.
Cell protein diluted 1:50 in PBST was incubated at room temperature on a shaker protected
from light for 1 h. Biotinylated monoclonal mouse anti-bovine IL-10 antibody clone CC320
(AbD Serotec) was added as detection antibody at 1 µg/ml in PBST and incubated at room
temperature on a shaker protected from light for 2 h. No standard curve was performed as
there was no commercially available bovine IL-10 standard.
Fig 10: Scheme of the sandwich ELISA used for relative IL-10 quantification in cell protein.
Material and methods
37
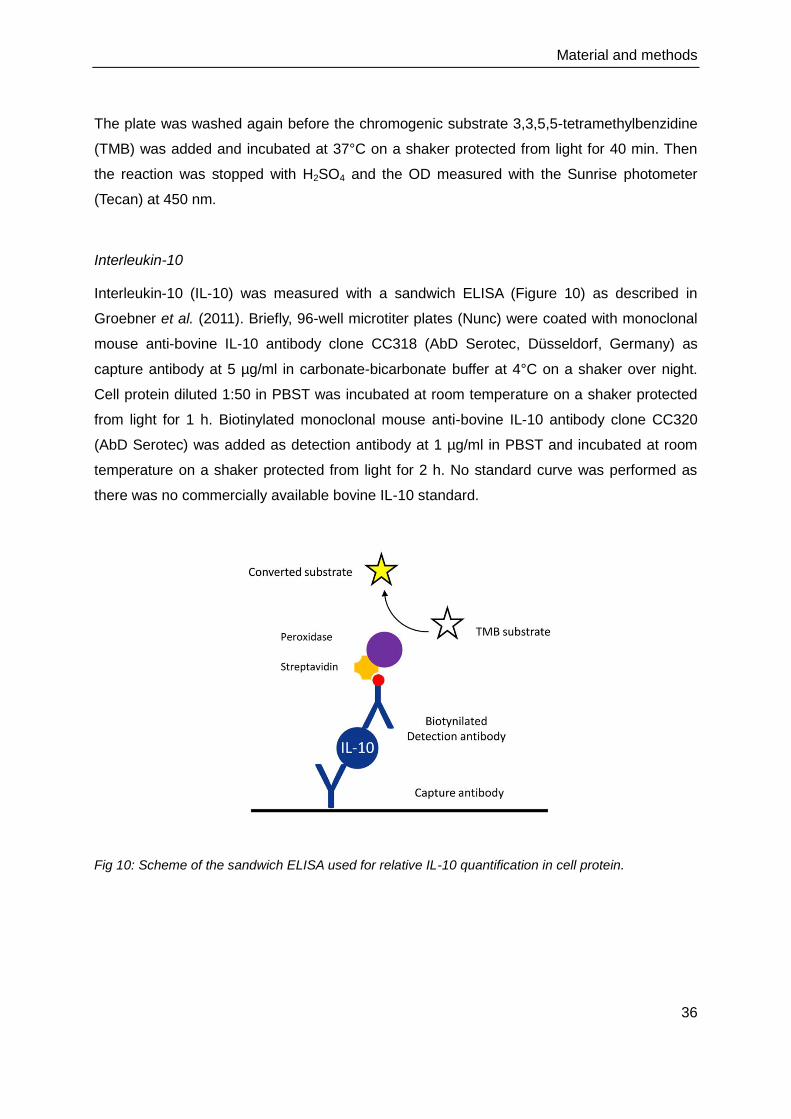
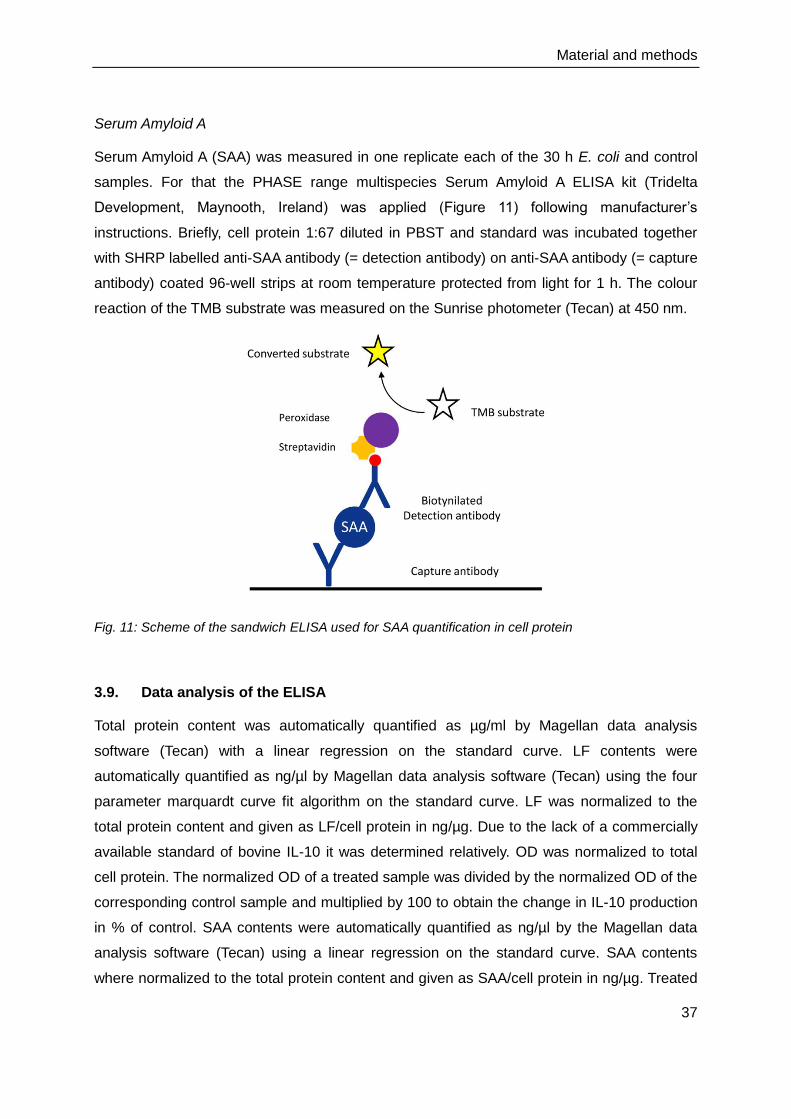
Serum Amyloid A
Serum Amyloid A (SAA) was measured in one replicate each of the 30 h E. coli and control
samples. For that the PHASE range multispecies Serum Amyloid A ELISA kit (Tridelta
Development, Maynooth, Ireland) was applied (Figure 11) following manufacturer’s
instructions. Briefly, cell protein 1:67 diluted in PBST and standard was incubated together
with SHRP labelled anti-SAA antibody (= detection antibody) on anti-SAA antibody (= capture
antibody) coated 96-well strips at room temperature protected from light for 1 h. The colour
reaction of the TMB substrate was measured on the Sunrise photometer (Tecan) at 450 nm.
Fig. 11: Scheme of the sandwich ELISA used for SAA quantification in cell protein
3.9. Data analysis of the ELISA
Total protein content was automatically quantified as µg/ml by Magellan data analysis
software (Tecan) with a linear regression on the standard curve. LF contents were
automatically quantified as ng/µl by Magellan data analysis software (Tecan) using the four
parameter marquardt curve fit algorithm on the standard curve. LF was normalized to the
total protein content and given as LF/cell protein in ng/µg. Due to the lack of a commercially
available standard of bovine IL-10 it was determined relatively. OD was normalized to total
cell protein. The normalized OD of a treated sample was divided by the normalized OD of the
corresponding control sample and multiplied by 100 to obtain the change in IL-10 production
in % of control. SAA contents were automatically quantified as ng/µl by the Magellan data
analysis software (Tecan) using a linear regression on the standard curve. SAA contents
where normalized to the total protein content and given as SAA/cell protein in ng/µg. Treated
Material and methods
38
and control samples were compared with SigmaPlot 11 (Systat) using a paired t-test or
signed rank test. Breeds were compared with a one-way-ANOVA or independent t-tests in
SPSS (IBM). It is important to remark that in all statistical tests no correction of P-values for
multiple testing was used. As this study is of descriptive and exploratory character only and
not of a diagnostic one, the goal was merely to show apparent differences. Many of these
would have been masked by this stringent condition for significance. We are, however, aware
of the fact that this increases the risk of false positive significances, so the results have been
interpreted cautiously.
Results and discussion
39
4. Results and discussion
4.1. Cell culture and immunocytochemistry
Cell culture can be defined as “a culture derived from dispersed cells taken from original
tissue, from a primary culture, or from a cell line or cell strain by enzymatic, mechanical, or
chemical disaggregation” (Freshney, 2005). The culture of animal cells had first been
established as a means to multiply viruses to produce vaccines at the beginning of the 20th
century. As early as that, scientists already studied the interactions of pathogenic bacteria
with cultured chick embryo cells (Smyth, 1915). The first cultivation of primary bovine
mammary epithelial cells (pbMEC) from udder tissue was published in 1961 (Ebner et al.,
1961). Tissue is the most common source for primary cell culture. It can be obtained from
biopsies or after slaughtering of the animal and is then processed using mechanical
rupturing, enzymatic digest or both. The idea to grow mammary epithelial cells not from
tissue but from milk was first realized using human (Buehring, 1972) and baboon’s milk (Rie
et al., 1976). Later, this protocol was adapted also for cow’s milk to culture pbMEC (Buehring,
1990). This method has many advantages over the tissue-derived culture: it is non-invasive
and therefore especially suited when valuable animals should not be harmed or killed, or
when repeated sampling is desired. Also there is almost no contamination by fibroblasts
(Buehring, 1990). This is why the milk-derived culture was chosen and evaluated against the
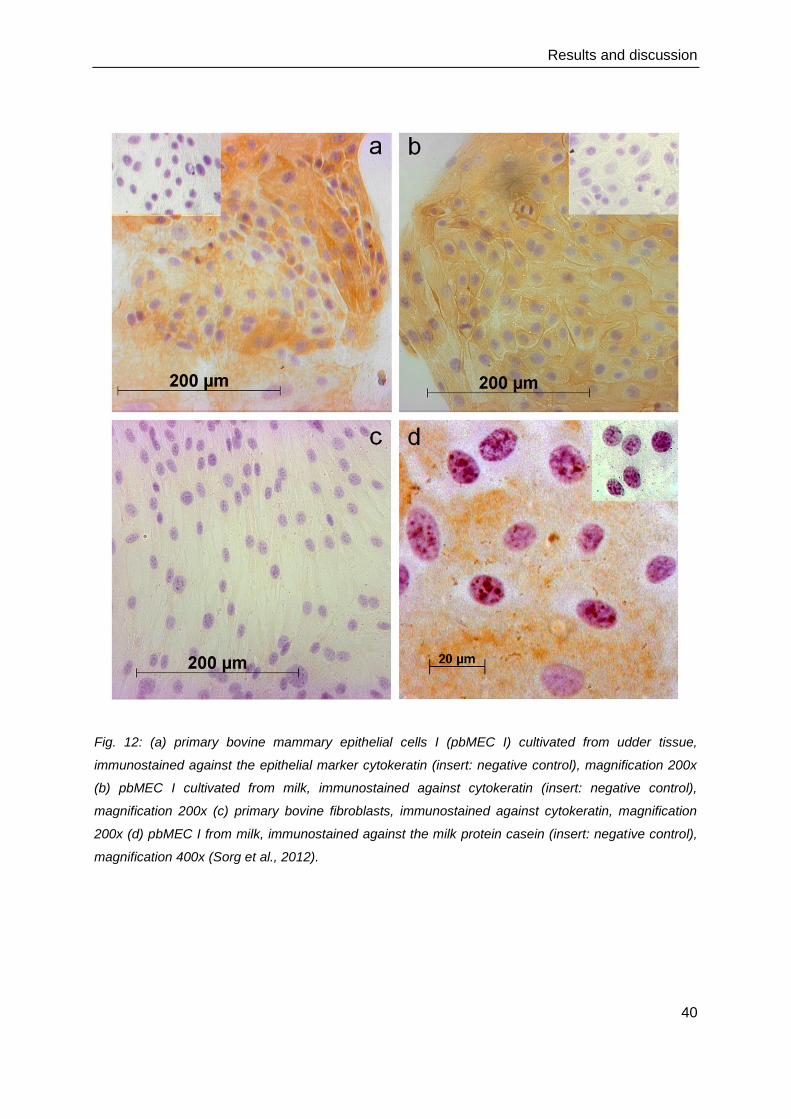
tissue-derived culture (Sorg et al., 2012). In both tissue (Figure 12a) and milk-derived
pbMEC I (Figure 12b), the predominant cell type was of epithelial origin as proved by specific
staining against the epithelial marker cytokeratin, and showed the typical cobblestone-like
monolayer with slightly varying cell sizes. Only few fibroblasts were found in the tissue
cultures. The fibroblast culture (Figure 12c) and negative control (Figure 12a, 12b insert)
showed no cytokeratin staining. PbMEC I from milk also stained positively for casein (Figure
12d, insert: negative control). The casein staining demonstrated that the cultured pbMEC
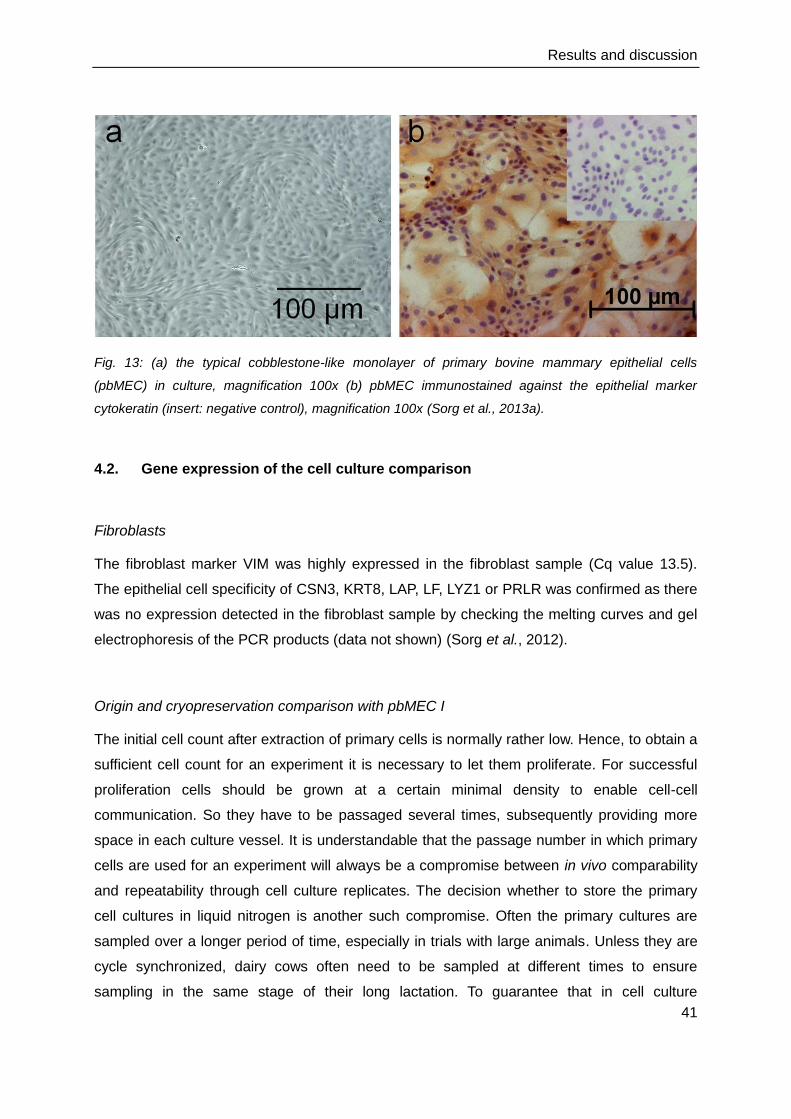
were still able to synthesize the milk protein casein. The pbMEC II cultures exhibited the
typical cobblestone-like morphology as checked by light microscopy (Figure 13a) (Sorg et al.,
2013a). An average of 5.98 x 10⁶ cells per animal in a range of 1 to 19 x 106 cells was
harvested for cryopreservation. By visual inspection with light microscopy there were nearly
0% unstained nucleated cells detected, so the purity of all cultures was estimated at nearly
100% (Figure 13b). The negative controls showed approximately 0% visible stained cells
(Figure 13b (insert)).
Results and discussion
40
Fig. 12: (a) primary bovine mammary epithelial cells I (pbMEC I) cultivated from udder tissue,
immunostained against the epithelial marker cytokeratin (insert: negative control), magnification 200x
(b) pbMEC I cultivated from milk, immunostained against cytokeratin (insert: negative control),
magnification 200x (c) primary bovine fibroblasts, immunostained against cytokeratin, magnification
200x (d) pbMEC I from milk, immunostained against the milk protein casein (insert: negative control),
magnification 400x (Sorg et al., 2012).
Results and discussion
41
Fig. 13: (a) the typical cobblestone-like monolayer of primary bovine mammary epithelial cells
(pbMEC) in culture, magnification 100x (b) pbMEC immunostained against the epithelial marker
cytokeratin (insert: negative control), magnification 100x (Sorg et al., 2013a).
4.2. Gene expression of the cell culture comparison
Fibroblasts
The fibroblast marker VIM was highly expressed in the fibroblast sample (Cq value 13.5).
The epithelial cell specificity of CSN3, KRT8, LAP, LF, LYZ1 or PRLR was confirmed as there
was no expression detected in the fibroblast sample by checking the melting curves and gel
electrophoresis of the PCR products (data not shown) (Sorg et al., 2012).
Origin and cryopreservation comparison with pbMEC I
The initial cell count after extraction of primary cells is normally rather low. Hence, to obtain a
sufficient cell count for an experiment it is necessary to let them proliferate. For successful
proliferation cells should be grown at a certain minimal density to enable cell-cell
communication. So they have to be passaged several times, subsequently providing more
space in each culture vessel. It is understandable that the passage number in which primary
cells are used for an experiment will always be a compromise between in vivo comparability
and repeatability through cell culture replicates. The decision whether to store the primary
cell cultures in liquid nitrogen is another such compromise. Often the primary cultures are
sampled over a longer period of time, especially in trials with large animals. Unless they are
cycle synchronized, dairy cows often need to be sampled at different times to ensure
sampling in the same stage of their long lactation. To guarantee that in cell culture
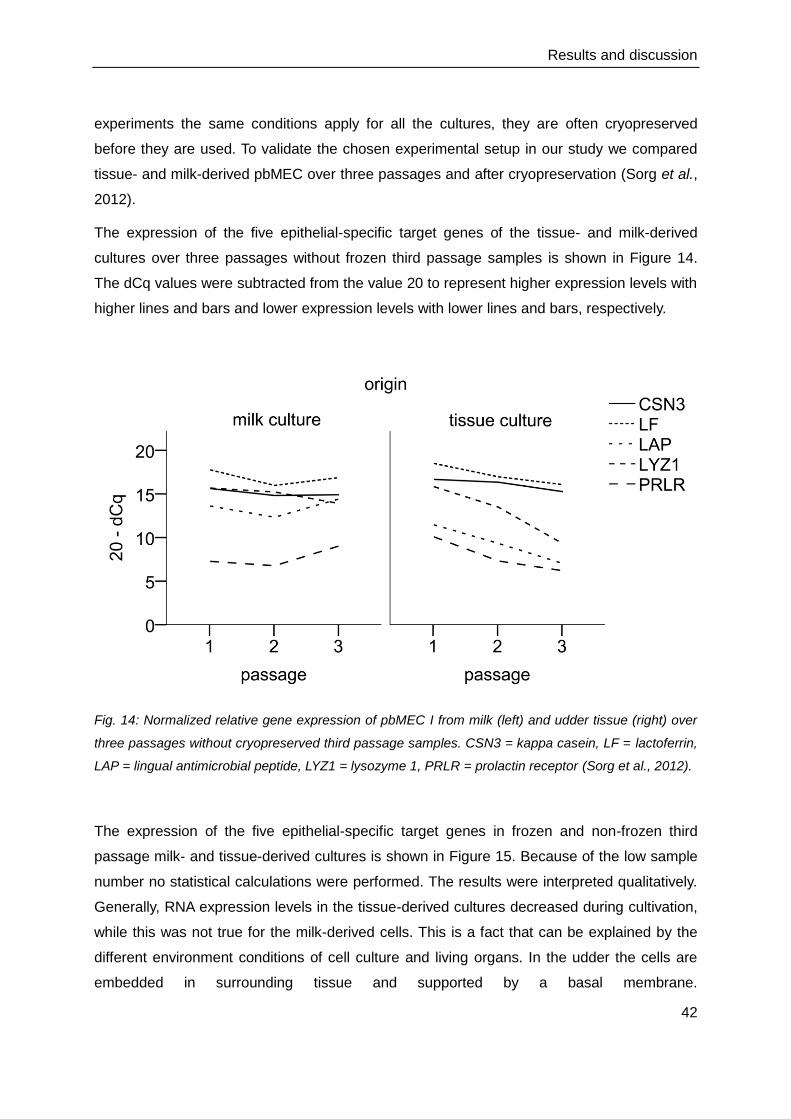
Results and discussion
42
experiments the same conditions apply for all the cultures, they are often cryopreserved
before they are used. To validate the chosen experimental setup in our study we compared
tissue- and milk-derived pbMEC over three passages and after cryopreservation (Sorg et al.,
2012).
The expression of the five epithelial-specific target genes of the tissue- and milk-derived
cultures over three passages without frozen third passage samples is shown in Figure 14.
The dCq values were subtracted from the value 20 to represent higher expression levels with
higher lines and bars and lower expression levels with lower lines and bars, respectively.
Fig. 14: Normalized relative gene expression of pbMEC I from milk (left) and udder tissue (right) over
three passages without cryopreserved third passage samples. CSN3 = kappa casein, LF = lactoferrin,
LAP = lingual antimicrobial peptide, LYZ1 = lysozyme 1, PRLR = prolactin receptor (Sorg et al., 2012).
The expression of the five epithelial-specific target genes in frozen and non-frozen third
passage milk- and tissue-derived cultures is shown in Figure 15. Because of the low sample
number no statistical calculations were performed. The results were interpreted qualitatively.
Generally, RNA expression levels in the tissue-derived cultures decreased during cultivation,
while this was not true for the milk-derived cells. This is a fact that can be explained by the
different environment conditions of cell culture and living organs. In the udder the cells are
embedded in surrounding tissue and supported by a basal membrane.
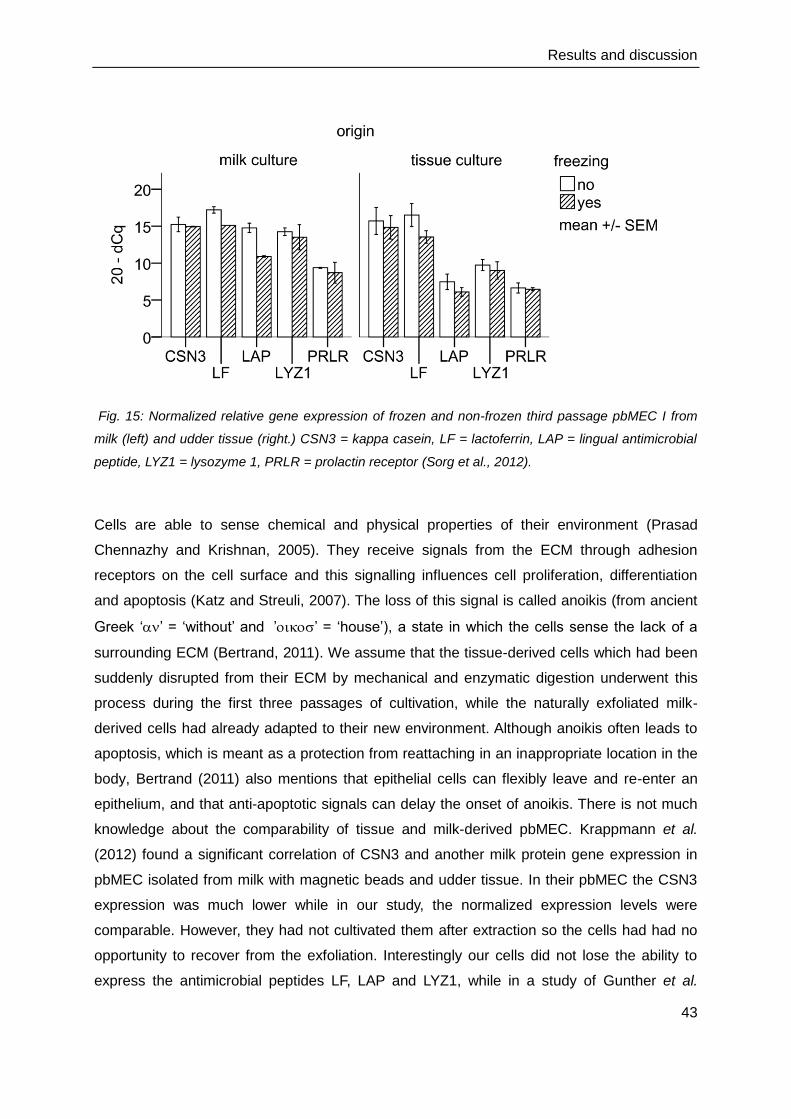
Results and discussion
43
Fig. 15: Normalized relative gene expression of frozen and non-frozen third passage pbMEC I from
milk (left) and udder tissue (right.) CSN3 = kappa casein, LF = lactoferrin, LAP = lingual antimicrobial
peptide, LYZ1 = lysozyme 1, PRLR = prolactin receptor (Sorg et al., 2012).
Cells are able to sense chemical and physical properties of their environment (Prasad
Chennazhy and Krishnan, 2005). They receive signals from the ECM through adhesion
receptors on the cell surface and this signalling influences cell proliferation, differentiation
and apoptosis (Katz and Streuli, 2007). The loss of this signal is called anoikis (from ancient
Greek ‘’ = ‘without’ and ’’ = ‘house’), a state in which the cells sense the lack of a
surrounding ECM (Bertrand, 2011). We assume that the tissue-derived cells which had been
suddenly disrupted from their ECM by mechanical and enzymatic digestion underwent this
process during the first three passages of cultivation, while the naturally exfoliated milk-
derived cells had already adapted to their new environment. Although anoikis often leads to
apoptosis, which is meant as a protection from reattaching in an inappropriate location in the
body, Bertrand (2011) also mentions that epithelial cells can flexibly leave and re-enter an
epithelium, and that anti-apoptotic signals can delay the onset of anoikis. There is not much
knowledge about the comparability of tissue and milk-derived pbMEC. Krappmann et al.
(2012) found a significant correlation of CSN3 and another milk protein gene expression in
pbMEC isolated from milk with magnetic beads and udder tissue. In their pbMEC the CSN3
expression was much lower while in our study, the normalized expression levels were
comparable. However, they had not cultivated them after extraction so the cells had had no
opportunity to recover from the exfoliation. Interestingly our cells did not lose the ability to
express the antimicrobial peptides LF, LAP and LYZ1, while in a study of Gunther et al.
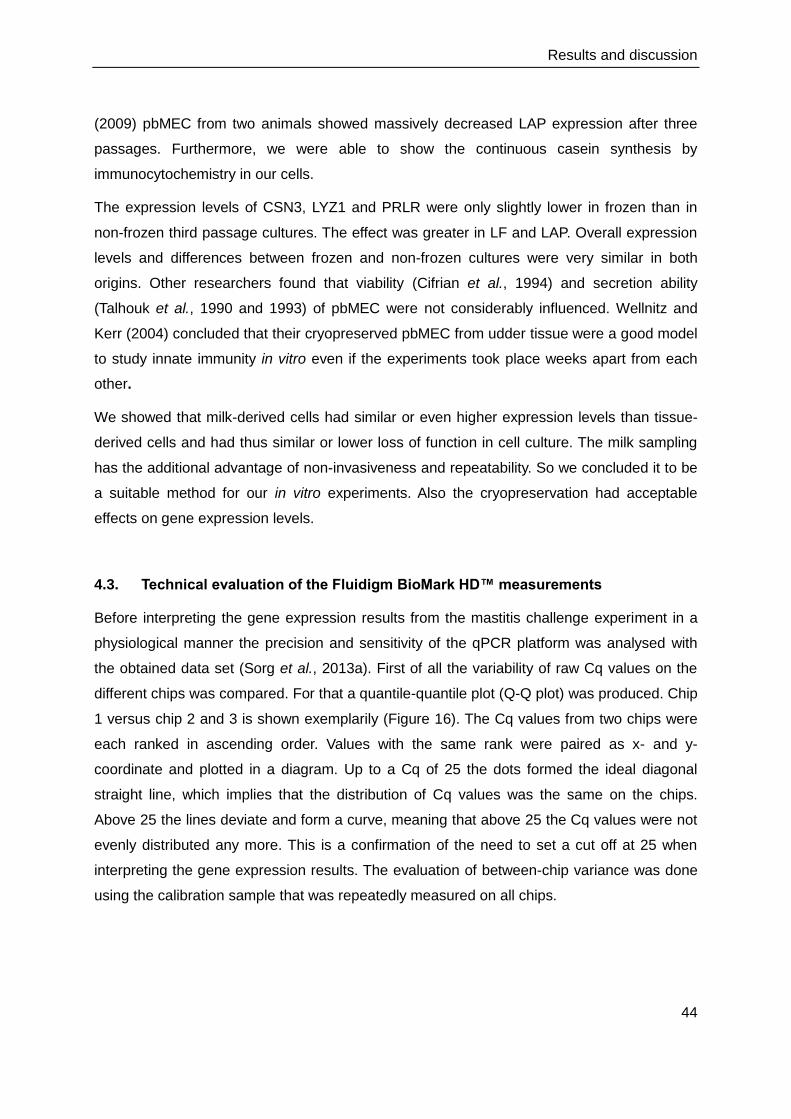
Results and discussion
44
(2009) pbMEC from two animals showed massively decreased LAP expression after three
passages. Furthermore, we were able to show the continuous casein synthesis by
immunocytochemistry in our cells.
The expression levels of CSN3, LYZ1 and PRLR were only slightly lower in frozen than in
non-frozen third passage cultures. The effect was greater in LF and LAP. Overall expression
levels and differences between frozen and non-frozen cultures were very similar in both
origins. Other researchers found that viability (Cifrian et al., 1994) and secretion ability
(Talhouk et al., 1990 and 1993) of pbMEC were not considerably influenced. Wellnitz and
Kerr (2004) concluded that their cryopreserved pbMEC from udder tissue were a good model
to study innate immunity in vitro even if the experiments took place weeks apart from each
other.
We showed that milk-derived cells had similar or even higher expression levels than tissue-
derived cells and had thus similar or lower loss of function in cell culture. The milk sampling
has the additional advantage of non-invasiveness and repeatability. So we concluded it to be
a suitable method for our in vitro experiments. Also the cryopreservation had acceptable
effects on gene expression levels.
4.3. Technical evaluation of the Fluidigm BioMark HD™ measurements
Before interpreting the gene expression results from the mastitis challenge experiment in a
physiological manner the precision and sensitivity of the qPCR platform was analysed with
the obtained data set (Sorg et al., 2013a). First of all the variability of raw Cq values on the
different chips was compared. For that a quantile-quantile plot (Q-Q plot) was produced. Chip
1 versus chip 2 and 3 is shown exemplarily (Figure 16). The Cq values from two chips were
each ranked in ascending order. Values with the same rank were paired as x- and y-
coordinate and plotted in a diagram. Up to a Cq of 25 the dots formed the ideal diagonal
straight line, which implies that the distribution of Cq values was the same on the chips.
Above 25 the lines deviate and form a curve, meaning that above 25 the Cq values were not
evenly distributed any more. This is a confirmation of the need to set a cut off at 25 when
interpreting the gene expression results. The evaluation of between-chip variance was done
using the calibration sample that was repeatedly measured on all chips.
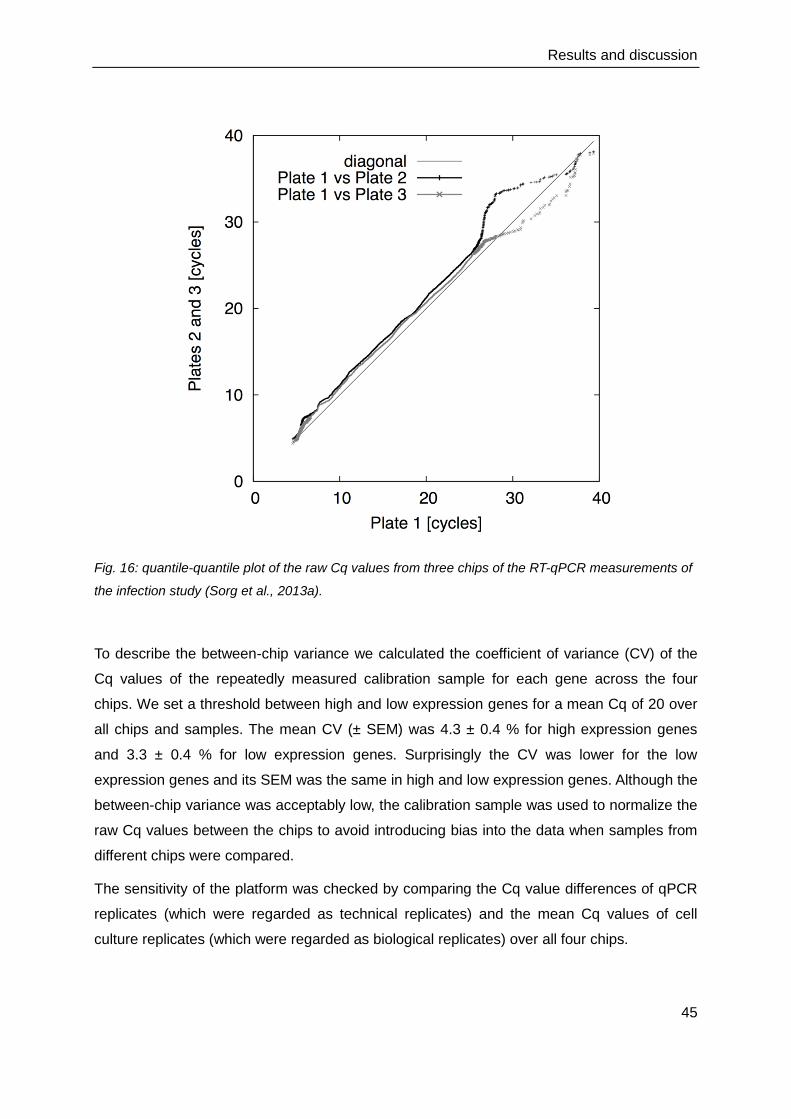
Results and discussion
45
Fig. 16: quantile-quantile plot of the raw Cq values from three chips of the RT-qPCR measurements of
the infection study (Sorg et al., 2013a).
To describe the between-chip variance we calculated the coefficient of variance (CV) of the
Cq values of the repeatedly measured calibration sample for each gene across the four
chips. We set a threshold between high and low expression genes for a mean Cq of 20 over
all chips and samples. The mean CV (± SEM) was 4.3 ± 0.4 % for high expression genes
and 3.3 ± 0.4 % for low expression genes. Surprisingly the CV was lower for the low
expression genes and its SEM was the same in high and low expression genes. Although the
between-chip variance was acceptably low, the calibration sample was used to normalize the
raw Cq values between the chips to avoid introducing bias into the data when samples from
different chips were compared.
The sensitivity of the platform was checked by comparing the Cq value differences of qPCR
replicates (which were regarded as technical replicates) and the mean Cq values of cell
culture replicates (which were regarded as biological replicates) over all four chips.
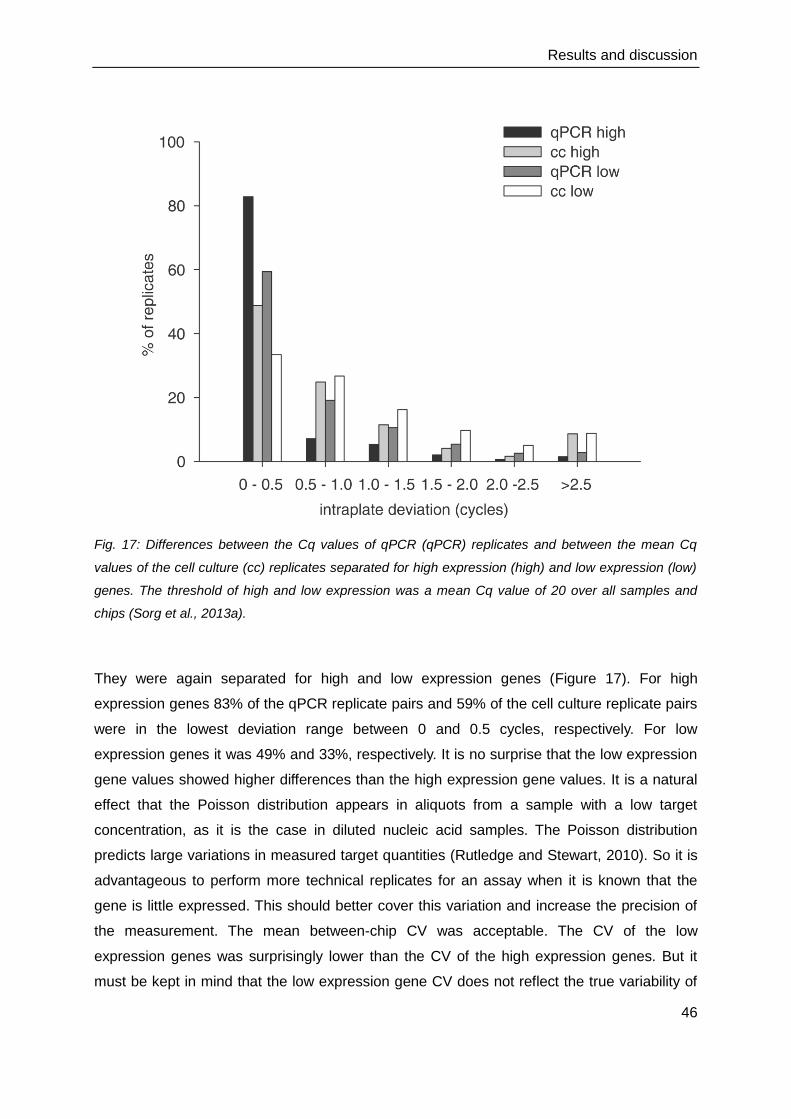
Results and discussion
46
Fig. 17: Differences between the Cq values of qPCR (qPCR) replicates and between the mean Cq
values of the cell culture (cc) replicates separated for high expression (high) and low expression (low)
genes. The threshold of high and low expression was a mean Cq value of 20 over all samples and
chips (Sorg et al., 2013a).
They were again separated for high and low expression genes (Figure 17). For high
expression genes 83% of the qPCR replicate pairs and 59% of the cell culture replicate pairs
were in the lowest deviation range between 0 and 0.5 cycles, respectively. For low
expression genes it was 49% and 33%, respectively. It is no surprise that the low expression
gene values showed higher differences than the high expression gene values. It is a natural
effect that the Poisson distribution appears in aliquots from a sample with a low target
concentration, as it is the case in diluted nucleic acid samples. The Poisson distribution
predicts large variations in measured target quantities (Rutledge and Stewart, 2010). So it is
advantageous to perform more technical replicates for an assay when it is known that the
gene is little expressed. This should better cover this variation and increase the precision of
the measurement. The mean between-chip CV was acceptable. The CV of the low
expression genes was surprisingly lower than the CV of the high expression genes. But it
must be kept in mind that the low expression gene CV does not reflect the true variability of
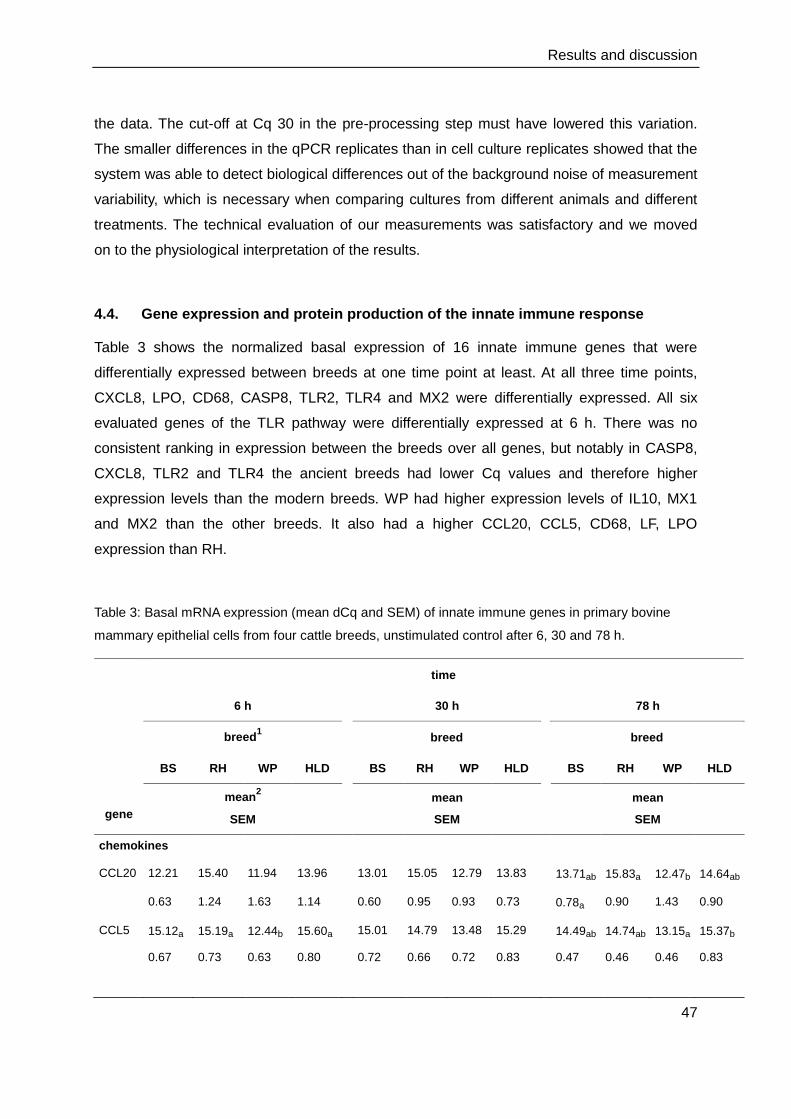
Results and discussion
47
the data. The cut-off at Cq 30 in the pre-processing step must have lowered this variation.
The smaller differences in the qPCR replicates than in cell culture replicates showed that the
system was able to detect biological differences out of the background noise of measurement
variability, which is necessary when comparing cultures from different animals and different
treatments. The technical evaluation of our measurements was satisfactory and we moved
on to the physiological interpretation of the results.
4.4. Gene expression and protein production of the innate immune response
Table 3 shows the normalized basal expression of 16 innate immune genes that were
differentially expressed between breeds at one time point at least. At all three time points,
CXCL8, LPO, CD68, CASP8, TLR2, TLR4 and MX2 were differentially expressed. All six
evaluated genes of the TLR pathway were differentially expressed at 6 h. There was no
consistent ranking in expression between the breeds over all genes, but notably in CASP8,
CXCL8, TLR2 and TLR4 the ancient breeds had lower Cq values and therefore higher
expression levels than the modern breeds. WP had higher expression levels of IL10, MX1
and MX2 than the other breeds. It also had a higher CCL20, CCL5, CD68, LF, LPO
expression than RH.
Table 3: Basal mRNA expression (mean dCq and SEM) of innate immune genes in primary bovine
mammary epithelial cells from four cattle breeds, unstimulated control after 6, 30 and 78 h.
time
6 h 30 h 78 h
breed1
breed breed
BS RH WP HLD BS RH WP HLD BS RH WP HLD
gene
mean2
SEM
mean
SEM
mean
SEM
chemokines
CCL20 12.21 15.40 11.94 13.96 13.01 15.05 12.79 13.83 13.71ab 15.83a 12.47b 14.64ab
0.63 1.24 1.63 1.14 0.60 0.95 0.93 0.73 0.78a 0.90 1.43 0.90
CCL5 15.12a 15.19a 12.44b 15.60a 15.01 14.79 13.48 15.29 14.49ab 14.74ab 13.15a 15.37b
0.67 0.73 0.63 0.80 0.72 0.66 0.72 0.83 0.47 0.46 0.46 0.83
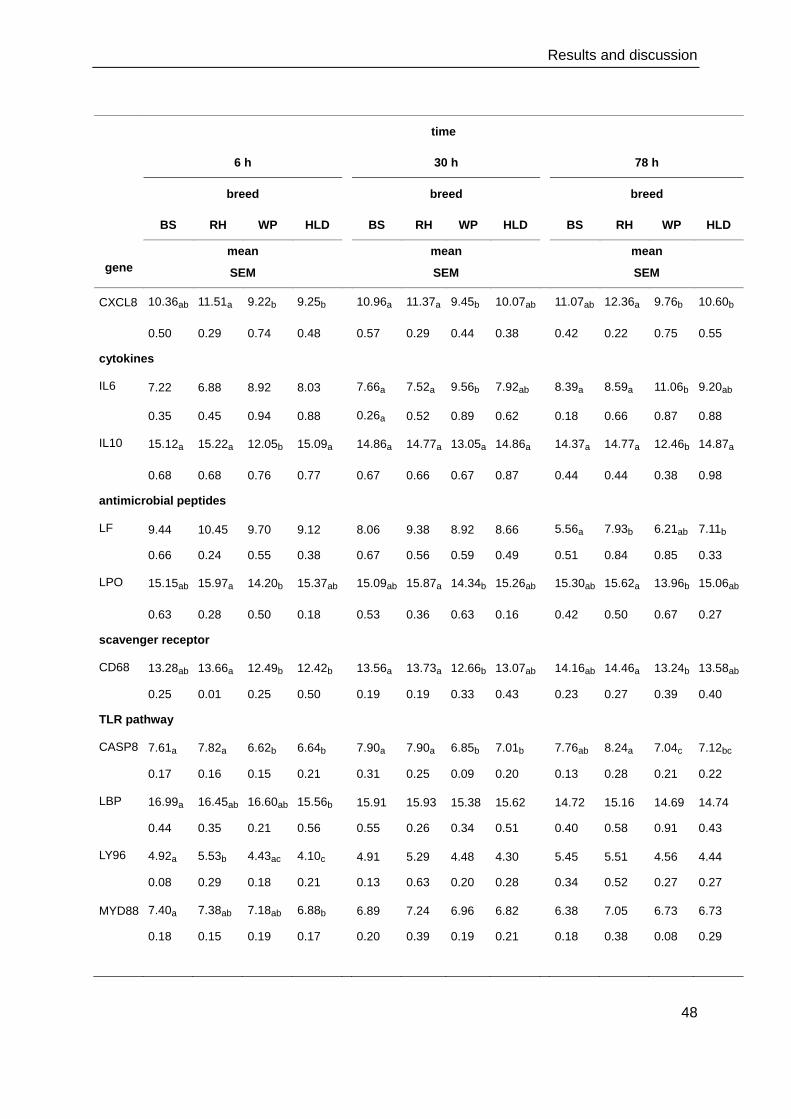
Results and discussion
48
time
6 h 30 h 78 h
breed breed breed
BS RH WP HLD BS RH WP HLD BS RH WP HLD
gene
mean
SEM
mean
SEM
mean
SEM
CXCL8 10.36ab 11.51a 9.22b 9.25b 10.96a 11.37a 9.45b 10.07ab 11.07ab 12.36a 9.76b 10.60b
0.50 0.29 0.74 0.48 0.57 0.29 0.44 0.38 0.42 0.22 0.75 0.55
cytokines
IL6 7.22 6.88 8.92 8.03 7.66a 7.52a 9.56b 7.92ab 8.39a 8.59a 11.06b 9.20ab
0.35 0.45 0.94 0.88 0.26a 0.52 0.89 0.62 0.18 0.66 0.87 0.88
IL10 15.12a 15.22a 12.05b 15.09a 14.86a 14.77a 13.05a 14.86a 14.37a 14.77a 12.46b 14.87a
0.68 0.68 0.76 0.77 0.67 0.66 0.67 0.87 0.44 0.44 0.38 0.98
antimicrobial peptides
LF 9.44 10.45 9.70 9.12 8.06 9.38 8.92 8.66 5.56a 7.93b 6.21ab 7.11b
0.66 0.24 0.55 0.38 0.67 0.56 0.59 0.49 0.51 0.84 0.85 0.33
LPO 15.15ab 15.97a 14.20b 15.37ab 15.09ab 15.87a 14.34b 15.26ab 15.30ab 15.62a 13.96b 15.06ab
0.63 0.28 0.50 0.18 0.53 0.36 0.63 0.16 0.42 0.50 0.67 0.27
scavenger receptor
CD68 13.28ab 13.66a 12.49b 12.42b 13.56a 13.73a 12.66b 13.07ab 14.16ab 14.46a 13.24b 13.58ab
0.25 0.01 0.25 0.50 0.19 0.19 0.33 0.43 0.23 0.27 0.39 0.40
TLR pathway
CASP8 7.61a 7.82a 6.62b 6.64b 7.90a 7.90a 6.85b 7.01b 7.76ab 8.24a 7.04c 7.12bc
0.17 0.16 0.15 0.21 0.31 0.25 0.09 0.20 0.13 0.28 0.21 0.22
LBP 16.99a 16.45ab 16.60ab 15.56b 15.91 15.93 15.38 15.62 14.72 15.16 14.69 14.74
0.44 0.35 0.21 0.56 0.55 0.26 0.34 0.51 0.40 0.58 0.91 0.43
LY96 4.92a 5.53b 4.43ac 4.10c 4.91 5.29 4.48 4.30 5.45 5.51 4.56 4.44
0.08 0.29 0.18 0.21 0.13 0.63 0.20 0.28 0.34 0.52 0.27 0.27
MYD88 7.40a 7.38ab 7.18ab 6.88b 6.89 7.24 6.96 6.82 6.38 7.05 6.73 6.73
0.18 0.15 0.19 0.17 0.20 0.39 0.19 0.21 0.18 0.38 0.08 0.29

Results and discussion
49
time
6 h 30 h 78 h
breed breed breed
BS RH WP HLD BS RH WP HLD BS RH WP HLD
gene mean
SEM
mean
SEM
mean
SEM
TLR2 14.54a 15.21a 14.44ab 13.47b 14.04ab 14.73a 13.75b 13.25bc 13.68ab 14.57a 13.34b 13.02b
0.17 0.36 0.48 0.33 0.37 0.32 0.23 0.27 0.36 0.33 0.19 0.38
TLR4 8.87ab 9.37a 8.10c 8.20bc 8.76ab 9.25a 7.87c 8.09bc 7.91a 9.14b 7.58a 7.97a
0.20 0.16 0.30 0.29 0.30 0.17 0.25 0.21 0.32 0.28 0.31 0.18
others
MX1 6.14ab 6.54ab 4.37a 7.03b 6.52 7.47 4.69 7.49 7.15 7.42 5.20 7.16
0.34 0.88 0.54 1.27 0.41 0.89 0.87 1.48 0.71 0.68 0.27 1.56
MX2 11.59a 11.42a 8.22b 11.61a 11.29ab 12.21a 8.84b 12.38a 11.86ab 12.59a 9.20b 12.05ab
0.72 0.97 0.63 1.24 0.57 1.06 1.08 1.28 0.84 0.96 0.45 1.33
1BS = Brown Swiss, RH = Red Holstein, WP = White Park, HLD = Highland
2means with different subscript letters within one time point are significantly different between the
breeds (P<0.05)
Tables 4 and 5 show the relative fold changes of expression between control and treated
cells. Only genes that were differentially expressed in one breed (P<0.05) or were at least
1.5-fold up regulated are presented. Table 4 shows the fold changes in gene expression after
6 h and 30 h exposure to E. coli. The most regulated gene was SAA3 with nearly 290-fold
and 1900-fold after 6 h and 30 h E. coli in RH. After 6 h, fold changes of C3 and CASP8 were
lower in HLD than in BS, CCL2 and LY96 were lower than in RH, and LPO was lower than in
WP. C3, chemokines and cytokines were generally stronger up regulated. Antimicrobial
peptides were only up regulated in the modern breeds. More of the S100 and MX genes
were differentially expressed in the modern breeds. After 30 h exposure to E. coli, only BS
differed from RH in CD14 fold change. C3, chemokines, cytokines and antimicrobial peptides
were strongly up regulated. The S100 and MX genes were only significantly up regulated in
the modern breeds. Table 5 shows the fold changes in gene expression after 30 h and 78 h
exposure to S. aureus. There were no breed differences after 30 h S. aureus. The few
differentially expressed genes were the antimicrobial peptides LPO and LYZ1 in WP and
TLR4 in BS. After 30 h S. aureus LYZ1 had the highest significant fold change with 1.6 in WP.
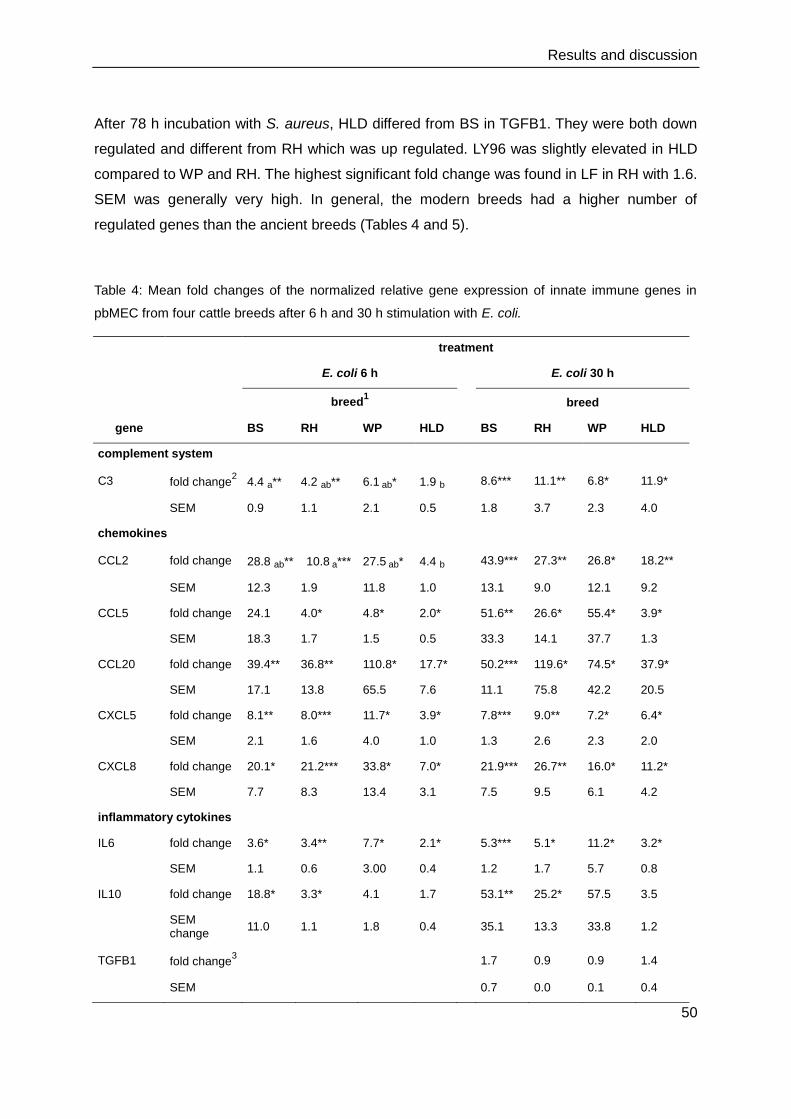
Results and discussion
50
After 78 h incubation with S. aureus, HLD differed from BS in TGFB1. They were both down
regulated and different from RH which was up regulated. LY96 was slightly elevated in HLD
compared to WP and RH. The highest significant fold change was found in LF in RH with 1.6.
SEM was generally very high. In general, the modern breeds had a higher number of
regulated genes than the ancient breeds (Tables 4 and 5).
Table 4: Mean fold changes of the normalized relative gene expression of innate immune genes in
pbMEC from four cattle breeds after 6 h and 30 h stimulation with E. coli.
treatment
E. coli 6 h E. coli 30 h
breed1 breed
gene
BS RH WP HLD BS RH WP HLD
complement system
C3 fold change2 4.4 a** 4.2 ab** 6.1
ab* 1.9 b 8.6*** 11.1** 6.8* 11.9*
SEM 0.9 1.1 2.1 0.5 1.8 3.7 2.3 4.0
chemokines
CCL2 fold change 28.8 ab** 10.8 a*** 27.5
ab* 4.4 b 43.9*** 27.3** 26.8* 18.2**
SEM 12.3 1.9 11.8 1.0 13.1 9.0 12.1 9.2
CCL5 fold change 24.1 4.0* 4.8* 2.0* 51.6** 26.6* 55.4* 3.9*
SEM 18.3 1.7 1.5 0.5 33.3 14.1 37.7 1.3
CCL20 fold change 39.4** 36.8** 110.8* 17.7* 50.2*** 119.6* 74.5* 37.9*
SEM 17.1 13.8 65.5 7.6 11.1 75.8 42.2 20.5
CXCL5 fold change 8.1** 8.0*** 11.7* 3.9* 7.8*** 9.0** 7.2* 6.4*
SEM 2.1 1.6 4.0 1.0 1.3 2.6 2.3 2.0
CXCL8 fold change 20.1* 21.2*** 33.8* 7.0* 21.9*** 26.7** 16.0* 11.2*
SEM 7.7 8.3 13.4 3.1 7.5 9.5 6.1 4.2
inflammatory cytokines
IL6 fold change 3.6* 3.4** 7.7* 2.1* 5.3*** 5.1* 11.2* 3.2*
SEM 1.1 0.6 3.00 0.4 1.2 1.7 5.7 0.8
IL10 fold change 18.8* 3.3* 4.1 1.7 53.1** 25.2* 57.5 3.5
SEM change
11.0 1.1 1.8 0.4
35.1 13.3 33.8 1.2
TGFB1
fold change3
1.7 0.9 0.9 1.4
SEM
0.7 0.0 0.1 0.4
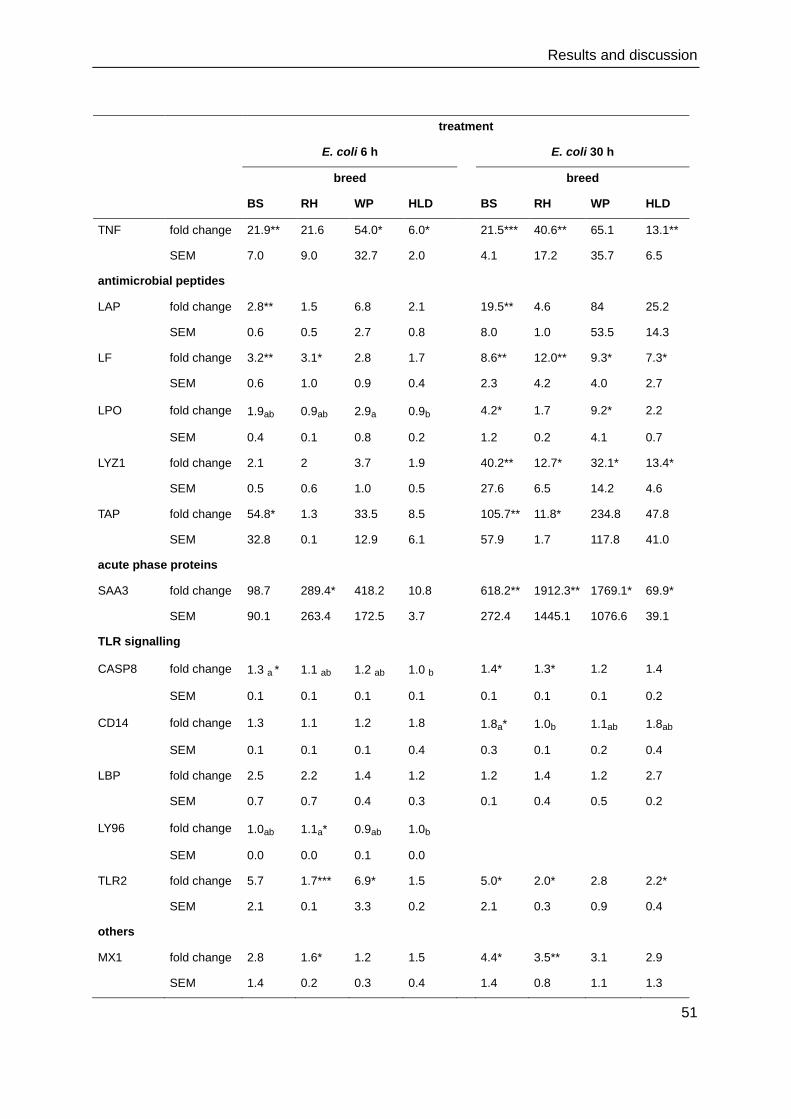
Results and discussion
51
treatment
E. coli 6 h E. coli 30 h
breed breed
BS RH WP HLD BS RH WP HLD
TNF fold change 21.9** 21.6 54.0* 6.0* 21.5*** 40.6** 65.1 13.1**
SEM 7.0 9.0 32.7 2.0 4.1 17.2 35.7 6.5
antimicrobial peptides
LAP fold change 2.8** 1.5 6.8 2.1 19.5** 4.6 84 25.2
SEM 0.6 0.5 2.7 0.8 8.0 1.0 53.5 14.3
LF fold change 3.2** 3.1* 2.8 1.7 8.6** 12.0** 9.3* 7.3*
SEM 0.6 1.0 0.9 0.4 2.3 4.2 4.0 2.7
LPO fold change 1.9ab 0.9ab 2.9a 0.9b 4.2* 1.7 9.2* 2.2
SEM 0.4 0.1 0.8 0.2 1.2 0.2 4.1 0.7
LYZ1 fold change 2.1 2 3.7 1.9 40.2** 12.7* 32.1* 13.4*
SEM 0.5 0.6 1.0 0.5 27.6 6.5 14.2 4.6
TAP fold change 54.8* 1.3 33.5 8.5 105.7** 11.8* 234.8 47.8
SEM 32.8 0.1 12.9 6.1 57.9 1.7 117.8 41.0
acute phase proteins
SAA3 fold change 98.7 289.4* 418.2 10.8 618.2** 1912.3** 1769.1* 69.9*
SEM 90.1 263.4 172.5 3.7 272.4 1445.1 1076.6 39.1
TLR signalling
CASP8 fold change 1.3 a * 1.1 ab 1.2 ab 1.0 b 1.4* 1.3* 1.2 1.4
SEM 0.1 0.1 0.1 0.1 0.1 0.1 0.1 0.2
CD14 fold change 1.3 1.1 1.2 1.8 1.8a* 1.0b 1.1ab 1.8ab
SEM 0.1 0.1 0.1 0.4 0.3 0.1 0.2 0.4
LBP fold change 2.5 2.2 1.4 1.2 1.2 1.4 1.2 2.7
SEM 0.7 0.7 0.4 0.3 0.1 0.4 0.5 0.2
LY96 fold change 1.0ab 1.1a* 0.9ab 1.0b
SEM 0.0 0.0 0.1 0.0
TLR2 fold change 5.7 1.7*** 6.9* 1.5 5.0* 2.0* 2.8 2.2*
SEM 2.1 0.1 3.3 0.2 2.1 0.3 0.9 0.4
others
MX1 fold change 2.8 1.6* 1.2 1.5 4.4* 3.5** 3.1 2.9
SEM 1.4 0.2 0.3 0.4 1.4 0.8 1.1 1.3
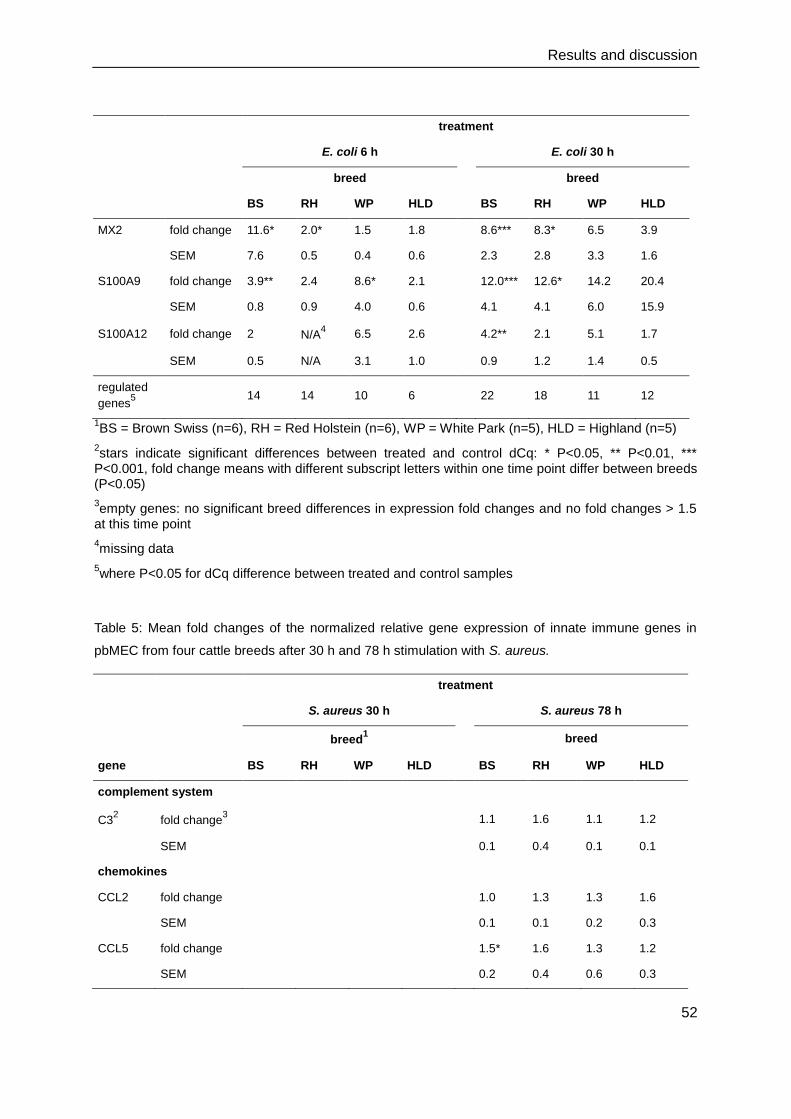
Results and discussion
52
treatment
E. coli 6 h E. coli 30 h
breed breed
BS RH WP HLD BS RH WP HLD
MX2 fold change 11.6* 2.0* 1.5 1.8 8.6*** 8.3* 6.5 3.9
SEM 7.6 0.5 0.4 0.6 2.3 2.8 3.3 1.6
S100A9 fold change 3.9** 2.4 8.6* 2.1 12.0*** 12.6* 14.2 20.4
SEM 0.8 0.9 4.0 0.6 4.1 4.1 6.0 15.9
S100A12 fold change 2 N/A4 6.5 2.6 4.2** 2.1 5.1 1.7
SEM 0.5 N/A 3.1 1.0 0.9 1.2 1.4 0.5
regulated
genes5
14 14 10 6
22 18 11 12
1BS = Brown Swiss (n=6), RH = Red Holstein (n=6), WP = White Park (n=5), HLD = Highland (n=5)
2stars indicate significant differences between treated and control dCq: * P<0.05, ** P<0.01, ***
P<0.001, fold change means with different subscript letters within one time point differ between breeds (P<0.05)
3empty genes: no significant breed differences in expression fold changes and no fold changes > 1.5
at this time point
4missing data
5where P<0.05 for dCq difference between treated and control samples
Table 5: Mean fold changes of the normalized relative gene expression of innate immune genes in
pbMEC from four cattle breeds after 30 h and 78 h stimulation with S. aureus.
treatment
S. aureus 30 h S. aureus 78 h
breed
1 breed
gene
BS RH WP HLD BS RH WP HLD
complement system
C32 fold change
3
1.1 1.6 1.1 1.2
SEM
0.1 0.4 0.1 0.1
chemokines
CCL2 fold change
1.0 1.3 1.3 1.6
SEM
0.1 0.1 0.2 0.3
CCL5 fold change
1.5* 1.6 1.3 1.2
SEM
0.2 0.4 0.6 0.3
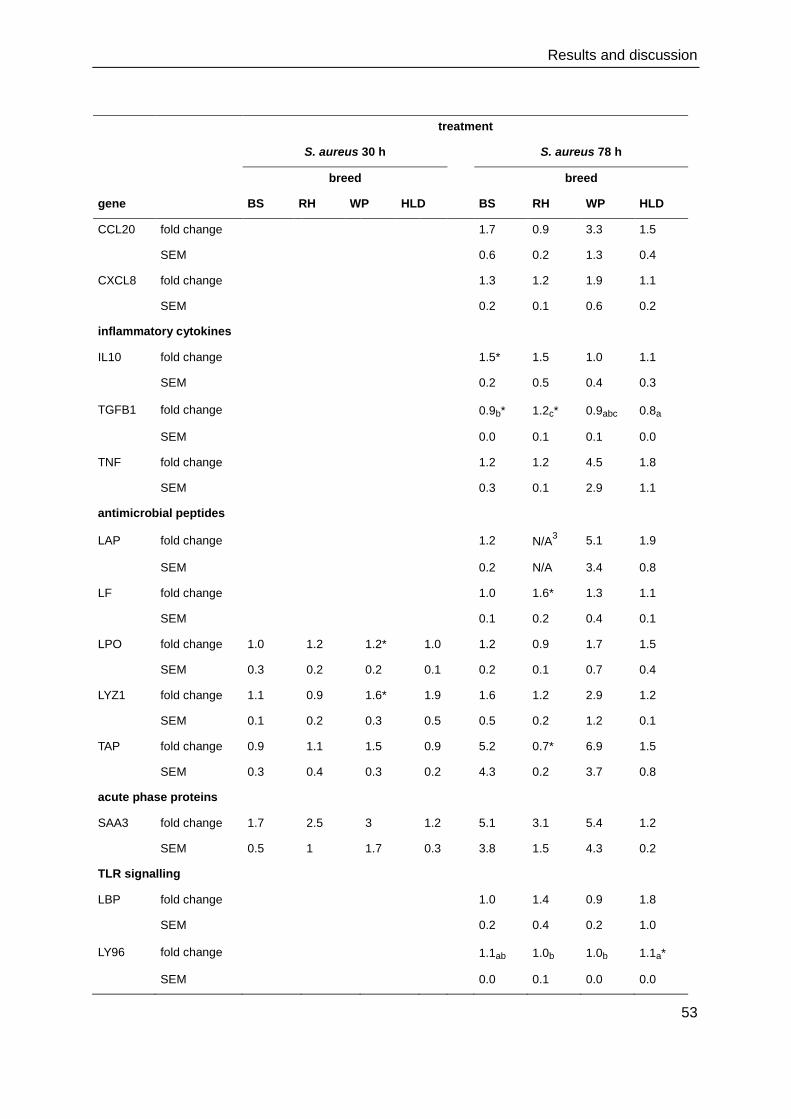
Results and discussion
53
treatment
S. aureus 30 h S. aureus 78 h
breed breed
gene
BS RH WP HLD BS RH WP HLD
CCL20 fold change
1.7 0.9 3.3 1.5
SEM
0.6 0.2 1.3 0.4
CXCL8 fold change
1.3 1.2 1.9 1.1
SEM
0.2 0.1 0.6 0.2
inflammatory cytokines
IL10 fold change
1.5* 1.5 1.0 1.1
SEM
0.2 0.5 0.4 0.3
TGFB1 fold change
0.9b* 1.2c* 0.9abc 0.8a
SEM
0.0 0.1 0.1 0.0
TNF fold change
1.2 1.2 4.5 1.8
SEM
0.3 0.1 2.9 1.1
antimicrobial peptides
LAP fold change
1.2 N/A3 5.1 1.9
SEM
0.2 N/A 3.4 0.8
LF fold change
1.0 1.6* 1.3 1.1
SEM
0.1 0.2 0.4 0.1
LPO fold change 1.0 1.2 1.2* 1.0 1.2 0.9 1.7 1.5
SEM 0.3 0.2 0.2 0.1 0.2 0.1 0.7 0.4
LYZ1 fold change 1.1 0.9 1.6* 1.9 1.6 1.2 2.9 1.2
SEM 0.1 0.2 0.3 0.5 0.5 0.2 1.2 0.1
TAP fold change 0.9 1.1 1.5 0.9 5.2 0.7* 6.9 1.5
SEM 0.3 0.4 0.3 0.2 4.3 0.2 3.7 0.8
acute phase proteins
SAA3 fold change 1.7 2.5 3 1.2 5.1 3.1 5.4 1.2
SEM 0.5 1 1.7 0.3 3.8 1.5 4.3 0.2
TLR signalling
LBP fold change
1.0 1.4 0.9 1.8
SEM
0.2 0.4 0.2 1.0
LY96 fold change
1.1ab 1.0b 1.0b 1.1a*
SEM
0.0 0.1 0.0 0.0
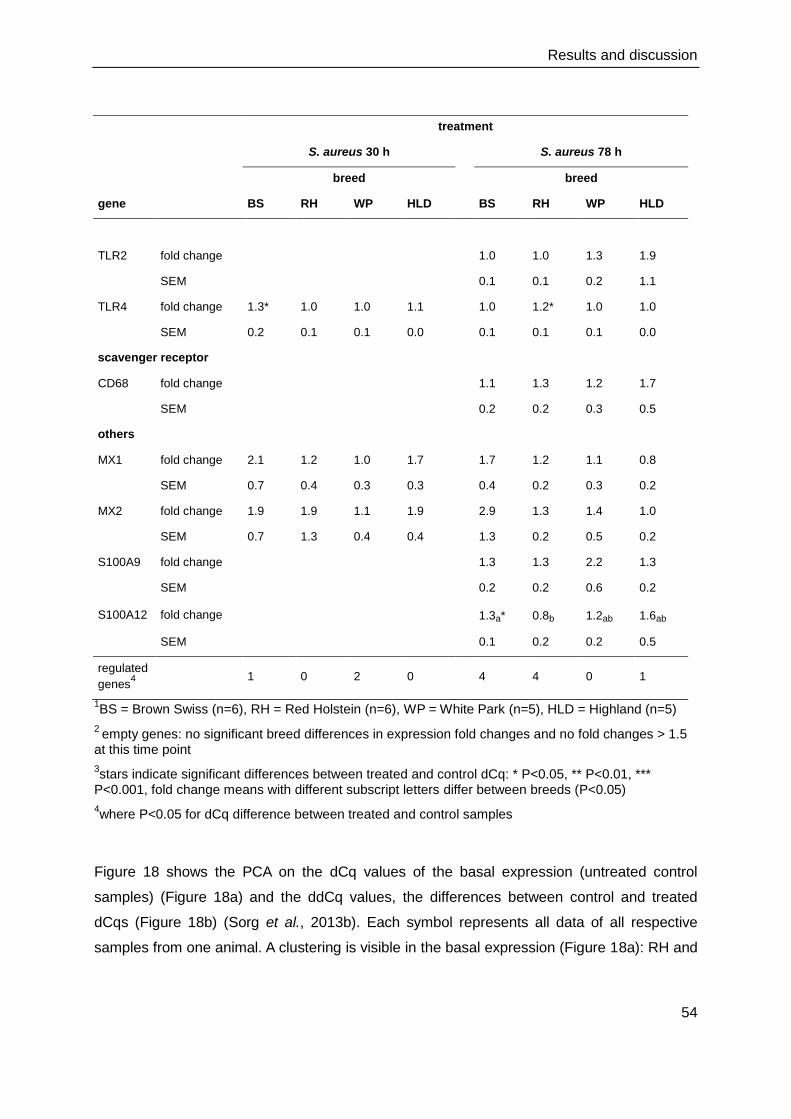
Results and discussion
54
treatment
S. aureus 30 h S. aureus 78 h
breed breed
gene BS RH WP HLD BS RH WP HLD
TLR2 fold change
1.0 1.0 1.3 1.9
SEM
0.1 0.1 0.2 1.1
TLR4 fold change 1.3* 1.0 1.0 1.1 1.0 1.2* 1.0 1.0
SEM 0.2 0.1 0.1 0.0 0.1 0.1 0.1 0.0
scavenger receptor
CD68 fold change
1.1 1.3 1.2 1.7
SEM
0.2 0.2 0.3 0.5
others
MX1 fold change 2.1 1.2 1.0 1.7 1.7 1.2 1.1 0.8
SEM 0.7 0.4 0.3 0.3 0.4 0.2 0.3 0.2
MX2 fold change 1.9 1.9 1.1 1.9 2.9 1.3 1.4 1.0
SEM 0.7 1.3 0.4 0.4 1.3 0.2 0.5 0.2
S100A9 fold change
1.3 1.3 2.2 1.3
SEM
0.2 0.2 0.6 0.2
S100A12 fold change
1.3a* 0.8b 1.2ab 1.6ab
SEM
0.1 0.2 0.2 0.5
regulated
genes4
1 0 2 0
4 4 0 1
1BS = Brown Swiss (n=6), RH = Red Holstein (n=6), WP = White Park (n=5), HLD = Highland (n=5)
2 empty genes: no significant breed differences in expression fold changes and no fold changes > 1.5
at this time point
3stars indicate significant differences between treated and control dCq: * P<0.05, ** P<0.01, ***
P<0.001, fold change means with different subscript letters differ between breeds (P<0.05)
4where P<0.05 for dCq difference between treated and control samples
Figure 18 shows the PCA on the dCq values of the basal expression (untreated control
samples) (Figure 18a) and the ddCq values, the differences between control and treated
dCqs (Figure 18b) (Sorg et al., 2013b). Each symbol represents all data of all respective
samples from one animal. A clustering is visible in the basal expression (Figure 18a): RH and

Results and discussion
55
BS form two subgroups and are separated from the cluster of WP and HLD. The PCA on the
ddCqs shows no such separation (Figure 18b).
Fig. 18: Principal component analysis of (a) dCq values (basal expression of unstimulated control) and
(b) ddCq values (difference between treated and control dCq) of 28 target genes in primary bovine
mammary epithelial cells from four cattle breeds after stimulation with E. coli and S. aureus. Each
symbol represents all respective samples from one animal (Sorg et al., 2013b).
The protein production of LF, IL-10 and SAA is shown in Figures 19, 20 and 21 respectively
(Sorg et al., 2013b). It is shown together with the particular corresponding mRNA expression.
LF mRNA up regulation could be observed in most E. coli treatments and after 78 h S.
aureus in RH, the LF protein was only increased after 30 h E. coli in RH and WP (Figure 19).
BS even showed a decrease under this treatment. In the untreated cells at 78 h BS had
higher gene expression levels than RH and HLD. In the untreated and the S. aureus treated
cells after 30 h HLD had higher protein levels than WP.
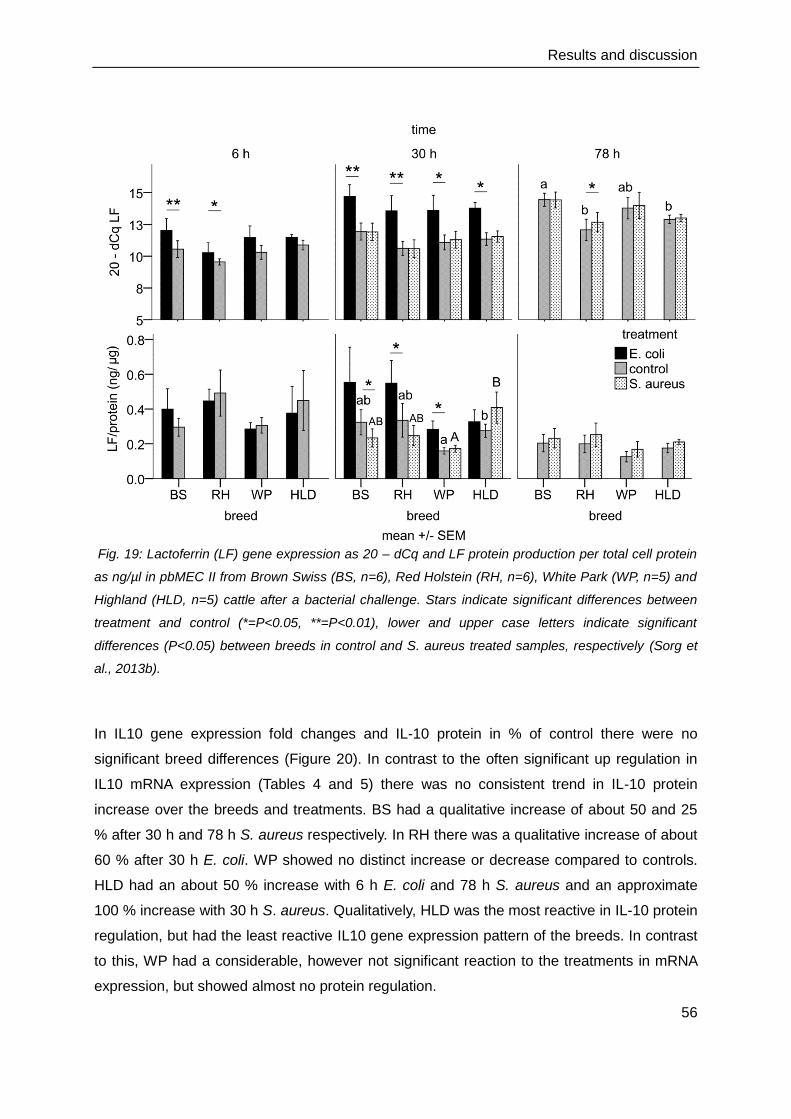
Results and discussion
56
Fig. 19: Lactoferrin (LF) gene expression as 20 – dCq and LF protein production per total cell protein
as ng/µl in pbMEC II from Brown Swiss (BS, n=6), Red Holstein (RH, n=6), White Park (WP, n=5) and
Highland (HLD, n=5) cattle after a bacterial challenge. Stars indicate significant differences between
treatment and control (*=P<0.05, **=P<0.01), lower and upper case letters indicate significant
differences (P<0.05) between breeds in control and S. aureus treated samples, respectively (Sorg et
al., 2013b).
In IL10 gene expression fold changes and IL-10 protein in % of control there were no
significant breed differences (Figure 20). In contrast to the often significant up regulation in
IL10 mRNA expression (Tables 4 and 5) there was no consistent trend in IL-10 protein
increase over the breeds and treatments. BS had a qualitative increase of about 50 and 25
% after 30 h and 78 h S. aureus respectively. In RH there was a qualitative increase of about
60 % after 30 h E. coli. WP showed no distinct increase or decrease compared to controls.
HLD had an about 50 % increase with 6 h E. coli and 78 h S. aureus and an approximate
100 % increase with 30 h S. aureus. Qualitatively, HLD was the most reactive in IL-10 protein
regulation, but had the least reactive IL10 gene expression pattern of the breeds. In contrast
to this, WP had a considerable, however not significant reaction to the treatments in mRNA
expression, but showed almost no protein regulation.
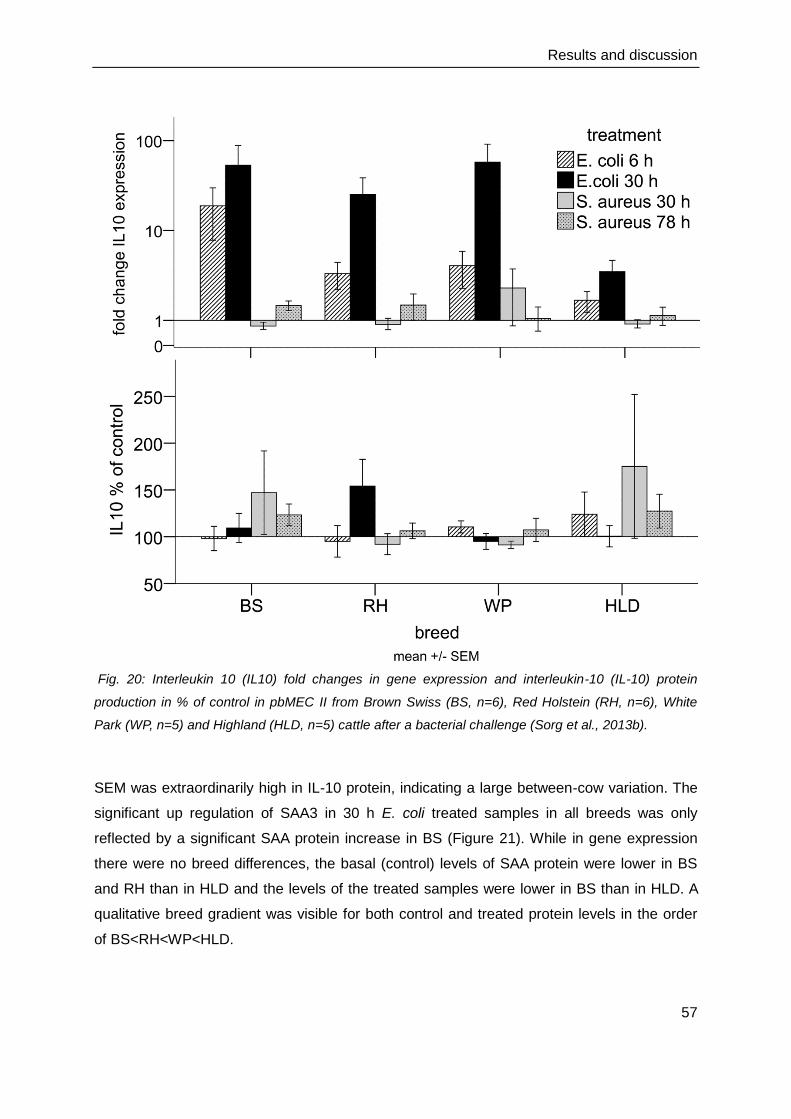
Results and discussion
57
Fig. 20: Interleukin 10 (IL10) fold changes in gene expression and interleukin-10 (IL-10) protein
production in % of control in pbMEC II from Brown Swiss (BS, n=6), Red Holstein (RH, n=6), White
Park (WP, n=5) and Highland (HLD, n=5) cattle after a bacterial challenge (Sorg et al., 2013b).
SEM was extraordinarily high in IL-10 protein, indicating a large between-cow variation. The
significant up regulation of SAA3 in 30 h E. coli treated samples in all breeds was only
reflected by a significant SAA protein increase in BS (Figure 21). While in gene expression
there were no breed differences, the basal (control) levels of SAA protein were lower in BS
and RH than in HLD and the levels of the treated samples were lower in BS than in HLD. A
qualitative breed gradient was visible for both control and treated protein levels in the order
of BS<RH<WP<HLD.
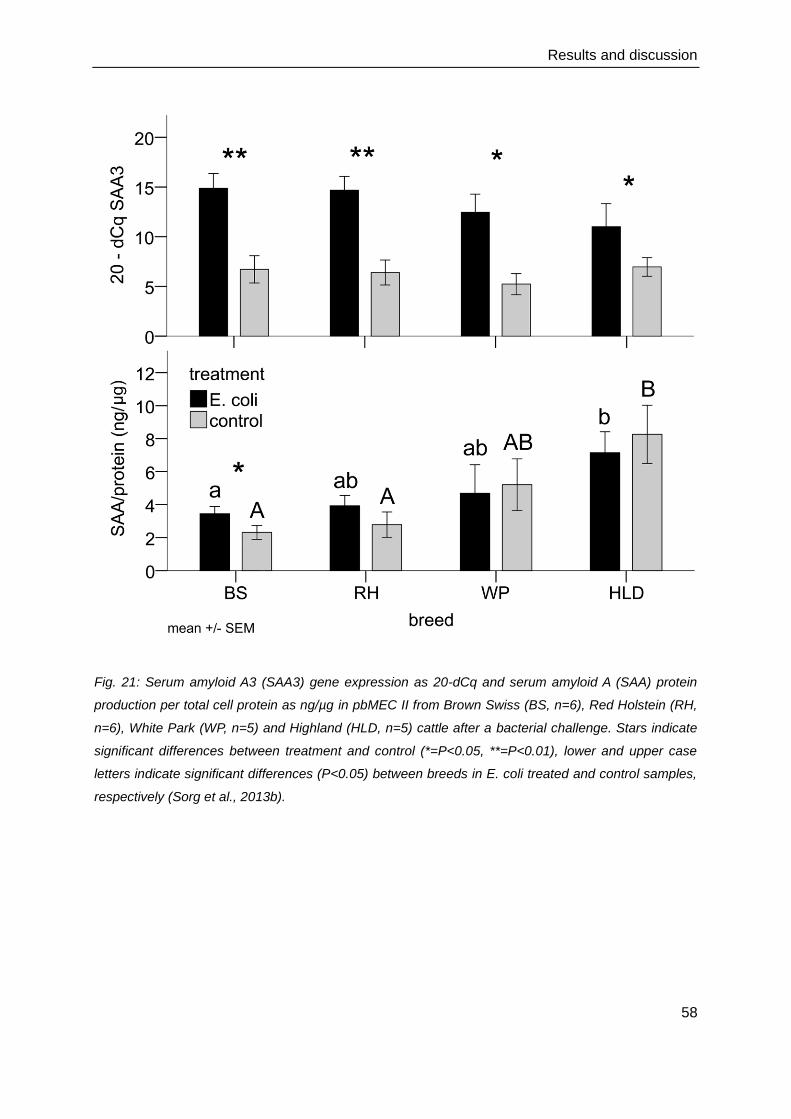
Results and discussion
58
Fig. 21: Serum amyloid A3 (SAA3) gene expression as 20-dCq and serum amyloid A (SAA) protein
production per total cell protein as ng/µg in pbMEC II from Brown Swiss (BS, n=6), Red Holstein (RH,
n=6), White Park (WP, n=5) and Highland (HLD, n=5) cattle after a bacterial challenge. Stars indicate
significant differences between treatment and control (*=P<0.05, **=P<0.01), lower and upper case
letters indicate significant differences (P<0.05) between breeds in E. coli treated and control samples,
respectively (Sorg et al., 2013b).
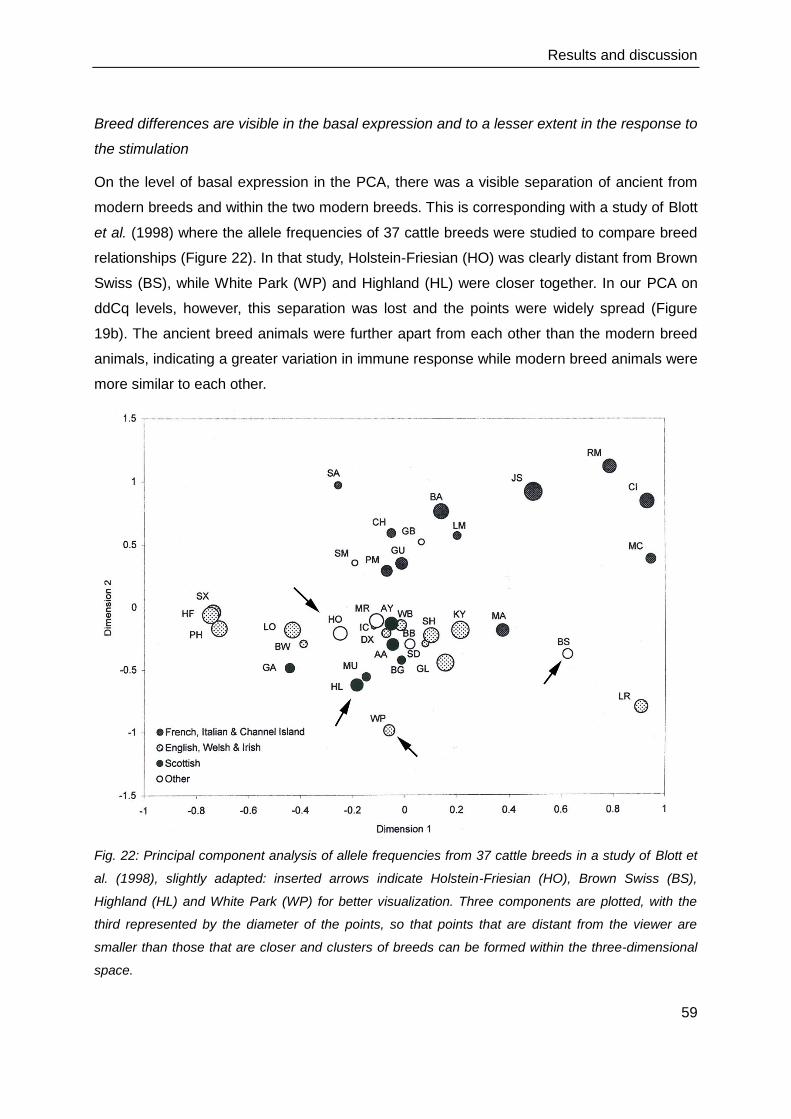
Results and discussion
59
Breed differences are visible in the basal expression and to a lesser extent in the response to
the stimulation
On the level of basal expression in the PCA, there was a visible separation of ancient from
modern breeds and within the two modern breeds. This is corresponding with a study of Blott
et al. (1998) where the allele frequencies of 37 cattle breeds were studied to compare breed
relationships (Figure 22). In that study, Holstein-Friesian (HO) was clearly distant from Brown
Swiss (BS), while White Park (WP) and Highland (HL) were closer together. In our PCA on
ddCq levels, however, this separation was lost and the points were widely spread (Figure
19b). The ancient breed animals were further apart from each other than the modern breed
animals, indicating a greater variation in immune response while modern breed animals were
more similar to each other.
Fig. 22: Principal component analysis of allele frequencies from 37 cattle breeds in a study of Blott et
al. (1998), slightly adapted: inserted arrows indicate Holstein-Friesian (HO), Brown Swiss (BS),
Highland (HL) and White Park (WP) for better visualization. Three components are plotted, with the
third represented by the diameter of the points, so that points that are distant from the viewer are
smaller than those that are closer and clusters of breeds can be formed within the three-dimensional
space.
Results and discussion
60
It could have been expected that the WP animals would be lying much closer together, as the
exceedingly small German WP cattle population has been shown to be more inbred (average
coefficient of inbreeding = 16%) than many other cattle breeds worldwide (average
coefficient of inbreeding = 0.3 – 5%) (Biedermann et al., 2009). It is likely that the rigorous
selection on conformal traits in the modern dairy breeds led to a high resemblance and small
variations.
Although the ranking of the breeds in gene expression levels was not consistent over all
genes, there was a consistency in TLR pathway expression: the higher basal expression of
the components of the TLR pathway in the ancient breeds could have an effect on the
rapidity of pathogen recognition and lead to a more efficient triggering of the immune
response. The higher basal levels of SAA protein in the ancient breeds could have a
protective effect against pathogens, as SAA is an opsonising agent (Shah et al., 2006).
Interestingly, basal LF protein levels were lower in the ancient breeds, but differed
significantly only between WP and HLD. WP and HLD also differed in basal expression of
MX1 and CCL5. This suggests that the breeds are all different from each other and cannot
simply be grouped together in 'modern' and 'ancient'. It is difficult to interpret the fold changes
of gene expression. Due to the considerably high SEM some visibly high fold changes
happened to be not significant. The PCA on ddCq did not reveal any clustering. But apart
from this, in the modern breeds there were more genes significantly regulated, especially for
the antimicrobial peptides, the TLR pathway and the MX genes. HLD had the lowest fold
changes in SAA3 expression, but the highest basal levels of SAA protein after 30 h. The
whole picture of breed differences is very heterogeneous and inconsistent. But it looks like in
those parts of the immune system where we found a difference between the breeds, a higher
basal expression led to a lower response. Kandasamy et al. (2012) measured the immune
response of cows that had before been classified as 'high-' and 'low-responder' animals to an
intramammary E. coli infusion. The low-responder animals had a weaker immune response,
which was, however, more effective and led to a shorter resolution phase of the inflammation.
Hence, a strong immune response is not in all cases beneficial for the animal. Another
example for this phenomenon is the tolerance of the Bos indicus Sahiwal cattle to the
indigenous protozoan parasite Theileria annulata. After an experimental infection, they
showed fewer clinical symptoms, recovered from a higher dose of pathogen and had lower
acute phase protein levels compared to Holstein calves (Glass et al., 2005). In another
Results and discussion
61
experiment, macrophages from Holstein cattle showed higher up regulation of inflammatory
and immune response genes than those from Sahiwal cattle (Glass et al., 2012).
To our knowledge there are no studies on the intra-mammary immune system of ancient
cattle breeds like WP and HLD. It has been found that the immune system of modern dairy
breeds shows differences in details, but is generally conserved (Bannerman et al., 2008a;
Bannerman et al., 2008b), which is in accordance with our results. In one of those studies,
the in vivo response of Holstein and Jersey cows to E. coli differed only in the time point of
milk cytokine and SCC increase, not in overall levels (Bannerman et al., 2008a). After an S.
aureus challenge, Holstein and Jersey animals also responded with similar levels of milk
SCC and cytokines and varied only in neutrophil and NAGase activity (Bannerman et al.,
2008b). Different LF contents in milk have already been measured in Holstein, Jersey and
Simmental cows (Krol et al., 2010) and in dairy and beef cattle (Tsuji et al., 1990), which adds
to our findings of different LF contents in pbMEC. Several polymorphisms have been found in
the LF gene in different cattle breeds that could cause a differential LF expression and
production (O'Halloran et al., 2009). To compare SAA levels in different breeds, we only
found one study: SAA in blood serum increased more rapidly in Angus than in Romosinuano
steers (an indigenous Colombian breed) after an LPS challenge and remained at higher
levels for 8 h (Carroll et al., 2011). Although there was no significant rise in SAA protein after
pathogen stimulation in our ancient breed pbMEC, their absolute levels were higher than in
the modern breeds. Cattle breed differences in gene expression and protein production of the
immune system have not been systematically studied so far, but our findings and the above
mentioned studies show that there is evidence for such diversity.
The animal differences within each breed, revealed by the high SEMs and by the wide
spread of the symbols representing animals in the PCAs, could also reflect the existence of a
substantial between-cow variation in the immune response which has already been shown
for Holstein cattle in vitro and in vivo (Kandasamy et al., 2012). The underlying genetic
polymorphisms could be linked to a certain breed, but they could be spread all over the cattle
population as well. Furthermore, it has been implied that a part of so far unexplained
phenotypic variation in the dairy cow is due to epigenetic regulation (Singh et al., 2010).
Results and discussion
62
E. coli induces a much stronger immune response than S. aureus
In all the breeds there was a much stronger reaction to E. coli than to S. aureus. This
remarkable pathogen difference has already been noted by other researchers in vitro
(Griesbeck-Zilch et al., 2008, Gunther et al., 2011, Danowski et al., 2012a) and in vivo
(Bannerman et al., 2004, Lee et al., 2006, Petzl et al., 2008). It was first thought that a lack of
S. aureus recognition by TLRs was the reason for the weak immune response, but Yang et
al. (2008) found that TLR2 and TLR4 were both properly activated by the two exact strains of
pathogens that we had used, too. S. aureus however, failed to activate NFKB, a transcription
factor that initiates the transcription of many proinflammatory genes. After experimental
blocking of the NFKB activation, their pbMEC still responded weakly to S. aureus. This leads
to the conclusion that S. aureus recognition by TLRs triggers the immune response via a
completely different pathway and may even dispose of a means to block or interfere with the
TLR signalling cascade. The fact that we measured such an extraordinarily weak immune
response compared to other studies could be found in the experimental design. Maybe we
missed the proper time frame for the peak in immune response which had been at 3 h in the
study of Yang et al. (2008) and at 2 – 4 h in a study of Strandberg et al. (2005) with gram-
positive bacterial lipoteichoic acid stimulation (LTA). It could also have been a wrong dose of
inoculum. Too low a dose would not trigger the immune response sufficiently. But Wellnitz
and Kerr (2004) showed that also with a too elevated MOI there was no more significant
immune response. Furthermore, it could be a strain-dependent effect, as other researchers
obtained a more pronounced reaction to other S. aureus strains like S. aureus M60 in vitro
(Griesbeck-Zilch et al., 2008) or S. aureus 305 in vivo (Bannerman et al., 2004). The often
chronic outcome of S. aureus mastitis could be based on this failure of a proper immune
response to clear out the colonization of the udder by the pathogen.
Signalling and defence molecules are strongly activated, in contrast to the TLR pathway
By far the most influenced gene was SAA3, which was up to 1900-fold up regulated in RH
after 30 h E. coli. It is known to have antibacterial effects and the reaction of our cells is a
confirmation of its suggested use as an inflammation marker (Molenaar et al., 2009). A strong
induction by E. coli was also observed in the chemokines and inflammatory cytokines on the
one hand as well as in C3, in the antimicrobial peptides, the S100A genes and the MX genes
on the other. This shows the excellent bidirectional functionality of our pbMEC: while acting
as sentinels by attracting and activating immune cells upon pathogen recognition, at the
same time they exerted their function in actively combating the pathogen with defence
Results and discussion
63
proteins. The TLR-pathway was not as markedly regulated. It seems that a small regulation
in this starting point in the signalling cascade builds up and results in a strong regulation of
the resulting end product. This is understandable when realizing that a single activated
molecule can itself activate many molecules in a row and this happens in each step of the
cascade. Strandberg et al. (2005) found no effect of LPS or LTA on TLR4 and TLR2
expression in pbMEC and the bovine mammary epithelial cell lines MAC-T, although there
was a pronounced inflammatory response. Thus, we agree with what those authors
concluded, which is that pbMEC have a fully functional, constituently active and immediately
responsive set of TLRs that does not need to be up regulated upon pathogen recognition.
Protein levels do not correspond well with mRNA expression
The weak correspondence of mRNA and protein levels could have several possible reasons.
First of all, the dynamics of gene expression and protein production over time are not
necessarily the same. It is possible that a fast response to the pathogens in 6 h LF gene
expression is translated into a measurable protein reaction only after 30 h and later.
Furthermore, LF is secreted into the cell culture medium. Unfortunately it was below the
measuring range of the ELISA protocol in most of the medium samples (data not shown), so
that no evaluation was possible. But this proportion of LF could account for the gap between
mRNA expression and cellular LF protein. In addition to this, in the human LF gene there is
an alternative transcript variant from a different LF gene promoter that leads to a shorter
isoform of the LF mRNA and protein, called delta LF (Mariller et al., 2012). It exerts
intracellular functions as a transcription factor in cell cycle regulating genes. The mRNAs
differ in exon 1 (Hoedt et al., 2010). Our primer pair had been designed to bind in exon 7 and
8 before this fact was known to us. If the same transcript variant exists in the bovine
transcriptome - which is possible as the LF gene is highly conserved among mammal
species - we could not discriminate between the expressions of these two. However, it is
possible that the antibody in the ELISA did only bind to LF and not to delta LF because of the
different amino acid sequence and structure. Another potential posttranscriptional regulation
is the microRNA miR-214 which has been shown to regulate LF mRNA expression and
function in mammary epithelial cells (Liao et al., 2010). Also for IL10 and for another SAA-
encoding gene, SAA2, microRNAs have been found that could lead to a posttranscriptional
regulation and a massive variation in protein production (Longley et al., 1999, Sharma et al.,
2009).
Conclusions
64
5. Conclusions
For the first time the intra-mammary immune system of the ancient HLD and WP cattle has
been characterized in vitro. It has often been suspected that the immune system of the
ancient breeds must be different from the modern breeds due to a very different selection
process and an adaptation to a different natural environment. At least in the innate immune
system of pbMEC this seems not to be the case. The differences between BS, RH, WP and
HLD were more pronounced in the basal mRNA and protein expression than in the response
to the pathogen stimulation. The breeds differed in parts of the innate immune system, but
activated mainly the same pathways at similar expression levels. Those were the TLR-
mediated triggering of the innate immune response which comprised the expression of
inflammatory cytokines and chemokines on the one hand, and the expression of
antimicrobial peptides, the acute phase gene and protein SAA3, complement component C3
and other defence molecules on the other hand. It could be suspected that the often
observed smaller susceptibility to mastitis of the ancient breeds is caused by higher basal
innate immune levels which do not need to be as highly up regulated after pathogen
recognition as in the modern breeds. There also was a large between-cow variation which
seemed to be independent of the breed. Breed-independent genetic polymorphisms,
epigenetic regulation and posttranscriptional regulation by microRNAs could be responsible
for that. These mechanisms remain subject for further research. In addition to that, we
studied only one part - one cellular component - of the complex immune network that
operates in the udder. It is still possible that there are breed differences in the reactivity of
neutrophils and macrophages or even in the adaptive immune response. Thus, our findings
from pbMEC need to be compared to the reaction of other cell types or to the in vivo
response.
The culture of pbMEC from milk has been found to be a suitable method for our purposes
that could easily be applied to study other ancient and rare breeds to obtain a broader picture
of breed differences, and the same holds true for the successful application of a high-
throughput qPCR system.
References
65
6. References
Alderson GLH 1997. A breed of distinction: White Park cattle ancient and modern. Countrywide
Livestock Ltd., Shrewsbury, UK.
Aliprantis AO, Yang RB, Weiss DS, Godowski P and Zychlinsky A 2000. The apoptotic signaling
pathway activated by Toll-like receptor-2. EMBO J 19, 3325-3336.
Bannerman DD, Paape MJ, Lee JW, Zhao X, Hope JC and Rainard P 2004. Escherichia coli and
Staphylococcus aureus elicit differential innate immune responses following intramammary infection.
Clin Diagn Lab Immunol 11, 463-472.
Bannerman DD, Kauf AC, Paape MJ, Springer HR and Goff JP 2008a. Comparison of Holstein and
Jersey innate immune responses to Escherichia coli intramammary infection. J Dairy Sci 91, 2225-
2235.
Bannerman DD, Springer HR, Paape MJ, Kauf AC and Goff JP 2008b. Evaluation of breed-dependent
differences in the innate immune responses of Holstein and Jersey cows to Staphylococcus aureus
intramammary infection. J Dairy Res 75, 291-301.
BCMS 2012. Report on Cattle Population by Breed, Sex and Country on 1st January 2012 to 2012:
cattle born or imported into GB. British Cattle Movement Service, Workington, United Kingdom.
Beecher C, Daly M, Childs S, Berry DP, Magee DA, McCarthy TV and Giblin L 2010. Polymorphisms in
bovine immune genes and their associations with somatic cell count and milk production in dairy
cattle. BMC Genet 11, 9.
Bertrand K 2011. Survival of exfoliated epithelial cells: a delicate balance between anoikis and
apoptosis. J Biomed Biotechnol 2011, 534139.
Beutler BA 2009. TLRs and innate immunity. Blood 113, 1399-1407.
Biedermann G, Hecht W, Fandrey E, Rudolph H and Frolich K 2009. Population genetic analysis of
White Park Cattle in Germany. Arch Tierz 52, 561-573.
BLE 2012. Central Documentation on Animal Genetic Resources in Germany (TGRDEU) - Domestic
animals, Bundesanstalt für Landwirtschaft und Ernährung (BLE), Bonn, Germany.
Blott SC, Williams JL and Haley CS 1998. Genetic relationships among European cattle breeds. Anim
Genet 29, 273-282.
Blottner S, Heins BJ, Wensch-Dorendorf M, Hansen LB and Swalve HH 2011. Brown Swiss x Holstein
crossbreds compared with pure Holsteins for calving traits, body weight, backfat thickness, fertility, and
body measurements. J Dairy Sci 94, 1058-1068.
Boichard D and Brochard M 2012. New phenotypes for new breeding goals in dairy cattle. animal 6,
544-550.
References
66
Bole-Feysot C, Goffin V, Edery M, Binart N and Kelly PA 1998. Prolactin (PRL) and its receptor:
actions, signal transduction pathways and phenotypes observed in PRL receptor knockout mice.
Endocr Rev 19, 225-268.
Brenig B, Beck J, Floren C, Bornemann-Kolatzki K, Wiedemann I, Hennecke S, Swalve H, Schutz E
2013. Molecular genetics of coat colour variations in White Galloway and White Park cattle. Anim
Genet [Epub ahead of print] 20.02.2013.
Buehring GC 1972. Culture of human mammary epithelial cells: keeping abreast with a new method. J
Natl Cancer Inst 49, 1433-1434.
Buehring GC 1990. Culture of mammary epithelial cells from bovine milk. J Dairy Sci 73, 956-963.
Burvenich C, Van Merris V, Mehrzad J, Diez-Fraile A and Duchateau L 2003. Severity of E. coli
mastitis is mainly determined by cow factors. Vet Res 34, 521-564.
Bustin SA, Benes V, Garson JA, Hellemans J, Huggett J, Kubista M, Mueller R, Nolan T, Pfaffl MW,
Shipley GL, Vandesompele J and Wittwer CT 2009. The MIQE guidelines: minimum information for
publication of quantitative real-time PCR experiments. Clin Chem 55, 611-622.
Carroll JA, Burdick NC, Reuter RR, Chase Jr CC, Spiers DE, Arthington JD and Coleman SW 2011.
Differential acute phase immune responses by Angus and Romosinuano steers following an endotoxin
challenge. Domest Anim Endocrinol 41, 163-173.
Carlsson A, Bjorck L and Persson K 1989. Lactoferrin and lysozyme in milk during acute mastitis and
their inhibitory effect in Delvotest P. J Dairy Sci 72, 3166-3175.
Cifrian E, Guidry AJ, O'Brien CN, Nickerson SC and Marquardt WW 1994. Adherence of
Staphylococcus aureus to cultured bovine mammary epithelial cells. J Dairy Sci 77, 970-983.
Cormican P, Meade KG, Cahalane S, Narciandi F, Chapwanya A, Lloyd AT and O'Farrelly C 2008.
Evolution, expression and effectiveness in a cluster of novel bovine beta-defensins. Immunogenetics
60, 147-156.
Danowski K, Sorg D, Gross J, Meyer HHD and Kliem H 2012a. Innate defense capability of challenged
primary bovine mammary epithelial cells after an induced negative energy balance in vivo. Cz J Anim
Sci 57, 207-220.
Danowski K, Gross JJ, Meyer HH and Kliem H 2012b. Effects of induced energy deficiency on
lactoferrin concentration in milk and the lactoferrin reaction of primary bovine mammary epithelial cells
in vitro. J Anim Physiol Anim Nutr. April 28 2012 [Epub ahead of print].
De Spiegeleer P, Sermon J, Vanoirbeek K, Aertsen A and Michiels CW 2005. Role of porins in
sensitivity of Escherichia coli to antibacterial activity of the lactoperoxidase enzyme system. Appl
Environ Microbiol 71, 3512-3518.
References
67
Dohner J 2001. The encyclopedia of historic and endangered livestock and poultry breeds. Yale
University Press, New Haven, CT, USA.
Ebner KE, Hoover CR, Hageman EC and Larson BL 1961. Cultivation and properties of bovine
mammary cell cultures. Exp Cell Res 23, 373-385.
Ellison RT, 3rd, Giehl TJ and LaForce FM 1988. Damage of the outer membrane of enteric gram-
negative bacteria by lactoferrin and transferrin. Infect Immun 56, 2774-2781.
European Brown Swiss Federation 2012. Brown Swiss from Europe means: Protein, Longevity,
Functionality. European Brown Swiss Federation, Bussolengo, Italia.
FAO 2000. World watch list for domestic animal diversity. Food and Agriculture Organization of the
United Nations, Rome, Italy.
Franchi L, Munoz-Planillo R and Nunez G 2012. Sensing and reacting to microbes through the
inflammasomes. Nat Immunol 13, 325-332.
Freshney RI 2005. Culture of Animal Cells. Wiley-Liss, Hoboken, NJ, USA.
Gangur V, Birmingham NP and Thanesvorakul S 2002. Chemokines in health and disease. Vet
Immunol Immunopathol 86, 127-136.
German Holstein Association 2010. German Holsteins 2010 Facts & Figures. German Holstein
Association, Bonn, Germany.
Glass EJ, Preston PM, Springbett A, Craigmile S, Kirvar E, Wilkie G and Brown CGD 2005. Bos taurus
and Bos indicus (Sahiwal) calves respond differently to infection with Theileria annulata and produce
markedly different levels of acute phase proteins. Int J Parasitol 35, 337-347.
Glass EJ, Crutchley S and Jensen K 2012. Living with the enemy or uninvited guests: Functional
genomics approaches to investigating host resistance or tolerance traits to a protozoan parasite,
Theileria annulata, in cattle. Vet Immunol Immunopathol 148, 178-189.
Gottfried E, Kunz-Schughart LA, Weber A, Rehli M, Peuker A, Muller A, Kastenberger M, Brockhoff G,
Andreesen R and Kreutz M 2008. Expression of CD68 in non-myeloid cell types. Scand J Immunol 67,
453-463.
Griesbeck-Zilch B, Meyer HH, Kuhn CH, Schwerin M and Wellnitz O 2008. Staphylococcus aureus
and Escherichia coli cause deviating expression profiles of cytokines and lactoferrin messenger
ribonucleic acid in mammary epithelial cells. J Dairy Sci 91, 2215-2224.
Griesbeck-Zilch B, Osman M, Kuhn C, Schwerin M, Bruckmaier RH, Pfaffl MW, Hammerle-Fickinger A,
Meyer HH and Wellnitz O 2009. Analysis of key molecules of the innate immune system in mammary
epithelial cells isolated from marker-assisted and conventionally selected cattle. J Dairy Sci 92, 4621-
4633.

References
68
Groebner AE, Schulke K, Schefold JC, Fusch G, Sinowatz F, Reichenbach HD, Wolf E, Meyer HH and
Ulbrich SE 2011. Immunological mechanisms to establish embryo tolerance in early bovine pregnancy.
Reprod Fertil Dev 23, 619-632.
Gronlund U, Hulten C, Eckersall PD, Hogarth C and Persson Waller K 2003. Haptoglobin and serum
amyloid A in milk and serum during acute and chronic experimentally induced Staphylococcus aureus
mastitis. J Dairy Res 70, 379-386.
Gunther J, Koczan D, Yang W, Nurnberg G, Repsilber D, Schuberth HJ, Park Z, Maqbool N, Molenaar
A and Seyfert HM 2009. Assessment of the immune capacity of mammary epithelial cells: comparison
with mammary tissue after challenge with Escherichia coli. Vet Res 40, 31.
Gunther J, Esch K, Poschadel N, Petzl W, Zerbe H, Mitterhuemer S, Blum H and Seyfert HM 2011.
Comparative kinetics of Escherichia coli- and Staphylococcus aureus-specific activation of key
immune pathways in mammary epithelial cells demonstrates that S. aureus elicits a delayed response
dominated by interleukin-6 (IL-6) but not by IL-1A or tumor necrosis factor alpha. Infect Immun 79,
695-707.
Halasa T, Huijps K, Osteras O and Hogeveen H 2007. Economic effects of bovine mastitis and mastitis
management: a review. Vet Q 29, 18-31.
Hatada EN, Krappmann D and Scheidereit C 2000. NF-kappaB and the innate immune response. Curr
Opin Immunol 12, 52-58.
Hayes BJ, Pryce J, Chamberlain AJ, Bowman PJ and Goddard ME 2010. Genetic architecture of
complex traits and accuracy of genomic prediction: coat colour, milk-fat percentage, and type in
Holstein cattle as contrasting model traits. PLoS Genet 6, e1001139.
Heikkilä AM, Nousiainen JI and Pyörälä S 2012. Costs of clinical mastitis with special reference to
premature culling. J Dairy Sci 95, 139-150.
Heringstad B, Klemetsdal G and Steine T 2003. Selection responses for clinical mastitis and protein
yield in two Norwegian dairy cattle selection experiments. J Dairy Sci 86, 2990-2999.
Herrmann H and Aebi U 2004. Intermediate filaments: molecular structure, assembly mechanism, and
integration into functionally distinct intracellular Scaffolds. Annu Rev Biochem 73, 749-789.
Hettinga K, van Valenberg H, de Vries S, Boeren S, van Hooijdonk T, van Arendonk J and Vervoort J
2011. The host defense proteome of human and bovine milk. PLoS ONE 6, e19433.
Hoedt E, Hardiville S, Mariller C, Elass E, Perraudin JP and Pierce A 2010. Discrimination and
evaluation of lactoferrin and delta-lactoferrin gene expression levels in cancer cells and under
inflammatory stimuli using TaqMan real-time PCR. BioMetals 23, 441-452.
Hogan J and Smith KL 2003. Coliform mastitis. Vet Res 34, 507-519.
References
69
Hsu K, Champaiboon C, Guenther BD, Sorenson BS, Khammanivong A, Ross KF, Geczy CL and
Herzberg MC 2009. Anti-infective protective properties of S100 calgranulins. Antiinflamm Antiallergy
Agents Med Chem 8, 290-305.
Huang YQ, Morimoto K, Hosoda K, Yoshimura Y and Isobe N 2012. Differential immunolocalization
between lingual antimicrobial peptide and lactoferrin in mammary gland of dairy cows. Vet Immunol
Immunopathol 145, 499-504.
Irwin DM 2004. Evolution of cow nonstomach lysozyme genes. Genome 47, 1082-1090.
Kandasamy S, Green BB, Benjamin AL and Kerr DE 2012. Between-cow variation in dermal fibroblast
response to lipopolysaccharide reflected in resolution of inflammation during Escherichia coli mastitis.
J Dairy Sci 94, 5963-5975.
Kanehisa M, Goto S, Kawashima S, Okuno Y and Hattori M 2004. The KEGG resource for deciphering
the genome. Nucleic Acids Res 32, D277-280.
Karantza V 2011. Keratins in health and cancer: more than mere epithelial cell markers. Oncogene 30,
127-138.
Karin M and Lin A 2002. NF-kappaB at the crossroads of life and death. Nat Immunol 3, 221-227.
Katz E and Streuli CH 2007. The extracellular matrix as an adhesion checkpoint for mammary
epithelial function. Int J Biochem Cell Biol 39, 715-726.
Koneman EW, Allen SD, Dowell VR and Sommer HM 1983. The Enterobacteriaceae. In Color Atlas
and Textbook of Diagnostic Microbiology (ed. KE W.), pp. 57-124, J.B. Lippincott Company, New York,
NY, USA.
Krappmann K, Weikard R and Kuhn C 2012. Evaluation of a replacement method for mammary gland
biopsies by comparing gene expression in udder tissue and mammary epithelial cells isolated from
milk. Res Vet Sci 93, 970-974.
Kristiansen M, Graversen JH, Jacobsen C, Sonne O, Hoffman H-J, Law SKA and Moestrup SK 2001.
Identification of the haemoglobin scavenger receptor. Nature 409, 198-201.
Krol J, Litwinczuk Z, Brodziak A and Barlowska J 2010. Lactoferrin, lysozyme and immunoglobulin G
content in milk of four breeds of cows managed under intensive production system. Pol J Vet Sci 13,
357-361.
Kuby J 1992. Immunology. W.H. Freeman, New York, NY, USA.
Kutila T, Pyorala S, Saloniemi H and Kaartinen L 2003. Antibacterial effect of bovine lactoferrin against
udder pathogens. Acta Vet Scand 44, 35-42.
Lee SH and Vidal SM 2002. Functional diversity of Mx proteins: variations on a theme of host
resistance to infection. Genome Res 12, 527-530.
References
70
Lee JW, Bannerman DD, Paape MJ, Huang MK and Zhao X 2006. Characterization of cytokine
expression in milk somatic cells during intramammary infections with Escherichia coli or
Staphylococcus aureus by real-time PCR. Vet Res 37, 219-229.
Liao Y, Du X and Lonnerdal B 2010. miR-214 regulates lactoferrin expression and pro-apoptotic
function in mammary epithelial cells. J Nutr 140, 1552-1556.
Liu YX, Xu CH, Gao TY and Sun Y 2012. Polymorphisms of the ATP1A1 gene associated with mastitis
in dairy cattle. Gen Mol Res 11, 651-660.
Livak KJ and Schmittgen TD 2001. Analysis of relative gene expression data using real-time
quantitative PCR and the 2(-Delta Delta C(T)) Method. Methods 25, 402-408.
Longley DB, Steel DM and Whitehead AS 1999. Posttranscriptional regulation of acute phase serum
amyloid A2 expression by the 5'- and 3'-untranslated regions of its mRNA. J Immunol 163, 4537-4545.
Manukyan M, Triantafilou K, Triantafilou M, Mackie A, Nilsen N, Espevik T, Wiesmuller KH, Ulmer AJ
and Heine H 2005. Binding of lipopeptide to CD14 induces physical proximity of CD14, TLR2 and
TLR1. Eur J Immunol 35, 911-921.
Marek J and Mócsy J 1956. Lehrbuch der klinischen Diagnostik der inneren Krankheiten der
Haustiere. VEB Gustav Fischer Verlag, Jena, Germany.
Mariller C, Hardiville S, Hoedt E, Huvent I, Pina-Canseco S and Pierce A 2012. Delta-lactoferrin, an
intracellular lactoferrin isoform that acts as a transcription factor. Biochem Cell Biol 90, 307-319.
Mason IL 2002. Mason's world dictionary of livestock breeds, types and varieties. CABI Publ.,
Wallingford, UK.
Molenaar AJ, Harris DP, Rajan GH, Pearson ML, Callaghan MR, Sommer L, Farr VC, Oden KE, Miles
MC, Petrova RS, Good LL, Singh K, McLaren RD, Prosser CG, Kim KS, Wieliczko RJ, Dines MH,
Johannessen KM, Grigor MR, Davis SR and Stelwagen K 2009. The acute-phase protein serum
amyloid A3 is expressed in the bovine mammary gland and plays a role in host defence. Biomarkers
14, 26-37.
O'Halloran F, Bahar B, Buckley F, O'Sullivan O, Sweeney T and Giblin L 2009. Characterisation of
single nucleotide polymorphisms identified in the bovine lactoferrin gene sequences across a range of
dairy cow breeds. Biochimie 91, 68-75.
Ogorevc J, Kunej T, Razpet A and Dovc P 2009. Database of cattle candidate genes and genetic
markers for milk production and mastitis. Anim Genet 40, 832-851.
Olson TA 1999. Genetics of colour variation. pp. 33-53, CABI Publishing, Wallingford, UK.
Paape M, Mehrzad J, Zhao X, Detilleux J and Burvenich C 2002. Defense of the bovine mammary
gland by polymorphonuclear neutrophil leukocytes. J Mammary Gland Biol Neoplasia 7, 109-121.
References
71
Peng Q, Li K, Sacks SH and Zhou W 2009. The role of anaphylatoxins C3a and C5a in regulating
innate and adaptive immune responses. Inflamm Allergy Drug Targets 8, 236-246.
Petzl W, Zerbe H, Gunther J, Yang W, Seyfert HM, Nurnberg G and Schuberth HJ 2008. Escherichia
coli, but not Staphylococcus aureus triggers an early increased expression of factors contributing to
the innate immune defense in the udder of the cow. Vet Res 39, 18.
Prasad Chennazhy K and Krishnan LK 2005. Effect of passage number and matrix characteristics on
differentiation of endothelial cells cultured for tissue engineering. Biomaterials 26, 5658-5667.
Rainard P and Riollet C 2006. Innate immunity of the bovine mammary gland. Vet Res 37, 369-400.
RBST 2012. Watchlist. Rare Breeds Survival Trust, Kenilworth, UK.
Rie EJ, Rie IP and Buehring GC 1976. Short-term line of normal baboon mammary epithelial cells. J
Natl Cancer Inst 57, 609-611.
Rupp R, Hernandez A and Mallard BA 2007. Association of bovine leukocyte antigen (BoLA) DRB3.2
with immune response, mastitis, and production and type traits in Canadian Holsteins. J Dairy Sci 90,
1029-1038.
Russell CD, Widdison S, Leigh JA and Coffey TJ 2012. Identification of single nucleotide
polymorphisms in the bovine Toll-like receptor 1 gene and association with health traits in cattle. Vet
Res 43, 17.
Schukken YH, Günther J, Fitzpatrick J, Fontaine MC, Goetze L, Holst O, Leigh J, Petzl W, Schuberth
HJ, Sipka A, Smith DGE, Quesnell R, Watts J, Yancey R, Zerbe H, Gurjar A, Zadoks RN and Seyfert
HM 2011. Host-response patterns of intramammary infections in dairy cows. Vet Immunol
Immunopathol 144, 270-289.
Schulz J 1994. Störungen des Euters. In Klinische Pathologie der Haustiere (eds. H Hartmann and HH
Meyer) Gustav Fischer Verlag, Jena, Germany.
Shah C, Hari-Dass R and Raynes JG 2006. Serum amyloid A is an innate immune opsonin for Gram-
negative bacteria. Blood 108, 1751-1757.
Sharma A, Kumar M, Aich J, Hariharan M, Brahmachari SK, Agrawal A and Ghosh B 2009.
Posttranscriptional regulation of interleukin-10 expression by hsa-miR-106a. Proc Natl Acad Sci U S A
106, 5761-5766.
Singh K, Erdman RA, Swanson KM, Molenaar AJ, Maqbool NJ, Wheeler TT, Arias JA, Quinn-Walsh
EC and Stelwagen K 2010. Epigenetic regulation of milk production in dairy cows. J Mammary Gland
Biol Neoplasia 15, 101-112.
Smith PK, Krohn RI, Hermanson GT, Mallia AK, Gartner FH, Provenzano MD, Fujimoto EK, Goeke
NM, Olson BJ and Klenk DC 1985. Measurement of protein using bicinchoninic acid. Anal Biochem
150, 76-85.
References
72
Smyth HF 1915. The reactions between bacteria and animal tissues under conditions of artificial
cultivation. J Exp Med 21, 103-112.
Spurgeon SL, Jones RC and Ramakrishnan R 2008. High throughput gene expression measurement
with real time PCR in a microfluidic dynamic array. PLoS ONE 3, e1662.
Sorg D, Potzel A, Beck M, Meyer HH, Viturro E and Kliem H 2012. Effects of cell culture techniques on
gene expression and cholesterol efflux in primary bovine mammary epithelial cells derived from milk
and tissue. In Vitro Cell Dev Biol Anim 48, 550-553.
Sorg D, Danowski K, Korenkova V, Rusnakova V, Küffner R, Zimmer R, Meyer HHD and Kliem H
2013a. Microfluidic high-throughput RT-qPCR measurements of the immune response of primary
bovine mammary epithelial cells cultured from milk to mastitis pathogens. animal 7, 799-805.
Sorg D, Fandrey E, Froelich K, Meyer HHD and Kliem H 2013b. Mammary immunity of White Park
and Highland cattle compared with Brown Swiss and Red Holstein. An Gen Res 52, 91-104.
Strandberg E and Shook GE 1989. Genetic and economic responses to breeding programs that
consider mastitis. J Dairy Sci 72, 2136-2142.
Strandberg Y, Gray C, Vuocolo T, Donaldson L, Broadway M and Tellam R 2005. Lipopolysaccharide
and lipoteichoic acid induce different innate immune responses in bovine mammary epithelial cells.
Cytokine 31, 72-86.
Sutra L and Poutrel B 1994. Virulence factors involved in the pathogenesis of bovine intramammary
infections due to Staphylococcus aureus. J Med Microbiol 40, 79-89.
Talhouk RS, Neiswander RL and Schanbacher FL 1990. In vitro culture of cryopreserved bovine
mammary cells on collagen gels: Synthesis and secretion of casein and lactoferrin. Tissue Cell 22,
583-599.
Talhouk RS, Neiswander RL and Schanbacher FL 1993. Morphological and functional differentiation of
cryopreserved lactating bovine mammary cells cultured on floating collagen gels. Tissue Cell 25, 799-
816.
Threadgill DW and Womack JE 1990. Genomic analysis of the major bovine milk protein genes.
Nucleic Acids Res 18, 6935-6942.
Tian B, Nowak DE, Jamaluddin M, Wang S and Brasier AR 2005. Identification of direct genomic
targets downstream of the nuclear factor-kappaB transcription factor mediating tumor necrosis factor
signaling. J Biol Chem 280, 17435-17448.
Tsuji S, Hirata Y, Mukai F and Ohtagaki S 1990. Comparison of lactoferrin content in colostrum
between different cattle breeds. J Dairy Sci 73, 125-128.
van Iersel MP, Kelder T, Pico AR, Hanspers K, Coort S, Conklin BR and Evelo C 2008. Presenting and
exploring biological pathways with PathVisio. BMC Bioinformatics 9, 399.
References
73
Viitala S, Szyda J, Blott S, Schulman N, Lidauer M, Maki-Tanila A, Georges M and Vilkki J 2006. The
role of the bovine growth hormone receptor and prolactin receptor genes in milk, fat and protein
production in Finnish Ayrshire dairy cattle. Genetics 173, 2151-2164.
Vivier E and Malissen B 2005. Innate and adaptive immunity: specificities and signaling hierarchies
revisited. Nat Immunol 6, 17-21.
Wellnitz O and Kerr DE 2004. Cryopreserved bovine mammary cells to model epithelial response to
infection. Vet Immunol Immunopathol 101, 191-202.
Yang W, Zerbe H, Petzl W, Brunner RM, Gunther J, Draing C, von Aulock S, Schuberth HJ and Seyfert
HM 2008. Bovine TLR2 and TLR4 properly transduce signals from Staphylococcus aureus and E. coli,
but S. aureus fails to both activate NF-kappaB in mammary epithelial cells and to quickly induce
TNFalpha and interleukin-8 (CXCL8) expression in the udder. Mol Immunol 45, 1385-1397.
Yang J, Sang Y, Meade K and Ross C 2011. The role of oct-1 in the regulation of tracheal antimicrobial
peptide (TAP) and lingual antimicrobial peptide (LAP) expression in bovine mammary epithelial cells.
Immunogenetics 63, 715-725.

Acknowledgments
74
Acknowledgments
First of all I want to thank Prof. Dr. Dr. Heinrich H. D. Meyer, who has given me the
opportunity to work on this topic at the chair of physiology.
Many thanks go to Prof. Dr. Michael Pfaffl, who has taken over the responsibility for this work
after Prof. Meyer had passed away.
I owe my profound gratitude to my supervisor Dr. Heike Kliem for her continuing support,
guidance and advice on all kinds of practical and theoretical issues.
I also thank Dr. Enrique Viturro, Josef Riederer, Dr. Anna Gröbner, Swanhild Meyer and all
my other colleagues at the chair of physiology for their assistance and expertise.
I would like to greatly acknowledge the cooperation with PD Dr. Kai Frölich and Eike Fandrey
from Tierpark Arche Warder and their team, who provided access to the White Park and
Highland cattle and assisted with the sampling procedure. Furthermore, I thank Dr. Karin
Schwaiger and Barbara Fritz from the chair of animal hygiene at the Technische Universität
München for assistance with the bacterial work. My thanks also go to Prof. Mikael Kubista,
Dr. Vlasta Korenková, Vendula Rušnáková and Veronika Kašparová from the Institute of
Biotechnology at the National Academy of Sciences, Prague, for qPCR measurements,
expert advice and a very interesting visit to Prague. Also I want to send my best regards to
Prof. Dr. Ralf Zimmer and Dr. Robert Küffner at the Ludwigs-Maximilians-Universität who
helped with bioinformatical analyses.
I enjoyed the work with my students Andrea Rütschle, Anne Potzel, Cornelia Ochs, Lisa
Schlereth and Christiane Schmautz. They not only learned from me, but also taught me
many things in exchange and were very pleasant company.
I thank the Vereinigung zur Förderung der Milchwissenschaftlichen Forschung an der
Technischen Universität München e.V., the J & G Bruns Stiftung, the Dr.-Ing Leonhard-
Lorenz-Stiftung, the National Mastitis Council and the TUM Graduate School for financial
support and the opportunity to visit international scientific conferences.
My TUM Graduate School mentor, Dr. Gerhard Moll, receives my deepest gratitude for
scientific advice and moral support.
I sincerely thank Michi, my family, my mother, my brother, my grandfather, and especially my
father, who helped me to take milk samples from his Highland cows in good and mostly bad
weather.
Scientific communications
75
Scientific communications
Original peer-reviewed scientific publications
Sorg D, Potzel A, Beck M, Meyer HHD, Viturro E, Kliem H 2012. Effects of cell culture
techniques on gene expression and cholesterol efflux in primary bovine mammary epithelial
cells derived from tissue and milk. In Vitro Cellular & Developmental Biology - Animal 48,
550-553.
Danowski K, Sorg D, Gross J, Meyer HHD, Kliem H 2012. Innate defense capability of
challenged primary bovine mammary epithelial cells after an induced negative energy
balance in vivo. Czech Journal of Animal Science 57, 207-220
Sorg D, Danowski K, Korenkova V, Rusnakova V, Küffner R, Zimmer R, Meyer HHD and
Kliem H 2013a. Microfluidic high-throughput RT-qPCR measurements of the immune
response of primary bovine mammary epithelial cells cultured from milk to mastitis
pathogens. Animal: an international journal of animal bioscience 7(05), 799-805
Sorg D, Fandrey E, Froelich K, Meyer HHD, Kliem H Mammary immunity of White Park and
Highland cattle compared with Brown Swiss and Red Holstein 2013b. Animal Genetic
Resources / Resources génétiques animales / Recursos genéticos animales 52, 91-104
Abstracts and posters presented at scientific conferences
Sorg D, Potzel A, Meyer HHD, Viturro E Kliem H 2011. Validation of RT-qPCR
measurements in primary bovine mammary gland epithelial cells (pbMEC). International
qPCR Symposium, Freising, Germany (March 28th– April 1st, 2011)
Sorg D, Danowski K, Froelich K, Meyer HHD, Kliem H 2012. Comparison of the innate
immune response to mastitis pathogens in mammary epithelial cells of two ancient and two
modern cattle breeds. 51st Annual meeting of the National Mastitis Council (NMC), St. Pete
Beach, FL, USA (January 22nd – 25th, 2012)
Scientific communications
76
Sorg D, Danowski K, Frölich K, Meyer HHD, Kliem H 2012. Gene expression of the innate
immune response to mastitis pathogens in mammary epithelial cells from ancient and
modern cattle breeds. 20. Tagung der Fachgruppe Physiologie und Biochemie der
Deutschen Veterinärmedizinischen Gesellschaft, Munich, Germany (February 17th & 18th,
2012)
Sorg D, Fandrey E, Frölich K, Meyer HHD, Kliem H 2013. The innate immune response to
mastitis pathogens in mammary epithelial cells from ancient and modern cattle breeds.
Heinrich HD Meyer Symposium, Freising, Germany (October 19th 2012)
Sorg D, Fandrey E, Frölich K, Meyer HHD, Kliem H 2013. Mammary immunity of different
cattle breeds measured with microfluidic high-throughput RT-qPCR. 6th international qPCR
and NGS 2013 Event, Freising, Germany (March 18th – 22nd 2013)
Curriculum Vitae
77
Curriculum Vitae
Diana Anna Clara Sorg
Date of birth: 06.11.1983
Place of birth: Tettnang, Germany
September 1990 – July 1994 primary school Langenargen, Germany
September 1994 – June 2003 Graf-Zeppelin-Gymnasium, Friedrichshafen,
Germany
October 2003 – March 2007: studies in agricultural science at Eidgenössische
Technische Hochschule (ETH) Zürich, Zurich,
Switzerland
Degree: BSc.
March 2007 – March 2009 studies in agricultural science with major in
animal science at ETH Zürich, Zurich,
Switzerland
Degree: MSc.
April 2009 – December 2012 PhD student at Physiology Weihenstephan,
Technische Universität München, Freising,
Germany
June 2012 – August 2012 Visiting Graduate Assistant at the Department of
Animal Science, University of Vermont,
Burlington, VT, USA
Appendix
78
Appendix
Appendix I
Sorg D, Potzel A, Beck M, Meyer HHD, Viturro E, Kliem H 2012a. Effects of cell culture
techniques on gene expression and cholesterol efflux in primary bovine mammary epithelial
cells derived from tissue and milk. In Vitro Cellular & Developmental Biology - Animal 48,
550-553 (Reprinted with kind permission from Springer Science and Business media)
Appendix II
Danowski K, Sorg D, Gross J, Meyer HHD, Kliem H 2012. Innate defense capability of
challenged primary bovine mammary epithelial cells after an induced negative energy
balance in vivo. Czech Journal of Animal Science 57, 207-220 (Reprinted with permission)
Appendix III
Sorg D, Danowski K, Korenkova V, Rusnakova V, Küffner R, Zimmer R, Meyer HHD and
Kliem H 2013a. Microfluidic high-throughput RT-qPCR measurements of the immune
response of primary bovine mammary epithelial cells cultured from milk to mastitis
pathogens. Animal: an international journal of animal bioscience 7(05), 799-805 (Reprinted
with permission)
Appendix III
Sorg D, Fandrey E, Froelich K, Meyer HHD, Kliem H Mammary immunity of White Park and
Highland cattle compared with Brown Swiss and Red Holstein 2013b. Animal Genetic
Resources / Resources génétiques animales / Recursos genéticos animales 52, 91-104
(Reprinted with permission)
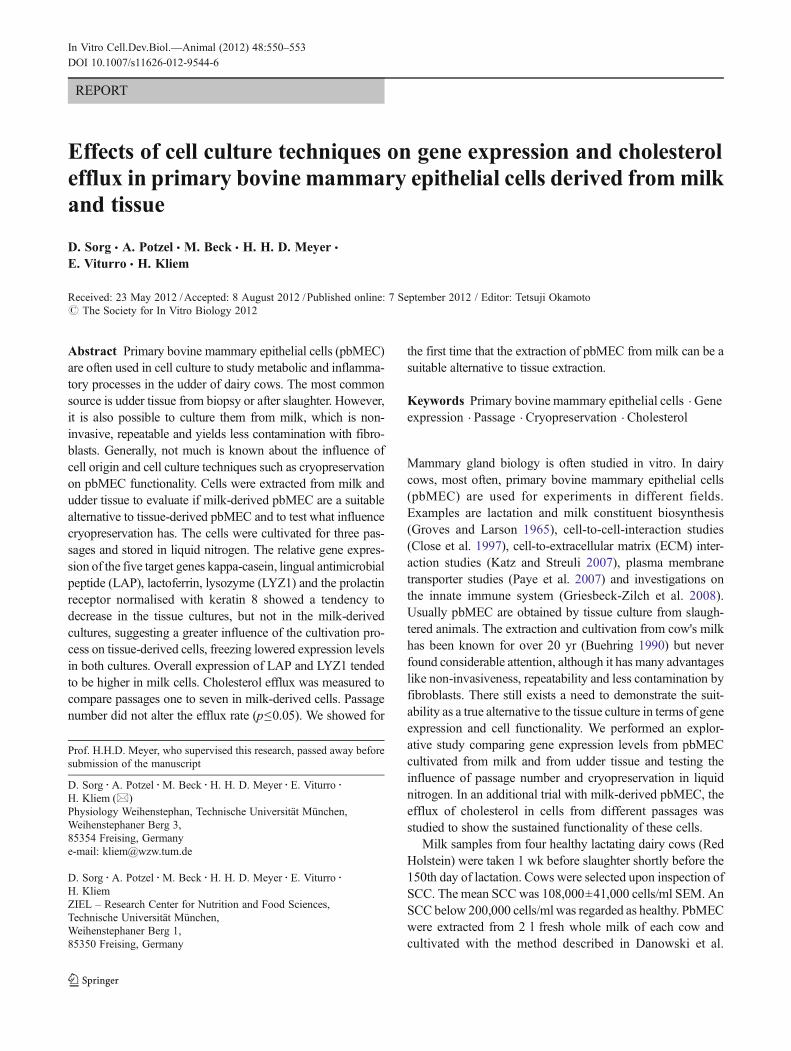
REPORT
Effects of cell culture techniques on gene expression and cholesterolefflux in primary bovine mammary epithelial cells derived frommilkand tissue
D. Sorg & A. Potzel & M. Beck & H. H. D. Meyer &
E. Viturro & H. Kliem
Received: 23 May 2012 /Accepted: 8 August 2012 /Published online: 7 September 2012 / Editor: Tetsuji Okamoto# The Society for In Vitro Biology 2012
Abstract Primary bovine mammary epithelial cells (pbMEC)are often used in cell culture to study metabolic and inflamma-tory processes in the udder of dairy cows. The most commonsource is udder tissue from biopsy or after slaughter. However,it is also possible to culture them from milk, which is non-invasive, repeatable and yields less contamination with fibro-blasts. Generally, not much is known about the influence ofcell origin and cell culture techniques such as cryopreservationon pbMEC functionality. Cells were extracted from milk andudder tissue to evaluate if milk-derived pbMEC are a suitablealternative to tissue-derived pbMEC and to test what influencecryopreservation has. The cells were cultivated for three pas-sages and stored in liquid nitrogen. The relative gene expres-sion of the five target genes kappa-casein, lingual antimicrobialpeptide (LAP), lactoferrin, lysozyme (LYZ1) and the prolactinreceptor normalised with keratin 8 showed a tendency todecrease in the tissue cultures, but not in the milk-derivedcultures, suggesting a greater influence of the cultivation pro-cess on tissue-derived cells, freezing lowered expression levelsin both cultures. Overall expression of LAP and LYZ1 tendedto be higher in milk cells. Cholesterol efflux was measured tocompare passages one to seven in milk-derived cells. Passagenumber did not alter the efflux rate (p≤0.05). We showed for
the first time that the extraction of pbMEC from milk can be asuitable alternative to tissue extraction.
Keywords Primary bovine mammary epithelial cells . Geneexpression . Passage . Cryopreservation . Cholesterol
Mammary gland biology is often studied in vitro. In dairycows, most often, primary bovine mammary epithelial cells(pbMEC) are used for experiments in different fields.Examples are lactation and milk constituent biosynthesis(Groves and Larson 1965), cell-to-cell-interaction studies(Close et al. 1997), cell-to-extracellular matrix (ECM) inter-action studies (Katz and Streuli 2007), plasma membranetransporter studies (Paye et al. 2007) and investigations onthe innate immune system (Griesbeck-Zilch et al. 2008).Usually pbMEC are obtained by tissue culture from slaugh-tered animals. The extraction and cultivation from cow's milkhas been known for over 20 yr (Buehring 1990) but neverfound considerable attention, although it has many advantageslike non-invasiveness, repeatability and less contamination byfibroblasts. There still exists a need to demonstrate the suit-ability as a true alternative to the tissue culture in terms of geneexpression and cell functionality. We performed an explor-ative study comparing gene expression levels from pbMECcultivated from milk and from udder tissue and testing theinfluence of passage number and cryopreservation in liquidnitrogen. In an additional trial with milk-derived pbMEC, theefflux of cholesterol in cells from different passages wasstudied to show the sustained functionality of these cells.
Milk samples from four healthy lactating dairy cows (RedHolstein) were taken 1 wk before slaughter shortly before the150th day of lactation. Cows were selected upon inspection ofSCC. The mean SCCwas 108,000±41,000 cells/ml SEM. AnSCC below 200,000 cells/ml was regarded as healthy. PbMECwere extracted from 2 l fresh whole milk of each cow andcultivated with the method described in Danowski et al.
Prof. H.H.D. Meyer, who supervised this research, passed away beforesubmission of the manuscript
D. Sorg :A. Potzel :M. Beck :H. H. D. Meyer : E. Viturro :H. Kliem (*)Physiology Weihenstephan, Technische Universität München,Weihenstephaner Berg 3,85354 Freising, Germanye-mail: [email protected]
D. Sorg :A. Potzel :M. Beck :H. H. D. Meyer : E. Viturro :H. KliemZIEL – Research Center for Nutrition and Food Sciences,Technische Universität München,Weihenstephaner Berg 1,85350 Freising, Germany
In Vitro Cell.Dev.Biol.—Animal (2012) 48:550–553DOI 10.1007/s11626-012-9544-6

(2012) adapted from Buehring (1990). Additionally, uddertissue from the same four cows was taken aseptically imme-diately after slaughtering with the method described inGriesbeck-Zilch et al. (2008). After the first, second and thirdpassage each, 100,000 cells were seeded in a six-well tissue-culture plate and grown for 5 d until harvest, the rest wasreseeded in a 25-cm2 tissue-culture flask for further prolifera-tion. After the third passage, additionally, an aliquot wasstored in liquid nitrogen for 3 wk before being reseeded at100,000 cells in a six-well plate in the same way. Primarybovine fibroblasts were extracted from a healthy cow's tendonand cultivated with the same protocol as the mammary tissue.An immunocytochemical staining of the epithelial markercytokeratin in pbMEC and fibroblasts was done using theprotocol and antibodies described in Danowski et al. (2012).The polyclonal rabbit anti-casein antibody (1:50 in PBS-
Tween) (Genetex, Irvine, CA) was used for the casein stainingin milk-derived cells with the same protocol as the cytokeratinstaining. After growing for 5 d, cells were washed with PBSand total RNAwas extracted with the NucleoSpin RNA II kit(Macherey-Nagel, Düren, Germany) following the manufac-turer's instructions. Reverse transcription was carried out us-ing 500 ng of RNA in a reaction with the M-MLV (H-) PointMutant Enzyme (Promega, Wisconsin) and random hexamerprimers (Invitrogen GmbH, Darmstadt, Germany). Reversetranscription quantitative polymerase chain reaction (RT-qPCR) was done on Rotor-Gene Q cycler (Qiagen GmbH,Hilden, Germany) and the SsoFast EvaGreen Supermix (Bio-Rad Laboratories, Inc. Munich, Germany) according manu-facturer’s instructions and the primers listed in Table 1. Toavoid measuring expression in eventually contaminatingfibroblasts, only mammary epithelial cell-specific genes were
Table 1. Primer sequences ofthe genes measured in RT-qPCR Gene Forward primer (5′→3′) Reverse primer (5′→3′)
CSN3 TGCAATGATGAAGAGTTTTTTCCTAG GATTGGGATATATTTGGCTATTTTGT
KRT8 ACTGGCTACGCAGGTGGACT CCGCAAGAGCCTTTCACTTG
LAP AGAAATTCTCAAAGCTGCCG CAGCATTTTACTTGGGCTCC
LF CGAAGTGTGGATGGCAAGGAA TTCAAGGTGGTCAAGTAGCGG
LYZ1 AAGAAACTTGGATTGGATGGC ACTGCTTTTGGGGTTTTGC
PRLR TGATGTTCATCTGCTGGAGAAGGGC TCCAGGTGCATGGGCTTCACG
VIM TGGAGCGTAAAGTGGAATCC GACATGCTGTTCTTGAATCTGG
Figure 1. Light microscopy of(a) primary bovine mammaryepithelial cells (pbMEC) fromudder tissue, immunostainedagainst cytokeratins (insert: neg-ative control), magnification×200 (b) pbMEC from milkimmunostained against cytoker-atins (insert: negative control),magnification ×200 (c) primarybovine fibroblasts immunos-tained against cytokeratins,magnification ×200 (d) pbMECfrom milk immunostainedagainst casein (insert: negativecontrol), magnification ×400.
PBMEC CULTURE FROM MILK AND UDDER TISSUE 551
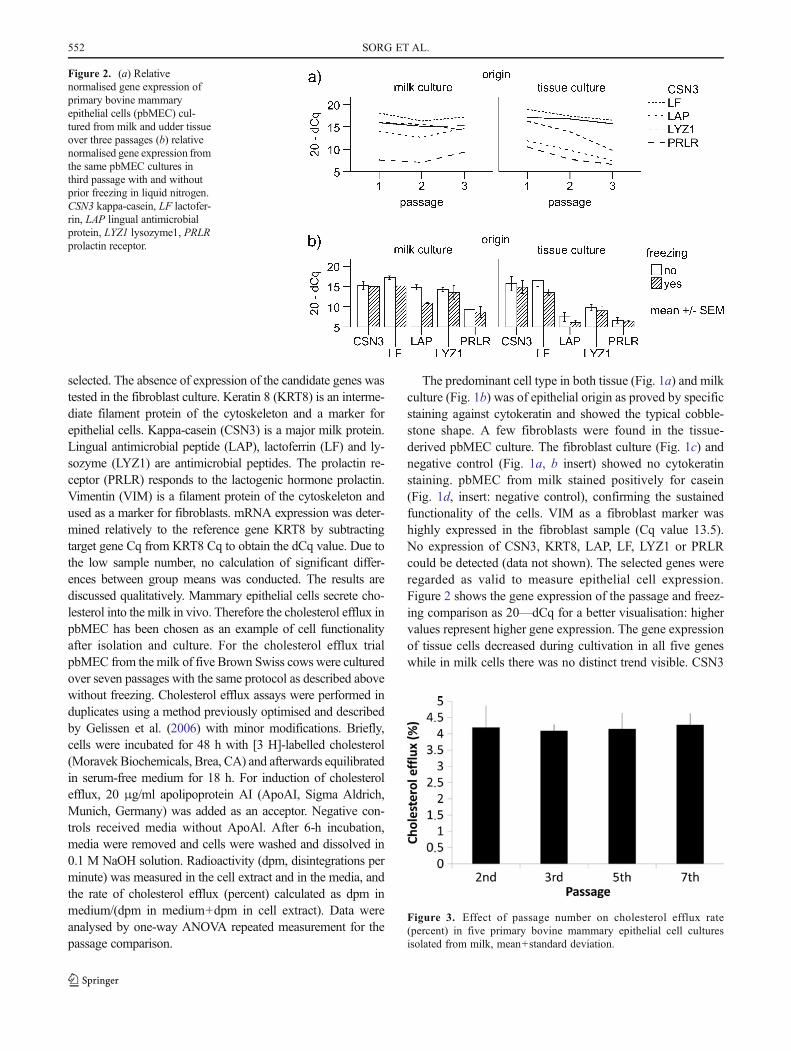
selected. The absence of expression of the candidate genes wastested in the fibroblast culture. Keratin 8 (KRT8) is an interme-diate filament protein of the cytoskeleton and a marker forepithelial cells. Kappa-casein (CSN3) is a major milk protein.Lingual antimicrobial peptide (LAP), lactoferrin (LF) and ly-sozyme (LYZ1) are antimicrobial peptides. The prolactin re-ceptor (PRLR) responds to the lactogenic hormone prolactin.Vimentin (VIM) is a filament protein of the cytoskeleton andused as a marker for fibroblasts. mRNA expression was deter-mined relatively to the reference gene KRT8 by subtractingtarget gene Cq from KRT8 Cq to obtain the dCq value. Due tothe low sample number, no calculation of significant differ-ences between group means was conducted. The results arediscussed qualitatively. Mammary epithelial cells secrete cho-lesterol into the milk in vivo. Therefore the cholesterol efflux inpbMEC has been chosen as an example of cell functionalityafter isolation and culture. For the cholesterol efflux trialpbMEC from the milk of five Brown Swiss cows were culturedover seven passages with the same protocol as described abovewithout freezing. Cholesterol efflux assays were performed induplicates using a method previously optimised and describedby Gelissen et al. (2006) with minor modifications. Briefly,cells were incubated for 48 h with [3 H]-labelled cholesterol(Moravek Biochemicals, Brea, CA) and afterwards equilibratedin serum-free medium for 18 h. For induction of cholesterolefflux, 20 μg/ml apolipoprotein AI (ApoAI, Sigma Aldrich,Munich, Germany) was added as an acceptor. Negative con-trols received media without ApoAl. After 6-h incubation,media were removed and cells were washed and dissolved in0.1 M NaOH solution. Radioactivity (dpm, disintegrations perminute) was measured in the cell extract and in the media, andthe rate of cholesterol efflux (percent) calculated as dpm inmedium/(dpm in medium+dpm in cell extract). Data wereanalysed by one-way ANOVA repeated measurement for thepassage comparison.
The predominant cell type in both tissue (Fig. 1a) and milkculture (Fig. 1b) was of epithelial origin as proved by specificstaining against cytokeratin and showed the typical cobble-stone shape. A few fibroblasts were found in the tissue-derived pbMEC culture. The fibroblast culture (Fig. 1c) andnegative control (Fig. 1a, b insert) showed no cytokeratinstaining. pbMEC from milk stained positively for casein(Fig. 1d, insert: negative control), confirming the sustainedfunctionality of the cells. VIM as a fibroblast marker washighly expressed in the fibroblast sample (Cq value 13.5).No expression of CSN3, KRT8, LAP, LF, LYZ1 or PRLRcould be detected (data not shown). The selected genes wereregarded as valid to measure epithelial cell expression.Figure 2 shows the gene expression of the passage and freez-ing comparison as 20—dCq for a better visualisation: highervalues represent higher gene expression. The gene expressionof tissue cells decreased during cultivation in all five geneswhile in milk cells there was no distinct trend visible. CSN3
Figure 2. (a) Relativenormalised gene expression ofprimary bovine mammaryepithelial cells (pbMEC) cul-tured from milk and udder tissueover three passages (b) relativenormalised gene expression fromthe same pbMEC cultures inthird passage with and withoutprior freezing in liquid nitrogen.CSN3 kappa-casein, LF lactofer-rin, LAP lingual antimicrobialprotein, LYZ1 lysozyme1, PRLRprolactin receptor.
Figure 3. Effect of passage number on cholesterol efflux rate(percent) in five primary bovine mammary epithelial cell culturesisolated from milk, mean+standard deviation.
552 SORG ET AL.

and LF gene expression was similar in both cultures, but LAPand LYZ1 were markedly higher expressed by the milk cells.The gene expression in milk-derived cells was similar orhigher in the third compared to the first passage. In contrastto this, tissue-derived cells showed a decreased gene expres-sion in the third passage. The passage number in which cellsare taken for an experiment is always a compromise between asufficient cell number and in vivo comparability. So it isunderstandable that gene expression is down regulated in thecourse of passages, as the in vivo conditions can never bemimicked perfectly and cells sense the chemical and physicalsurroundings via adhesion receptors (Katz and Streuli 2007).The question arises, how big is the extent of functionality lossand is it acceptable. Seeing that the milk-derived cells hadsimilar starting levels of gene expression as the tissue cells, theorigin did not seem to have much influence in a qualitativeway. The sustained gene expression in the milk cells in con-trast to the decreased expression in the tissue cells is a hintthat the former culture is at least equally suited and might beeven superior to the latter under certain circumstances.Interestingly, our cultured pbMEC cells did not lose immunedefence capability in terms of expressing LAP, LYZ1 and LF,in contrast to a study of Gunther et al. (2009). In that study,pbMEC from udder tissue of two animals almost lost theability to express LAP with or without stimulation with E.coli after three passages. This could be explained by the factthat LAP was qualitatively much lower expressed in ourtissue-derived cells than in our milk-derived cells.
The same question of sustained functionality holds true forthe decision whether to store the cells prior to use. Especiallyin trials with dairy cows, the samplings of animals are often atdifferent times to ensure comparing animals at the samelactation stage. To avoid bias through different cell cultureconditions, the cells are stored and reseeded together fortreatment. Freezing had only a slight effect on the levels ofCSN3, LYZ1 and PRLR in both cultures. This is in accor-dance to other studies that found that viability (Cifrian et al.1994) and secretion ability (Talhouk et al. 1990, 1993) werenot considerably influenced. LAP and LF, however, showed agreater difference in both cultures. Therefore, before settingup an experiment there is the need to test if the desired genesare still satisfactorily expressed after cryopreservation. Butthis need is the same for milk and tissue-derived cells.
The cholesterol efflux ability of second, third, fifth andseventh passage cultures remained intact during time, as itshowed no significant variations (p≤0.05) (Fig. 3). Themean values ranged between 4.10 and 4.28% with a stan-dard deviation between 0.19 and 0.67%. This is anotherconfirmation for the sustained functionality of milk-derived pbMEC in culture and a hint that they could be asuitable model for studying cholesterol metabolism in vitro.
To our knowledge, this is the first time that gene expres-sion and cholesterol efflux from cultured pbMEC was
compared for tissue and milk origin. We demonstrated inthis preliminary study that culturing pbMEC from milkseems to be a suitable alternative to isolating these cellsfrom tissue. Expression levels of five target genes over threepassages were similar or higher than in the cultures fromtissue, indicating that the loss of function was similar oreven lower in the milk cell culture. These findings aresupported by the sustained cholesterol efflux over sevenpassages.
Acknowledgments We thank the Vereinigung zur Förderung derMilchwissenschaftlichen Forschung an der Technischen UniversitätMünchen e.V. (Munich, Germany) and the Sachsenmilch LeppersdorfGmbH (Wachau, Germany) for their support.
References
Buehring G. C. Culture of mammary epithelial cells from bovine milk.J. Dairy Sci. 73(4): 956–963; 1990.
Cifrian E.; Guidry A. J.; O’Brien C. N.; Nickerson S. C.; Marquardt W.W. Adherence of Staphylococcus aureus to cultured bovine mam-mary epithelial cells. J. Dairy Sci. 77(4): 970–983; 1994.
Close M. J.; Howlett A. R.; Roskelley C. D.; Desprez P. Y.; Bailey N.;Rowning B.; Teng C. T.; Stampfer M. R.; Yaswen P. Lactoferrinexpression in mammary epithelial cells is mediated by changes in cellshape and actin cytoskeleton. J. Cell Sci. 110(22): 2861–2871; 1997.
Danowski K.; Sorg D.; Gross J.; Meyer H. H. D.; KliemH. Innate defensecapability of challenged primary bovine mammary epithelial cellsafter an induced negative energy balance in vivo. Czech. J. Anim.Sci. 57: 207–220; 2012.
Gelissen I. C.; Harris M.; Rye K. A.; Quinn C.; Brown A. J.; KockxM.; Cartland S.; Packianathan M.; Kritharides L.; Jessup W.ABCA1 and ABCG1 synergize to mediate cholesterol export toapoA-I. Arterioscler. Thromb. Vasc. 26(3): 534–540; 2006.
Griesbeck-Zilch B.; Meyer H. H.; Kuhn C. H.; Schwerin M.; Wellnitz O.Staphylococcus aureus and Escherichia coli cause deviating expres-sion profiles of cytokines and lactoferrin messenger ribonucleic acidin mammary epithelial cells. J. Dairy Sci. 91(6): 2215–2224; 2008.
Groves T. D.; Larson B. L. Preparation of specifically labeled milkproteins using bovine mammary-cell cultures. Biochim. Biophys.Acta 104(2): 462–469; 1965.
Gunther J.; Koczan D.; Yang W.; Nurnberg G.; Repsilber D.; SchuberthH. J.; Park Z.; Maqbool N.; Molenaar A.; Seyfert H. M. Assessmentof the immune capacity of mammary epithelial cells: comparisonwith mammary tissue after challenge with Escherichia coli. Vet. Res.40(4): 31; 2009.
Katz E.; Streuli C. H. The extracellular matrix as an adhesion check-point for mammary epithelial function. Int. J. Biochem. Cell Biol.39(4): 715–726; 2007.
Paye J. M.; Akers R. M.; Huckle W. R.; Forsten-Williams K. Autocrineproduction of insulin-like growth factor-I (IGF-I) affects para-cellular transport across epithelial cells in vitro. Cell Commun.Adhes. 14(2–3): 85–98; 2007.
Talhouk R. S.; Neiswander R. L.; Schanbacher F. L. In vitro culture ofcryopreserved bovine mammary cells on collagen gels: synthesis andsecretion of casein and lactoferrin. Tissue Cell 22(5): 583–599; 1990.
Talhouk R. S.; Neiswander R. L.; Schanbacher F. L. Morphologicaland functional differentiation of cryopreserved lactating bovinemammary cells cultured on floating collagen gels. Tissue Cell 25(6): 799–816; 1993.
PBMEC CULTURE FROM MILK AND UDDER TISSUE 553
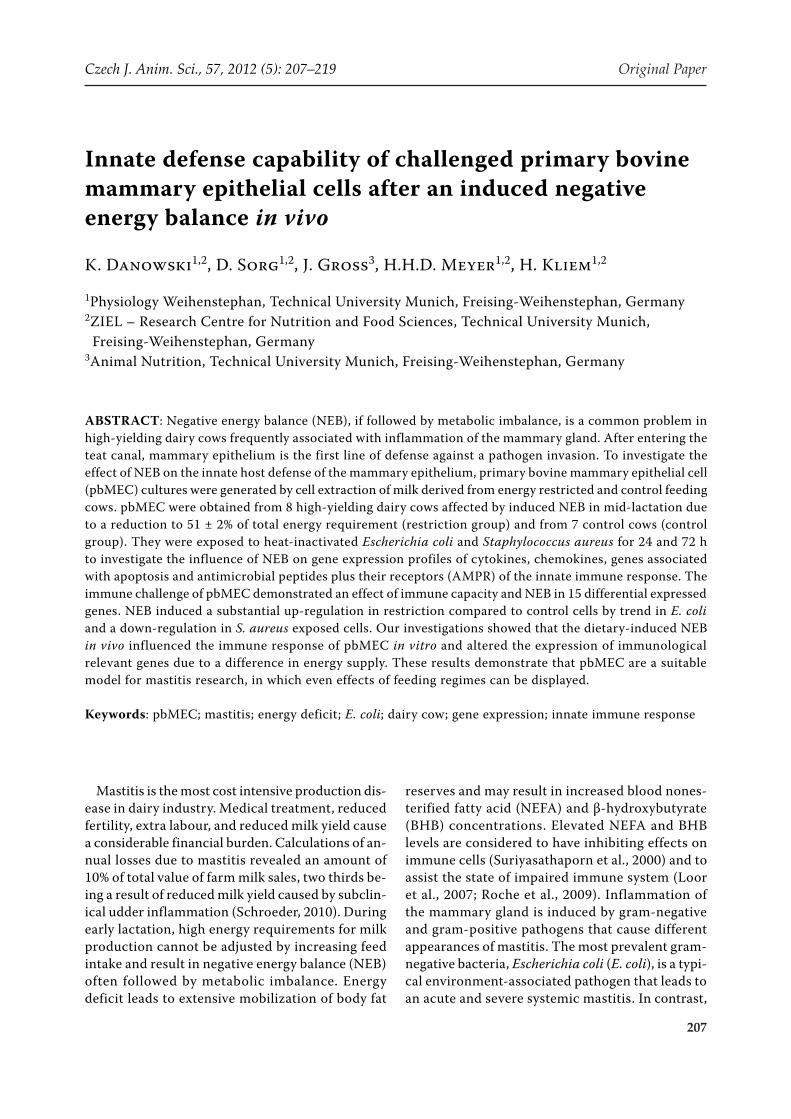
207
Czech J. Anim. Sci., 57, 2012 (5): 207–219 Original Paper
Mastitis is the most cost intensive production dis-ease in dairy industry. Medical treatment, reduced fertility, extra labour, and reduced milk yield cause a considerable financial burden. Calculations of an-nual losses due to mastitis revealed an amount of 10% of total value of farm milk sales, two thirds be-ing a result of reduced milk yield caused by subclin-ical udder inflammation (Schroeder, 2010). During early lactation, high energy requirements for milk production cannot be adjusted by increasing feed intake and result in negative energy balance (NEB) often followed by metabolic imbalance. Energy deficit leads to extensive mobilization of body fat
reserves and may result in increased blood nones-terified fatty acid (NEFA) and β-hydroxybutyrate (BHB) concentrations. Elevated NEFA and BHB levels are considered to have inhibiting effects on immune cells (Suriyasathaporn et al., 2000) and to assist the state of impaired immune system (Loor et al., 2007; Roche et al., 2009). Inflammation of the mammary gland is induced by gram-negative and gram-positive pathogens that cause different appearances of mastitis. The most prevalent gram-negative bacteria, Escherichia coli (E. coli), is a typi-cal environment-associated pathogen that leads to an acute and severe systemic mastitis. In contrast,
Innate defense capability of challenged primary bovine mammary epithelial cells after an induced negative energy balance in vivo
K. Danowski1,2, D. Sorg1,2, J. Gross3, H.H.D. Meyer1,2, H. Kliem1,2
1Physiology Weihenstephan, Technical University Munich, Freising-Weihenstephan, Germany2ZIEL – Research Centre for Nutrition and Food Sciences, Technical University Munich,
Freising-Weihenstephan, Germany3Animal Nutrition, Technical University Munich, Freising-Weihenstephan, Germany
ABSTRACT: Negative energy balance (NEB), if followed by metabolic imbalance, is a common problem in high-yielding dairy cows frequently associated with inflammation of the mammary gland. After entering the teat canal, mammary epithelium is the first line of defense against a pathogen invasion. To investigate the effect of NEB on the innate host defense of the mammary epithelium, primary bovine mammary epithelial cell (pbMEC) cultures were generated by cell extraction of milk derived from energy restricted and control feeding cows. pbMEC were obtained from 8 high-yielding dairy cows affected by induced NEB in mid-lactation due to a reduction to 51 ± 2% of total energy requirement (restriction group) and from 7 control cows (control group). They were exposed to heat-inactivated Escherichia coli and Staphylococcus aureus for 24 and 72 h to investigate the influence of NEB on gene expression profiles of cytokines, chemokines, genes associated with apoptosis and antimicrobial peptides plus their receptors (AMPR) of the innate immune response. The immune challenge of pbMEC demonstrated an effect of immune capacity and NEB in 15 differential expressed genes. NEB induced a substantial up-regulation in restriction compared to control cells by trend in E. coli and a down-regulation in S. aureus exposed cells. Our investigations showed that the dietary-induced NEB in vivo influenced the immune response of pbMEC in vitro and altered the expression of immunological relevant genes due to a difference in energy supply. These results demonstrate that pbMEC are a suitable model for mastitis research, in which even effects of feeding regimes can be displayed.
Keywords: pbMEC; mastitis; energy deficit; E. coli; dairy cow; gene expression; innate immune response
208
Original Paper Czech J. Anim. Sci., 57, 2012 (5): 207–219
Staphylococcus aureus (S. aureus) is among the most prevalent gram-positive bacteria causing a chronical and subclinical form of mastitis (Wellnitz et al., 2006; Tesfaye et al., 2009). Under practical conditions most mastitis incidences are disposed subclinically and remain unnoticed in dairy livestock. Besides their milk secretory function, mammary epithelial cells (MEC) participate in the first line of defense against invading pathogens (Vorbach et al., 2006) and op-erate together with immune cells during pathogen invasion. Cell culture studies with MEC revealed the expression of host defense mechanisms, e.g., pathogen recognition receptors as well as antimi-crobial peptide (Petzl et al., 2008; Griesbeck-Zilch et al., 2009), which enable them to react on pathogen invasion before the acquired immune defense fac-tors intervene. They are also responsible for immune modulatory effects in the udder due to secretion of chemokines (Bournazou et al., 2009) which enables the interaction with immune cells to defend against pathogen invasion.
Most investigated receptors are the transmem-brane toll-like receptors (TLR) that mediate path-ogen recognition via the pathogen-associated molecule pattern (PAMP) such as lipopolysaccha-rides (LPS) from E. coli and lipoteichoic acid (LTA) of S. auerus. In cattle, currently 10 different TLR are described and characterized (Werling et al., 2006). Petzl et al. (2008) demonstrated previously that TLR2 and TLR4 are selectively up-regulated in case of clinical mastitis, whereas TLR9 was not affected. Beside receptor-based defense, mammary epithelial cells secret a wide range of antimicrobial peptides (AMP) (Zasloff, 2002; Roosen et al., 2004; Lutzow et al., 2008; Molenaar et al., 2009). These proteins and peptides react upon all invading pathogens and exhibit strategies of killing. Antiviral, antifungal, and antibiotic mechanisms include membrane dis-ruption, thus perturbing bacterial permeability as well as metabolic inhibition (Almeida and Pokorny, 2009; Bocchinfuso et al., 2009). Additionally, in contrast to the therapeutical problems of increas-ing antibiotical resistance of pathogens, interest on those potent peptides increases due to minimal resistance development of the pathogens (Kraus and Peschel, 2006). Acute symptoms of mammary infection most often associated with E. coli mas-titis lead to increasing inflammation parameters. First of all, Tumor necrosis factor alpha (TNFα) and Interleukin 1 beta (IL1β) are to be mentioned. In the acute phase of cytokine release they mediate both local and systemic inflammatory responses.
They are most potent endogenous inducers of fe-ver and have both beneficial and injurious proper-ties (Sordillo and Streicher, 2002). Furthermore, TNFα is one of the factors to induce apoptosis in the mammary gland (Bannerman, 2009). During mammary inflammation epithelial cells take part in chemotaxis to recruit immune cells by the release of chemoattractants (Haston and Shileds, 1985). In case of acute mastitis 90% of milk-derived cells are neutrophiles (Mehrzad et al. 2005), which are also supposed to be the first cells to arrive at in-flammation due to secretion of growth-related oncogene alpha (Groα) and Interleukin 8 (IL8). Severe mastitis leads to mammary tissue damage and cell death by either apoptosis or necrosis, sup-ported by both bacteria and host defense factors (Zhao and Lacasse, 2008). Apoptosis initiating and regulatory factors are the FAS receptor, the anti-apoptotic B-cell lymphoma 2 (Bcl-2) family members involved in mitochondrial death cascade, and up-stream initiator and down-stream effec-tor cysteine proteases called caspases activated by the death receptor and the mitochondrial cascade (Nunez et al., 1998).
However, in most of the above cited works analy-sis was done in milk or the established cell culture models were generated by mammary biopsy or slaughter after intra mammary infection (Wellnitz and Kerr, 2004; Griesbeck-Zilch et al., 2008; Petzl et al., 2008). Beside its invasive character concerning animal’s welfare, the main disadvantage of mam-mary biopsy is the high risk of contamination with fibroblasts. This fast-growing stroma cells may overgrow the target epithelial cells and might tamper with the results. According to the advice of Boutinaud and Jammes (2002), the establishment of a cell culture model of milk-derived cells was implemented and focus was directed at the immune defense capability of primary bovine mammary epi-thelial cells (pbMEC) affected by induced in vivo NEB. The present investigation should have re-vealed whether the induced NEB in vivo influences also the immune capacity of MEC, for its known inhibiting effect on immune cells (Suriyasathaporn et al., 2000). Therefore cell cultures of pbMEC of energy restricted and control fed cows were gen-erated and an immune challenge was conducted. A set of 15 comprehensive genes involved in the different areas of the innate host defense was se-lected and the immune response was determined using quantitative reverse transcription polymerase chain reaction (qRT-PCR).
209
Czech J. Anim. Sci., 57, 2012 (5): 207–219 Original Paper
MATERIAL AND METHODS
Animals and dietary-induced NEB
A detailed description of the experimental de-sign and the conduction of the feeding experiment were published in Gross et al. (2011). In brief, Red Holstein cows were housed in a free-stall barn and were evenly assigned to control and restriction feeding according to milk yield, calculated energy balance, and feed intake during the first 85 days postpartum (pp). After re-establishment of meta-bolic stability and a positive energy balance on day 100 pp, a 51 ± 2% dietary energy deficit of total energy requirements was individually induced for 3 weeks, followed by a re-alimentation period.
Cell culture of primary bovine mammary epithelial cells
Milk samples were taken on the last day of the energy restriction period. One litre of milk was taken from each animal and per quarters subjected to a bacterial milk test to exclude bacterial infection prior to the experiment. Only milk free of bacteria was used to extract pbMEC. The milk was dispersed evenly into four centrifuge cups (250 ml each). The four cups were centrifuged at 1850 g, at 20°C for 10 min. Milk was decanted and each cell pel-let was re-suspended in 25 ml pre-warmed (37°C) washing medium (HBSS, Sigma-Aldrich, Munich, Germany) containing 200 µg per ml penicillin G, 200 µg/ml of streptomycin, 200 µg/ml gentamicin, and 10 µg/ml amphotericin B (Sigma-Aldrich, Munich, Germany). Two cell solutions were com-bined into a 50 ml falcon tube, washed by gentle mixing and centrifuged at 500 g at room tempera-ture (RT) for 5 min. The pellets were re-suspended in 25 ml HBSS-solution and filtered (Falcon Cell Strainer 100 µm, BD Biosciences, Bedford, USA) into one falcon tube. After centrifugation at 500 g for 5 min, the pellet was re-suspended in warm growth medium consisting of DMEM/F12 Ham (Sigma-Aldrich, Munich, Germany), 10% fetal calf serum (FCS) (Gibco, Invitrogen, Carlsbad, USA), ITS supplement (5 mg/ml insulin, 5 mg/ml transferrin, and 0.005 mg/ml sodium selenite; Invitrogen, Carlsbad, USA), 100 µg/ml penicillin, 100 µg/ml streptomycin, 100 µg/ml gentamycin, and 5 µg/ml amphotericin B. The cells were seed-ed into 25 cm2 tissue culture flasks (Greiner Bio
One, Frickenhausen, Germany) and cultivated at 37°C, 5% CO2, and 90% humidity. The cells were allowed to attach for 24 h. Unattached cells were removed by gentile washing with warm phosphate buffered saline (PBS) of pH 7.4 and the medium was exchanged. Growth medium was changed twice weekly and growth of primary cells was documented until reaching 80% confluence. Due to higher sensi-bility and higher contamination risk in primary cells compared to cell lines, infected cultures were elimi-nated at first appearance of bacterial contamination. Additionally, only morphologically healthy cultures were further cultivated and selected for the experi-ment. The cells were harvested at 80% confluence state in the second passage and stored in DMEM/F12 HAM with 20% FCS and 10% dimethyl sulfoxide (DMSO) (Roth, Karlsruhe, Germany) in liquid ni-trogen until all samples were taken. Finally, primary mammary epithelial cell cultures of 8 restriction and 7 control cows were successfully generated.
Immunohistochemistry
Epithelial identity was confirmed by immuno-his-tological staining of cytokeratins 4, 5, 6, 8, 10, 13, and 18. Concurrently to the seeding of the 48-wells chal-lenge plates, pbMEC were seeded on culture cham-ber slides (LAB-Tek, Nunc, GmbH, Langenselbold, Germany) in four-times approach. After reaching confluent state, medium was removed and pbMEC were washed twice with PBS. Chambers were removed and attached cells were fixed with ice-cold aceton-methanol mix (1 : 1) for 5 min. Slides were dried at room temperature (RT). Wells were incubated with 1% H2O2 (Merk, Darmstadt, Germany) in PBS-Tween (PBST) in the dark at RT for 30 min to block endo- genous peroxidases. After triple washing with PBST for 5 min, respectively, the slides were incubated with goat serum (Dako, Glostrup, Denkmark) di-luted 1 : 10 in PBST for 30 min at RT. A primary monoclonal mouse IgG anti-pan cytokeratin anti-body (F3418, Sigma-Aldrich, St. Louis, USA) was diluted 1 : 50 in PBST, applied to the wells and in-cubated at 4°C overnight. Goat serum remained on negative controls and was not replaced by primary antibody. On the next day the slides were 3 times washed with PBST for 5 min, respectively, and sec-ondary polyclonal goat anti-mouse antibody (1 : 400; Immunoglobulins HRP, Dako Gostrup, Denmark) was applied. After 1 h incubation at RT the cells were washed 3 times with PBST for 5 min, respec-
210
Original Paper Czech J. Anim. Sci., 57, 2012 (5): 207–219
tively, and peroxidase was visualized by incubating the wells with 0.01% DAB-dihydrochloride (D-5905, Sigma-Aldrich, Munich, Germany) and 0.01% H2O2 in PBST in the dark at RT for 15 min. Afterwards the slides were 3 times washed with PBST for 5 min, respectively, and were dipped in aqua bidets. The cell nuclei were stained with Mayer hemalaun solu-tion (Roth, Karlsruhe, Germany) for 15 s and colour development was obtained by dipping the slides into tap water. The slides were dehydrated in a series of ethanols of increasing concetration (50–100%) for 2 min, respectively, followed by 2 min incubation in xylol (Sigma-Aldrich, Munich, Germany). Cover glasses were fixed with EUKITT (Fluka, Sigma-Aldrich, Steinheim, Germany). Results are shown in Figure 1.
Cultivation of E. coli and S. aureus
S. aureus 1027 and E. coli 1303 (Petzl et al., 2008) were donated from Wolfram Petzl (Clinic for Ruminants, Ludwig-Maximilians-University, Munich, Germany). The gram negative pathogen E. coli was cultured in lysogeny broth (LB) liquid me-dium and on LB-agar Lennox (SERVA, Heidelberg, Germany) plates. The cultivation of the gram posi-tive S. auerus was conducted in casein-soy-peptone (CASO) broth liquid medium (Fluka, Sigma-Aldrich, Steinheim, Germany) and on blood agar (Blood Agar Base No. 2, Oxoid, Cambridge, UK) plates. The path-ogens were thawed and applied to the appropriate agar plates and incubated at 37°C overnight. One colony of each pathogen was picked and applied to 20 ml growth mediums. After overnight incubation at 37°C, E. coli was diluted 1 : 1000 and S. auerus 1 : 500 into fresh growth medium. Optical density (OD) of 1 ml bacteria solution was measured at 600 nm every 30 min for 4 h to generate a growth curve. Simultaneously with each OD measurement, 5 dilution steps of the pathogens were seeded on respective agar plates and incubated at 37°C. At the beginning, 10–4–10–6 dilution steps and with increasing time and pathogen growth 10–9–10–10 dilution steps were used. Next day the colonies were counted. According to the assumption that one colony was grown out of one bacterium within the dilution steps the amount of bacteria was calculated. The growth curve was repeated and according to the optimal harvest time the growth was stopped by putting the pathogen tubes on ice for 10 min. The tubes were centrifuged at 1850 g twice for 10 min
and re-suspended in 50 ml PBS. After the third cen-trifugation step, the pellet was re-suspended in 5 ml PBS and put into the 63°C water bath for 30 min to inactivate the pathogens. To control the inactiva-tion, respective agar plates were inoculated with the pathogens. Bacteria solutions were aliquoted and stored at –80°C.
Immune challenge of pbMEC with heat-inactivated E. coli and S. aureus
Cells were thawed in the third passage and seeded into 48 well plates with a concentration of 100 000 cells per a well. Two wells were seeded for E. coli, S. auerus, and untreated control cells, respectively. Additionally two wells served as counting wells. Those wells were detached prior to treatment and counted twice. The determined mean cell count was assumed for the treatment and the control cell wells to calculate the concentration of applied pathogen. Until 80% conflu-ency was obtained, the growth medium was replaced by 1 ml DMEM/F12 Ham supplied with ITS (chal-lenge medium) solely. The cells in the counting wells were detached, counted, and pathogen concentrations for multiplicity of infection (MOI 30) were calculated. Challenge medium was replaced and the wells were infected with MOI 30 of respective heat-inactivated bacteria solution. Control wells were treated with PBS. A double approach was conducted.
Quantitative reverse transcription PCR (qRT-PCR) for mRNA quantification
After 24 and 72 h the cells were harvested, chal-lenge medium supernatant was removed and stored at –80°C. Total RNA was extracted with the Allprep RNA/Protein kit (Qiagen, Hilden, Germany) as de-scribed in the manufacturer’s instructions and an additional DNAse digestion (RNase-Free DNase Set, Qiagen, Hilden, Germany) was conducted. RNA integrity was determined with the Agilent Bioanalyzer 2100 and RNA 6000 Nano Assays (Agilent Technologies, Waldbronn, Germany). The reverse transcription was conducted on Eppendorf Mastercycler Gradient (Eppendorf, Hamburg, Germany). For converting the RNA template into cDNA 300 ng of RNA was reverse transcribed with 1 µl of M-MLV Reverse Transcriptase, RNase Minus, Point Mutant (Promega, Mannheim, Germany) us-ing 3 µl of random primers (Invitrogen, Karlsruhe,
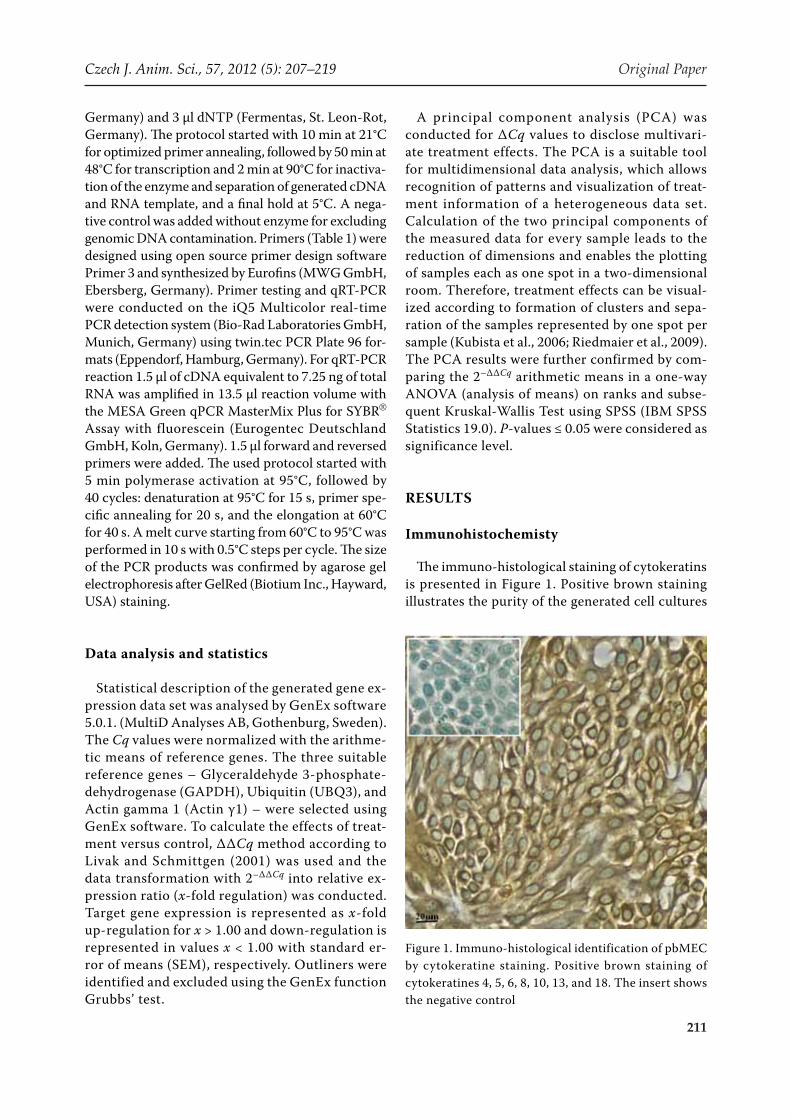
211
Czech J. Anim. Sci., 57, 2012 (5): 207–219 Original Paper
Germany) and 3 µl dNTP (Fermentas, St. Leon-Rot, Germany). The protocol started with 10 min at 21°C for optimized primer annealing, followed by 50 min at 48°C for transcription and 2 min at 90°C for inactiva-tion of the enzyme and separation of generated cDNA and RNA template, and a final hold at 5°C. A nega-tive control was added without enzyme for excluding genomic DNA contamination. Primers (Table 1) were designed using open source primer design software Primer 3 and synthesized by Eurofins (MWG GmbH, Ebersberg, Germany). Primer testing and qRT-PCR were conducted on the iQ5 Multicolor real-time PCR detection system (Bio-Rad Laboratories GmbH, Munich, Germany) using twin.tec PCR Plate 96 for-mats (Eppendorf, Hamburg, Germany). For qRT-PCR reaction 1.5 µl of cDNA equivalent to 7.25 ng of total RNA was amplified in 13.5 µl reaction volume with the MESA Green qPCR MasterMix Plus for SYBR® Assay with fluorescein (Eurogentec Deutschland GmbH, Koln, Germany). 1.5 µl forward and reversed primers were added. The used protocol started with 5 min polymerase activation at 95°C, followed by 40 cycles: denaturation at 95°C for 15 s, primer spe-cific annealing for 20 s, and the elongation at 60°C for 40 s. A melt curve starting from 60°C to 95°C was performed in 10 s with 0.5°C steps per cycle. The size of the PCR products was confirmed by agarose gel electrophoresis after GelRed (Biotium Inc., Hayward, USA) staining.
Data analysis and statistics
Statistical description of the generated gene ex-pression data set was analysed by GenEx software 5.0.1. (MultiD Analyses AB, Gothenburg, Sweden). The Cq values were normalized with the arithme-tic means of reference genes. The three suitable reference genes – Glyceraldehyde 3-phosphate-dehydrogenase (GAPDH), Ubiquitin (UBQ3), and Actin gamma 1 (Actin γ1) – were selected using GenEx software. To calculate the effects of treat-ment versus control, ∆∆Cq method according to Livak and Schmittgen (2001) was used and the data transformation with 2–∆∆Cq into relative ex-pression ratio (x-fold regulation) was conducted. Target gene expression is represented as x-fold up-regulation for x > 1.00 and down-regulation is represented in values x < 1.00 with standard er-ror of means (SEM), respectively. Outliners were identified and excluded using the GenEx function Grubbs’ test.
A principal component analysis (PCA) was conducted for ∆Cq values to disclose multivari-ate treatment effects. The PCA is a suitable tool for multidimensional data analysis, which allows recognition of patterns and visualization of treat-ment information of a heterogeneous data set. Calculation of the two principal components of the measured data for every sample leads to the reduction of dimensions and enables the plotting of samples each as one spot in a two-dimensional room. Therefore, treatment effects can be visual-ized according to formation of clusters and sepa-ration of the samples represented by one spot per sample (Kubista et al., 2006; Riedmaier et al., 2009). The PCA results were further confirmed by com-paring the 2–∆∆Cq arithmetic means in a one-way ANOVA (analysis of means) on ranks and subse-quent Kruskal-Wallis Test using SPSS (IBM SPSS Statistics 19.0). P-values ≤ 0.05 were considered as significance level.
RESULTS
Immunohistochemisty
The immuno-histological staining of cytokeratins is presented in Figure 1. Positive brown staining illustrates the purity of the generated cell cultures
Figure 1. Immuno-histological identification of pbMEC by cytokeratine staining. Positive brown staining of cytokeratines 4, 5, 6, 8, 10, 13, and 18. The insert shows the negative control
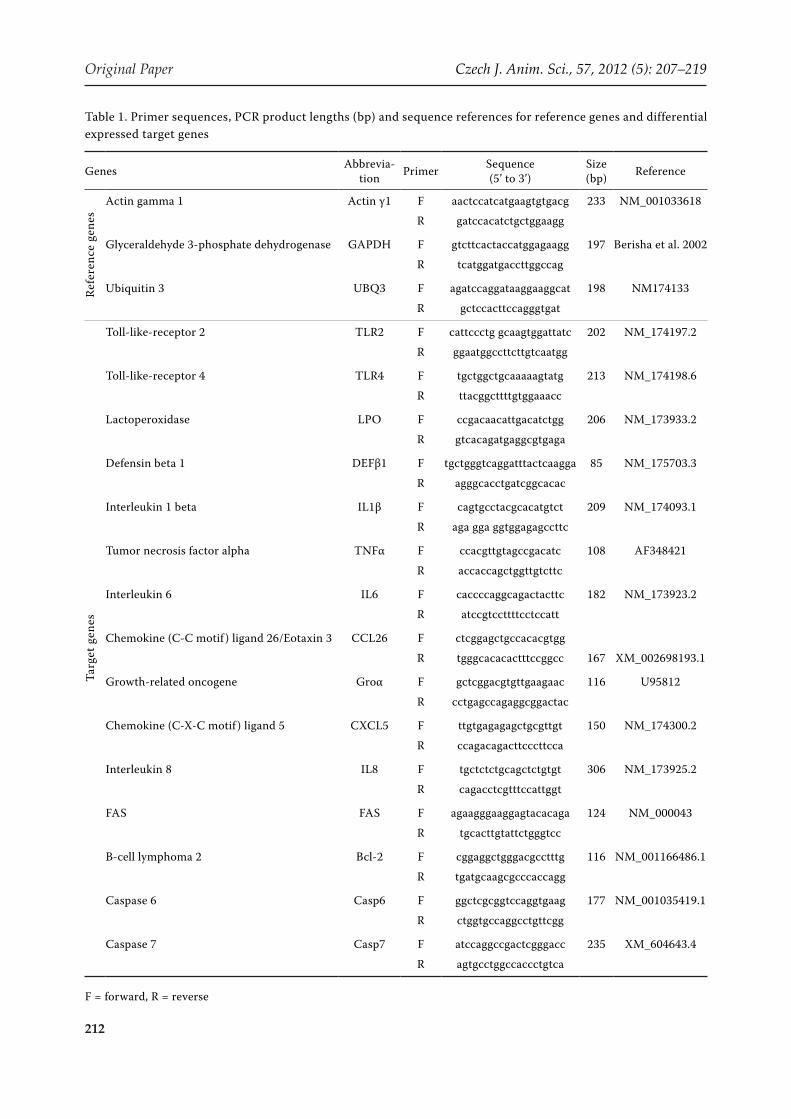
212
Original Paper Czech J. Anim. Sci., 57, 2012 (5): 207–219
Table 1. Primer sequences, PCR product lengths (bp) and sequence references for reference genes and differential expressed target genes
Genes Abbrevia-tion Primer Sequence
(5’ to 3’)Size (bp) Reference
Refe
renc
e ge
nes
Actin gamma 1 Actin γ1 F aactccatcatgaagtgtgacg 233 NM_001033618
R gatccacatctgctggaagg
Glyceraldehyde 3-phosphate dehydrogenase GAPDH F gtcttcactaccatggagaagg 197 Berisha et al. 2002
R tcatggatgaccttggccag
Ubiquitin 3 UBQ3 F agatccaggataaggaaggcat 198 NM174133
R gctccacttccagggtgat
Targ
et g
enes
Toll-like-receptor 2 TLR2 F cattccctg gcaagtggattatc 202 NM_174197.2
R ggaatggccttcttgtcaatgg
Toll-like-receptor 4 TLR4 F tgctggctgcaaaaagtatg 213 NM_174198.6
R ttacggcttttgtggaaacc
Lactoperoxidase LPO F ccgacaacattgacatctgg 206 NM_173933.2
R gtcacagatgaggcgtgaga
Defensin beta 1 DEFβ1 F tgctgggtcaggatttactcaagga 85 NM_175703.3
R agggcacctgatcggcacac
Interleukin 1 beta IL1β F cagtgcctacgcacatgtct 209 NM_174093.1
R aga gga ggtggagagccttc
Tumor necrosis factor alpha TNFα F ccacgttgtagccgacatc 108 AF348421
R accaccagctggttgtcttc
Interleukin 6 IL6 F caccccaggcagactacttc 182 NM_173923.2
R atccgtccttttcctccatt
Chemokine (C-C motif ) ligand 26/Eotaxin 3 CCL26 F ctcggagctgccacacgtgg
R tgggcacacactttccggcc 167 XM_002698193.1
Growth-related oncogene Groα F gctcggacgtgttgaagaac 116 U95812
R cctgagccagaggcggactac
Chemokine (C-X-C motif ) ligand 5 CXCL5 F ttgtgagagagctgcgttgt 150 NM_174300.2
R ccagacagacttcccttcca
Interleukin 8 IL8 F tgctctctgcagctctgtgt 306 NM_173925.2
R cagacctcgtttccattggt
FAS FAS F agaagggaaggagtacacaga 124 NM_000043
R tgcacttgtattctgggtcc
B-cell lymphoma 2 Bcl-2 F cggaggctgggacgcctttg 116 NM_001166486.1
R tgatgcaagcgcccaccagg
Caspase 6 Casp6 F ggctcgcggtccaggtgaag 177 NM_001035419.1
R ctggtgccaggcctgttcgg
Caspase 7 Casp7 F atccaggccgactcgggacc 235 XM_604643.4
R agtgcctggccaccctgtca
F = forward, R = reverse
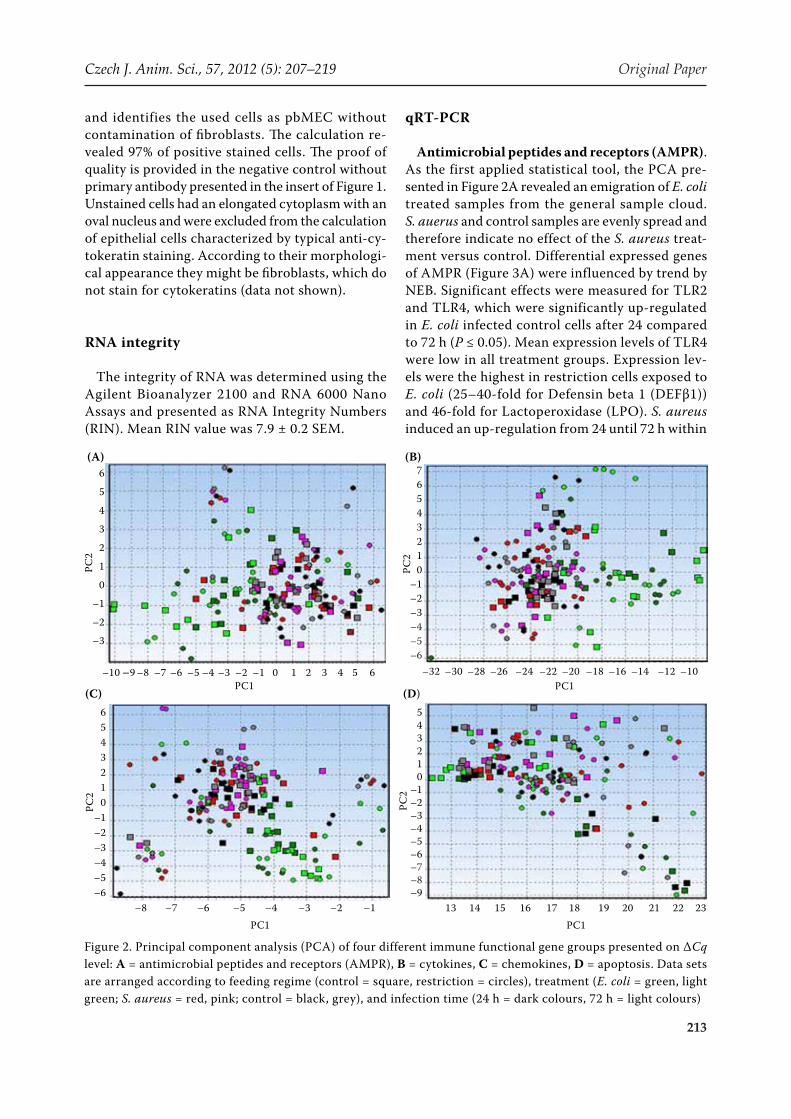
213
Czech J. Anim. Sci., 57, 2012 (5): 207–219 Original Paper
and identifies the used cells as pbMEC without contamination of fibroblasts. The calculation re-vealed 97% of positive stained cells. The proof of quality is provided in the negative control without primary antibody presented in the insert of Figure 1. Unstained cells had an elongated cytoplasm with an oval nucleus and were excluded from the calculation of epithelial cells characterized by typical anti-cy-tokeratin staining. According to their morphologi-cal appearance they might be fibroblasts, which do not stain for cytokeratins (data not shown).
RNA integrity
The integrity of RNA was determined using the Agilent Bioanalyzer 2100 and RNA 6000 Nano Assays and presented as RNA Integrity Numbers (RIN). Mean RIN value was 7.9 ± 0.2 SEM.
qRT-PCR
Antimicrobial peptides and receptors (AMPR). As the first applied statistical tool, the PCA pre-sented in Figure 2A revealed an emigration of E. coli treated samples from the general sample cloud. S. auerus and control samples are evenly spread and therefore indicate no effect of the S. aureus treat-ment versus control. Differential expressed genes of AMPR (Figure 3A) were influenced by trend by NEB. Significant effects were measured for TLR2 and TLR4, which were significantly up-regulated in E. coli infected control cells after 24 compared to 72 h (P ≤ 0.05). Mean expression levels of TLR4 were low in all treatment groups. Expression lev-els were the highest in restriction cells exposed to E. coli (25–40-fold for Defensin beta 1 (DEFβ1)) and 46-fold for Lactoperoxidase (LPO). S. aureus induced an up-regulation from 24 until 72 h within
Figure 2. Principal component analysis (PCA) of four different immune functional gene groups presented on ∆Cq level: A = antimicrobial peptides and receptors (AMPR), B = cytokines, C = chemokines, D = apoptosis. Data sets are arranged according to feeding regime (control = square, restriction = circles), treatment (E. coli = green, light green; S. aureus = red, pink; control = black, grey), and infection time (24 h = dark colours, 72 h = light colours)
6
5
4
3
2
1
0
–1
–2
–3
76543210
–1–2–3–4–5–6
–32 –30 –28 –26 –24 –22 –20 –18 –16 –14 –12 –10PC1
PC2
PC2
–10 –9 –8 –7 –6 –5 –4 –3 –2 –1 0 1 2 3 4 5 6PC1
–8 –7 –6 –5 –4 –3 –2 –1PC1
PC2
6543210
–1–2–3–4–5–6
13 14 15 16 17 18 19 20 21 22 23PC1
PC2
543210
–1–2–3–4–5–6–7–8–9
(A) (B)
(C) (D)
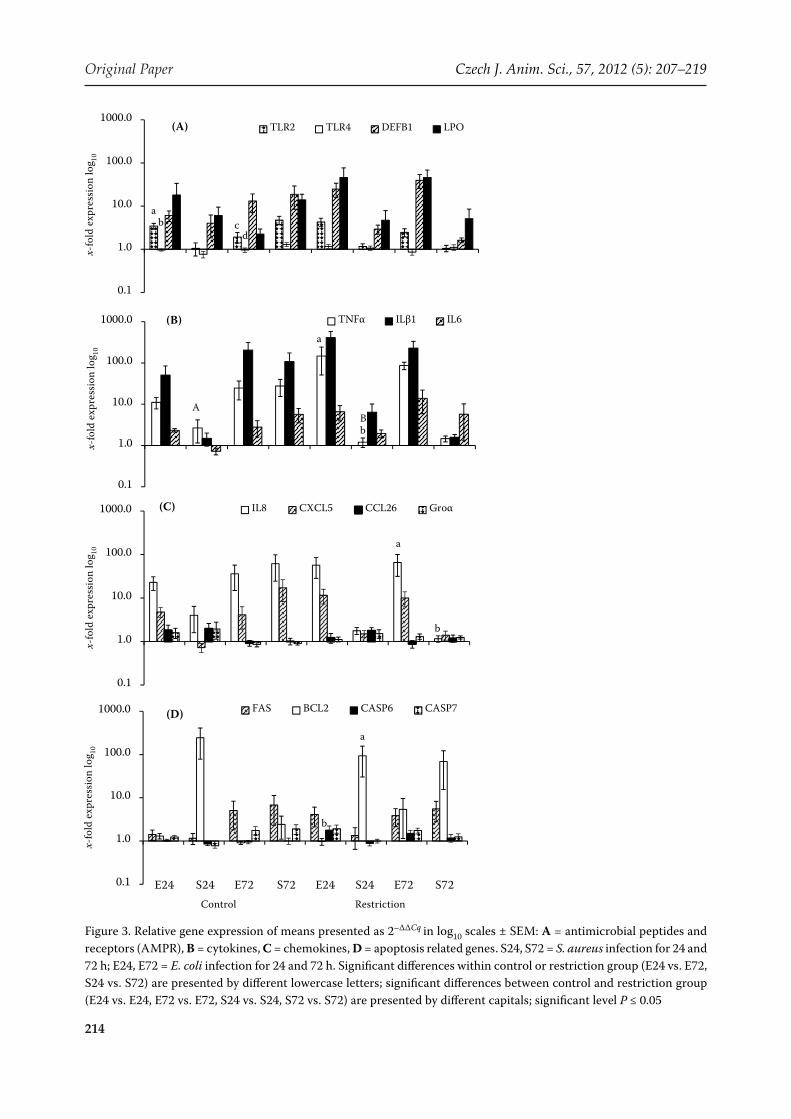
214
Original Paper Czech J. Anim. Sci., 57, 2012 (5): 207–219
Figure 3. Relative gene expression of means presented as 2–∆∆Cq in log10 scales ± SEM: A = antimicrobial peptides and receptors (AMPR), B = cytokines, C = chemokines, D = apoptosis related genes. S24, S72 = S. aureus infection for 24 and 72 h; E24, E72 = E. coli infection for 24 and 72 h. Significant differences within control or restriction group (E24 vs. E72, S24 vs. S72) are presented by different lowercase letters; significant differences between control and restriction group (E24 vs. E24, E72 vs. E72, S24 vs. S24, S72 vs. S72) are presented by different capitals; significant level P ≤ 0.05
0.1
1.0
10.0
100.0
1000.0
E24 S24 E72 S72 E24 S24 E72 S72
(B) TNFα ILβ1 IL6
0.1
1.0
10.0
100.0
1000.0(A) TLR2 TLR4 DEFB1 LPO
0.1
1.0
10.0
100.0
1000.0
E24 S24 E72 S72 E24 S24 E72 S72
(C) IL8 CXCL5 CCL26 Groα
x-fo
ld e
xpre
ssio
n lo
g 10
0.1
1.0
10.0
100.0
1000.0 (D) FAS BCL2 CASP6 CASP7
Control Restriction
a
a
AB b
b
a
b
ab c
d
E24 S24 E72 S72 E24 S24 E72 S72
x-fo
ld e
xpre
ssio
n lo
g 10x-
fold
exp
ress
ion
log 10
x-fo
ld e
xpre
ssio
n lo
g 10
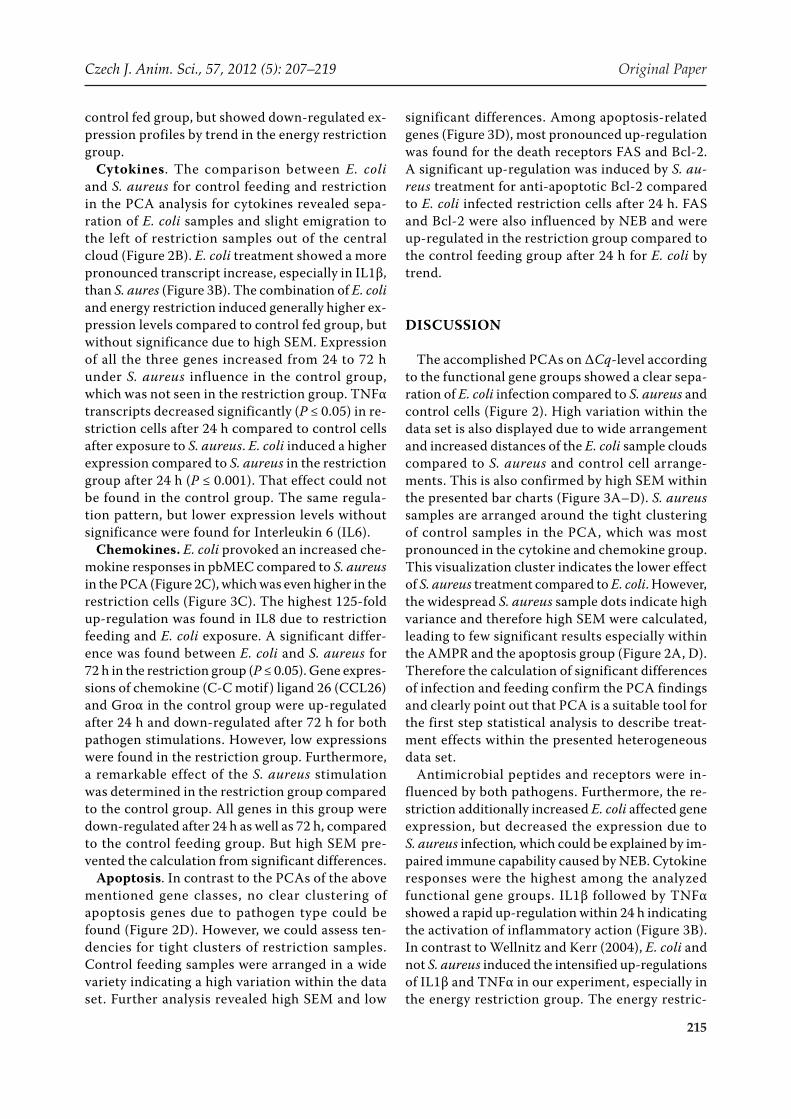
215
Czech J. Anim. Sci., 57, 2012 (5): 207–219 Original Paper
control fed group, but showed down-regulated ex-pression profiles by trend in the energy restriction group.
Cytokines. The comparison between E. coli and S. aureus for control feeding and restriction in the PCA analysis for cytokines revealed sepa-ration of E. coli samples and slight emigration to the left of restriction samples out of the central cloud (Figure 2B). E. coli treatment showed a more pronounced transcript increase, especially in IL1β, than S. aures (Figure 3B). The combination of E. coli and energy restriction induced generally higher ex-pression levels compared to control fed group, but without significance due to high SEM. Expression of all the three genes increased from 24 to 72 h under S. aureus influence in the control group, which was not seen in the restriction group. TNFα transcripts decreased significantly (P ≤ 0.05) in re-striction cells after 24 h compared to control cells after exposure to S. aureus. E. coli induced a higher expression compared to S. aureus in the restriction group after 24 h (P ≤ 0.001). That effect could not be found in the control group. The same regula-tion pattern, but lower expression levels without significance were found for Interleukin 6 (IL6).
Chemokines. E. coli provoked an increased che- mokine responses in pbMEC compared to S. aureus in the PCA (Figure 2C), which was even higher in the restriction cells (Figure 3C). The highest 125-fold up-regulation was found in IL8 due to restriction feeding and E. coli exposure. A significant differ-ence was found between E. coli and S. aureus for 72 h in the restriction group (P ≤ 0.05). Gene expres-sions of chemokine (C-C motif ) ligand 26 (CCL26) and Groα in the control group were up-regulated after 24 h and down-regulated after 72 h for both pathogen stimulations. However, low expressions were found in the restriction group. Furthermore, a remarkable effect of the S. aureus stimulation was determined in the restriction group compared to the control group. All genes in this group were down-regulated after 24 h as well as 72 h, compared to the control feeding group. But high SEM pre-vented the calculation from significant differences.
Apoptosis. In contrast to the PCAs of the above mentioned gene classes, no clear clustering of apoptosis genes due to pathogen type could be found (Figure 2D). However, we could assess ten-dencies for tight clusters of restriction samples. Control feeding samples were arranged in a wide variety indicating a high variation within the data set. Further analysis revealed high SEM and low
significant differences. Among apoptosis-related genes (Figure 3D), most pronounced up-regulation was found for the death receptors FAS and Bcl-2. A significant up-regulation was induced by S. au-reus treatment for anti-apoptotic Bcl-2 compared to E. coli infected restriction cells after 24 h. FAS and Bcl-2 were also influenced by NEB and were up-regulated in the restriction group compared to the control feeding group after 24 h for E. coli by trend.
DISCUSSION
The accomplished PCAs on ∆Cq-level according to the functional gene groups showed a clear sepa-ration of E. coli infection compared to S. aureus and control cells (Figure 2). High variation within the data set is also displayed due to wide arrangement and increased distances of the E. coli sample clouds compared to S. aureus and control cell arrange-ments. This is also confirmed by high SEM within the presented bar charts (Figure 3A–D). S. aureus samples are arranged around the tight clustering of control samples in the PCA, which was most pronounced in the cytokine and chemokine group. This visualization cluster indicates the lower effect of S. aureus treatment compared to E. coli. However, the widespread S. aureus sample dots indicate high variance and therefore high SEM were calculated, leading to few significant results especially within the AMPR and the apoptosis group (Figure 2A, D). Therefore the calculation of significant differences of infection and feeding confirm the PCA findings and clearly point out that PCA is a suitable tool for the first step statistical analysis to describe treat-ment effects within the presented heterogeneous data set.
Antimicrobial peptides and receptors were in-fluenced by both pathogens. Furthermore, the re-striction additionally increased E. coli affected gene expression, but decreased the expression due to S. aureus infection, which could be explained by im-paired immune capability caused by NEB. Cytokine responses were the highest among the analyzed functional gene groups. IL1β followed by TNFα showed a rapid up-regulation within 24 h indicating the activation of inflammatory action (Figure 3B). In contrast to Wellnitz and Kerr (2004), E. coli and not S. aureus induced the intensified up-regulations of IL1β and TNFα in our experiment, especially in the energy restriction group. The energy restric-
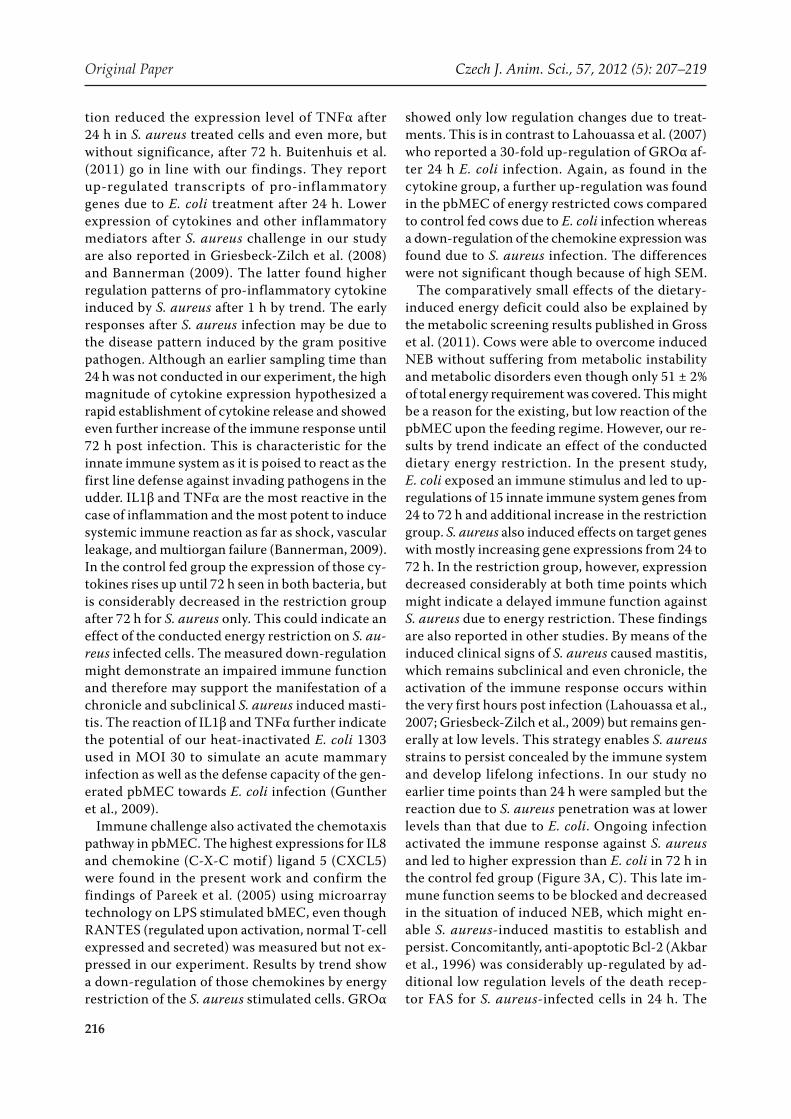
216
Original Paper Czech J. Anim. Sci., 57, 2012 (5): 207–219
tion reduced the expression level of TNFα after 24 h in S. aureus treated cells and even more, but without significance, after 72 h. Buitenhuis et al. (2011) go in line with our findings. They report up-regulated transcripts of pro-inflammatory genes due to E. coli treatment after 24 h. Lower expression of cytokines and other inflammatory mediators after S. aureus challenge in our study are also reported in Griesbeck-Zilch et al. (2008) and Bannerman (2009). The latter found higher regulation patterns of pro-inflammatory cytokine induced by S. aureus after 1 h by trend. The early responses after S. aureus infection may be due to the disease pattern induced by the gram positive pathogen. Although an earlier sampling time than 24 h was not conducted in our experiment, the high magnitude of cytokine expression hypothesized a rapid establishment of cytokine release and showed even further increase of the immune response until 72 h post infection. This is characteristic for the innate immune system as it is poised to react as the first line defense against invading pathogens in the udder. IL1β and TNFα are the most reactive in the case of inflammation and the most potent to induce systemic immune reaction as far as shock, vascular leakage, and multiorgan failure (Bannerman, 2009). In the control fed group the expression of those cy-tokines rises up until 72 h seen in both bacteria, but is considerably decreased in the restriction group after 72 h for S. aureus only. This could indicate an effect of the conducted energy restriction on S. au-reus infected cells. The measured down-regulation might demonstrate an impaired immune function and therefore may support the manifestation of a chronicle and subclinical S. aureus induced masti-tis. The reaction of IL1β and TNFα further indicate the potential of our heat-inactivated E. coli 1303 used in MOI 30 to simulate an acute mammary infection as well as the defense capacity of the gen-erated pbMEC towards E. coli infection (Gunther et al., 2009).
Immune challenge also activated the chemotaxis pathway in pbMEC. The highest expressions for IL8 and chemokine (C-X-C motif ) ligand 5 (CXCL5) were found in the present work and confirm the findings of Pareek et al. (2005) using microarray technology on LPS stimulated bMEC, even though RANTES (regulated upon activation, normal T-cell expressed and secreted) was measured but not ex-pressed in our experiment. Results by trend show a down-regulation of those chemokines by energy restriction of the S. aureus stimulated cells. GROα
showed only low regulation changes due to treat-ments. This is in contrast to Lahouassa et al. (2007) who reported a 30-fold up-regulation of GROα af-ter 24 h E. coli infection. Again, as found in the cytokine group, a further up-regulation was found in the pbMEC of energy restricted cows compared to control fed cows due to E. coli infection whereas a down-regulation of the chemokine expression was found due to S. aureus infection. The differences were not significant though because of high SEM.
The comparatively small effects of the dietary-induced energy deficit could also be explained by the metabolic screening results published in Gross et al. (2011). Cows were able to overcome induced NEB without suffering from metabolic instability and metabolic disorders even though only 51 ± 2% of total energy requirement was covered. This might be a reason for the existing, but low reaction of the pbMEC upon the feeding regime. However, our re-sults by trend indicate an effect of the conducted dietary energy restriction. In the present study, E. coli exposed an immune stimulus and led to up-regulations of 15 innate immune system genes from 24 to 72 h and additional increase in the restriction group. S. aureus also induced effects on target genes with mostly increasing gene expressions from 24 to 72 h. In the restriction group, however, expression decreased considerably at both time points which might indicate a delayed immune function against S. aureus due to energy restriction. These findings are also reported in other studies. By means of the induced clinical signs of S. aureus caused mastitis, which remains subclinical and even chronicle, the activation of the immune response occurs within the very first hours post infection (Lahouassa et al., 2007; Griesbeck-Zilch et al., 2009) but remains gen-erally at low levels. This strategy enables S. aureus strains to persist concealed by the immune system and develop lifelong infections. In our study no earlier time points than 24 h were sampled but the reaction due to S. aureus penetration was at lower levels than that due to E. coli. Ongoing infection activated the immune response against S. aureus and led to higher expression than E. coli in 72 h in the control fed group (Figure 3A, C). This late im-mune function seems to be blocked and decreased in the situation of induced NEB, which might en-able S. aureus-induced mastitis to establish and persist. Concomitantly, anti-apoptotic Bcl-2 (Akbar et al., 1996) was considerably up-regulated by ad-ditional low regulation levels of the death recep-tor FAS for S. aureus-infected cells in 24 h. The
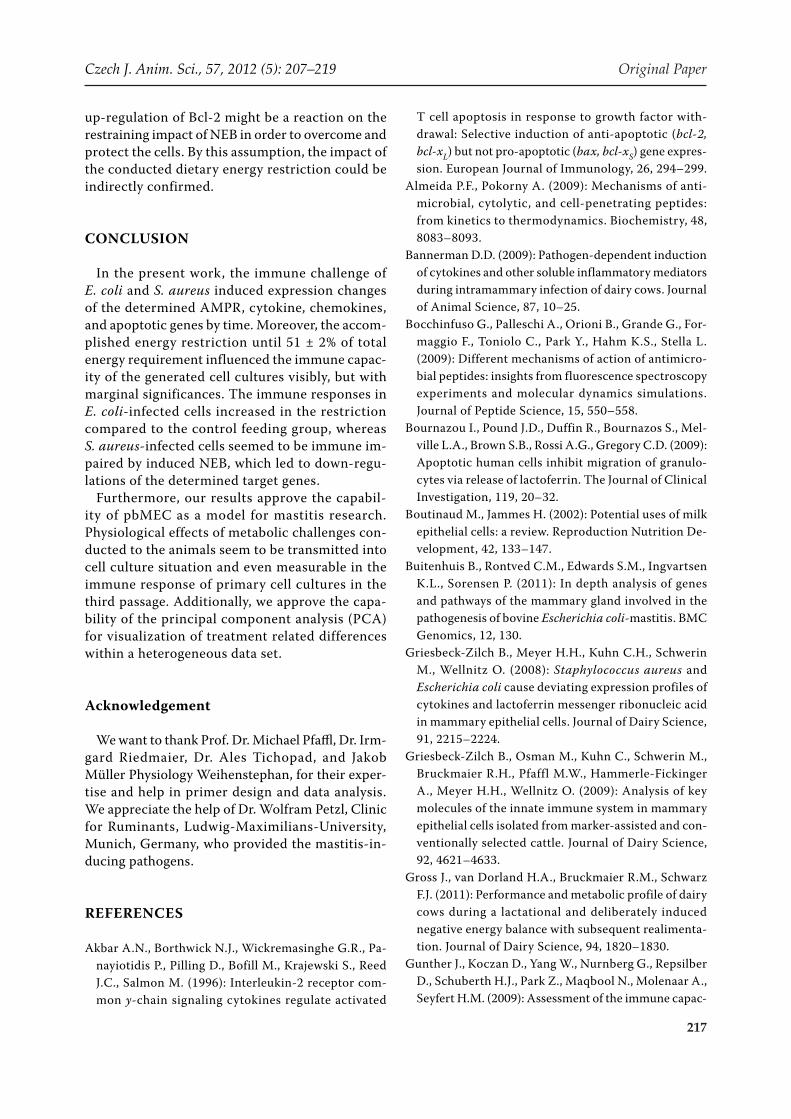
217
Czech J. Anim. Sci., 57, 2012 (5): 207–219 Original Paper
up-regulation of Bcl-2 might be a reaction on the restraining impact of NEB in order to overcome and protect the cells. By this assumption, the impact of the conducted dietary energy restriction could be indirectly confirmed.
CONCLUSION
In the present work, the immune challenge of E. coli and S. aureus induced expression changes of the determined AMPR, cytokine, chemokines, and apoptotic genes by time. Moreover, the accom-plished energy restriction until 51 ± 2% of total energy requirement influenced the immune capac-ity of the generated cell cultures visibly, but with marginal significances. The immune responses in E. coli-infected cells increased in the restriction compared to the control feeding group, whereas S. aureus-infected cells seemed to be immune im-paired by induced NEB, which led to down-regu-lations of the determined target genes.
Furthermore, our results approve the capabil-ity of pbMEC as a model for mastitis research. Physiological effects of metabolic challenges con-ducted to the animals seem to be transmitted into cell culture situation and even measurable in the immune response of primary cell cultures in the third passage. Additionally, we approve the capa-bility of the principal component analysis (PCA) for visualization of treatment related differences within a heterogeneous data set.
Acknowledgement
We want to thank Prof. Dr. Michael Pfaffl, Dr. Irm- gard Riedmaier, Dr. Ales Tichopad, and Jakob Müller Physiology Weihenstephan, for their exper-tise and help in primer design and data analysis. We appreciate the help of Dr. Wolfram Petzl, Clinic for Ruminants, Ludwig-Maximilians-University, Munich, Germany, who provided the mastitis-in-ducing pathogens.
REFERENCES
Akbar A.N., Borthwick N.J., Wickremasinghe G.R., Pa-nayiotidis P., Pilling D., Bofill M., Krajewski S., Reed J.C., Salmon M. (1996): Interleukin-2 receptor com-mon y-chain signaling cytokines regulate activated
T cell apoptosis in response to growth factor with-drawal: Selective induction of anti-apoptotic (bcl-2, bcl-xL) but not pro-apoptotic (bax, bcl-xS) gene expres-sion. European Journal of Immunology, 26, 294–299.
Almeida P.F., Pokorny A. (2009): Mechanisms of anti-microbial, cytolytic, and cell-penetrating peptides: from kinetics to thermodynamics. Biochemistry, 48, 8083–8093.
Bannerman D.D. (2009): Pathogen-dependent induction of cytokines and other soluble inflammatory mediators during intramammary infection of dairy cows. Journal of Animal Science, 87, 10–25.
Bocchinfuso G., Palleschi A., Orioni B., Grande G., For-maggio F., Toniolo C., Park Y., Hahm K.S., Stella L. (2009): Different mechanisms of action of antimicro-bial peptides: insights from fluorescence spectroscopy experiments and molecular dynamics simulations. Journal of Peptide Science, 15, 550–558.
Bournazou I., Pound J.D., Duffin R., Bournazos S., Mel-ville L.A., Brown S.B., Rossi A.G., Gregory C.D. (2009): Apoptotic human cells inhibit migration of granulo-cytes via release of lactoferrin. The Journal of Clinical Investigation, 119, 20–32.
Boutinaud M., Jammes H. (2002): Potential uses of milk epithelial cells: a review. Reproduction Nutrition De-velopment, 42, 133–147.
Buitenhuis B., Rontved C.M., Edwards S.M., Ingvartsen K.L., Sorensen P. (2011): In depth analysis of genes and pathways of the mammary gland involved in the pathogenesis of bovine Escherichia coli-mastitis. BMC Genomics, 12, 130.
Griesbeck-Zilch B., Meyer H.H., Kuhn C.H., Schwerin M., Wellnitz O. (2008): Staphylococcus aureus and Escherichia coli cause deviating expression profiles of cytokines and lactoferrin messenger ribonucleic acid in mammary epithelial cells. Journal of Dairy Science, 91, 2215–2224.
Griesbeck-Zilch B., Osman M., Kuhn C., Schwerin M., Bruckmaier R.H., Pfaffl M.W., Hammerle-Fickinger A., Meyer H.H., Wellnitz O. (2009): Analysis of key molecules of the innate immune system in mammary epithelial cells isolated from marker-assisted and con-ventionally selected cattle. Journal of Dairy Science, 92, 4621–4633.
Gross J., van Dorland H.A., Bruckmaier R.M., Schwarz F.J. (2011): Performance and metabolic profile of dairy cows during a lactational and deliberately induced negative energy balance with subsequent realimenta-tion. Journal of Dairy Science, 94, 1820–1830.
Gunther J., Koczan D., Yang W., Nurnberg G., Repsilber D., Schuberth H.J., Park Z., Maqbool N., Molenaar A., Seyfert H.M. (2009): Assessment of the immune capac-
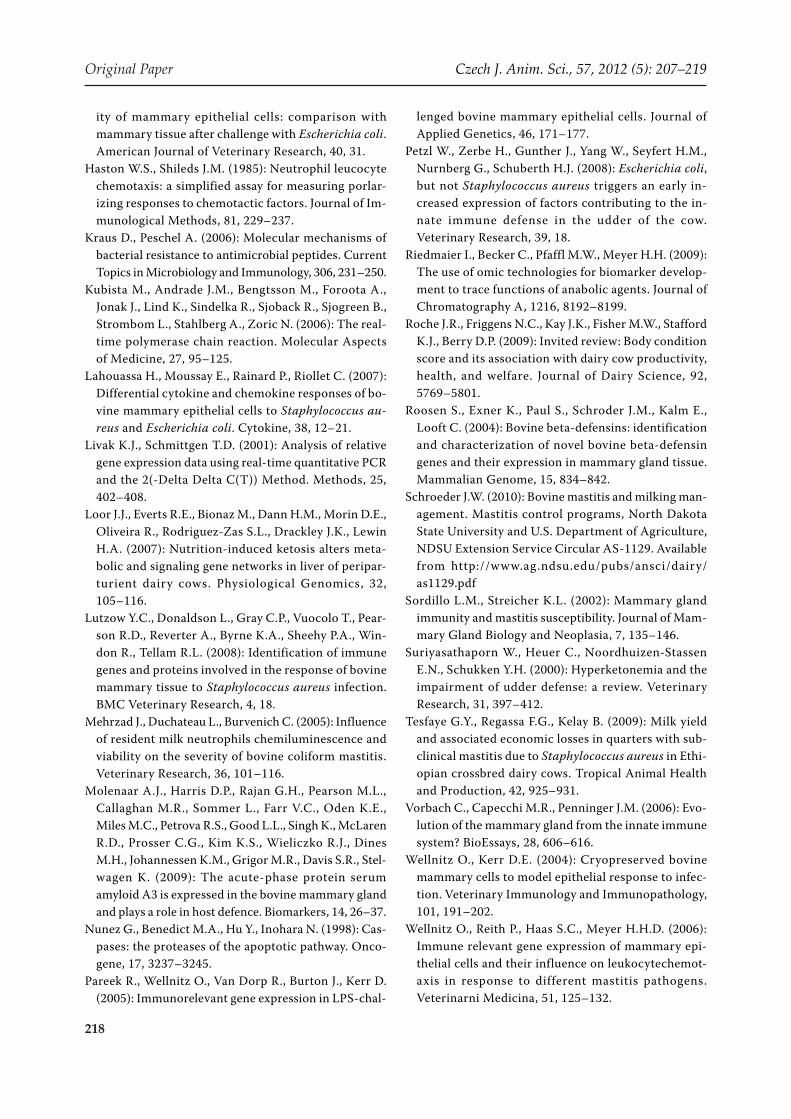
218
Original Paper Czech J. Anim. Sci., 57, 2012 (5): 207–219
ity of mammary epithelial cells: comparison with mammary tissue after challenge with Escherichia coli. American Journal of Veterinary Research, 40, 31.
Haston W.S., Shileds J.M. (1985): Neutrophil leucocyte chemotaxis: a simplified assay for measuring porlar-izing responses to chemotactic factors. Journal of Im-munological Methods, 81, 229–237.
Kraus D., Peschel A. (2006): Molecular mechanisms of bacterial resistance to antimicrobial peptides. Current Topics in Microbiology and Immunology, 306, 231–250.
Kubista M., Andrade J.M., Bengtsson M., Foroota A., Jonak J., Lind K., Sindelka R., Sjoback R., Sjogreen B., Strombom L., Stahlberg A., Zoric N. (2006): The real-time polymerase chain reaction. Molecular Aspects of Medicine, 27, 95–125.
Lahouassa H., Moussay E., Rainard P., Riollet C. (2007): Differential cytokine and chemokine responses of bo-vine mammary epithelial cells to Staphylococcus au-reus and Escherichia coli. Cytokine, 38, 12–21.
Livak K.J., Schmittgen T.D. (2001): Analysis of relative gene expression data using real-time quantitative PCR and the 2(-Delta Delta C(T)) Method. Methods, 25, 402–408.
Loor J.J., Everts R.E., Bionaz M., Dann H.M., Morin D.E., Oliveira R., Rodriguez-Zas S.L., Drackley J.K., Lewin H.A. (2007): Nutrition-induced ketosis alters meta-bolic and signaling gene networks in liver of peripar-turient dairy cows. Physiological Genomics, 32, 105–116.
Lutzow Y.C., Donaldson L., Gray C.P., Vuocolo T., Pear-son R.D., Reverter A., Byrne K.A., Sheehy P.A., Win-don R., Tellam R.L. (2008): Identification of immune genes and proteins involved in the response of bovine mammary tissue to Staphylococcus aureus infection. BMC Veterinary Research, 4, 18.
Mehrzad J., Duchateau L., Burvenich C. (2005): Influence of resident milk neutrophils chemiluminescence and viability on the severity of bovine coliform mastitis. Veterinary Research, 36, 101–116.
Molenaar A.J., Harris D.P., Rajan G.H., Pearson M.L., Callaghan M.R., Sommer L., Farr V.C., Oden K.E., Miles M.C., Petrova R.S., Good L.L., Singh K., McLaren R.D., Prosser C.G., Kim K.S., Wieliczko R.J., Dines M.H., Johannessen K.M., Grigor M.R., Davis S.R., Stel-wagen K. (2009): The acute-phase protein serum amyloid A3 is expressed in the bovine mammary gland and plays a role in host defence. Biomarkers, 14, 26–37.
Nunez G., Benedict M.A., Hu Y., Inohara N. (1998): Cas-pases: the proteases of the apoptotic pathway. Onco-gene, 17, 3237–3245.
Pareek R., Wellnitz O., Van Dorp R., Burton J., Kerr D. (2005): Immunorelevant gene expression in LPS-chal-
lenged bovine mammary epithelial cells. Journal of Applied Genetics, 46, 171–177.
Petzl W., Zerbe H., Gunther J., Yang W., Seyfert H.M., Nurnberg G., Schuberth H.J. (2008): Escherichia coli, but not Staphylococcus aureus triggers an early in-creased expression of factors contributing to the in-nate immune defense in the udder of the cow. Veterinary Research, 39, 18.
Riedmaier I., Becker C., Pfaffl M.W., Meyer H.H. (2009): The use of omic technologies for biomarker develop-ment to trace functions of anabolic agents. Journal of Chromatography A, 1216, 8192–8199.
Roche J.R., Friggens N.C., Kay J.K., Fisher M.W., Stafford K.J., Berry D.P. (2009): Invited review: Body condition score and its association with dairy cow productivity, health, and welfare. Journal of Dairy Science, 92, 5769–5801.
Roosen S., Exner K., Paul S., Schroder J.M., Kalm E., Looft C. (2004): Bovine beta-defensins: identification and characterization of novel bovine beta-defensin genes and their expression in mammary gland tissue. Mammalian Genome, 15, 834–842.
Schroeder J.W. (2010): Bovine mastitis and milking man-agement. Mastitis control programs, North Dakota State University and U.S. Department of Agriculture, NDSU Extension Service Circular AS-1129. Available from http://www.ag.ndsu.edu/pubs/ansci/dairy/as1129.pdf
Sordillo L.M., Streicher K.L. (2002): Mammary gland immunity and mastitis susceptibility. Journal of Mam-mary Gland Biology and Neoplasia, 7, 135–146.
Suriyasathaporn W., Heuer C., Noordhuizen-Stassen E.N., Schukken Y.H. (2000): Hyperketonemia and the impairment of udder defense: a review. Veterinary Research, 31, 397–412.
Tesfaye G.Y., Regassa F.G., Kelay B. (2009): Milk yield and associated economic losses in quarters with sub-clinical mastitis due to Staphylococcus aureus in Ethi-opian crossbred dairy cows. Tropical Animal Health and Production, 42, 925–931.
Vorbach C., Capecchi M.R., Penninger J.M. (2006): Evo-lution of the mammary gland from the innate immune system? BioEssays, 28, 606–616.
Wellnitz O., Kerr D.E. (2004): Cryopreserved bovine mammary cells to model epithelial response to infec-tion. Veterinary Immunology and Immunopathology, 101, 191–202.
Wellnitz O., Reith P., Haas S.C., Meyer H.H.D. (2006): Immune relevant gene expression of mammary epi-thelial cells and their influence on leukocytechemot-axis in response to different mastitis pathogens. Veterinarni Medicina, 51, 125–132.
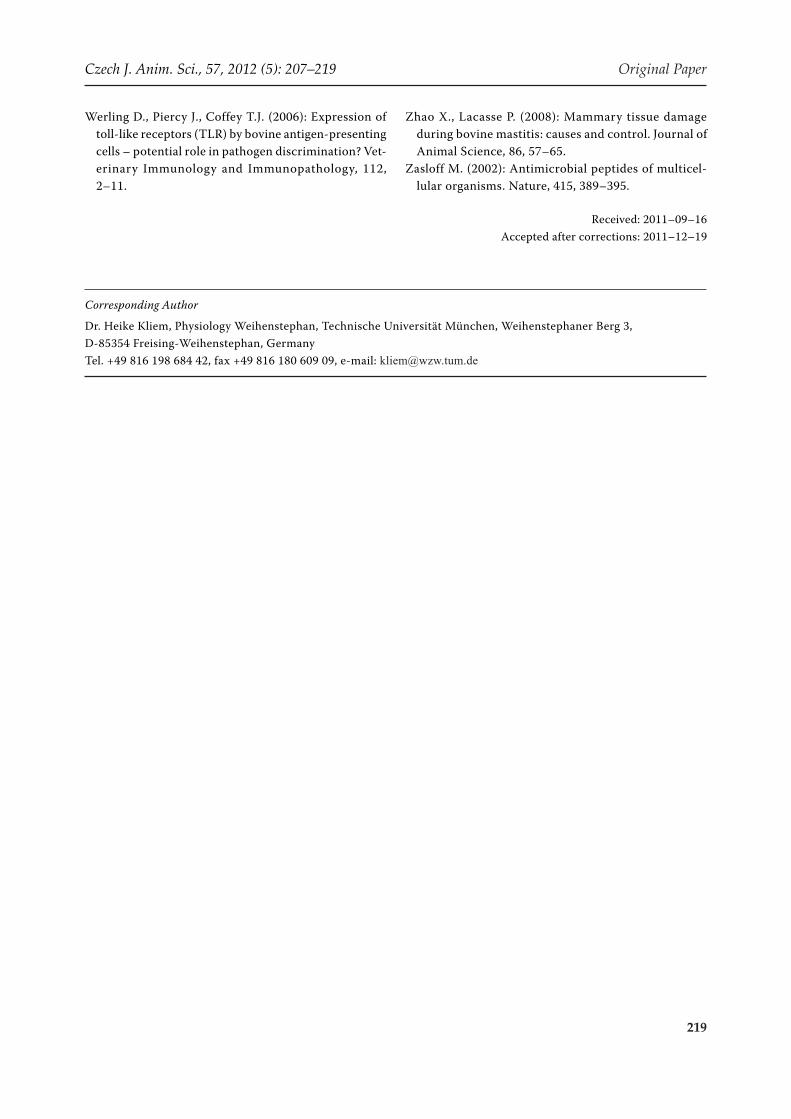
219
Czech J. Anim. Sci., 57, 2012 (5): 207–219 Original Paper
Corresponding Author
Dr. Heike Kliem, Physiology Weihenstephan, Technische Universität München, Weihenstephaner Berg 3, D-85354 Freising-Weihenstephan, GermanyTel. +49 816 198 684 42, fax +49 816 180 609 09, e-mail: [email protected]
Werling D., Piercy J., Coffey T.J. (2006): Expression of toll-like receptors (TLR) by bovine antigen-presenting cells – potential role in pathogen discrimination? Vet-erinary Immunology and Immunopathology, 112, 2–11.
Zhao X., Lacasse P. (2008): Mammary tissue damage during bovine mastitis: causes and control. Journal of Animal Science, 86, 57–65.
Zasloff M. (2002): Antimicrobial peptides of multicel-lular organisms. Nature, 415, 389–395.
Received: 2011–09–16Accepted after corrections: 2011–12–19

Animal (2013), 7:5, pp 799–805 & The Animal Consortium 2012doi:10.1017/S1751731112002315
animal
Microfluidic high-throughput RT-qPCR measurements of theimmune response of primary bovine mammary epithelial cellscultured from milk to mastitis pathogens
D. Sorg1,2, K. Danowski1,2, V. Korenkova3, V. Rusnakova3, R. Kuffner4, R. Zimmer4,H. H. D. Meyer1,2* and H. Kliem1,2-
1Physiology Weihenstephan, Technische Universitat Munchen, Weihenstephaner Berg 3, 85354 Freising, Germany; 2ZIEL – Research Center for Life and FoodSciences, Weihenstephaner Berg 1, 85350 Freising, Germany; 3Laboratory of Gene Expression, Institute of Biotechnology, Academy of Sciences of the CzechRepublic, 14220 Prague, Czech Republic; 4Institute for Bioinformatics, Ludwigs-Maximilians-Universitat Munchen, Amalienstraße 17, 80333 Munchen, Germany
(Received 16 May 2012; Accepted 1 October 2012; First published online 11 December 2012)
Bovine mastitis, the inflammation of the udder, is a major problem for the dairy industry and for the welfare of the animals.To better understand this disease, and to implement two special techniques for studying mammary gland immunity in vitro,we measured the innate immune response of primary bovine mammary epithelial cells (pbMEC) from six Brown Swiss cowsafter stimulation with the heat-inactivated mastitis pathogens, Escherichia coli 1303 and Staphylococcus aureus 1027. The cellswere extracted and cultivated from milk instead of udder tissue, which is usually done. The advantages of this technique arenon-invasiveness and less contamination by fibroblasts. For the first time, pbMEC gene expression (GE) was measured with amicrofluidic high-throughput real-time reverse transcription-quantitative PCR platform, the BioMark HDTM system from Fluidigm.In addition to the physiological analysis, the precision and suitability of this method was evaluated in a large data set. The meancoefficient of variance (6 s.e.) between repeated chips was 4.3 6 0.4% for highly expressed and 3.3 6 0.4% for lowly expressedgenes. Quantitative PCR (qPCR) replicate deviations were smaller than the cell culture replicate deviations, indicating thatbiological and cell culture differences could be distinguished from the background noise. Twenty-two genes (complement system,chemokines, inflammatory cytokines, antimicrobial peptides, acute phase response and toll-like receptor signalling) weredifferentially expressed (P , 0.05) with E. coli. The most upregulated gene was the acute phase protein serum amyloid A3 with618-time fold. S. aureus slightly induced CCL5, IL10, TLR4 and S100A12 expression and failed to elicit a distinct overall innateimmune response. We showed that, with this milk-derived pbMEC culture and the high-throughput qPCR technique, it is possibleto obtain similar results in pbMEC expression as with conventional PCR and with satisfactory precision so that it can be appliedin future GE studies in pbMEC.
Keywords: bovine mastitis, gene expression profiling, microfluidic qPCR, primary bovine mammary epithelial cells, innate immune response
Implications
We show that a time- and cost-efficient high-throughputquantitative PCR (qPCR) system, applied on primary bovinemammary epithelial cells (pbMEC) cultured from milk, is aconvenient alternative to the two major standard proceduresin measuring gene expression. We obtained similar results asstudies with pbMEC from udder tissue and measurementson DNA microarrays or conventional qPCR. We suggestthat the milk-derived pbMEC culture and the microfluidic
high-throughput qPCR system could be applied in futureexperiments with pbMEC.
Introduction
Bovine mastitis, the inflammation of udder tissue, is one ofthe most frequent and most costly diseases in dairy cows.Bacteria are by far the most common cause of mastitis.Escherichia coli induces predominantly acute and severe mas-titis, whereas Staphylococcus aureus often leads to mild andchronic mastitis (Petzl et al., 2008). In order to better under-stand this disease, primary bovine mammary epithelial cells(pbMEC) have been intensively studied in vitro. They synthesize
* Prof. Dr. H. H. D. Meyer, who supervised this research, died before publicationof this work.- E-mail: [email protected]
799
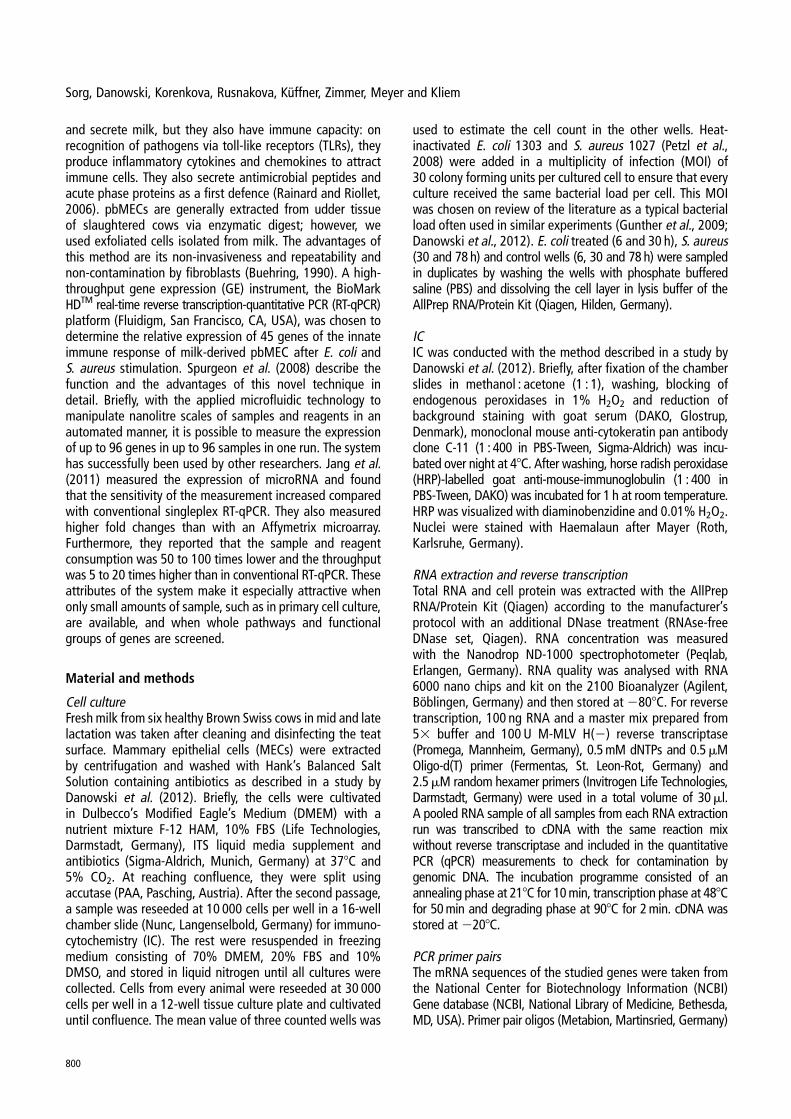
and secrete milk, but they also have immune capacity: onrecognition of pathogens via toll-like receptors (TLRs), theyproduce inflammatory cytokines and chemokines to attractimmune cells. They also secrete antimicrobial peptides andacute phase proteins as a first defence (Rainard and Riollet,2006). pbMECs are generally extracted from udder tissueof slaughtered cows via enzymatic digest; however, weused exfoliated cells isolated from milk. The advantages ofthis method are its non-invasiveness and repeatability andnon-contamination by fibroblasts (Buehring, 1990). A high-throughput gene expression (GE) instrument, the BioMarkHDTM real-time reverse transcription-quantitative PCR (RT-qPCR)platform (Fluidigm, San Francisco, CA, USA), was chosen todetermine the relative expression of 45 genes of the innateimmune response of milk-derived pbMEC after E. coli andS. aureus stimulation. Spurgeon et al. (2008) describe thefunction and the advantages of this novel technique indetail. Briefly, with the applied microfluidic technology tomanipulate nanolitre scales of samples and reagents in anautomated manner, it is possible to measure the expressionof up to 96 genes in up to 96 samples in one run. The systemhas successfully been used by other researchers. Jang et al.(2011) measured the expression of microRNA and foundthat the sensitivity of the measurement increased comparedwith conventional singleplex RT-qPCR. They also measuredhigher fold changes than with an Affymetrix microarray.Furthermore, they reported that the sample and reagentconsumption was 50 to 100 times lower and the throughputwas 5 to 20 times higher than in conventional RT-qPCR. Theseattributes of the system make it especially attractive whenonly small amounts of sample, such as in primary cell culture,are available, and when whole pathways and functionalgroups of genes are screened.
Material and methods
Cell cultureFresh milk from six healthy Brown Swiss cows in mid and latelactation was taken after cleaning and disinfecting the teatsurface. Mammary epithelial cells (MECs) were extractedby centrifugation and washed with Hank’s Balanced SaltSolution containing antibiotics as described in a study byDanowski et al. (2012). Briefly, the cells were cultivatedin Dulbecco’s Modified Eagle’s Medium (DMEM) with anutrient mixture F-12 HAM, 10% FBS (Life Technologies,Darmstadt, Germany), ITS liquid media supplement andantibiotics (Sigma-Aldrich, Munich, Germany) at 378C and5% CO2. At reaching confluence, they were split usingaccutase (PAA, Pasching, Austria). After the second passage,a sample was reseeded at 10 000 cells per well in a 16-wellchamber slide (Nunc, Langenselbold, Germany) for immuno-cytochemistry (IC). The rest were resuspended in freezingmedium consisting of 70% DMEM, 20% FBS and 10%DMSO, and stored in liquid nitrogen until all cultures werecollected. Cells from every animal were reseeded at 30 000cells per well in a 12-well tissue culture plate and cultivateduntil confluence. The mean value of three counted wells was
used to estimate the cell count in the other wells. Heat-inactivated E. coli 1303 and S. aureus 1027 (Petzl et al.,2008) were added in a multiplicity of infection (MOI) of30 colony forming units per cultured cell to ensure that everyculture received the same bacterial load per cell. This MOIwas chosen on review of the literature as a typical bacterialload often used in similar experiments (Gunther et al., 2009;Danowski et al., 2012). E. coli treated (6 and 30 h), S. aureus(30 and 78 h) and control wells (6, 30 and 78 h) were sampledin duplicates by washing the wells with phosphate bufferedsaline (PBS) and dissolving the cell layer in lysis buffer of theAllPrep RNA/Protein Kit (Qiagen, Hilden, Germany).
ICIC was conducted with the method described in a study byDanowski et al. (2012). Briefly, after fixation of the chamberslides in methanol : acetone (1 : 1), washing, blocking ofendogenous peroxidases in 1% H2O2 and reduction ofbackground staining with goat serum (DAKO, Glostrup,Denmark), monoclonal mouse anti-cytokeratin pan antibodyclone C-11 (1 : 400 in PBS-Tween, Sigma-Aldrich) was incu-bated over night at 48C. After washing, horse radish peroxidase(HRP)-labelled goat anti-mouse-immunoglobulin (1 : 400 inPBS-Tween, DAKO) was incubated for 1 h at room temperature.HRP was visualized with diaminobenzidine and 0.01% H2O2.Nuclei were stained with Haemalaun after Mayer (Roth,Karlsruhe, Germany).
RNA extraction and reverse transcriptionTotal RNA and cell protein was extracted with the AllPrepRNA/Protein Kit (Qiagen) according to the manufacturer’sprotocol with an additional DNase treatment (RNAse-freeDNase set, Qiagen). RNA concentration was measuredwith the Nanodrop ND-1000 spectrophotometer (Peqlab,Erlangen, Germany). RNA quality was analysed with RNA6000 nano chips and kit on the 2100 Bioanalyzer (Agilent,Boblingen, Germany) and then stored at 2808C. For reversetranscription, 100 ng RNA and a master mix prepared from53 buffer and 100 U M-MLV H(2) reverse transcriptase(Promega, Mannheim, Germany), 0.5 mM dNTPs and 0.5 mMOligo-d(T) primer (Fermentas, St. Leon-Rot, Germany) and2.5 mM random hexamer primers (Invitrogen Life Technologies,Darmstadt, Germany) were used in a total volume of 30 ml.A pooled RNA sample of all samples from each RNA extractionrun was transcribed to cDNA with the same reaction mixwithout reverse transcriptase and included in the quantitativePCR (qPCR) measurements to check for contamination bygenomic DNA. The incubation programme consisted of anannealing phase at 218C for 10 min, transcription phase at 488Cfor 50 min and degrading phase at 908C for 2 min. cDNA wasstored at 2208C.
PCR primer pairsThe mRNA sequences of the studied genes were taken fromthe National Center for Biotechnology Information (NCBI)Gene database (NCBI, National Library of Medicine, Bethesda,MD, USA). Primer pair oligos (Metabion, Martinsried, Germany)
Sorg, Danowski, Korenkova, Rusnakova, Kuffner, Zimmer, Meyer and Kliem
800
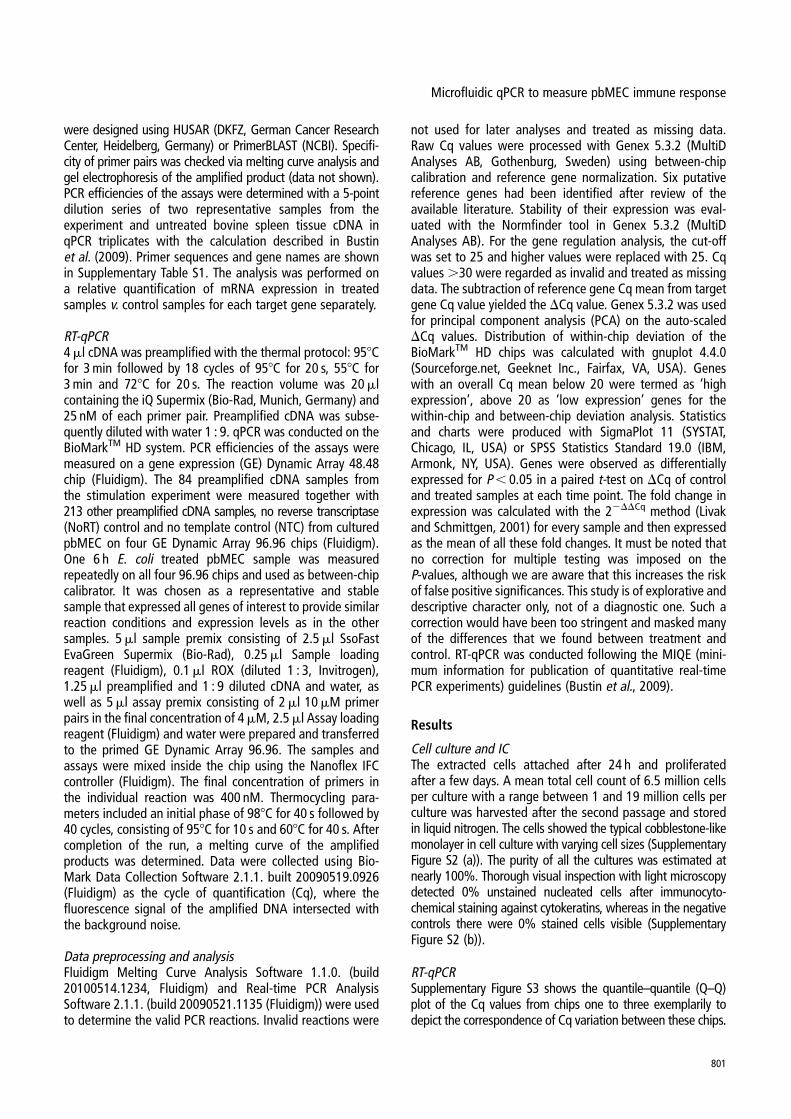
were designed using HUSAR (DKFZ, German Cancer ResearchCenter, Heidelberg, Germany) or PrimerBLAST (NCBI). Specifi-city of primer pairs was checked via melting curve analysis andgel electrophoresis of the amplified product (data not shown).PCR efficiencies of the assays were determined with a 5-pointdilution series of two representative samples from theexperiment and untreated bovine spleen tissue cDNA inqPCR triplicates with the calculation described in Bustinet al. (2009). Primer sequences and gene names are shownin Supplementary Table S1. The analysis was performed ona relative quantification of mRNA expression in treatedsamples v. control samples for each target gene separately.
RT-qPCR4 ml cDNA was preamplified with the thermal protocol: 958Cfor 3 min followed by 18 cycles of 958C for 20 s, 558C for3 min and 728C for 20 s. The reaction volume was 20 mlcontaining the iQ Supermix (Bio-Rad, Munich, Germany) and25 nM of each primer pair. Preamplified cDNA was subse-quently diluted with water 1 : 9. qPCR was conducted on theBioMarkTM HD system. PCR efficiencies of the assays weremeasured on a gene expression (GE) Dynamic Array 48.48chip (Fluidigm). The 84 preamplified cDNA samples fromthe stimulation experiment were measured together with213 other preamplified cDNA samples, no reverse transcriptase(NoRT) control and no template control (NTC) from culturedpbMEC on four GE Dynamic Array 96.96 chips (Fluidigm).One 6 h E. coli treated pbMEC sample was measuredrepeatedly on all four 96.96 chips and used as between-chipcalibrator. It was chosen as a representative and stablesample that expressed all genes of interest to provide similarreaction conditions and expression levels as in the othersamples. 5 ml sample premix consisting of 2.5 ml SsoFastEvaGreen Supermix (Bio-Rad), 0.25 ml Sample loadingreagent (Fluidigm), 0.1 ml ROX (diluted 1 : 3, Invitrogen),1.25 ml preamplified and 1 : 9 diluted cDNA and water, aswell as 5 ml assay premix consisting of 2 ml 10 mM primerpairs in the final concentration of 4 mM, 2.5 ml Assay loadingreagent (Fluidigm) and water were prepared and transferredto the primed GE Dynamic Array 96.96. The samples andassays were mixed inside the chip using the Nanoflex IFCcontroller (Fluidigm). The final concentration of primers inthe individual reaction was 400 nM. Thermocycling para-meters included an initial phase of 988C for 40 s followed by40 cycles, consisting of 958C for 10 s and 608C for 40 s. Aftercompletion of the run, a melting curve of the amplifiedproducts was determined. Data were collected using Bio-Mark Data Collection Software 2.1.1. built 20090519.0926(Fluidigm) as the cycle of quantification (Cq), where thefluorescence signal of the amplified DNA intersected withthe background noise.
Data preprocessing and analysisFluidigm Melting Curve Analysis Software 1.1.0. (build20100514.1234, Fluidigm) and Real-time PCR AnalysisSoftware 2.1.1. (build 20090521.1135 (Fluidigm)) were usedto determine the valid PCR reactions. Invalid reactions were
not used for later analyses and treated as missing data.Raw Cq values were processed with Genex 5.3.2 (MultiDAnalyses AB, Gothenburg, Sweden) using between-chipcalibration and reference gene normalization. Six putativereference genes had been identified after review of theavailable literature. Stability of their expression was eval-uated with the Normfinder tool in Genex 5.3.2 (MultiDAnalyses AB). For the gene regulation analysis, the cut-offwas set to 25 and higher values were replaced with 25. Cqvalues .30 were regarded as invalid and treated as missingdata. The subtraction of reference gene Cq mean from targetgene Cq value yielded the DCq value. Genex 5.3.2 was usedfor principal component analysis (PCA) on the auto-scaledDCq values. Distribution of within-chip deviation of theBioMarkTM HD chips was calculated with gnuplot 4.4.0(Sourceforge.net, Geeknet Inc., Fairfax, VA, USA). Geneswith an overall Cq mean below 20 were termed as ‘highexpression’, above 20 as ‘low expression’ genes for thewithin-chip and between-chip deviation analysis. Statisticsand charts were produced with SigmaPlot 11 (SYSTAT,Chicago, IL, USA) or SPSS Statistics Standard 19.0 (IBM,Armonk, NY, USA). Genes were observed as differentiallyexpressed for P , 0.05 in a paired t-test on DCq of controland treated samples at each time point. The fold change inexpression was calculated with the 22DDCq method (Livakand Schmittgen, 2001) for every sample and then expressedas the mean of all these fold changes. It must be noted thatno correction for multiple testing was imposed on theP-values, although we are aware that this increases the riskof false positive significances. This study is of explorative anddescriptive character only, not of a diagnostic one. Such acorrection would have been too stringent and masked manyof the differences that we found between treatment andcontrol. RT-qPCR was conducted following the MIQE (mini-mum information for publication of quantitative real-timePCR experiments) guidelines (Bustin et al., 2009).
Results
Cell culture and ICThe extracted cells attached after 24 h and proliferatedafter a few days. A mean total cell count of 6.5 million cellsper culture with a range between 1 and 19 million cells perculture was harvested after the second passage and storedin liquid nitrogen. The cells showed the typical cobblestone-likemonolayer in cell culture with varying cell sizes (SupplementaryFigure S2 (a)). The purity of all the cultures was estimated atnearly 100%. Thorough visual inspection with light microscopydetected 0% unstained nucleated cells after immunocyto-chemical staining against cytokeratins, whereas in the negativecontrols there were 0% stained cells visible (SupplementaryFigure S2 (b)).
RT-qPCRSupplementary Figure S3 shows the quantile–quantile (Q–Q)plot of the Cq values from chips one to three exemplarily todepict the correspondence of Cq variation between these chips.
Microfluidic qPCR to measure pbMEC immune response
801
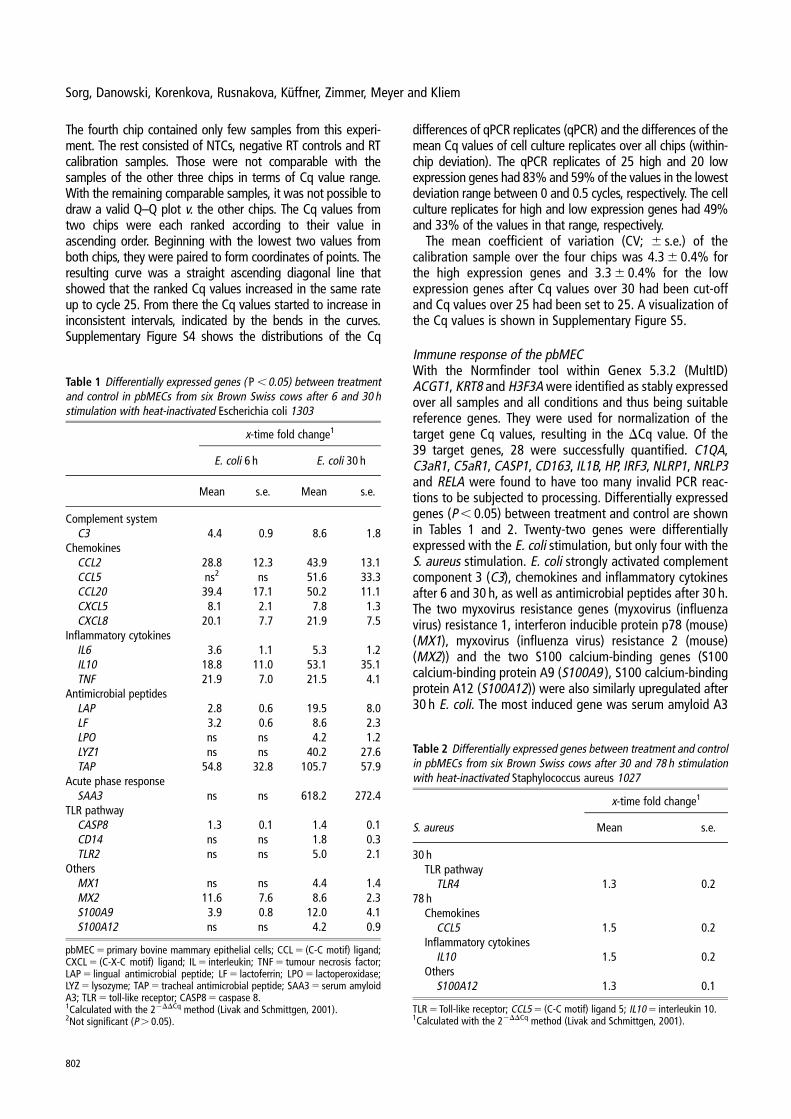
The fourth chip contained only few samples from this experi-ment. The rest consisted of NTCs, negative RT controls and RTcalibration samples. Those were not comparable with thesamples of the other three chips in terms of Cq value range.With the remaining comparable samples, it was not possible todraw a valid Q–Q plot v. the other chips. The Cq values fromtwo chips were each ranked according to their value inascending order. Beginning with the lowest two values fromboth chips, they were paired to form coordinates of points. Theresulting curve was a straight ascending diagonal line thatshowed that the ranked Cq values increased in the same rateup to cycle 25. From there the Cq values started to increase ininconsistent intervals, indicated by the bends in the curves.Supplementary Figure S4 shows the distributions of the Cq
differences of qPCR replicates (qPCR) and the differences of themean Cq values of cell culture replicates over all chips (within-chip deviation). The qPCR replicates of 25 high and 20 lowexpression genes had 83% and 59% of the values in the lowestdeviation range between 0 and 0.5 cycles, respectively. The cellculture replicates for high and low expression genes had 49%and 33% of the values in that range, respectively.
The mean coefficient of variation (CV; 6 s.e.) of thecalibration sample over the four chips was 4.3 6 0.4% forthe high expression genes and 3.3 6 0.4% for the lowexpression genes after Cq values over 30 had been cut-offand Cq values over 25 had been set to 25. A visualization ofthe Cq values is shown in Supplementary Figure S5.
Immune response of the pbMECWith the Normfinder tool within Genex 5.3.2 (MultID)ACGT1, KRT8 and H3F3A were identified as stably expressedover all samples and all conditions and thus being suitablereference genes. They were used for normalization of thetarget gene Cq values, resulting in the DCq value. Of the39 target genes, 28 were successfully quantified. C1QA,C3aR1, C5aR1, CASP1, CD163, IL1B, HP, IRF3, NLRP1, NRLP3and RELA were found to have too many invalid PCR reac-tions to be subjected to processing. Differentially expressedgenes (P , 0.05) between treatment and control are shownin Tables 1 and 2. Twenty-two genes were differentiallyexpressed with the E. coli stimulation, but only four with theS. aureus stimulation. E. coli strongly activated complementcomponent 3 (C3), chemokines and inflammatory cytokinesafter 6 and 30 h, as well as antimicrobial peptides after 30 h.The two myxovirus resistance genes (myxovirus (influenzavirus) resistance 1, interferon inducible protein p78 (mouse)(MX1), myxovirus (influenza virus) resistance 2 (mouse)(MX2)) and the two S100 calcium-binding genes (S100calcium-binding protein A9 (S100A9 ), S100 calcium-bindingprotein A12 (S100A12)) were also similarly upregulated after30 h E. coli. The most induced gene was serum amyloid A3
Table 1 Differentially expressed genes ( P , 0.05) between treatmentand control in pbMECs from six Brown Swiss cows after 6 and 30 hstimulation with heat-inactivated Escherichia coli 1303
x-time fold change1
E. coli 6 h E. coli 30 h
Mean s.e. Mean s.e.
Complement systemC3 4.4 0.9 8.6 1.8
ChemokinesCCL2 28.8 12.3 43.9 13.1CCL5 ns2 ns 51.6 33.3CCL20 39.4 17.1 50.2 11.1CXCL5 8.1 2.1 7.8 1.3CXCL8 20.1 7.7 21.9 7.5
Inflammatory cytokinesIL6 3.6 1.1 5.3 1.2IL10 18.8 11.0 53.1 35.1TNF 21.9 7.0 21.5 4.1
Antimicrobial peptidesLAP 2.8 0.6 19.5 8.0LF 3.2 0.6 8.6 2.3LPO ns ns 4.2 1.2LYZ1 ns ns 40.2 27.6TAP 54.8 32.8 105.7 57.9
Acute phase responseSAA3 ns ns 618.2 272.4
TLR pathwayCASP8 1.3 0.1 1.4 0.1CD14 ns ns 1.8 0.3TLR2 ns ns 5.0 2.1
OthersMX1 ns ns 4.4 1.4MX2 11.6 7.6 8.6 2.3S100A9 3.9 0.8 12.0 4.1S100A12 ns ns 4.2 0.9
pbMEC 5 primary bovine mammary epithelial cells; CCL 5 (C-C motif) ligand;CXCL 5 (C-X-C motif) ligand; IL 5 interleukin; TNF 5 tumour necrosis factor;LAP 5 lingual antimicrobial peptide; LF 5 lactoferrin; LPO 5 lactoperoxidase;LYZ 5 lysozyme; TAP 5 tracheal antimicrobial peptide; SAA3 5 serum amyloidA3; TLR 5 toll-like receptor; CASP8 5 caspase 8.1Calculated with the 22DDCq method (Livak and Schmittgen, 2001).2Not significant (P . 0.05).
Table 2 Differentially expressed genes between treatment and controlin pbMECs from six Brown Swiss cows after 30 and 78 h stimulationwith heat-inactivated Staphylococcus aureus 1027
x-time fold change1
S. aureus Mean s.e.
30 hTLR pathway
TLR4 1.3 0.278 h
ChemokinesCCL5 1.5 0.2
Inflammatory cytokinesIL10 1.5 0.2
OthersS100A12 1.3 0.1
TLR 5 Toll-like receptor; CCL5 5 (C-C motif) ligand 5; IL10 5 interleukin 10.1Calculated with the 22DDCq method (Livak and Schmittgen, 2001).
Sorg, Danowski, Korenkova, Rusnakova, Kuffner, Zimmer, Meyer and Kliem
802
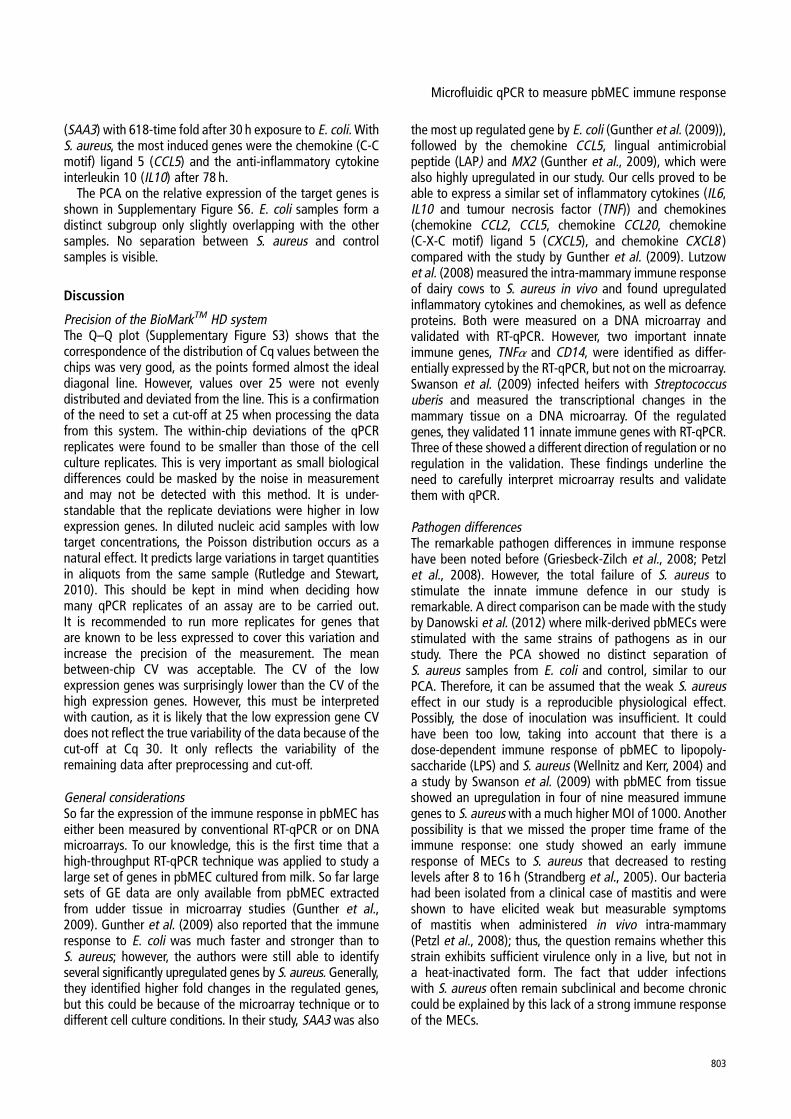
(SAA3) with 618-time fold after 30 h exposure to E. coli. WithS. aureus, the most induced genes were the chemokine (C-Cmotif) ligand 5 (CCL5) and the anti-inflammatory cytokineinterleukin 10 (IL10) after 78 h.
The PCA on the relative expression of the target genes isshown in Supplementary Figure S6. E. coli samples form adistinct subgroup only slightly overlapping with the othersamples. No separation between S. aureus and controlsamples is visible.
Discussion
Precision of the BioMarkTM HD systemThe Q–Q plot (Supplementary Figure S3) shows that thecorrespondence of the distribution of Cq values between thechips was very good, as the points formed almost the idealdiagonal line. However, values over 25 were not evenlydistributed and deviated from the line. This is a confirmationof the need to set a cut-off at 25 when processing the datafrom this system. The within-chip deviations of the qPCRreplicates were found to be smaller than those of the cellculture replicates. This is very important as small biologicaldifferences could be masked by the noise in measurementand may not be detected with this method. It is under-standable that the replicate deviations were higher in lowexpression genes. In diluted nucleic acid samples with lowtarget concentrations, the Poisson distribution occurs as anatural effect. It predicts large variations in target quantitiesin aliquots from the same sample (Rutledge and Stewart,2010). This should be kept in mind when deciding howmany qPCR replicates of an assay are to be carried out.It is recommended to run more replicates for genes thatare known to be less expressed to cover this variation andincrease the precision of the measurement. The meanbetween-chip CV was acceptable. The CV of the lowexpression genes was surprisingly lower than the CV of thehigh expression genes. However, this must be interpretedwith caution, as it is likely that the low expression gene CVdoes not reflect the true variability of the data because of thecut-off at Cq 30. It only reflects the variability of theremaining data after preprocessing and cut-off.
General considerationsSo far the expression of the immune response in pbMEC haseither been measured by conventional RT-qPCR or on DNAmicroarrays. To our knowledge, this is the first time that ahigh-throughput RT-qPCR technique was applied to study alarge set of genes in pbMEC cultured from milk. So far largesets of GE data are only available from pbMEC extractedfrom udder tissue in microarray studies (Gunther et al.,2009). Gunther et al. (2009) also reported that the immuneresponse to E. coli was much faster and stronger than toS. aureus; however, the authors were still able to identifyseveral significantly upregulated genes by S. aureus. Generally,they identified higher fold changes in the regulated genes,but this could be because of the microarray technique or todifferent cell culture conditions. In their study, SAA3 was also
the most up regulated gene by E. coli (Gunther et al. (2009)),followed by the chemokine CCL5, lingual antimicrobialpeptide (LAP) and MX2 (Gunther et al., 2009), which werealso highly upregulated in our study. Our cells proved to beable to express a similar set of inflammatory cytokines (IL6,IL10 and tumour necrosis factor (TNF)) and chemokines(chemokine CCL2, CCL5, chemokine CCL20, chemokine(C-X-C motif) ligand 5 (CXCL5), and chemokine CXCL8 )compared with the study by Gunther et al. (2009). Lutzowet al. (2008) measured the intra-mammary immune responseof dairy cows to S. aureus in vivo and found upregulatedinflammatory cytokines and chemokines, as well as defenceproteins. Both were measured on a DNA microarray andvalidated with RT-qPCR. However, two important innateimmune genes, TNFa and CD14, were identified as differ-entially expressed by the RT-qPCR, but not on the microarray.Swanson et al. (2009) infected heifers with Streptococcusuberis and measured the transcriptional changes in themammary tissue on a DNA microarray. Of the regulatedgenes, they validated 11 innate immune genes with RT-qPCR.Three of these showed a different direction of regulation or noregulation in the validation. These findings underline theneed to carefully interpret microarray results and validatethem with qPCR.
Pathogen differencesThe remarkable pathogen differences in immune responsehave been noted before (Griesbeck-Zilch et al., 2008; Petzlet al., 2008). However, the total failure of S. aureus tostimulate the innate immune defence in our study isremarkable. A direct comparison can be made with the studyby Danowski et al. (2012) where milk-derived pbMECs werestimulated with the same strains of pathogens as in ourstudy. There the PCA showed no distinct separation ofS. aureus samples from E. coli and control, similar to ourPCA. Therefore, it can be assumed that the weak S. aureuseffect in our study is a reproducible physiological effect.Possibly, the dose of inoculation was insufficient. It couldhave been too low, taking into account that there is adose-dependent immune response of pbMEC to lipopoly-saccharide (LPS) and S. aureus (Wellnitz and Kerr, 2004) anda study by Swanson et al. (2009) with pbMEC from tissueshowed an upregulation in four of nine measured immunegenes to S. aureus with a much higher MOI of 1000. Anotherpossibility is that we missed the proper time frame of theimmune response: one study showed an early immuneresponse of MECs to S. aureus that decreased to restinglevels after 8 to 16 h (Strandberg et al., 2005). Our bacteriahad been isolated from a clinical case of mastitis and wereshown to have elicited weak but measurable symptomsof mastitis when administered in vivo intra-mammary(Petzl et al., 2008); thus, the question remains whether thisstrain exhibits sufficient virulence only in a live, but not ina heat-inactivated form. The fact that udder infectionswith S. aureus often remain subclinical and become chroniccould be explained by this lack of a strong immune responseof the MECs.
Microfluidic qPCR to measure pbMEC immune response
803
Pathogen recognitionE. coli should be recognized by TLR4 and its cofactor CD14,which binds to conserved LPS patterns of gram-negativebacteria (Lu et al., 2008). Of this complex, only CD14 hasbeen regulated by E. coli in our study. In contradiction tothe statement that MECs do not express CD14 (Rainardand Riollet, 2006), we were able to measure an expressedand weakly regulated CD14. Apoptosis inducer caspase8 (CASP8) is activated by the gram-positive bacteria recog-nizing TLR2 (Aliprantis et al., 2000). CASP8 and TLR2 wereupregulated by E. coli. It has been shown in human cells thatTLR2 is able to respond to gram-negative bacteria whenexpressed in combination with the cofactor lymphocyteantigen 96 (LY96, also called MD2; Dziarski et al., 2001). Thiscofactor was expressed but not regulated by E. coli in ourcells, as well as other members of the pathway (LPS-bindingprotein (LBP), TLR4 and myeloid differentiation primaryresponse gene 88 (MYD88)). TLR4, on the other hand, wasweakly upregulated by S. aureus. Although based on mRNAexpression only, nothing can be said about the actual inter-action of the pathogen components with the TLRs; both TLR2and TLR4 mRNAs were present in all control and treatedsamples, and changes in expressions of TLR2 and TLR4 werepathogen specific in our study. The whole TLR signallingpathway here seemed to be less influenced than in otherstudies. It seems that it is not necessary to strongly upre-gulate the TLR pathway components for an efficient immuneresponse. Strandberg et al. (2005) found a similar weak TLRactivation in bovine MECs upon LPS stimulation andstill came to the conclusion that a functioning and locallyeffective immune system was present.
Inflammatory cytokines and chemokinesThese signalling and modulating molecules were highlyinfluenced by E. coli. This is consistent with most other studiesmentioned already and confirming that pbMECs exert a majorsentinel function to trigger the immune response. However, incontrast to another study (Lahouassa et al., 2007), we detecteda modulation of the immune response by upregulation ofthe anti-inflammatory cytokine IL10, suggesting an instantself-regulation to avoid damage to the tissue.
Antimicrobial peptides and acute phase responseLAP and tracheal antimicrobial peptide (TAP) belong tothe b-defensins, and together with lactoperoxidase (LPO),lysozyme (LYZ1) and lactoferrin (LF) they are antimicrobialpeptides, able to inhibit and damage bacteria directly. All fivestudied antimicrobial peptides were differentially expressedafter E. coli stimulation, with TAP being by far the mostinfluenced one. This is a confirmation of the findings ofLopez-Meza et al. (2009) that MECs are the source for TAPfound in the udder and in milk. Not many data are availablefor antimicrobial peptide expression of cultured pbMEC.Although it has been reported that repeated subcultivationof pbMECs lowered their ability to express LAP with and withoutstimulation (Gunther et al., 2009), all of our three passagecultures expressed LAP and responded to the stimulation.
The acute phase gene SAA3 was the most upregulated one,same as in the study by Gunther et al. (2009). The anti-bacterial SAA protein is an opsonin for gram-negative bacteria(Shah et al., 2006), and because of its massive increaseduring mastitis it has been suggested as a biomarker for thisdisease (Larsen et al., 2010).
Complement systemThe known lack of the classical pathway of the complementsystem in the mammary gland (Rainard and Riollet, 2006)was confirmed by the absence of complement component 1,q subcomponent, A chain (C1QA) expression. However,C3 expression was induced showing that the alternativepathway was functional in our cells. C3 can opsonize bac-teria and makes them available for phagocytosis, and itregulates the inflammatory response (Rainard and Riollet,2006). In another study, it was also upregulated by E. coliand S. aureus in pbMEC (Griesbeck-Zilch et al., 2008). Thesefindings suggest that C3 in milk is at least partially synthe-sized by the epithelial cells and not just transported throughthe blood–udder barrier. Complement component 5a recep-tor 1 (C5AR1) and complement component 3a receptor 1(C3AR1) were both found expressed in a part of the samples,and no statistical evaluation was done because of themissing data (data not shown). The expression of C5AR1 inepithelial cells has been discussed controversially; however,one study found C5aR protein expression in the bovine MECline MAC-T in a subpopulation of 10% to 12% of the cells(Nemali et al., 2008). C5AR1 encodes for the receptor ofcomplement component 5a (C5a), which is mainly presenton granulocytes, macrophages and some lymphocytes. C5aleads to cellular responses of the cells such as chemotaxis,phagocytosis and enzyme release (Rainard and Riollet, 2006).However, this author also mentions the stimulation of cyto-kine synthesis by C5a. This could be one possible function ofpbMEC when recognizing C5a via the C5a receptor.
OthersS100A9 and S100A12 encode for calgranulins, which area group of mediator molecules with calcium-binding, pro-inflammatory, regulatory, anti-oxidant and protective prop-erties. The S100-A12 protein has been shown to inhibitE. coli growth in vitro (Lutzow et al., 2008). S100 genes areknown to be upregulated in infected udder tissue andpbMEC (Gunther et al., 2009). As in the pbMEC study byGunther et al. (2009), MX2 and MX1 were induced by theE. coli treatment. MX proteins belong to the large GTPasesfamily and have different antiviral capacities; their expres-sion is stimulated by interferon and virus recognition (Leeand Vidal, 2002). Their potential effect on mastitis remainsto be subject of further research.
Conclusions
For the first time, a high-throughput microfluidic RT-qPCRplatform was applied to study a large set of genes in pbMECcultured from milk. The sensitivity of the measurement was
Sorg, Danowski, Korenkova, Rusnakova, Kuffner, Zimmer, Meyer and Kliem
804
found to be satisfactory for our purposes. We found it to beless time, sample, reagent and cost consuming than theconventional RT-qPCR, and unlike DNA microarrays, it doesnot require additional validation via conventional qPCR.With this technique and with cells cultivated from milkinstead of tissue, we obtained similar results as other studiesabout the immune system in pbMEC. This confirms that ourresults are comparable with the results from conventionalqPCR and tissue cultured pbMEC. With conventional qPCR,usually there are only few genes measured in each experi-ment. Therefore, it is necessary to assemble many differentstudies with different experimental conditions to achieve anoverview of the immune response. We showed that, withmicrofluidic qPCR, it is now possible to do this in oneexperiment. The same holds true to other functions of thesecells; cholesterol, fatty acid and milk protein metabolism arealso important fields of study and could be screened inexactly the same way.
It is a subject of further research to analyse why S. aureusoften fails to elicit a distinct immune response and whatgenes are exactly involved if there is a response. For that,microfluidic qPCR could be applied to screen a larger set ofimmune genes by omitting PCR replicates. The activationof antimicrobial peptides, the acute phase gene SAA3,S100A12 and S100A9 confirmed the diversified defencecapability of pbMEC against E. coli. On the other hand, ourpbMECs proved to be able to act as sentinel cells byexpressing chemokines and inflammatory cytokines for theattraction and activation of immune cells. They were alsoable to express the anti-inflammatory gene IL10 to modulatethe immune response. However, many details and interac-tions of the immune response are still unclear and wesuggest that this experimental set-up could be applied forfurther studies. Different pathogens and additional genescould be tested to broaden the picture as well as make itmore detailed.
Acknowledgements
The authors thank the ‘Vereinigung zur Forderung der Milch-wissenschaftlichen Forschung an der TU Munchen e. V.’ (Freising,Germany), the ‘Jutta und Georg Bruns Stiftung’ (Steinfeld,Germany) and the ‘Dr-Ing. Leonhard-Lorenz-Stiftung’ (Garching,Germany) for their friendly support. They also thank Dr WolframPetzl (Ludwigs-Maximilians-Universitat Munchen, Germany) fordonating the bacteria.
Supplementary materials
For supplementary materials referred to in this article, pleasevisit http://dx.doi.org/10.1017/S1751731112002315
ReferencesAliprantis AO, Yang RB, Weiss DS, Godowski P and Zychlinsky A 2000. Theapoptotic signaling pathway activated by Toll-like receptor-2. EuropeanMolecular Biology Organization Journal 19, 3325–3336.
Buehring GC 1990. Culture of mammary epithelial cells from bovine milk.Journal of Dairy Science 73, 956–963.
Bustin SA, Benes V, Garson JA, Hellemans J, Huggett J, Kubista M, Mueller R,Nolan T, Pfaffl MW, Shipley GL, Vandesompele J and Wittwer CT 2009. TheMIQE guidelines: minimum information for publication of quantitative real-timePCR experiments. Clinical Chemistry 55, 611–622.
Danowski K, Sorg D, Gross J, Meyer HHD and Kliem H 2012. Innate defensecapability of challenged primary bovine mammary epithelial cells after an inducednegative energy balance in vivo. Czech Journal of Animal Science 57, 207–220.
Dziarski R, Wang Q, Miyake K, Kirschning CJ and Gupta D 2001. MD-2 enables Toll-like receptor 2 (TLR2)-mediated responses to lipopolysaccharide and enhancesTLR2-mediated responses to Gram-positive and Gram-negative bacteria and theircell wall components. Journal of Immunology 166, 1938–1944.
Griesbeck-Zilch B, Meyer HH, Kuhn CH, Schwerin M and Wellnitz O 2008.Staphylococcus aureus and Escherichia coli cause deviating expression profilesof cytokines and lactoferrin messenger ribonucleic acid in mammary epithelialcells. Journal of Dairy Science 91, 2215–2224.
Gunther J, Koczan D, Yang W, Nurnberg G, Repsilber D, Schuberth HJ, Park Z,Maqbool N, Molenaar A and Seyfert HM 2009. Assessment of the immunecapacity of mammary epithelial cells: comparison with mammary tissue afterchallenge with Escherichia coli. Veterinary Research 40, 31.
Jang JS, Simon VA, Feddersen RM, Rakhshan F, Schultz DA, Zschunke MA, LingleWL, Kolbert CP and Jen J 2011. Quantitative miRNA expression analysis usingfluidigm microfluidics dynamic arrays. BMC Genomics 12, 144.
Lahouassa H, Moussay E, Rainard P and Riollet C 2007. Differential cytokine andchemokine responses of bovine mammary epithelial cells to Staphylococcusaureus and Escherichia coli. Cytokine 38, 12–21.
Larsen T, Rontved CM, Ingvartsen KL, Vels L and Bjerring M 2010. Enzymeactivity and acute phase proteins in milk utilized as indicators of acute clinicalE. coli LPS-induced mastitis. Animal 4, 1672–1679.
Lee SH and Vidal SM 2002. Functional diversity of Mx proteins: variations on atheme of host resistance to infection. Genome Research 12, 527–530.
Livak KJ and Schmittgen TD 2001. Analysis of relative gene expression datausing real-time quantitative PCR and the 2(-Delta Delta C(T)) Method. Methods25, 402–408.
Lopez-Meza JE, Gutierrez-Barroso A and Ochoa-Zarzosa A 2009. Expression oftracheal antimicrobial peptide in bovine mammary epithelial cells. Research inVeterinary Science 87, 59–63.
Lu Y-C, Yeh W-C and Ohashi PS 2008. LPS/TLR4 signal transduction pathway.Cytokine 42, 145–151.
Lutzow Y, Donaldson L, Gray C, Vuocolo T, Pearson R, Reverter A, Byrne K,Sheehy P, Windon R and Tellam R 2008. Identification of immune genes andproteins involved in the response of bovine mammary tissue to Staphylococcusaureus infection. BMC Veterinary Research 4, 18.
Nemali S, Siemsen DW, Nelson LK, Bunger PL, Faulkner CL, Rainard P, Gauss KA,Jutila MA and Quinn MT 2008. Molecular analysis of the bovine anaphylatoxinC5a receptor. Journal of Leukocyte Biology 84, 537–549.
Petzl W, Zerbe H, Gunther J, Yang W, Seyfert HM, Nurnberg G and Schuberth HJ2008. Escherichia coli, but not Staphylococcus aureus triggers an early increasedexpression of factors contributing to the innate immune defense in the udder ofthe cow. Veterinary Research 39, 18.
Rainard P and Riollet C 2006. Innate immunity of the bovine mammary gland.Veterinary Research 37, 369–400.
Rutledge RG and Stewart D 2010. Assessing the performance capabilities ofLRE-based assays for absolute quantitative real-time PCR. PLoS One 5, e9731.
Shah C, Hari-Dass R and Raynes JG 2006. Serum amyloid A is an innate immuneopsonin for Gram-negative bacteria. Blood 108, 1751–1757.
Spurgeon SL, Jones RC and Ramakrishnan R 2008. High throughput geneexpression measurement with real time PCR in a microfluidic dynamic array.PLoS One 3, e1662.
Strandberg Y, Gray C, Vuocolo T, Donaldson L, Broadway M and Tellam R 2005.Lipopolysaccharide and lipoteichoic acid induce different innate immuneresponses in bovine mammary epithelial cells. Cytokine 31, 72–86.
Swanson KM, Stelwagen K, Dobson J, Henderson HV, Davis SR, Farr VC and Singh K2009. Transcriptome profiling of Streptococcus uberis-induced mastitis revealsfundamental differences between immune gene expression in the mammary glandand in a primary cell culture model. Journal of Dairy Science 92, 117–129.
Wellnitz O and Kerr DE 2004. Cryopreserved bovine mammary cells to modelepithelial response to infection. Veterinary Immunology and Immunopathology101, 191–202.
Microfluidic qPCR to measure pbMEC immune response
805
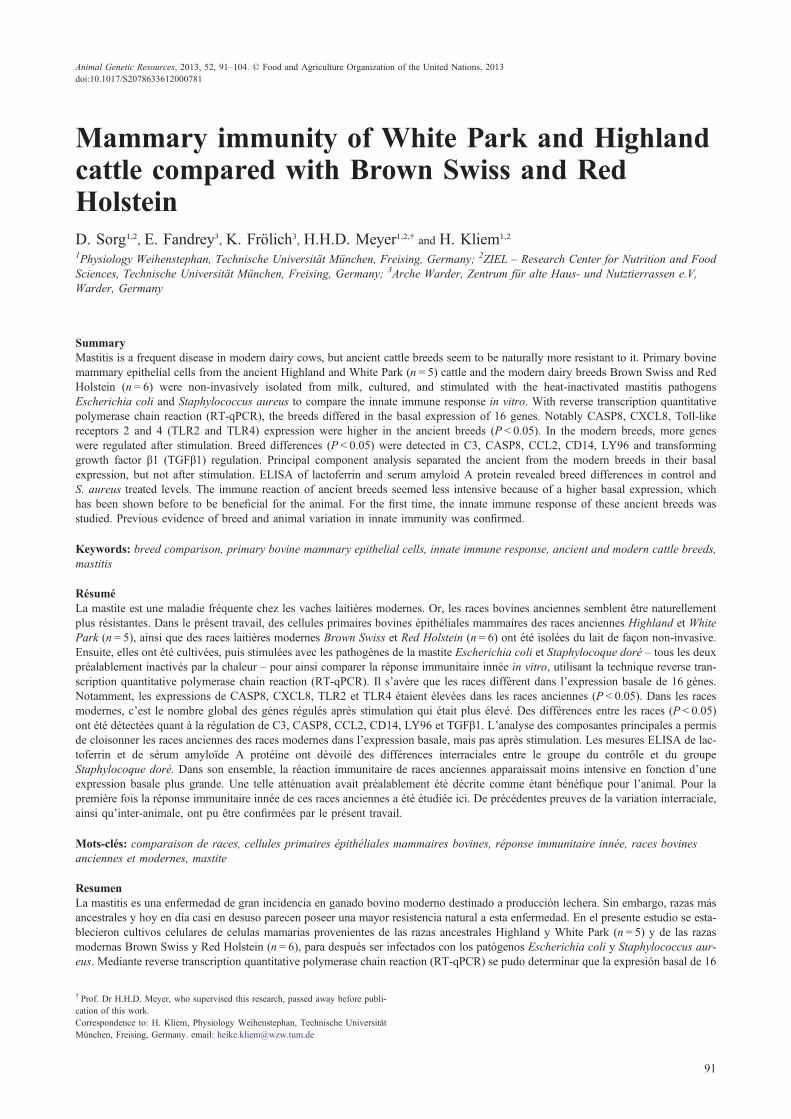
Mammary immunity of White Park and Highlandcattle compared with Brown Swiss and RedHolsteinD. Sorg1,2, E. Fandrey3, K. Frölich3, H.H.D. Meyer1,2,† and H. Kliem1,2
1Physiology Weihenstephan, Technische Universität München, Freising, Germany; 2ZIEL – Research Center for Nutrition and FoodSciences, Technische Universität München, Freising, Germany; 3Arche Warder, Zentrum für alte Haus- und Nutztierrassen e.V,Warder, Germany
SummaryMastitis is a frequent disease in modern dairy cows, but ancient cattle breeds seem to be naturally more resistant to it. Primary bovinemammary epithelial cells from the ancient Highland and White Park (n = 5) cattle and the modern dairy breeds Brown Swiss and RedHolstein (n = 6) were non-invasively isolated from milk, cultured, and stimulated with the heat-inactivated mastitis pathogensEscherichia coli and Staphylococcus aureus to compare the innate immune response in vitro. With reverse transcription quantitativepolymerase chain reaction (RT-qPCR), the breeds differed in the basal expression of 16 genes. Notably CASP8, CXCL8, Toll-likereceptors 2 and 4 (TLR2 and TLR4) expression were higher in the ancient breeds (P < 0.05). In the modern breeds, more geneswere regulated after stimulation. Breed differences (P < 0.05) were detected in C3, CASP8, CCL2, CD14, LY96 and transforminggrowth factor β1 (TGFβ1) regulation. Principal component analysis separated the ancient from the modern breeds in their basalexpression, but not after stimulation. ELISA of lactoferrin and serum amyloid A protein revealed breed differences in control andS. aureus treated levels. The immune reaction of ancient breeds seemed less intensive because of a higher basal expression, whichhas been shown before to be beneficial for the animal. For the first time, the innate immune response of these ancient breeds wasstudied. Previous evidence of breed and animal variation in innate immunity was confirmed.
Keywords: breed comparison, primary bovine mammary epithelial cells, innate immune response, ancient and modern cattle breeds,mastitis
RésuméLa mastite est une maladie fréquente chez les vaches laitières modernes. Or, les races bovines anciennes semblent être naturellementplus résistantes. Dans le présent travail, des cellules primaires bovines épithéliales mammaires des races anciennes Highland et WhitePark (n = 5), ainsi que des races laitières modernes Brown Swiss et Red Holstein (n = 6) ont été isolées du lait de façon non-invasive.Ensuite, elles ont été cultivées, puis stimulées avec les pathogènes de la mastite Escherichia coli et Staphylocoque doré – tous les deuxpréalablement inactivés par la chaleur – pour ainsi comparer la réponse immunitaire innée in vitro, utilisant la technique reverse tran-scription quantitative polymerase chain reaction (RT-qPCR). Il s’avère que les races diffèrent dans l’expression basale de 16 gènes.Notamment, les expressions de CASP8, CXCL8, TLR2 et TLR4 étaient élevées dans les races anciennes (P < 0.05). Dans les racesmodernes, c’est le nombre global des gènes régulés après stimulation qui était plus élevé. Des différences entre les races (P < 0.05)ont été détectées quant à la régulation de C3, CASP8, CCL2, CD14, LY96 et TGFβ1. L’analyse des composantes principales a permisde cloisonner les races anciennes des races modernes dans l’expression basale, mais pas après stimulation. Les mesures ELISA de lac-toferrin et de sérum amyloïde A protéine ont dévoilé des différences interraciales entre le groupe du contrôle et du groupeStaphylocoque doré. Dans son ensemble, la réaction immunitaire de races anciennes apparaissait moins intensive en fonction d’uneexpression basale plus grande. Une telle atténuation avait préalablement été décrite comme étant bénéfique pour l’animal. Pour lapremière fois la réponse immunitaire innée de ces races anciennes a été étudiée ici. De précédentes preuves de la variation interraciale,ainsi qu’inter-animale, ont pu être confirmées par le présent travail.
Mots-clés: comparaison de races, cellules primaires épithéliales mammaires bovines, réponse immunitaire innée, races bovinesanciennes et modernes, mastite
ResumenLa mastitis es una enfermedad de gran incidencia en ganado bovino moderno destinado a producción lechera. Sin embargo, razas másancestrales y hoy en día casi en desuso parecen poseer una mayor resistencia natural a esta enfermedad. En el presente estudio se esta-blecieron cultivos celulares de celulas mamarias provenientes de las razas ancestrales Highland y White Park (n = 5) y de las razasmodernas Brown Swiss y Red Holstein (n = 6), para después ser infectados con los patógenos Escherichia coli y Staphylococcus aur-eus. Mediante reverse transcription quantitative polymerase chain reaction (RT-qPCR) se pudo determinar que la expresión basal de 16
† Prof. Dr H.H.D. Meyer, who supervised this research, passed away before publi-cation of this work.Correspondence to: H. Kliem, Physiology Weihenstephan, Technische UniversitätMünchen, Freising, Germany. email: [email protected]
91
Animal Genetic Resources, 2013, 52, 91–104. © Food and Agriculture Organization of the United Nations, 2013doi:10.1017/S2078633612000781
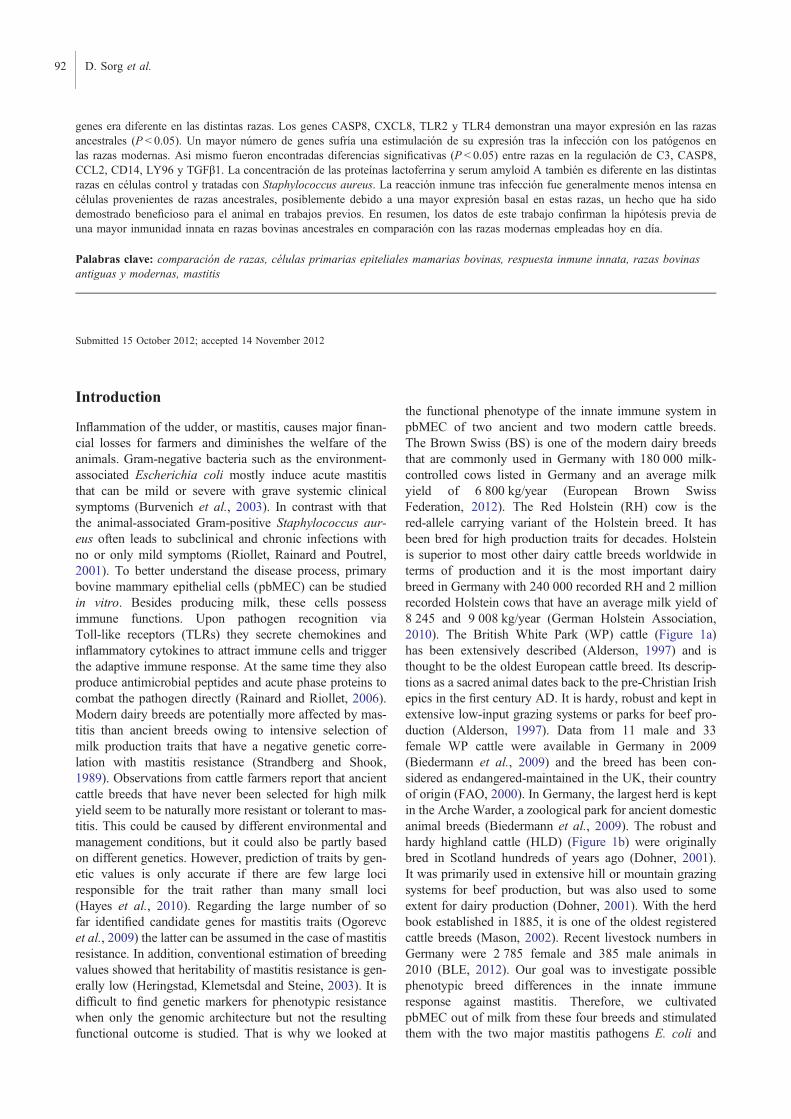
genes era diferente en las distintas razas. Los genes CASP8, CXCL8, TLR2 y TLR4 demonstran una mayor expresión en las razasancestrales (P < 0.05). Un mayor número de genes sufría una estimulación de su expresión tras la infección con los patógenos enlas razas modernas. Asi mismo fueron encontradas diferencias significativas (P < 0.05) entre razas en la regulación de C3, CASP8,CCL2, CD14, LY96 y TGFβ1. La concentración de las proteínas lactoferrina y serum amyloid A también es diferente en las distintasrazas en células control y tratadas con Staphylococcus aureus. La reacción inmune tras infección fue generalmente menos intensa encélulas provenientes de razas ancestrales, posiblemente debido a una mayor expresión basal en estas razas, un hecho que ha sidodemostrado beneficioso para el animal en trabajos previos. En resumen, los datos de este trabajo confirman la hipótesis previa deuna mayor inmunidad innata en razas bovinas ancestrales en comparación con las razas modernas empleadas hoy en día.
Palabras clave: comparación de razas, células primarias epiteliales mamarias bovinas, respuesta inmune innata, razas bovinasantiguas y modernas, mastitis
Submitted 15 October 2012; accepted 14 November 2012
Introduction
Inflammation of the udder, or mastitis, causes major finan-cial losses for farmers and diminishes the welfare of theanimals. Gram-negative bacteria such as the environment-associated Escherichia coli mostly induce acute mastitisthat can be mild or severe with grave systemic clinicalsymptoms (Burvenich et al., 2003). In contrast with thatthe animal-associated Gram-positive Staphylococcus aur-eus often leads to subclinical and chronic infections withno or only mild symptoms (Riollet, Rainard and Poutrel,2001). To better understand the disease process, primarybovine mammary epithelial cells (pbMEC) can be studiedin vitro. Besides producing milk, these cells possessimmune functions. Upon pathogen recognition viaToll-like receptors (TLRs) they secrete chemokines andinflammatory cytokines to attract immune cells and triggerthe adaptive immune response. At the same time they alsoproduce antimicrobial peptides and acute phase proteins tocombat the pathogen directly (Rainard and Riollet, 2006).Modern dairy breeds are potentially more affected by mas-titis than ancient breeds owing to intensive selection ofmilk production traits that have a negative genetic corre-lation with mastitis resistance (Strandberg and Shook,1989). Observations from cattle farmers report that ancientcattle breeds that have never been selected for high milkyield seem to be naturally more resistant or tolerant to mas-titis. This could be caused by different environmental andmanagement conditions, but it could also be partly basedon different genetics. However, prediction of traits by gen-etic values is only accurate if there are few large lociresponsible for the trait rather than many small loci(Hayes et al., 2010). Regarding the large number of sofar identified candidate genes for mastitis traits (Ogorevcet al., 2009) the latter can be assumed in the case of mastitisresistance. In addition, conventional estimation of breedingvalues showed that heritability of mastitis resistance is gen-erally low (Heringstad, Klemetsdal and Steine, 2003). It isdifficult to find genetic markers for phenotypic resistancewhen only the genomic architecture but not the resultingfunctional outcome is studied. That is why we looked at
the functional phenotype of the innate immune system inpbMEC of two ancient and two modern cattle breeds.The Brown Swiss (BS) is one of the modern dairy breedsthat are commonly used in Germany with 180 000 milk-controlled cows listed in Germany and an average milkyield of 6 800 kg/year (European Brown SwissFederation, 2012). The Red Holstein (RH) cow is thered-allele carrying variant of the Holstein breed. It hasbeen bred for high production traits for decades. Holsteinis superior to most other dairy cattle breeds worldwide interms of production and it is the most important dairybreed in Germany with 240 000 recorded RH and 2 millionrecorded Holstein cows that have an average milk yield of8 245 and 9 008 kg/year (German Holstein Association,2010). The British White Park (WP) cattle (Figure 1a)has been extensively described (Alderson, 1997) and isthought to be the oldest European cattle breed. Its descrip-tions as a sacred animal dates back to the pre-Christian Irishepics in the first century AD. It is hardy, robust and kept inextensive low-input grazing systems or parks for beef pro-duction (Alderson, 1997). Data from 11 male and 33female WP cattle were available in Germany in 2009(Biedermann et al., 2009) and the breed has been con-sidered as endangered-maintained in the UK, their countryof origin (FAO, 2000). In Germany, the largest herd is keptin the Arche Warder, a zoological park for ancient domesticanimal breeds (Biedermann et al., 2009). The robust andhardy highland cattle (HLD) (Figure 1b) were originallybred in Scotland hundreds of years ago (Dohner, 2001).It was primarily used in extensive hill or mountain grazingsystems for beef production, but was also used to someextent for dairy production (Dohner, 2001). With the herdbook established in 1885, it is one of the oldest registeredcattle breeds (Mason, 2002). Recent livestock numbers inGermany were 2 785 female and 385 male animals in2010 (BLE, 2012). Our goal was to investigate possiblephenotypic breed differences in the innate immuneresponse against mastitis. Therefore, we cultivatedpbMEC out of milk from these four breeds and stimulatedthem with the two major mastitis pathogens E. coli and
92 D. Sorg et al.
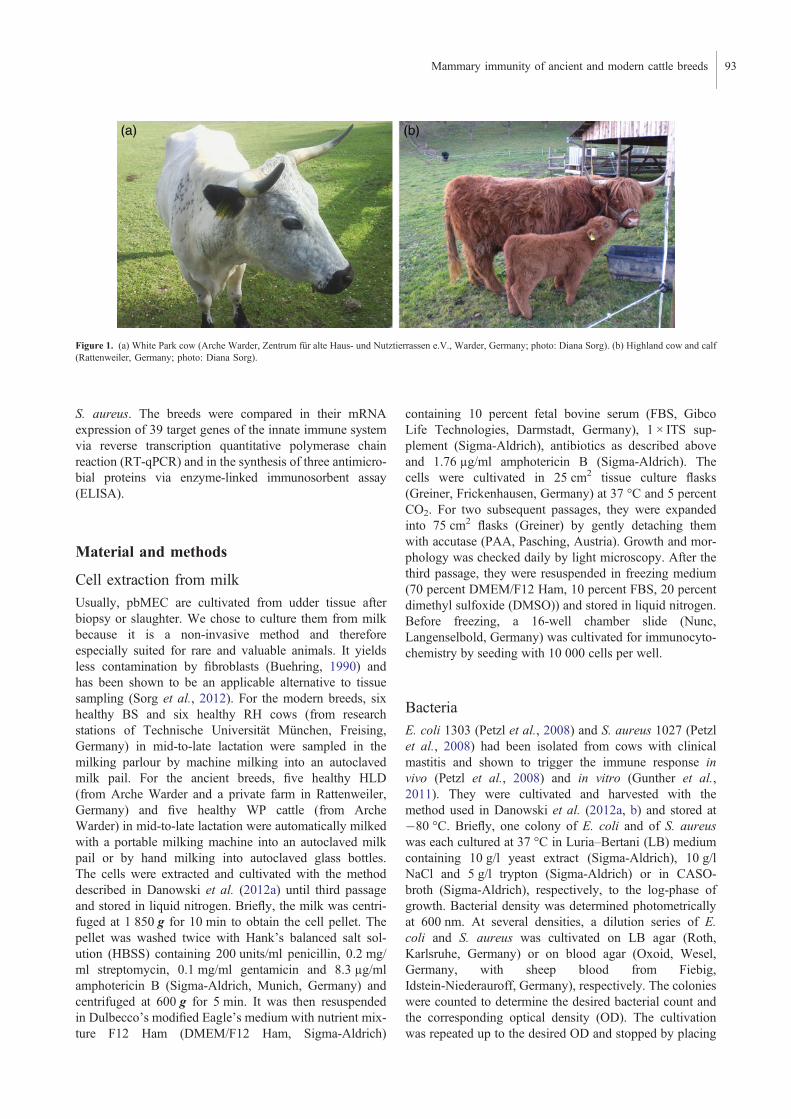
S. aureus. The breeds were compared in their mRNAexpression of 39 target genes of the innate immune systemvia reverse transcription quantitative polymerase chainreaction (RT-qPCR) and in the synthesis of three antimicro-bial proteins via enzyme-linked immunosorbent assay(ELISA).
Material and methods
Cell extraction from milk
Usually, pbMEC are cultivated from udder tissue afterbiopsy or slaughter. We chose to culture them from milkbecause it is a non-invasive method and thereforeespecially suited for rare and valuable animals. It yieldsless contamination by fibroblasts (Buehring, 1990) andhas been shown to be an applicable alternative to tissuesampling (Sorg et al., 2012). For the modern breeds, sixhealthy BS and six healthy RH cows (from researchstations of Technische Universität München, Freising,Germany) in mid-to-late lactation were sampled in themilking parlour by machine milking into an autoclavedmilk pail. For the ancient breeds, five healthy HLD(from Arche Warder and a private farm in Rattenweiler,Germany) and five healthy WP cattle (from ArcheWarder) in mid-to-late lactation were automatically milkedwith a portable milking machine into an autoclaved milkpail or by hand milking into autoclaved glass bottles.The cells were extracted and cultivated with the methoddescribed in Danowski et al. (2012a) until third passageand stored in liquid nitrogen. Briefly, the milk was centri-fuged at 1 850 g for 10 min to obtain the cell pellet. Thepellet was washed twice with Hank’s balanced salt sol-ution (HBSS) containing 200 units/ml penicillin, 0.2 mg/ml streptomycin, 0.1 mg/ml gentamicin and 8.3 µg/mlamphotericin B (Sigma-Aldrich, Munich, Germany) andcentrifuged at 600 g for 5 min. It was then resuspendedin Dulbecco’s modified Eagle’s medium with nutrient mix-ture F12 Ham (DMEM/F12 Ham, Sigma-Aldrich)
containing 10 percent fetal bovine serum (FBS, GibcoLife Technologies, Darmstadt, Germany), 1 × ITS sup-plement (Sigma-Aldrich), antibiotics as described aboveand 1.76 µg/ml amphotericin B (Sigma-Aldrich). Thecells were cultivated in 25 cm2 tissue culture flasks(Greiner, Frickenhausen, Germany) at 37 °C and 5 percentCO2. For two subsequent passages, they were expandedinto 75 cm2 flasks (Greiner) by gently detaching themwith accutase (PAA, Pasching, Austria). Growth and mor-phology was checked daily by light microscopy. After thethird passage, they were resuspended in freezing medium(70 percent DMEM/F12 Ham, 10 percent FBS, 20 percentdimethyl sulfoxide (DMSO)) and stored in liquid nitrogen.Before freezing, a 16-well chamber slide (Nunc,Langenselbold, Germany) was cultivated for immunocyto-chemistry by seeding with 10 000 cells per well.
Bacteria
E. coli 1303 (Petzl et al., 2008) and S. aureus 1027 (Petzlet al., 2008) had been isolated from cows with clinicalmastitis and shown to trigger the immune response invivo (Petzl et al., 2008) and in vitro (Gunther et al.,2011). They were cultivated and harvested with themethod used in Danowski et al. (2012a, b) and stored at−80 °C. Briefly, one colony of E. coli and of S. aureuswas each cultured at 37 °C in Luria–Bertani (LB) mediumcontaining 10 g/l yeast extract (Sigma-Aldrich), 10 g/lNaCl and 5 g/l trypton (Sigma-Aldrich) or in CASO-broth (Sigma-Aldrich), respectively, to the log-phase ofgrowth. Bacterial density was determined photometricallyat 600 nm. At several densities, a dilution series of E.coli and S. aureus was cultivated on LB agar (Roth,Karlsruhe, Germany) or on blood agar (Oxoid, Wesel,Germany, with sheep blood from Fiebig,Idstein-Niederauroff, Germany), respectively. The colonieswere counted to determine the desired bacterial count andthe corresponding optical density (OD). The cultivationwas repeated up to the desired OD and stopped by placing
Figure 1. (a) White Park cow (Arche Warder, Zentrum für alte Haus- und Nutztierrassen e.V., Warder, Germany; photo: Diana Sorg). (b) Highland cow and calf(Rattenweiler, Germany; photo: Diana Sorg).
Mammary immunity of ancient and modern cattle breeds 93
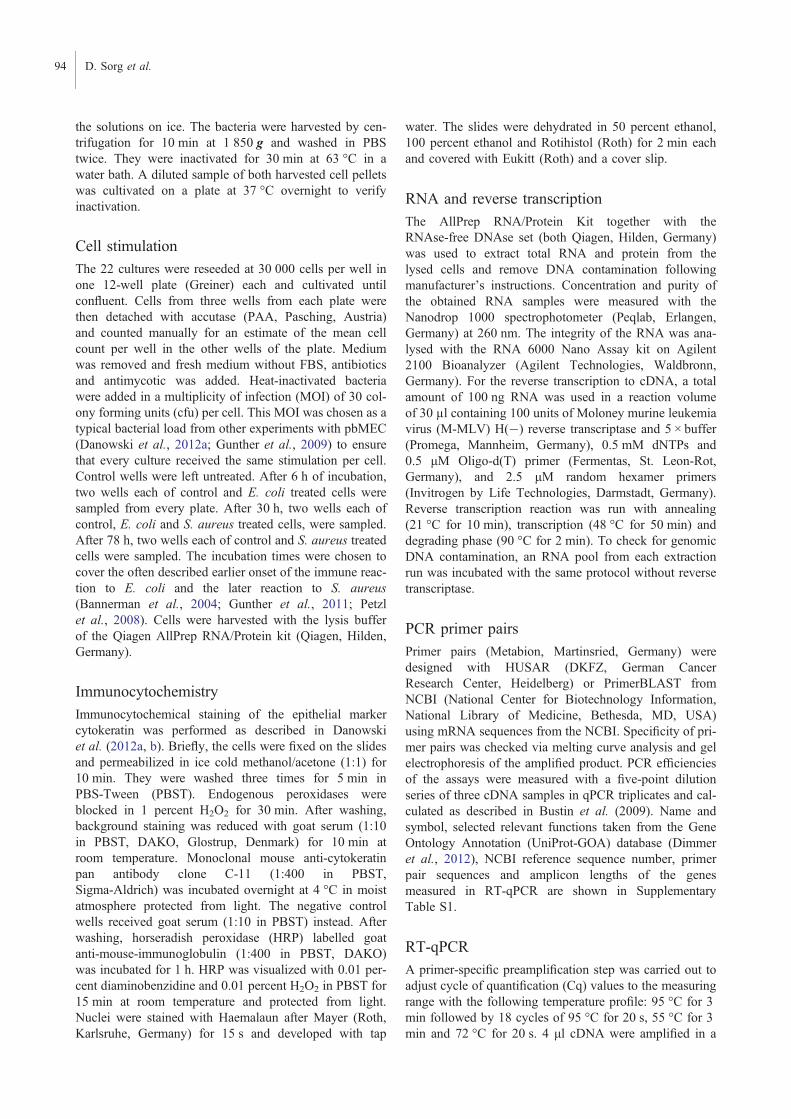
the solutions on ice. The bacteria were harvested by cen-trifugation for 10 min at 1 850 g and washed in PBStwice. They were inactivated for 30 min at 63 °C in awater bath. A diluted sample of both harvested cell pelletswas cultivated on a plate at 37 °C overnight to verifyinactivation.
Cell stimulation
The 22 cultures were reseeded at 30 000 cells per well inone 12-well plate (Greiner) each and cultivated untilconfluent. Cells from three wells from each plate werethen detached with accutase (PAA, Pasching, Austria)and counted manually for an estimate of the mean cellcount per well in the other wells of the plate. Mediumwas removed and fresh medium without FBS, antibioticsand antimycotic was added. Heat-inactivated bacteriawere added in a multiplicity of infection (MOI) of 30 col-ony forming units (cfu) per cell. This MOI was chosen as atypical bacterial load from other experiments with pbMEC(Danowski et al., 2012a; Gunther et al., 2009) to ensurethat every culture received the same stimulation per cell.Control wells were left untreated. After 6 h of incubation,two wells each of control and E. coli treated cells weresampled from every plate. After 30 h, two wells each ofcontrol, E. coli and S. aureus treated cells, were sampled.After 78 h, two wells each of control and S. aureus treatedcells were sampled. The incubation times were chosen tocover the often described earlier onset of the immune reac-tion to E. coli and the later reaction to S. aureus(Bannerman et al., 2004; Gunther et al., 2011; Petzlet al., 2008). Cells were harvested with the lysis bufferof the Qiagen AllPrep RNA/Protein kit (Qiagen, Hilden,Germany).
Immunocytochemistry
Immunocytochemical staining of the epithelial markercytokeratin was performed as described in Danowskiet al. (2012a, b). Briefly, the cells were fixed on the slidesand permeabilized in ice cold methanol/acetone (1:1) for10 min. They were washed three times for 5 min inPBS-Tween (PBST). Endogenous peroxidases wereblocked in 1 percent H2O2 for 30 min. After washing,background staining was reduced with goat serum (1:10in PBST, DAKO, Glostrup, Denmark) for 10 min atroom temperature. Monoclonal mouse anti-cytokeratinpan antibody clone C-11 (1:400 in PBST,Sigma-Aldrich) was incubated overnight at 4 °C in moistatmosphere protected from light. The negative controlwells received goat serum (1:10 in PBST) instead. Afterwashing, horseradish peroxidase (HRP) labelled goatanti-mouse-immunoglobulin (1:400 in PBST, DAKO)was incubated for 1 h. HRP was visualized with 0.01 per-cent diaminobenzidine and 0.01 percent H2O2 in PBST for15 min at room temperature and protected from light.Nuclei were stained with Haemalaun after Mayer (Roth,Karlsruhe, Germany) for 15 s and developed with tap
water. The slides were dehydrated in 50 percent ethanol,100 percent ethanol and Rotihistol (Roth) for 2 min eachand covered with Eukitt (Roth) and a cover slip.
RNA and reverse transcription
The AllPrep RNA/Protein Kit together with theRNAse-free DNAse set (both Qiagen, Hilden, Germany)was used to extract total RNA and protein from thelysed cells and remove DNA contamination followingmanufacturer’s instructions. Concentration and purity ofthe obtained RNA samples were measured with theNanodrop 1000 spectrophotometer (Peqlab, Erlangen,Germany) at 260 nm. The integrity of the RNA was ana-lysed with the RNA 6000 Nano Assay kit on Agilent2100 Bioanalyzer (Agilent Technologies, Waldbronn,Germany). For the reverse transcription to cDNA, a totalamount of 100 ng RNA was used in a reaction volumeof 30 µl containing 100 units of Moloney murine leukemiavirus (M-MLV) H(−) reverse transcriptase and 5 × buffer(Promega, Mannheim, Germany), 0.5 mM dNTPs and0.5 μM Oligo-d(T) primer (Fermentas, St. Leon-Rot,Germany), and 2.5 μM random hexamer primers(Invitrogen by Life Technologies, Darmstadt, Germany).Reverse transcription reaction was run with annealing(21 °C for 10 min), transcription (48 °C for 50 min) anddegrading phase (90 °C for 2 min). To check for genomicDNA contamination, an RNA pool from each extractionrun was incubated with the same protocol without reversetranscriptase.
PCR primer pairs
Primer pairs (Metabion, Martinsried, Germany) weredesigned with HUSAR (DKFZ, German CancerResearch Center, Heidelberg) or PrimerBLAST fromNCBI (National Center for Biotechnology Information,National Library of Medicine, Bethesda, MD, USA)using mRNA sequences from the NCBI. Specificity of pri-mer pairs was checked via melting curve analysis and gelelectrophoresis of the amplified product. PCR efficienciesof the assays were measured with a five-point dilutionseries of three cDNA samples in qPCR triplicates and cal-culated as described in Bustin et al. (2009). Name andsymbol, selected relevant functions taken from the GeneOntology Annotation (UniProt-GOA) database (Dimmeret al., 2012), NCBI reference sequence number, primerpair sequences and amplicon lengths of the genesmeasured in RT-qPCR are shown in SupplementaryTable S1.
RT-qPCR
A primer-specific preamplification step was carried out toadjust cycle of quantification (Cq) values to the measuringrange with the following temperature profile: 95 °C for 3min followed by 18 cycles of 95 °C for 20 s, 55 °C for 3min and 72 °C for 20 s. 4 μl cDNA were amplified in a
94 D. Sorg et al.
volume of 20 µl with the iQ Supermix (Bio-Rad, Munich,Germany) and a primer concentration of 25 nM (Metabion,Martinsried, Germany) of each primer pair over 18 cycles.RT-qPCR was done on the microfluidic high-throughputBioMark™ HD system (Fluidigm, San Francisco, CA,USA) (Spurgeon, Jones and Ramakrishnan, 2008). One48.48 Gene Expression (GE) Dynamic Array chip wasused to measure PCR efficiencies of the assays and four96.96 GE Dynamic Arrays were used to measure geneexpression in the samples. One representative and stablyexpressed sample was chosen as between-chip calibratorand measured repeatedly on all chips. 5 ìl sample premixcontaining 2.5 μl SsoFast EvaGreen Supermix (Bio-Rad),0.25 µl of sample loading reagent (Fluidigm), 0.1 µlROX (diluted 1:3, Invitrogen), 1.25 μl preamplified and1:9 diluted cDNA and water, as well as 5 μl assay premixcontaining 2 µl 10 µM primer pairs in the final concen-tration of 4 ìM, 2.5 µl Assay loading reagent (Fluidigm)and water were prepared and transferred to the primedGE Dynamic Array 96.96. The samples and assays weremixed inside the chip with the Nanoflex IFC controller(Fluidigm). The final concentration of primers in the indi-vidual reaction was 400 μM. The temperature profile was98 °C for 40 s then followed by 40 cycles consisting of95 °C for 10 s and 60 °C for 40 s. A melting curve of allPCR products was performed after the run to check forspecificity. The Cq, where the fluorescence signal crossedthe threshold, was detected by the BioMark DataCollection Software 2.1.1. built 20090519.0926(Fluidigm, San Francisco, CA, USA). RT-qPCR was con-ducted following the minimum information for the publi-cation of quantitative real-time PCR experiments (MIQE)-Guidelines (Bustin et al., 2009).
Data analysis of RT-qPCR
Melting Curve Analysis Software 1.1.0. built20100514.1234 (Fluidigm) and Real-time PCR AnalysisSoftware 2.1.1. built 20090521.1135 (Fluidigm) wereused to determine the valid PCR reactions. Invalid reactionswere not used for later analysis and treated as missing data.Owing to loss of measurement precision, Cq values higherthan 30 were treated as missing data and values between25 and 30 were replaced by 25. Raw Cq values were pro-cessed with Genex 5.3.2 (MultID Analyses AB,Gothenburg, Sweden), using interplate calibration and refer-ence gene normalization. Actin gamma 1 (ACTG1), keratin8 (KRT8) and H3 histone, family 3A (H3F3A) were ident-ified as suitable reference genes with the Normfinder toolwithin Genex 5.3.2. (MultID). The subtraction of referencegene Cq value index from target gene Cq value yielded thedCq value. Genex 5.3.2 (MultID) was also used for princi-pal component analysis (PCA). All other statistical calcu-lations were conducted with SigmaPlot 11 (Systat,Chicago, IL, USA) or SPSS Statistics Standard 21.0(IBM, Armonk, NY, USA). Fold change in expressionwas calculated with the 2−ddCq method (Livak and
Schmittgen, 2001). Independent t-tests were used to com-pare basal expressions and fold changes in expressionbetween breeds (P < 0.05). Paired t-tests or signed ranktests on dCq values were used to find differentiallyexpressed genes between treatment and control. Graphswere drawn with SPSS (IBM) or SigmaPlot 11 (Systat). Itmust be noted that no correction for multiple testing wasimposed on the P-values. This study is of descriptive andexplorative character only, not of a diagnostic one. Such acorrection would have been too stringent and maskedmany of the differences.
Protein quantification with ELISA
Total protein content in the extracted cell protein was deter-mined with the bicinchoninic acid (BCA) assay (Smithet al., 1985) and measured with a photometer (Tecan,Männedorf, Switzerland). Lactoferrin (LF) was measuredwith the ELISA protocol and reagents used by Danowskiet al. (2012b). Cell protein was diluted 1:1 in PBST andmeasured in duplicates. Interleukin-10 (IL-10) was deter-mined using the ELISA protocol from Groebner et al.(2011) with minor modifications: the capture antibodymouse anti-bovine IL-10 antibody clone CC318 (AbDSerotec, Düsseldorf, Germany) was used at 5 µg/ml andthe detection antibody biotinylated monoclonal mouse anti-bovine IL-10 antibody clone CC320 (AbD Serotec) wasused at 1 µg/ml and incubated for 2 h. Samples were diluted1:50 in PBST. Serum amyloid A (SAA) was measured in30 h E. coli treated and control samples with the PHASESerum amyloid A Multispecies ELISA kit (TriDelta,Maynooth, Ireland) according to manufacturer’s instruc-tions. Samples were diluted 1:67 in PBST.
Data analysis of ELISA
LF contents were calculated from the standard curve(Magellan data analysis software, Tecan, Männedorf,Switzerland). They were normalized to the total proteincontent of the sample and presented as ng LF/μg cellprotein. A paired t-test in SigmaPlot 11 (Systat, Chicago,IL, USA) was used to test for differential expression ofLF between treated and control samples at each timepoint (P < 0.05). Independent t-tests were used to comparetreated and control levels between breeds. Owing to a lackof a commercial standard, relative IL-10 concentration wasdetermined by normalizing the OD to the total protein con-tent of the sample. To avoid interplate bias we gave theratio of normalized ODs of treated and control samplesthat were each measured together on the same plate, mul-tiplied by 100, this yielded IL-10 in % of control. SAAcontents were determined with the standard curve as indi-cated in the manual. A paired t-test or signed rank test inSigmaPlot (Systat, Chicago, IL, USA) was used to com-pare SAA content in 30 h E. coli treated and controlsamples (P < 0.05). An independent t-test was used tocompare breeds (P < 0.05).
Mammary immunity of ancient and modern cattle breeds 95
Results
Cell culture and immunocytochemistry
An average of 5.98 million cells per animal with a range of1–19 million cells was harvested for storage in liquid nitro-gen. All the cultures showed a clear and continuous stain-ing for cytokeratin, whereas the negative controls remainedunstained. No cell types other than epithelial-like cellscould be detected. All cultures showed the typicalcobblestone-like shape with varying cell sizes. An exampleis shown in Supplementary Figure S2.
Gene expression
Table 1 shows the normalized basal expression of 16innate immune genes in the untreated control samplesafter 6, 30 and 78 h incubation. These 16 genes were dif-ferentially expressed between breeds at one time point atleast. CXCL8, LPO, CD68, CASP8, TLR2, TLR4 andMX2 were differentially expressed at all three time points.Six genes of the TLR pathway were differentiallyexpressed at 6 h. Notably in CASP8, CXCL8, TLR2 andTLR4, the ancient breeds had lower Cq values and there-fore higher expression levels than the modern breeds.WP had higher expression levels of CCL5, IL10, MX1and MX2 than the other breeds. It also had a higherCCL20, CD68 and LPO expression than RH.
Tables 2 and 3 show the relative fold changes in geneexpression of innate immune genes between control andtreated cells. Only genes that were differentially expressedin one breed (P < 0.05) or were at least 1.5-fold up-regulatedare presented. Table 2 shows the fold changes in geneexpression after 6 and 30 h exposure to E. coli. After 6 h,HLD had lower fold changes than BS in complement com-ponent 3 (C3) and caspase 8 (CASP8), lower fold changesthan RH in chemokine (C-C motif) ligand 2 (CCL2) andlymphocyte antigen 96 (LY96) and lower fold changesthan WP in lactoperoxidase (LPO). C3, chemokines andcytokines were strongly up-regulated. Antimicrobial pep-tides were only up-regulated in the modern breeds. S100and MX genes were more differentially expressed in themodern breeds. The most regulated gene after 6 h exposureto E. coli was SAA3 with nearly 290-fold in RH. After 30 hexposure to E. coli, BS had higher fold changes than RH inCD14. C3, chemokines, cytokines and antimicrobial pep-tides were strongly up-regulated. With the two E. coli treat-ments, more of the antimicrobial peptides were up-regulatedin BS than in the other breeds. After 6 h exposure to E. colitherewas no up-regulation of these in the ancient breeds. TheS100 and MX genes were only up-regulated in the modernbreeds. The most regulated gene after 30 h exposure to E.coli was SAA3 with 1900-fold in RH. Table 3 shows thefold changes in gene expression after 30 and 78 h exposureto S. aureus. There were no breed differences after 30 hexposure to S. aureus. The only differentially expressedgenes were the antimicrobial peptides LPO and LYZ1 inWP and TLR4 in BS. After 30 h exposure to S. aureus
LYZ1 had the highest significant fold change with 1.6 inWP. After 78 h exposure to S. aureus, HLD differed fromBS in transforming growth factor β1 (TGFβ1). They wereboth down-regulated and differed from RH which wasup-regulated. LY96 was slightly elevated in HLD comparedwithWP andRH.After 78 h exposure to S. aureus, the high-est significant fold change was found in LF in RH with 1.6.SEM was generally very high. In general, the modern breedshad a higher number of regulated genes than the ancient breeds(Tables 2 and 3). Figure 2 shows the PCA on the dCq valuesof the control samples (Figure 2a) and the ddCq values, thedifferences between control and treated dCqs (Figure 2b).Each symbol represents all data of all respective samplesfrom one animal. A visual clustering can be observed inthe basal expression (Figure 2a): RH and BS form two sub-groups in the lower half of the picture. WP and HLD aremixed together, but separated from the modern breeds inthe upper half of the graph. No such separation is visiblein the PCA on the ddCqs of gene expression.
Protein production
LF content in total cell protein is shown together with theinversed expression of its gene (20-dCq), so that higherbars represent higher gene expression (Figure 3). Whilean up-regulation in the gene expression could be observedin most E. coli treatments and after 78 h with S. aureus,only RH and WP had a significant protein increase with30 h exposure to E. coli. BS even showed a down-regulation in LF protein with 30 h exposure to S. aureus.BS had higher gene expression levels than RH and HLDin 78 h control cells. HLD had higher control and S. aur-eus treated LF protein levels after 30 h compared with WP.
IL-10 was determined relatively as IL-10 in % of control andis shown together with the fold change of its geneexpression (Figure 4). There were no significant breed differ-ences. While there was an often significant up-regulation inIL10 gene expression (see Tables 2 and 3) the rise in proteinproduction was not consistent throughout the breeds and thetreatments. In BS, there was a qualitative increase ofapproximately 50 and 25 percent of IL-10 protein after 30and 78 h exposure to S. aureus, respectively. RH had aqualitative increase of about 60 percent with 30 h exposureto E. coli. WP showed no visible changes compared withcontrols. In HLD, there was about 50 percent more IL-10with 6 h E. coli and 78 h S. aureus treatments, as well asabout 100 percent more with 30 h S. aureus treatment.SEM of the protein data was considerably high.
SAA content was measured in control and E. coli treatedcells after 30 h stimulation and is shown together withthe inversed expression of its gene (20-dCq), so that higherbars represent higher gene expression (Figure 5). Geneexpression was significantly increased by the treatment,but only in BS this was also true for the proteinproduction. BS and RH differed significantly from HLDin basal SAA levels (control). However, only BS differedsignificantly from HLD in E. coli treated SAA levels.
96 D. Sorg et al.
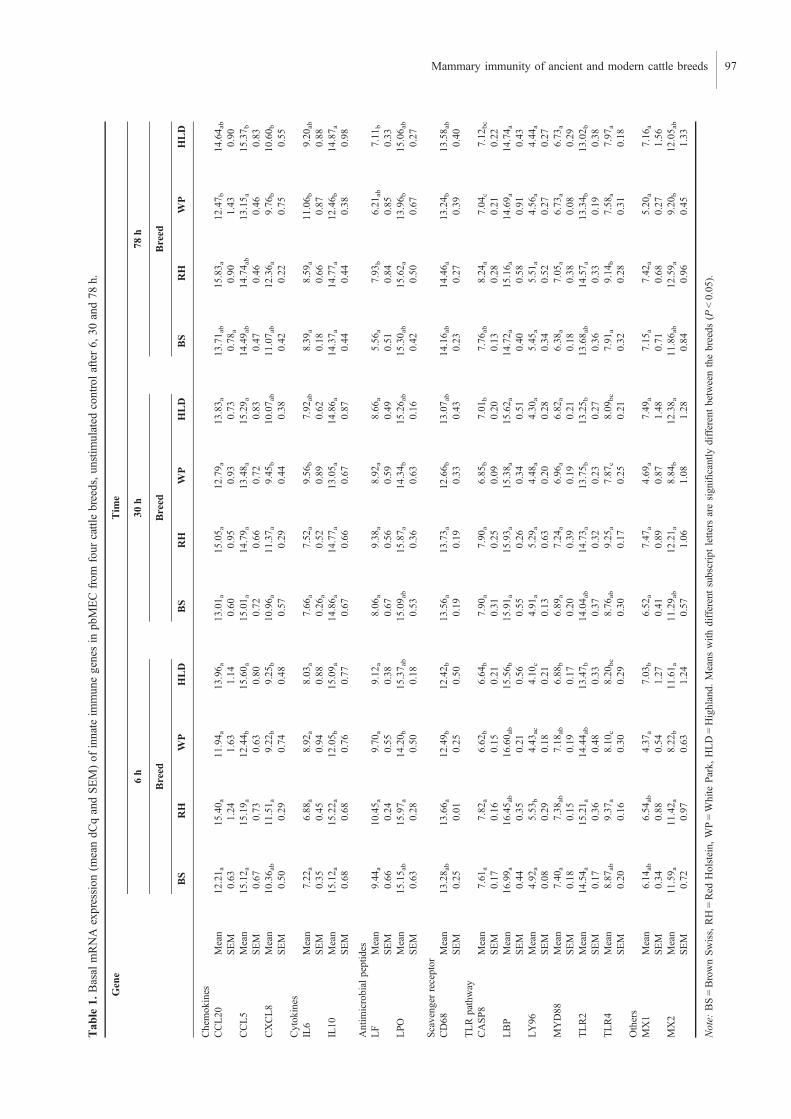
Tab
le1.
Basal
mRNA
expression
(meandC
qandSEM)of
innate
immunegenesin
pbMECfrom
four
cattlebreeds,unstim
ulated
controlafter6,
30and78
h.
Gene
Tim
e
6h
30h
78h
Breed
Breed
Breed
BS
RH
WP
HLD
BS
RH
WP
HLD
BS
RH
WP
HLD
Chemok
ines
CCL20
Mean
12.21 a
15.40 a
11.94 a
13.96 a
13.01 a
15.05 a
12.79 a
13.83 a
13.71 a
b15
.83 a
12.47 b
14.64 a
b
SEM
0.63
1.24
1.63
1.14
0.60
0.95
0.93
0.73
0.78
a0.90
1.43
0.90
CCL5
Mean
15.12 a
15.19 a
12.44 b
15.60 a
15.01 a
14.79 a
13.48 a
15.29 a
14.49 a
b14
.74 a
b13
.15 a
15.37 b
SEM
0.67
0.73
0.63
0.80
0.72
0.66
0.72
0.83
0.47
0.46
0.46
0.83
CXCL8
Mean
10.36 a
b11
.51 a
9.22
b9.25
b10
.96 a
11.37 a
9.45
b10
.07 a
b11
.07 a
b12
.36 a
9.76
b10
.60 b
SEM
0.50
0.29
0.74
0.48
0.57
0.29
0.44
0.38
0.42
0.22
0.75
0.55
Cytok
ines
IL6
Mean
7.22
a6.88
a8.92
a8.03
a7.66
a7.52
a9.56
b7.92
ab8.39
a8.59
a11
.06 b
9.20
ab
SEM
0.35
0.45
0.94
0.88
0.26
a0.52
0.89
0.62
0.18
0.66
0.87
0.88
IL10
Mean
15.12 a
15.22 a
12.05 b
15.09 a
14.86 a
14.77 a
13.05 a
14.86 a
14.37 a
14.77 a
12.46 b
14.87 a
SEM
0.68
0.68
0.76
0.77
0.67
0.66
0.67
0.87
0.44
0.44
0.38
0.98
Antim
icrobial
peptides
LF
Mean
9.44
a10
.45 a
9.70
a9.12
a8.06
a9.38
a8.92
a8.66
a5.56
a7.93
b6.21
ab7.11
b
SEM
0.66
0.24
0.55
0.38
0.67
0.56
0.59
0.49
0.51
0.84
0.85
0.33
LPO
Mean
15.15 a
b15
.97 a
14.20 b
15.37 a
b15
.09 a
b15
.87 a
14.34 b
15.26 a
b15
.30 a
b15
.62 a
13.96 b
15.06 a
b
SEM
0.63
0.28
0.50
0.18
0.53
0.36
0.63
0.16
0.42
0.50
0.67
0.27
Scaveng
erreceptor
CD68
Mean
13.28 a
b13
.66 a
12.49 b
12.42 b
13.56 a
13.73 a
12.66 b
13.07 a
b14
.16 a
b14
.46 a
13.24 b
13.58 a
b
SEM
0.25
0.01
0.25
0.50
0.19
0.19
0.33
0.43
0.23
0.27
0.39
0.40
TLRpathway
CASP8
Mean
7.61
a7.82
a6.62
b6.64
b7.90
a7.90
a6.85
b7.01
b7.76
ab8.24
a7.04
c7.12
bc
SEM
0.17
0.16
0.15
0.21
0.31
0.25
0.09
0.20
0.13
0.28
0.21
0.22
LBP
Mean
16.99 a
16.45 a
b16
.60 a
b15
.56 b
15.91 a
15.93 a
15.38 a
15.62 a
14.72 a
15.16 a
14.69 a
14.74 a
SEM
0.44
0.35
0.21
0.56
0.55
0.26
0.34
0.51
0.40
0.58
0.91
0.43
LY96
Mean
4.92
a5.53
b4.43
ac4.10
c4.91
a5.29
a4.48
a4.30
a5.45
a5.51
a4.56
a4.44
a
SEM
0.08
0.29
0.18
0.21
0.13
0.63
0.20
0.28
0.34
0.52
0.27
0.27
MYD88
Mean
7.40
a7.38
ab7.18
ab6.88
b6.89
a7.24
a6.96
a6.82
a6.38
a7.05
a6.73
a6.73
a
SEM
0.18
0.15
0.19
0.17
0.20
0.39
0.19
0.21
0.18
0.38
0.08
0.29
TLR2
Mean
14.54 a
15.21 a
14.44 a
b13
.47 b
14.04 a
b14
.73 a
13.75 b
13.25 b
13.68 a
b14
.57 a
13.34 b
13.02 b
SEM
0.17
0.36
0.48
0.33
0.37
0.32
0.23
0.27
0.36
0.33
0.19
0.38
TLR4
Mean
8.87
ab9.37
a8.10
c8.20
bc
8.76
ab9.25
a7.87
c8.09
bc
7.91
a9.14
b7.58
a7.97
a
SEM
0.20
0.16
0.30
0.29
0.30
0.17
0.25
0.21
0.32
0.28
0.31
0.18
Others
MX1
Mean
6.14
ab6.54
ab4.37
a7.03
b6.52
a7.47
a4.69
a7.49
a7.15
a7.42
a5.20
a7.16
a
SEM
0.34
0.88
0.54
1.27
0.41
0.89
0.87
1.48
0.71
0.68
0.27
1.56
MX2
Mean
11.59 a
11.42 a
8.22
b11
.61 a
11.29 a
b12
.21 a
8.84
b12
.38 a
11.86 a
b12
.59 a
9.20
b12
.05 a
b
SEM
0.72
0.97
0.63
1.24
0.57
1.06
1.08
1.28
0.84
0.96
0.45
1.33
Note:
BS=BrownSwiss,RH=Red
Holstein,
WP=White
Park,HLD=Highland.
Means
with
differentsubscriptletters
aresignificantly
differentbetweenthebreeds
(P<0.05).
Mammary immunity of ancient and modern cattle breeds 97
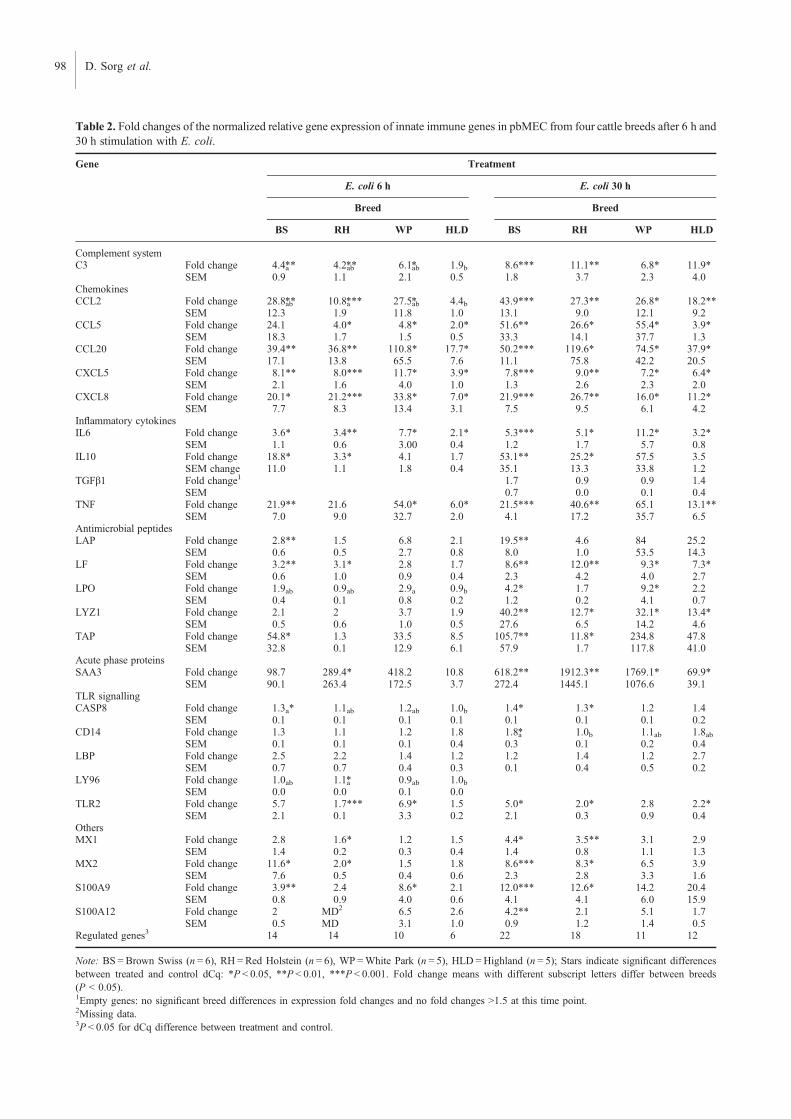
Table 2. Fold changes of the normalized relative gene expression of innate immune genes in pbMEC from four cattle breeds after 6 h and30 h stimulation with E. coli.
Gene Treatment
E. coli 6 h E. coli 30 h
Breed Breed
BS RH WP HLD BS RH WP HLD
Complement systemC3 Fold change 4.4a** 4.2ab** 6.1ab* 1.9b 8.6*** 11.1** 6.8* 11.9*
SEM 0.9 1.1 2.1 0.5 1.8 3.7 2.3 4.0ChemokinesCCL2 Fold change 28.8ab** 10.8a*** 27.5ab* 4.4b 43.9*** 27.3** 26.8* 18.2**
SEM 12.3 1.9 11.8 1.0 13.1 9.0 12.1 9.2CCL5 Fold change 24.1 4.0* 4.8* 2.0* 51.6** 26.6* 55.4* 3.9*
SEM 18.3 1.7 1.5 0.5 33.3 14.1 37.7 1.3CCL20 Fold change 39.4** 36.8** 110.8* 17.7* 50.2*** 119.6* 74.5* 37.9*
SEM 17.1 13.8 65.5 7.6 11.1 75.8 42.2 20.5CXCL5 Fold change 8.1** 8.0*** 11.7* 3.9* 7.8*** 9.0** 7.2* 6.4*
SEM 2.1 1.6 4.0 1.0 1.3 2.6 2.3 2.0CXCL8 Fold change 20.1* 21.2*** 33.8* 7.0* 21.9*** 26.7** 16.0* 11.2*
SEM 7.7 8.3 13.4 3.1 7.5 9.5 6.1 4.2Inflammatory cytokinesIL6 Fold change 3.6* 3.4** 7.7* 2.1* 5.3*** 5.1* 11.2* 3.2*
SEM 1.1 0.6 3.00 0.4 1.2 1.7 5.7 0.8IL10 Fold change 18.8* 3.3* 4.1 1.7 53.1** 25.2* 57.5 3.5
SEM change 11.0 1.1 1.8 0.4 35.1 13.3 33.8 1.2TGFβ1 Fold change1 1.7 0.9 0.9 1.4
SEM 0.7 0.0 0.1 0.4TNF Fold change 21.9** 21.6 54.0* 6.0* 21.5*** 40.6** 65.1 13.1**
SEM 7.0 9.0 32.7 2.0 4.1 17.2 35.7 6.5Antimicrobial peptidesLAP Fold change 2.8** 1.5 6.8 2.1 19.5** 4.6 84 25.2
SEM 0.6 0.5 2.7 0.8 8.0 1.0 53.5 14.3LF Fold change 3.2** 3.1* 2.8 1.7 8.6** 12.0** 9.3* 7.3*
SEM 0.6 1.0 0.9 0.4 2.3 4.2 4.0 2.7LPO Fold change 1.9ab 0.9ab 2.9a 0.9b 4.2* 1.7 9.2* 2.2
SEM 0.4 0.1 0.8 0.2 1.2 0.2 4.1 0.7LYZ1 Fold change 2.1 2 3.7 1.9 40.2** 12.7* 32.1* 13.4*
SEM 0.5 0.6 1.0 0.5 27.6 6.5 14.2 4.6TAP Fold change 54.8* 1.3 33.5 8.5 105.7** 11.8* 234.8 47.8
SEM 32.8 0.1 12.9 6.1 57.9 1.7 117.8 41.0Acute phase proteinsSAA3 Fold change 98.7 289.4* 418.2 10.8 618.2** 1912.3** 1769.1* 69.9*
SEM 90.1 263.4 172.5 3.7 272.4 1445.1 1076.6 39.1TLR signallingCASP8 Fold change 1.3a* 1.1ab 1.2ab 1.0b 1.4* 1.3* 1.2 1.4
SEM 0.1 0.1 0.1 0.1 0.1 0.1 0.1 0.2CD14 Fold change 1.3 1.1 1.2 1.8 1.8a* 1.0b 1.1ab 1.8ab
SEM 0.1 0.1 0.1 0.4 0.3 0.1 0.2 0.4LBP Fold change 2.5 2.2 1.4 1.2 1.2 1.4 1.2 2.7
SEM 0.7 0.7 0.4 0.3 0.1 0.4 0.5 0.2LY96 Fold change 1.0ab 1.1a* 0.9ab 1.0b
SEM 0.0 0.0 0.1 0.0TLR2 Fold change 5.7 1.7*** 6.9* 1.5 5.0* 2.0* 2.8 2.2*
SEM 2.1 0.1 3.3 0.2 2.1 0.3 0.9 0.4OthersMX1 Fold change 2.8 1.6* 1.2 1.5 4.4* 3.5** 3.1 2.9
SEM 1.4 0.2 0.3 0.4 1.4 0.8 1.1 1.3MX2 Fold change 11.6* 2.0* 1.5 1.8 8.6*** 8.3* 6.5 3.9
SEM 7.6 0.5 0.4 0.6 2.3 2.8 3.3 1.6S100A9 Fold change 3.9** 2.4 8.6* 2.1 12.0*** 12.6* 14.2 20.4
SEM 0.8 0.9 4.0 0.6 4.1 4.1 6.0 15.9S100A12 Fold change 2 MD2 6.5 2.6 4.2** 2.1 5.1 1.7
SEM 0.5 MD 3.1 1.0 0.9 1.2 1.4 0.5Regulated genes3 14 14 10 6 22 18 11 12
Note: BS = Brown Swiss (n = 6), RH = Red Holstein (n = 6), WP =White Park (n = 5), HLD =Highland (n = 5); Stars indicate significant differencesbetween treated and control dCq: *P < 0.05, **P < 0.01, ***P < 0.001. Fold change means with different subscript letters differ between breeds(P < 0.05).1Empty genes: no significant breed differences in expression fold changes and no fold changes >1.5 at this time point.2Missing data.3P < 0.05 for dCq difference between treatment and control.
98 D. Sorg et al.
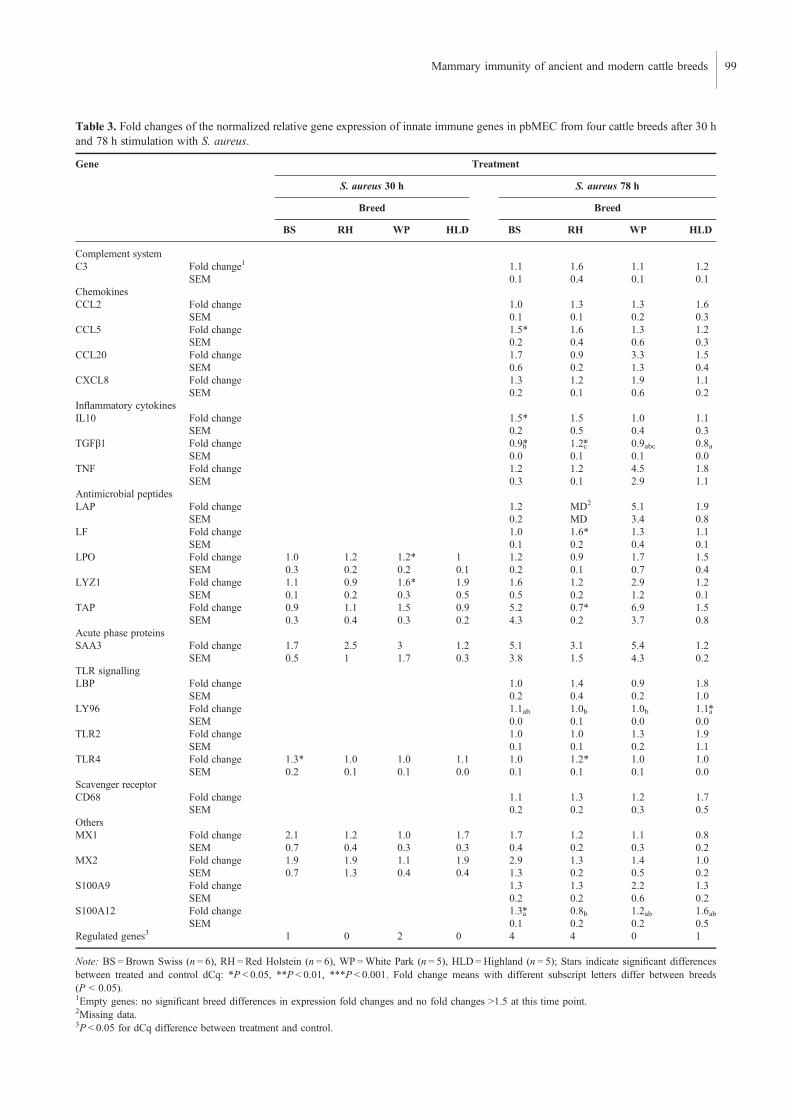
Table 3. Fold changes of the normalized relative gene expression of innate immune genes in pbMEC from four cattle breeds after 30 hand 78 h stimulation with S. aureus.
Gene Treatment
S. aureus 30 h S. aureus 78 h
Breed Breed
BS RH WP HLD BS RH WP HLD
Complement systemC3 Fold change1 1.1 1.6 1.1 1.2
SEM 0.1 0.4 0.1 0.1ChemokinesCCL2 Fold change 1.0 1.3 1.3 1.6
SEM 0.1 0.1 0.2 0.3CCL5 Fold change 1.5* 1.6 1.3 1.2
SEM 0.2 0.4 0.6 0.3CCL20 Fold change 1.7 0.9 3.3 1.5
SEM 0.6 0.2 1.3 0.4CXCL8 Fold change 1.3 1.2 1.9 1.1
SEM 0.2 0.1 0.6 0.2Inflammatory cytokinesIL10 Fold change 1.5* 1.5 1.0 1.1
SEM 0.2 0.5 0.4 0.3TGFβ1 Fold change 0.9b* 1.2c* 0.9abc 0.8a
SEM 0.0 0.1 0.1 0.0TNF Fold change 1.2 1.2 4.5 1.8
SEM 0.3 0.1 2.9 1.1Antimicrobial peptidesLAP Fold change 1.2 MD2 5.1 1.9
SEM 0.2 MD 3.4 0.8LF Fold change 1.0 1.6* 1.3 1.1
SEM 0.1 0.2 0.4 0.1LPO Fold change 1.0 1.2 1.2* 1 1.2 0.9 1.7 1.5
SEM 0.3 0.2 0.2 0.1 0.2 0.1 0.7 0.4LYZ1 Fold change 1.1 0.9 1.6* 1.9 1.6 1.2 2.9 1.2
SEM 0.1 0.2 0.3 0.5 0.5 0.2 1.2 0.1TAP Fold change 0.9 1.1 1.5 0.9 5.2 0.7* 6.9 1.5
SEM 0.3 0.4 0.3 0.2 4.3 0.2 3.7 0.8Acute phase proteinsSAA3 Fold change 1.7 2.5 3 1.2 5.1 3.1 5.4 1.2
SEM 0.5 1 1.7 0.3 3.8 1.5 4.3 0.2TLR signallingLBP Fold change 1.0 1.4 0.9 1.8
SEM 0.2 0.4 0.2 1.0LY96 Fold change 1.1ab 1.0b 1.0b 1.1a*
SEM 0.0 0.1 0.0 0.0TLR2 Fold change 1.0 1.0 1.3 1.9
SEM 0.1 0.1 0.2 1.1TLR4 Fold change 1.3* 1.0 1.0 1.1 1.0 1.2* 1.0 1.0
SEM 0.2 0.1 0.1 0.0 0.1 0.1 0.1 0.0Scavenger receptorCD68 Fold change 1.1 1.3 1.2 1.7
SEM 0.2 0.2 0.3 0.5OthersMX1 Fold change 2.1 1.2 1.0 1.7 1.7 1.2 1.1 0.8
SEM 0.7 0.4 0.3 0.3 0.4 0.2 0.3 0.2MX2 Fold change 1.9 1.9 1.1 1.9 2.9 1.3 1.4 1.0
SEM 0.7 1.3 0.4 0.4 1.3 0.2 0.5 0.2S100A9 Fold change 1.3 1.3 2.2 1.3
SEM 0.2 0.2 0.6 0.2S100A12 Fold change 1.3a* 0.8b 1.2ab 1.6ab
SEM 0.1 0.2 0.2 0.5Regulated genes3 1 0 2 0 4 4 0 1
Note: BS = Brown Swiss (n = 6), RH = Red Holstein (n = 6), WP =White Park (n = 5), HLD =Highland (n = 5); Stars indicate significant differencesbetween treated and control dCq: *P < 0.05, **P < 0.01, ***P < 0.001. Fold change means with different subscript letters differ between breeds(P < 0.05).1Empty genes: no significant breed differences in expression fold changes and no fold changes >1.5 at this time point.2Missing data.3P < 0.05 for dCq difference between treatment and control.
Mammary immunity of ancient and modern cattle breeds 99
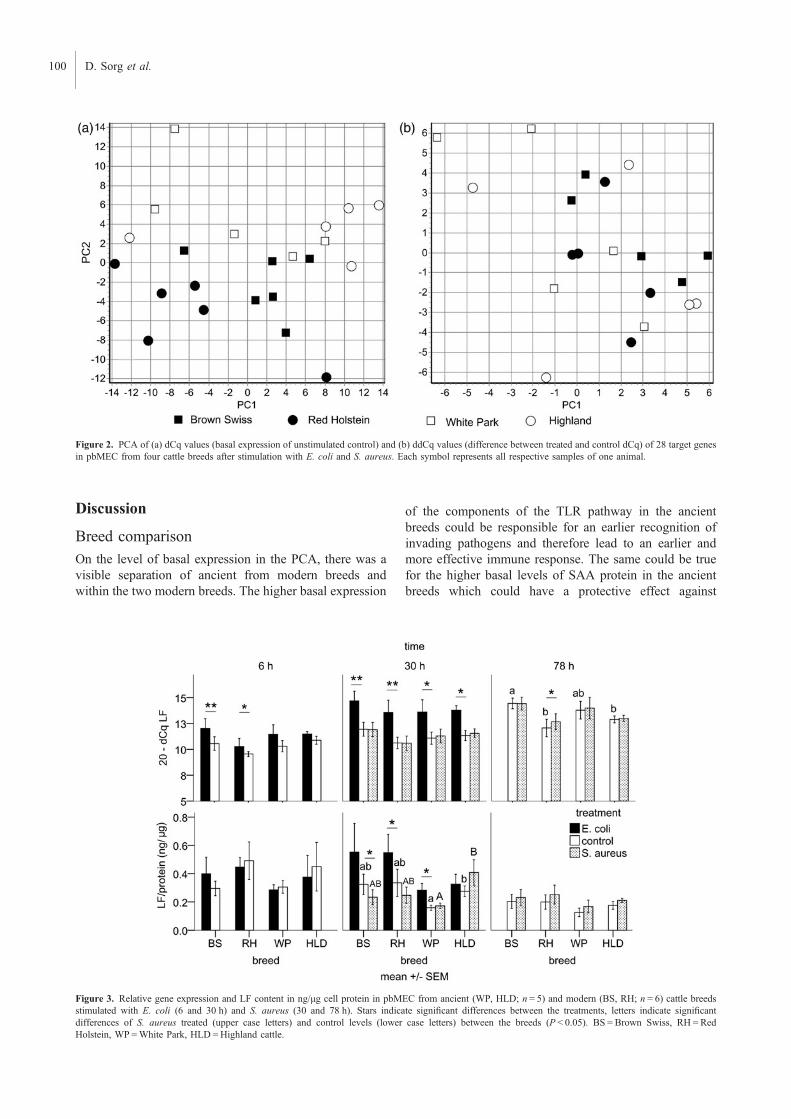
Discussion
Breed comparison
On the level of basal expression in the PCA, there was avisible separation of ancient from modern breeds andwithin the two modern breeds. The higher basal expression
of the components of the TLR pathway in the ancientbreeds could be responsible for an earlier recognition ofinvading pathogens and therefore lead to an earlier andmore effective immune response. The same could be truefor the higher basal levels of SAA protein in the ancientbreeds which could have a protective effect against
Figure 2. PCA of (a) dCq values (basal expression of unstimulated control) and (b) ddCq values (difference between treated and control dCq) of 28 target genesin pbMEC from four cattle breeds after stimulation with E. coli and S. aureus. Each symbol represents all respective samples of one animal.
Figure 3. Relative gene expression and LF content in ng/μg cell protein in pbMEC from ancient (WP, HLD; n = 5) and modern (BS, RH; n = 6) cattle breedsstimulated with E. coli (6 and 30 h) and S. aureus (30 and 78 h). Stars indicate significant differences between the treatments, letters indicate significantdifferences of S. aureus treated (upper case letters) and control levels (lower case letters) between the breeds (P < 0.05). BS = Brown Swiss, RH = RedHolstein, WP =White Park, HLD =Highland cattle.
100 D. Sorg et al.
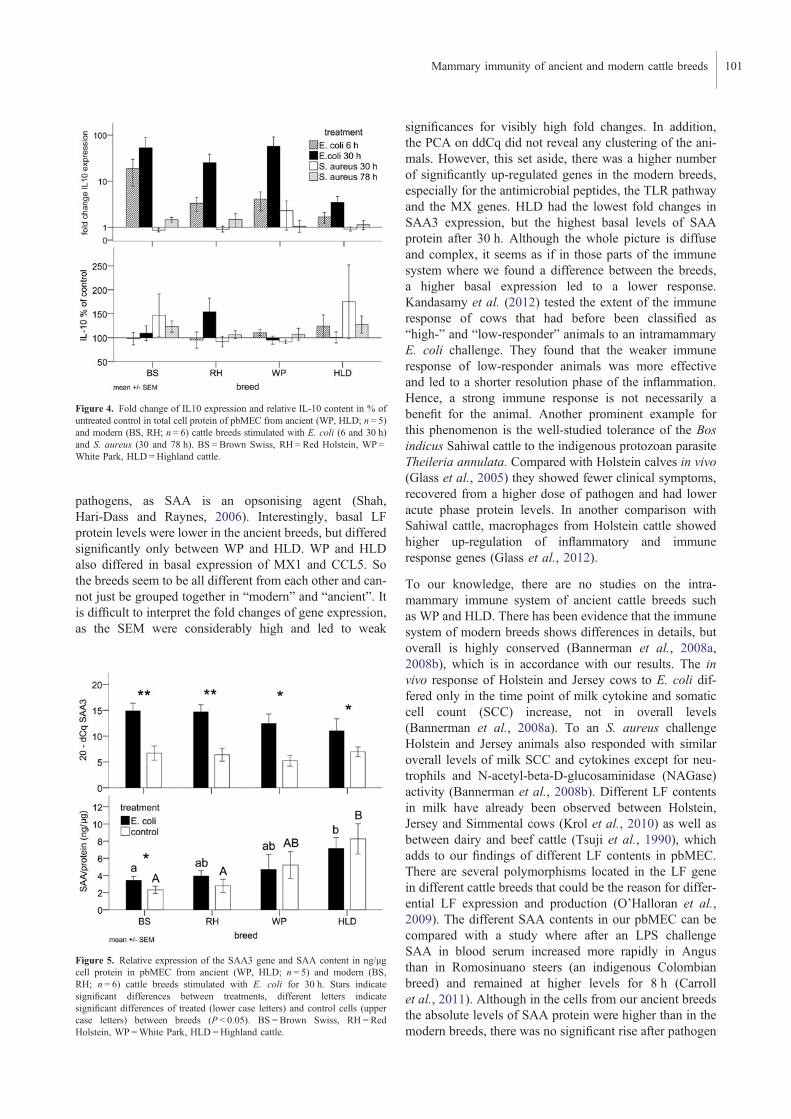
pathogens, as SAA is an opsonising agent (Shah,Hari-Dass and Raynes, 2006). Interestingly, basal LFprotein levels were lower in the ancient breeds, but differedsignificantly only between WP and HLD. WP and HLDalso differed in basal expression of MX1 and CCL5. Sothe breeds seem to be all different from each other and can-not just be grouped together in “modern” and “ancient”. Itis difficult to interpret the fold changes of gene expression,as the SEM were considerably high and led to weak
significances for visibly high fold changes. In addition,the PCA on ddCq did not reveal any clustering of the ani-mals. However, this set aside, there was a higher numberof significantly up-regulated genes in the modern breeds,especially for the antimicrobial peptides, the TLR pathwayand the MX genes. HLD had the lowest fold changes inSAA3 expression, but the highest basal levels of SAAprotein after 30 h. Although the whole picture is diffuseand complex, it seems as if in those parts of the immunesystem where we found a difference between the breeds,a higher basal expression led to a lower response.Kandasamy et al. (2012) tested the extent of the immuneresponse of cows that had before been classified as“high-” and “low-responder” animals to an intramammaryE. coli challenge. They found that the weaker immuneresponse of low-responder animals was more effectiveand led to a shorter resolution phase of the inflammation.Hence, a strong immune response is not necessarily abenefit for the animal. Another prominent example forthis phenomenon is the well-studied tolerance of the Bosindicus Sahiwal cattle to the indigenous protozoan parasiteTheileria annulata. Compared with Holstein calves in vivo(Glass et al., 2005) they showed fewer clinical symptoms,recovered from a higher dose of pathogen and had loweracute phase protein levels. In another comparison withSahiwal cattle, macrophages from Holstein cattle showedhigher up-regulation of inflammatory and immuneresponse genes (Glass et al., 2012).
To our knowledge, there are no studies on the intra-mammary immune system of ancient cattle breeds suchas WP and HLD. There has been evidence that the immunesystem of modern breeds shows differences in details, butoverall is highly conserved (Bannerman et al., 2008a,2008b), which is in accordance with our results. The invivo response of Holstein and Jersey cows to E. coli dif-fered only in the time point of milk cytokine and somaticcell count (SCC) increase, not in overall levels(Bannerman et al., 2008a). To an S. aureus challengeHolstein and Jersey animals also responded with similaroverall levels of milk SCC and cytokines except for neu-trophils and N-acetyl-beta-D-glucosaminidase (NAGase)activity (Bannerman et al., 2008b). Different LF contentsin milk have already been observed between Holstein,Jersey and Simmental cows (Krol et al., 2010) as well asbetween dairy and beef cattle (Tsuji et al., 1990), whichadds to our findings of different LF contents in pbMEC.There are several polymorphisms located in the LF genein different cattle breeds that could be the reason for differ-ential LF expression and production (O’Halloran et al.,2009). The different SAA contents in our pbMEC can becompared with a study where after an LPS challengeSAA in blood serum increased more rapidly in Angusthan in Romosinuano steers (an indigenous Colombianbreed) and remained at higher levels for 8 h (Carrollet al., 2011). Although in the cells from our ancient breedsthe absolute levels of SAA protein were higher than in themodern breeds, there was no significant rise after pathogen
Figure 4. Fold change of IL10 expression and relative IL-10 content in % ofuntreated control in total cell protein of pbMEC from ancient (WP, HLD; n = 5)and modern (BS, RH; n = 6) cattle breeds stimulated with E. coli (6 and 30 h)and S. aureus (30 and 78 h). BS = Brown Swiss, RH = Red Holstein, WP =White Park, HLD = Highland cattle.
Figure 5. Relative expression of the SAA3 gene and SAA content in ng/μgcell protein in pbMEC from ancient (WP, HLD; n = 5) and modern (BS,RH; n = 6) cattle breeds stimulated with E. coli for 30 h. Stars indicatesignificant differences between treatments, different letters indicatesignificant differences of treated (lower case letters) and control cells (uppercase letters) between breeds (P < 0.05). BS = Brown Swiss, RH = RedHolstein, WP =White Park, HLD =Highland cattle.
Mammary immunity of ancient and modern cattle breeds 101

stimulation. Cattle breed differences in gene expressionand protein production of the immune system have notbeen systematically studied so far, but our findings andthe above-mentioned studies show that there is evidencefor such diversity.
The considerable animal differences within each breed,reflected by the high SEMs and by the wide spread ofthe symbols representing animals in the PCAs, could beexplained by the existence of a substantial between-cowvariation in the immune response which has already beenshown for Holstein cattle in vitro and in vivo(Kandasamy et al., 2012). It could be caused by geneticpolymorphisms that are linked to a certain breed, butcould also be spread all over the cattle population.Furthermore, it has been suggested that a proportion ofunexplained phenotypic variation in the dairy cow isbecause of epigenetic regulation (Singh et al., 2010).
General remarks about the immune response
C3, chemokines, inflammatory cytokines and the inflam-mation marker SAA3 experienced a strong up-regulationby E. coli in all the breeds. The antimicrobial peptideswere also strongly up-regulated after 30 h in E. coli treatedcells. This confirms that our pbMEC continued to exertsentinel functions to trigger the innate immune responseupon pathogen recognition as well as an active defenceby attacking and opsonising bacterial cells. Interestingly,in our study the TLR pathway was not as markedly regu-lated, although it is one of the starting points of theimmune signalling cascade and has been shown to be asource for potential mastitis resistance (Griesbeck-Zilchet al., 2009). However, in another study the regulation ofTLRs in pbMECs was similarly weak, but the authorsstill concluded that there was a functioning and locallyeffective immune system (Strandberg et al., 2005). Wealso found a regulation of the genes we had termed as“others”. The calcium-binding, pro-inflammatory, regulat-ory and anti-oxidant S100 calcium-binding proteins A9(S100-A9) and A12 (S100-A12) seem to be a class of pro-tective and defence proteins (Hsu et al., 2009) that act inaddition to LF, lysozyme 1 (LYZ1), LPO and theβ-defensins lingual antimicrobial peptide (LAP) and tra-cheal antimicrobial peptide (TAP). The antiviral myxo-virus (influenza virus) resistance 2 (mouse) gene (MX2)has a yet unknown role in mastitis and remains a subjectof further research.
Pathogen comparison
It has previously been shown that S. aureus elicits a differentand often weaker immune response than E. coli in vitro(Griesbeck-Zilch et al., 2008) and in vivo (Petzl et al.,2008). The dose of inoculum could have been too low sothat the cells did not receive enough signals to trigger theresponse. Our results can be compared with a similar studywith pbMEC from milk and the same strains of pathogens
(Danowski et al., 2012a): in that study, too, the immuneresponse to S. aureus was much weaker than to E. coli.Our data support the hypothesis that the often subclinicaland chronic outcome of S. aureus mastitis is caused bythis reduced reaction of the mammary immune system.
Gene expression and protein comparison
LF gene expression was generally better reflected by theELISA measurements than the other two proteins.Although IL10 gene expression was significantlyup-regulated in the two modern breeds there was no con-sistent rise of the protein in cell content. SAA3 expressionwas up-regulated by E. coli after 30 h, but the proteinlevels reflected that only in BS and RH. For all thesethree genes (in SAA for the SAA encoding-gene SAA2)microRNAs have been identified that could lead to adifferential expression, translation and massive variationin protein levels (Longley, Steel and Whitehead, 1999;Sharma et al., 2009; Liao, Du and Lonnerdal, 2010).These microRNAs could also be differentially expressedbetween the breeds and determine the breed differencesin mRNA expression. LF was also secreted into themedia, but the concentrations were mostly below themeasuring range (data not shown). This and a delaybetween mRNA expression and protein synthesis of thethree genes could also account for the differences.
Conclusions
To our knowledge this is the first time that the mammaryimmune system of the ancient WP and HLD cattle wasstudied in vitro. The four breeds BS, RH, WP and HLDwere found to differ in parts of the gene expression andprotein production. A higher basal expression of somegenes and proteins in the cells from the ancient breedsseemed to lead to a lower immune response after pathogenrecognition. However, the main immune system pathwaysthat were activated were the same, indicating that the com-plex network of immune response is to some extent con-served between the Bos taurus breeds. With thisexperimental setup it is possible to study other breedsand other pathogens in the same way, especially with thenon-invasive pbMEC extraction from milk which is suit-able for the sampling of valuable animals of rare breeds.We confirmed the existence of previously described sub-stantial cow-to-cow variation in immune response. Theclassification of high- and low-responder animals and theunderlying genetic and epigenetic mechanisms remainsubject to further analysis.
Acknowledgments
We thank Dr Wolfram Petzl (Ludwigs-Maximilians-Universität München, Germany) for donating the bacteria
102 D. Sorg et al.

and Katrin Danowski for donating primer pair oligos. Ourspecial thanks go to the whole staff of Arche Warder forhandling the animals and general support with the sampling.This work was supported by the “Vereinigung zurFörderung der Milchwissenschaftlichen Forschung an derTU München e. V.” (Freising, Germany); the “Drs.Bruns-Stiftung” (Steinfeld, Germany) and the “Dr.-Ing.Leonhard-Lorenz-Stiftung” (Garching, Germany).
Conflict of Interest statement
The authors declare that there is no conflict of interest.
Supplementary material
Supplementary materials of this paper is available at http://journals.cambridge.org/agr
References
Alderson, G.L.H. 1997. A breed of distinction: White Park cattle ancientand modern. Countrywide Livestock Ltd., Shrewsbury, UK.
Bannerman, D.D., Paape, M.J., Lee, J.W., Zhao, X., Hope, J.C. &Rainard, P. 2004. Escherichia coli and Staphylococcus aureus elicitdifferential innate immune responses following intramammary infec-tion. Clinical and Diagnostic Laboratory Immunology 11: 463–472.
Bannerman, D.D., Kauf, A.C., Paape, M.J., Springer, H.R. & Goff,J.P. 2008a. Comparison of Holstein and Jersey innate immuneresponses to Escherichia coli intramammary infection. Journal ofDairy Science 91: 2225–2235.
Bannerman, D.D., Springer, H.R., Paape, M.J., Kauf, A.C. & Goff,J.P. 2008b. Evaluation of breed-dependent differences in the innateimmune responses of Holstein and Jersey cows to Staphylococcusaureus intramammary infection. Journal of Dairy Research 75:291–301.
Biedermann, G., Hecht, W., Fandrey, E., Rudolph, H. & Frolich, K.2009. Population genetic analysis of White Park cattle in Germany.Archiv Fur Tierzucht-Archives of Animal Breeding 52: 561–573.
BLE. 2012. Central documentation on animal genetic resources inGermany – domestic animals. Bundesanstalt für Landwirtschaft undErnährung (BLE), Bonn, Germany (available at http://tgrdeu.genres.de/hausundnutztiere/rind).
Buehring, G.C. 1990. Culture of mammary epithelial cells from bovinemilk. Journal of Dairy Science 73: 956–963.
Burvenich, C., Van Merris, V., Mehrzad, J., Diez-Fraile, A. &Duchateau, L. 2003. Severity of E. coli mastitis is mainly determinedby cow factors. Veterinary Research 34: 521–564.
Bustin, S.A., Benes, V., Garson, J.A., Hellemans, J., Huggett, J.,Kubista, M., Mueller, R., Nolan, T., Pfaffl, M.W., Shipley, G.L.,Vandesompele, J. & Wittwer, C.T. 2009. The MIQE guidelines:minimum information for publication of quantitative real-time PCRexperiments. Clinical Chemistry 55: 611–622.
Carroll, J.A., Burdick, N.C., Reuter, R.R., Chase Jr, C.C., Spiers, D.E.,Arthington, J.D. & Coleman, S.W. 2011. Differential acute phaseimmune responses by Angus and Romosinuano steers following anendotoxin challenge. Domestic Animal Endocrinology 41: 163–173.
Danowski, K., Sorg, D., Gross, J., Meyer, H.H.D. & Kliem, H. 2012a.Innate defense capability of challenged primary bovine mammary epi-thelial cells after an induced negative energy balance in vivo. CzechJournal of Animal Science 57: 207–220.
Danowski, K., Gross, J.J., Meyer, H.H.D. & Kliem, H. 2012b. Effectsof induced energy deficiency on lactoferrin concentration in milk andthe lactoferrin reaction of primary bovine mammary epithelial cells invitro. Journal of Animal Physiology and Animal Nutrition [Epubahead of Print], DOI: 10.1111/j.1439-0396.2012.01305.x.
Dimmer, E.C., Huntley, R.P., Alam-Faruque, Y., Sawford, T.,O’Donovan, C., Martin, M.J., Bely, B., Browne, P., Mun Chan,W., Eberhardt, R., Gardner, M., Laiho, K., Legge, D.,Magrane, M., Pichler, K., Poggioli, D., Sehra, H., Auchincloss,A., Axelsen, K., Blatter, M.C., Boutet, E., Braconi-Quintaje, S.,Breuza, L., Bridge, A., Coudert, E., Estreicher, A., Famiglietti,L., Ferro-Rojas, S., Feuermann, M., Gos, A., Gruaz-Gumowski,N., Hinz, U., Hulo, C., James, J., Jimenez, S., Jungo, F., Keller,G., Lemercier, P., Lieberherr, D., Masson, P., Moinat, M.,Pedruzzi, I., Poux, S., Rivoire, C., Roechert, B., Schneider, M.,Stutz, A., Sundaram, S., Tognolli, M., Bougueleret, L.,Argoud-Puy, G., Cusin, I., Duek-Roggli, P., Xenarios, I. &Apweiler, R. 2012. The UniProt-GO Annotation database in 2011.Nucleic Acids Research 40: D565–D570.
Dohner, J. 2001. The encyclopedia of historic and endangered livestockand poultry breeds. Yale University Press, New Haven, USA.
European Brown Swiss Federation. 2012. Brown Swiss from Europemeans: protein, longevity, functionality. European Brown SwissFederation, Bussolengo, Italia (available at http://www.brown-swiss.org/WhyBrownSwiss/brochure_ING.pdf).
FAO. 2000. World watch list for domestic animal diversity. Food andAgriculture Organization of the United Nations, Rome, Italy (avail-able at http://www.fao.org/docrep/009/x8750e/x8750e00.htm).
German Holstein Association. 2010. German Holsteins 2010 facts &figures. German Holstein Association, Bonn, Germany (available athttp://www.holstein-dhv.de/downloads.html).
Glass, E.J., Crutchley, S. & Jensen, K. 2012. Living with the enemy oruninvited guests: functional genomics approaches to investigating hostresistance or tolerance traits to a protozoan parasite, Theileria annu-lata, in cattle. Veterinary Immunology and Immunopathology 148:178–189.
Glass, E.J., Preston, P.M., Springbett, A., Craigmile, S., Kirvar, E.,Wilkie, G. & Brown, C.G.D. 2005. Bos taurus and Bos indicus(Sahiwal) calves respond differently to infection with Theileria annu-lata and produce markedly different levels of acute phase proteins.International Journal for Parasitology 35: 337–347.
Griesbeck-Zilch, B., Meyer, H.H., Kuhn, C.H., Schwerin, M. &Wellnitz, O. 2008. Staphylococcus aureus and Escherichia colicause deviating expression profiles of cytokines and lactoferrin mes-senger ribonucleic acid in mammary epithelial cells. Journal ofDairy Science 91: 2215–2224.
Griesbeck-Zilch, B., Osman, M., Kuhn, C., Schwerin, M.,Bruckmaier, R.H., Pfaffl, M.W., Hammerle-Fickinger, A.,Meyer, H.H. & Wellnitz, O. 2009. Analysis of key molecules ofthe innate immune system in mammary epithelial cells isolated frommarker-assisted and conventionally selected cattle. Journal of DairyScience 92: 4621–4633.
Groebner, A.E., Schulke, K., Schefold, J.C., Fusch, G., Sinowatz, F.,Reichenbach, H.D., Wolf, E., Meyer, H.H. & Ulbrich, S.E. 2011.Immunological mechanisms to establish embryo tolerance in earlybovine pregnancy. Reproduction, Fertility and Development 23:619–632.
Gunther, J., Esch, K., Poschadel, N., Petzl, W., Zerbe, H.,Mitterhuemer, S., Blum, H. & Seyfert, H.M. 2011. Comparative
Mammary immunity of ancient and modern cattle breeds 103
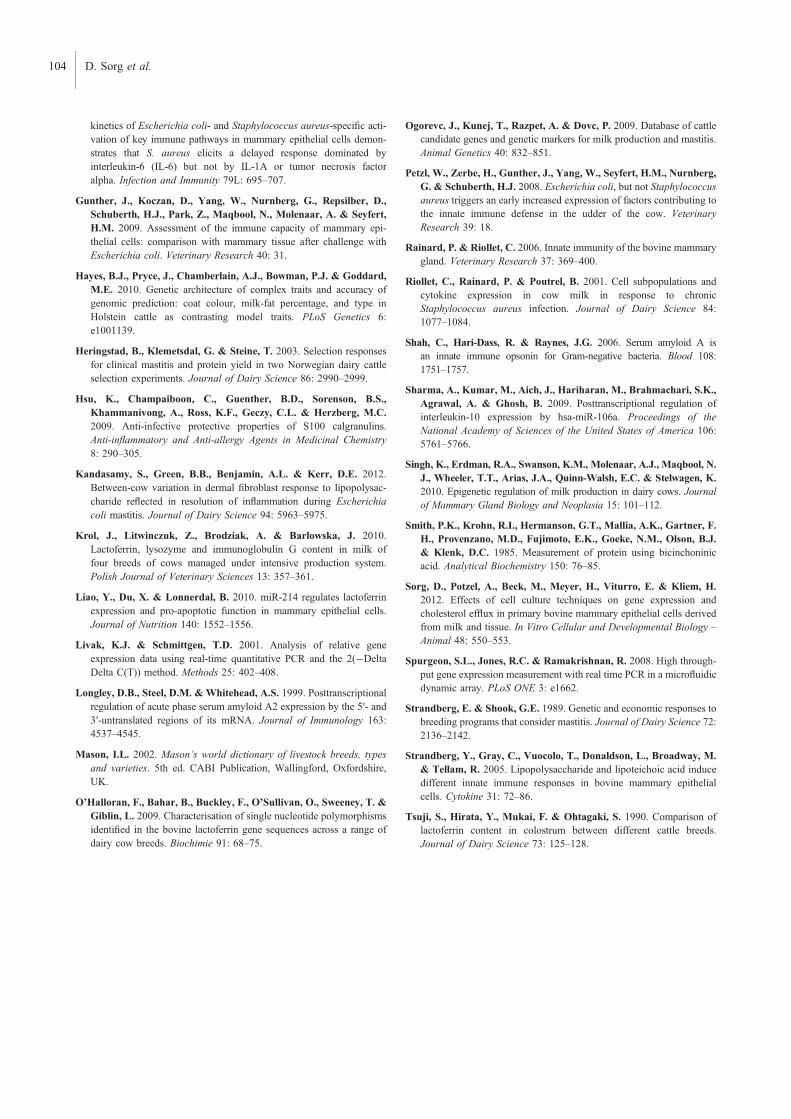
kinetics of Escherichia coli- and Staphylococcus aureus-specific acti-vation of key immune pathways in mammary epithelial cells demon-strates that S. aureus elicits a delayed response dominated byinterleukin-6 (IL-6) but not by IL-1A or tumor necrosis factoralpha. Infection and Immunity 79L: 695–707.
Gunther, J., Koczan, D., Yang, W., Nurnberg, G., Repsilber, D.,Schuberth, H.J., Park, Z., Maqbool, N., Molenaar, A. & Seyfert,H.M. 2009. Assessment of the immune capacity of mammary epi-thelial cells: comparison with mammary tissue after challenge withEscherichia coli. Veterinary Research 40: 31.
Hayes, B.J., Pryce, J., Chamberlain, A.J., Bowman, P.J. & Goddard,M.E. 2010. Genetic architecture of complex traits and accuracy ofgenomic prediction: coat colour, milk-fat percentage, and type inHolstein cattle as contrasting model traits. PLoS Genetics 6:e1001139.
Heringstad, B., Klemetsdal, G. & Steine, T. 2003. Selection responsesfor clinical mastitis and protein yield in two Norwegian dairy cattleselection experiments. Journal of Dairy Science 86: 2990–2999.
Hsu, K., Champaiboon, C., Guenther, B.D., Sorenson, B.S.,Khammanivong, A., Ross, K.F., Geczy, C.L. & Herzberg, M.C.2009. Anti-infective protective properties of S100 calgranulins.Anti-inflammatory and Anti-allergy Agents in Medicinal Chemistry8: 290–305.
Kandasamy, S., Green, B.B., Benjamin, A.L. & Kerr, D.E. 2012.Between-cow variation in dermal fibroblast response to lipopolysac-charide reflected in resolution of inflammation during Escherichiacoli mastitis. Journal of Dairy Science 94: 5963–5975.
Krol, J., Litwinczuk, Z., Brodziak, A. & Barlowska, J. 2010.Lactoferrin, lysozyme and immunoglobulin G content in milk offour breeds of cows managed under intensive production system.Polish Journal of Veterinary Sciences 13: 357–361.
Liao, Y., Du, X. & Lonnerdal, B. 2010. miR-214 regulates lactoferrinexpression and pro-apoptotic function in mammary epithelial cells.Journal of Nutrition 140: 1552–1556.
Livak, K.J. & Schmittgen, T.D. 2001. Analysis of relative geneexpression data using real-time quantitative PCR and the 2(−DeltaDelta C(T)) method. Methods 25: 402–408.
Longley, D.B., Steel, D.M. & Whitehead, A.S. 1999. Posttranscriptionalregulation of acute phase serum amyloid A2 expression by the 5′- and3′-untranslated regions of its mRNA. Journal of Immunology 163:4537–4545.
Mason, I.L. 2002. Mason’s world dictionary of livestock breeds, typesand varieties. 5th ed. CABI Publication, Wallingford, Oxfordshire,UK.
O’Halloran, F., Bahar, B., Buckley, F., O’Sullivan, O., Sweeney, T. &Giblin, L. 2009. Characterisation of single nucleotide polymorphismsidentified in the bovine lactoferrin gene sequences across a range ofdairy cow breeds. Biochimie 91: 68–75.
Ogorevc, J., Kunej, T., Razpet, A. & Dovc, P. 2009. Database of cattlecandidate genes and genetic markers for milk production and mastitis.Animal Genetics 40: 832–851.
Petzl, W., Zerbe, H., Gunther, J., Yang, W., Seyfert, H.M., Nurnberg,G. & Schuberth, H.J. 2008. Escherichia coli, but not Staphylococcusaureus triggers an early increased expression of factors contributing tothe innate immune defense in the udder of the cow. VeterinaryResearch 39: 18.
Rainard, P. & Riollet, C. 2006. Innate immunity of the bovine mammarygland. Veterinary Research 37: 369–400.
Riollet, C., Rainard, P. & Poutrel, B. 2001. Cell subpopulations andcytokine expression in cow milk in response to chronicStaphylococcus aureus infection. Journal of Dairy Science 84:1077–1084.
Shah, C., Hari-Dass, R. & Raynes, J.G. 2006. Serum amyloid A isan innate immune opsonin for Gram-negative bacteria. Blood 108:1751–1757.
Sharma, A., Kumar, M., Aich, J., Hariharan, M., Brahmachari, S.K.,Agrawal, A. & Ghosh, B. 2009. Posttranscriptional regulation ofinterleukin-10 expression by hsa-miR-106a. Proceedings of theNational Academy of Sciences of the United States of America 106:5761–5766.
Singh, K., Erdman, R.A., Swanson, K.M., Molenaar, A.J., Maqbool, N.J., Wheeler, T.T., Arias, J.A., Quinn-Walsh, E.C. & Stelwagen, K.2010. Epigenetic regulation of milk production in dairy cows. Journalof Mammary Gland Biology and Neoplasia 15: 101–112.
Smith, P.K., Krohn, R.I., Hermanson, G.T., Mallia, A.K., Gartner, F.H., Provenzano, M.D., Fujimoto, E.K., Goeke, N.M., Olson, B.J.& Klenk, D.C. 1985. Measurement of protein using bicinchoninicacid. Analytical Biochemistry 150: 76–85.
Sorg, D., Potzel, A., Beck, M., Meyer, H., Viturro, E. & Kliem, H.2012. Effects of cell culture techniques on gene expression andcholesterol efflux in primary bovine mammary epithelial cells derivedfrom milk and tissue. In Vitro Cellular and Developmental Biology –Animal 48: 550–553.
Spurgeon, S.L., Jones, R.C. & Ramakrishnan, R. 2008. High through-put gene expression measurement with real time PCR in a microfluidicdynamic array. PLoS ONE 3: e1662.
Strandberg, E. & Shook, G.E. 1989. Genetic and economic responses tobreeding programs that consider mastitis. Journal of Dairy Science 72:2136–2142.
Strandberg, Y., Gray, C., Vuocolo, T., Donaldson, L., Broadway, M.& Tellam, R. 2005. Lipopolysaccharide and lipoteichoic acid inducedifferent innate immune responses in bovine mammary epithelialcells. Cytokine 31: 72–86.
Tsuji, S., Hirata, Y., Mukai, F. & Ohtagaki, S. 1990. Comparison oflactoferrin content in colostrum between different cattle breeds.Journal of Dairy Science 73: 125–128.
104 D. Sorg et al.