Legislative Council Panel on Economic Services HONG KONG ... · Legislative Council Panel on...
33
For discussion on 22 November 2004 Legislative Council Panel on Economic Services HONG KONG PORT – MASTER PLAN 2020 PURPOSE Our recently completed consultancy – “Study on Hong Kong Port – Master Plan 2020 (HKP2020 Study)” recommends a package of initiatives for port development up to the year of 2020 and beyond. This paper briefs Members on the key features of the recommendations and informs Members of the Government’s plan to conduct consultation on the Study findings. A copy of the Draft Executive Summary of the Study is attached for Members’ reference (Annex ). BACKGROUND 2. Since 1989, the Government has conducted four reviews on the Port Development Strategy to ensure that we responded to changing circumstances as the Hong Kong economy underwent transformation. 3. The last Port Development Strategy Review (PDSR) conducted in 2001 concluded that the Government needed to balance the various factors, such as economic benefits and environmental impacts, when devising a sustainable direction for port development. A follow-up study was recommended to identify and evaluate the best strategic options for taking forward Hong Kong’s port development plans. 4. We commissioned the HKP2020 Study which was completed recently. The main objective of the HKP2020 Study is to formulate a competitive and sustainable strategy and master plan for Hong Kong’s port development over a 20-year time frame. During the study, extensive industry consultations were conducted and the Port Development Council (PDC) and its Port Development Advisory Group were involved in steering the Study. Meetings with key LC Paper No. CB(1)230/04-05(04)
Transcript of Legislative Council Panel on Economic Services HONG KONG ... · Legislative Council Panel on...
For discussion on 22 November 2004
Legislative Council Panel on Economic Services
HONG KONG PORT – MASTER PLAN 2020 PURPOSE Our recently completed consultancy – “Study on Hong Kong Port – Master Plan 2020 (HKP2020 Study)” recommends a package of initiatives for port development up to the year of 2020 and beyond. This paper briefs Members on the key features of the recommendations and informs Members of the Government’s plan to conduct consultation on the Study findings. A copy of the Draft Executive Summary of the Study is attached for Members’ reference (Annex). BACKGROUND 2. Since 1989, the Government has conducted four reviews on the Port Development Strategy to ensure that we responded to changing circumstances as the Hong Kong economy underwent transformation. 3. The last Port Development Strategy Review (PDSR) conducted in 2001 concluded that the Government needed to balance the various factors, such as economic benefits and environmental impacts, when devising a sustainable direction for port development. A follow-up study was recommended to identify and evaluate the best strategic options for taking forward Hong Kong’s port development plans. 4. We commissioned the HKP2020 Study which was completed recently. The main objective of the HKP2020 Study is to formulate a competitive and sustainable strategy and master plan for Hong Kong’s port development over a 20-year time frame. During the study, extensive industry consultations were conducted and the Port Development Council (PDC) and its Port Development Advisory Group were involved in steering the Study. Meetings with key
LC Paper No. CB(1)230/04-05(04)
- 2 -
stakeholder groups were held to seek their comments on the findings and recommendations of the study. Their comments have been incorporated in the recommended strategy and Indicative Master Plan. STUDY FINDINGS 5. Key findings of the HKP2020 Study are summarized in the attached Draft Executive Summary and the key features are outlined below:-
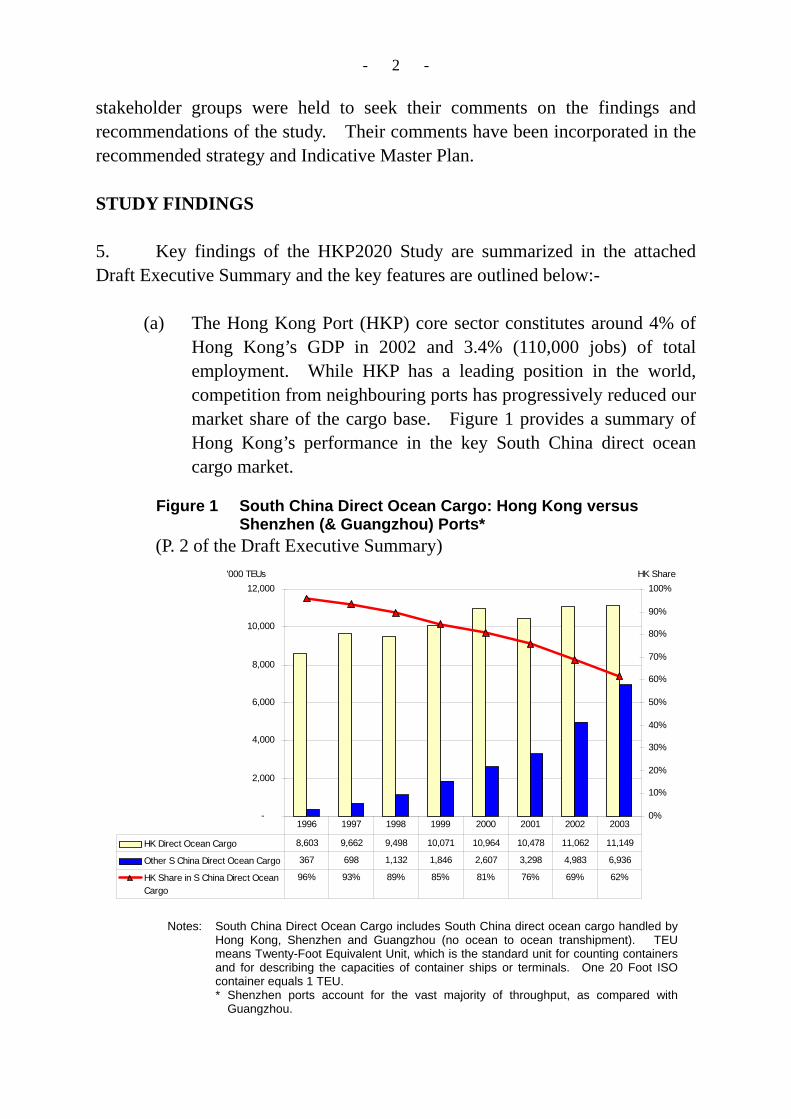
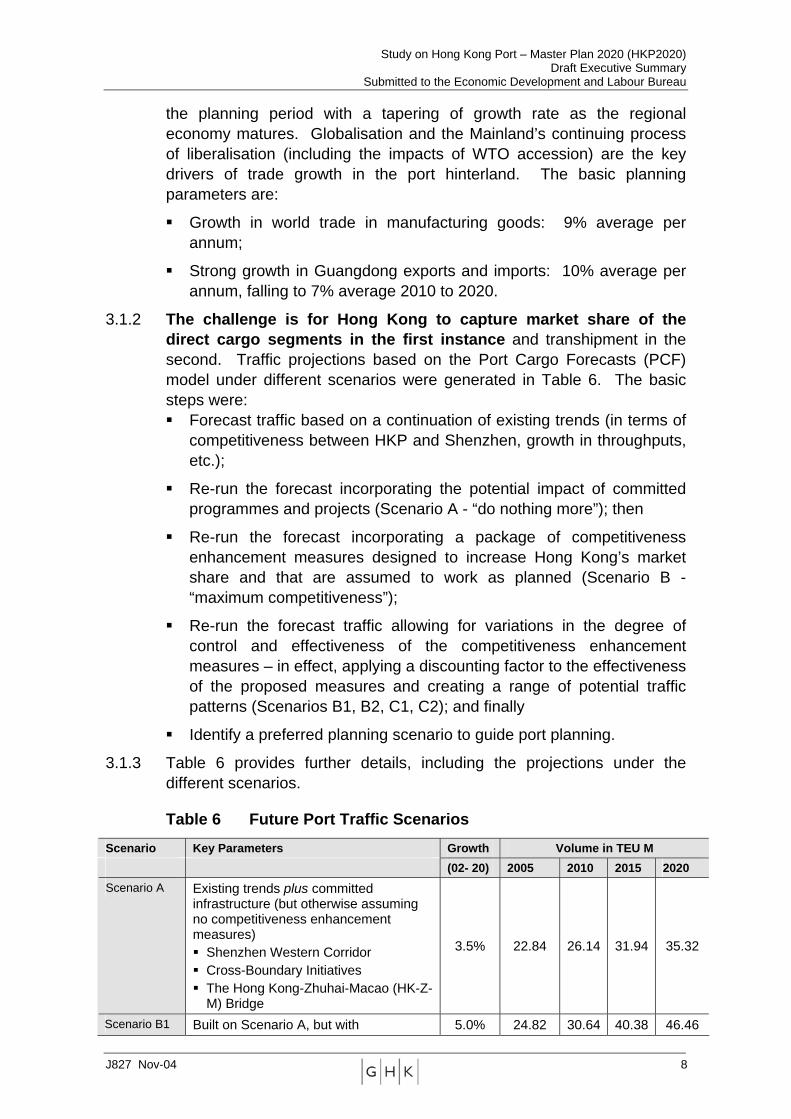
(a) The Hong Kong Port (HKP) core sector constitutes around 4% of Hong Kong’s GDP in 2002 and 3.4% (110,000 jobs) of total employment. While HKP has a leading position in the world, competition from neighbouring ports has progressively reduced our market share of the cargo base. Figure 1 provides a summary of Hong Kong’s performance in the key South China direct ocean cargo market.
Figure 1 South China Direct Ocean Cargo: Hong Kong versus
Shenzhen (& Guangzhou) Ports* (P. 2 of the Draft Executive Summary)
Notes: South China Direct Ocean Cargo includes South China direct ocean cargo handled by Hong Kong, Shenzhen and Guangzhou (no ocean to ocean transhipment). TEU means Twenty-Foot Equivalent Unit, which is the standard unit for counting containers and for describing the capacities of container ships or terminals. One 20 Foot ISO container equals 1 TEU.
* Shenzhen ports account for the vast majority of throughput, as compared with Guangzhou.
-
2,000
4,000
6,000
8,000
10,000
12,000'000 TEUs
0%
10%
20%
30%
40%
50%
60%
70%
80%
90%
100%HK Share
HK Direct Ocean Cargo 8,603 9,662 9,498 10,071 10,964 10,478 11,062 11,149
Other S China Direct Ocean Cargo 367 698 1,132 1,846 2,607 3,298 4,983 6,936
HK Share in S China Direct OceanCargo
96% 93% 89% 85% 81% 76% 69% 62%
1996 1997 1998 1999 2000 2001 2002 2003
- 3 -
(b) Market growth of non-container handling is limited. (c) The port choice focus is increasingly on total through cost
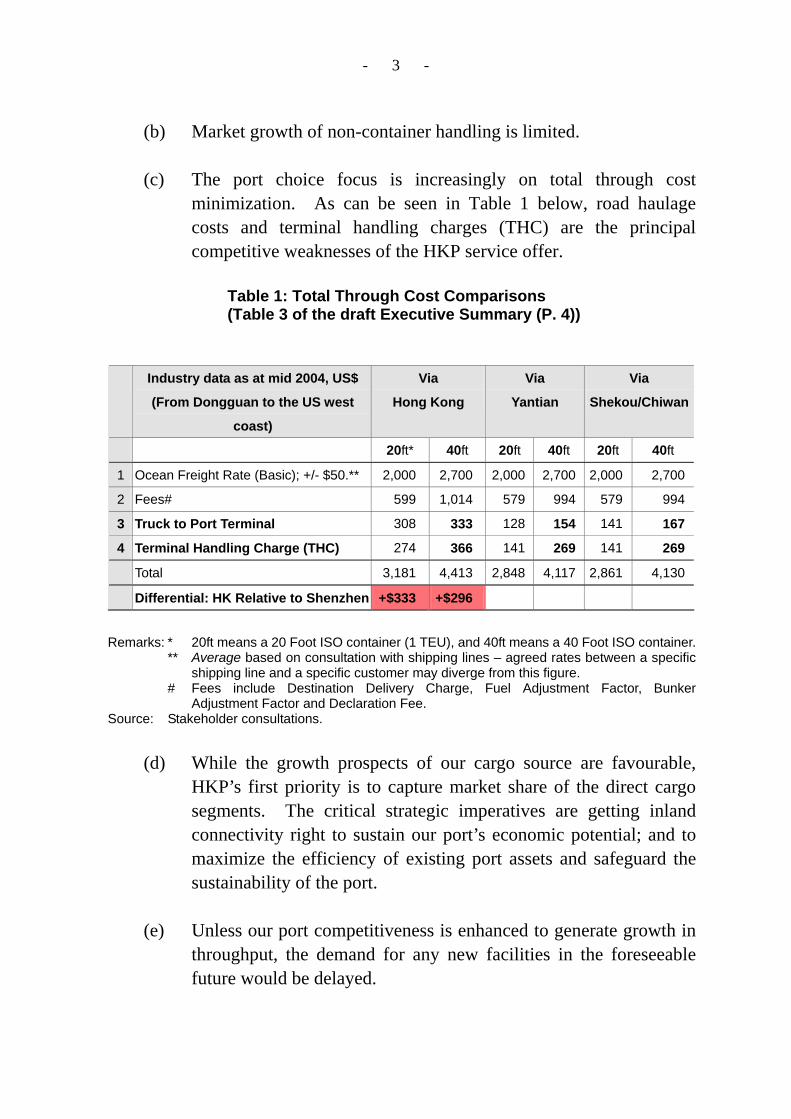
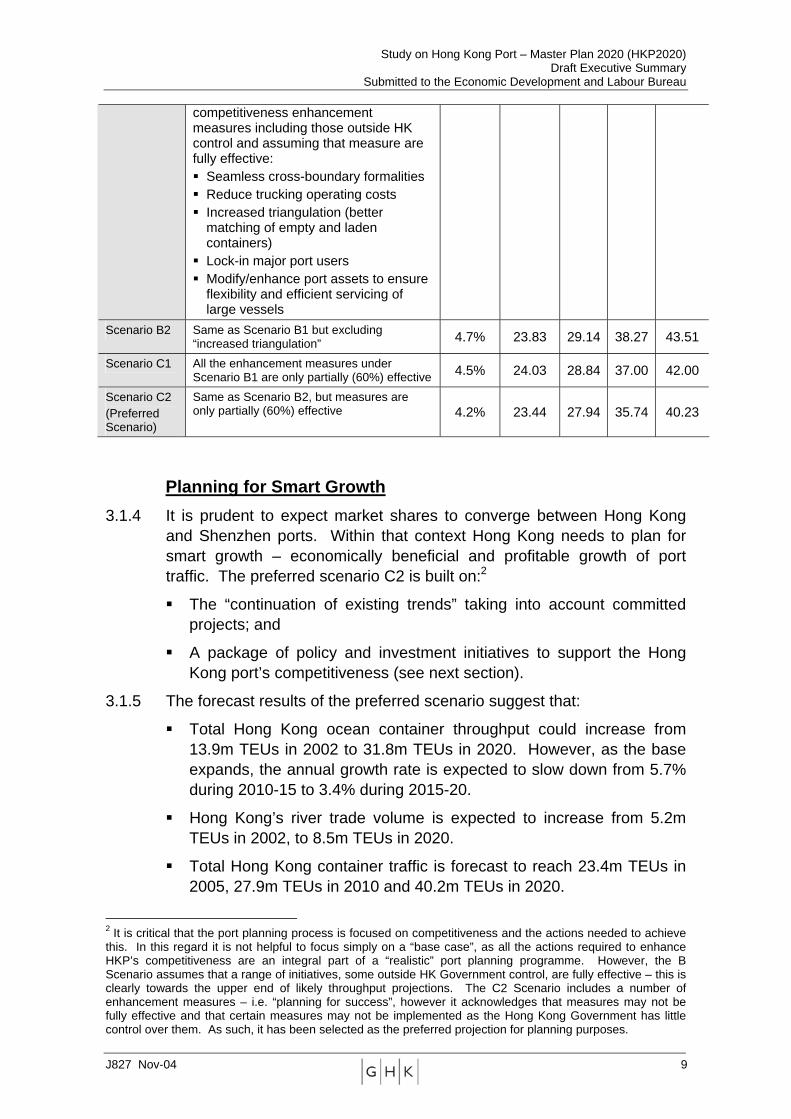
minimization. As can be seen in Table 1 below, road haulage costs and terminal handling charges (THC) are the principal competitive weaknesses of the HKP service offer.
Table 1: Total Through Cost Comparisons (Table 3 of the draft Executive Summary (P. 4))
Industry data as at mid 2004, US$
(From Dongguan to the US west
coast)
Via
Hong Kong
Via
Yantian
Via
Shekou/Chiwan
20ft* 40ft 20ft 40ft 20ft 40ft
1 Ocean Freight Rate (Basic); +/- $50.** 2,000 2,700 2,000 2,700 2,000 2,700
2 Fees# 599 1,014 579 994 579 994
3 Truck to Port Terminal 308 333 128 154 141 167
4 Terminal Handling Charge (THC) 274 366 141 269 141 269
Total 3,181 4,413 2,848 4,117 2,861 4,130
Differential: HK Relative to Shenzhen +$333 +$296
Remarks: * 20ft means a 20 Foot ISO container (1 TEU), and 40ft means a 40 Foot ISO container. ** Average based on consultation with shipping lines – agreed rates between a specific
shipping line and a specific customer may diverge from this figure. # Fees include Destination Delivery Charge, Fuel Adjustment Factor, Bunker
Adjustment Factor and Declaration Fee. Source: Stakeholder consultations.
(d) While the growth prospects of our cargo source are favourable,
HKP’s first priority is to capture market share of the direct cargo segments. The critical strategic imperatives are getting inland connectivity right to sustain our port’s economic potential; and to maximize the efficiency of existing port assets and safeguard the sustainability of the port.
(e) Unless our port competitiveness is enhanced to generate growth in
throughput, the demand for any new facilities in the foreseeable future would be delayed.
- 4 -
(f) Freight traffic projections based on the port cargo forecast model under different scenarios were generated. The preferred forecast scenario is built on the continuation of existing trends taking into account committed projects; and a package of policy and investment initiatives to support the HKP’s competitiveness (see paragraph 7). The preferred forecast scenario suggests that total Hong Kong container traffic could reach 23.4 million TEUs in 2005, 27.9 million TEUs in 2010 and 40.2 million TEUs in 2020.
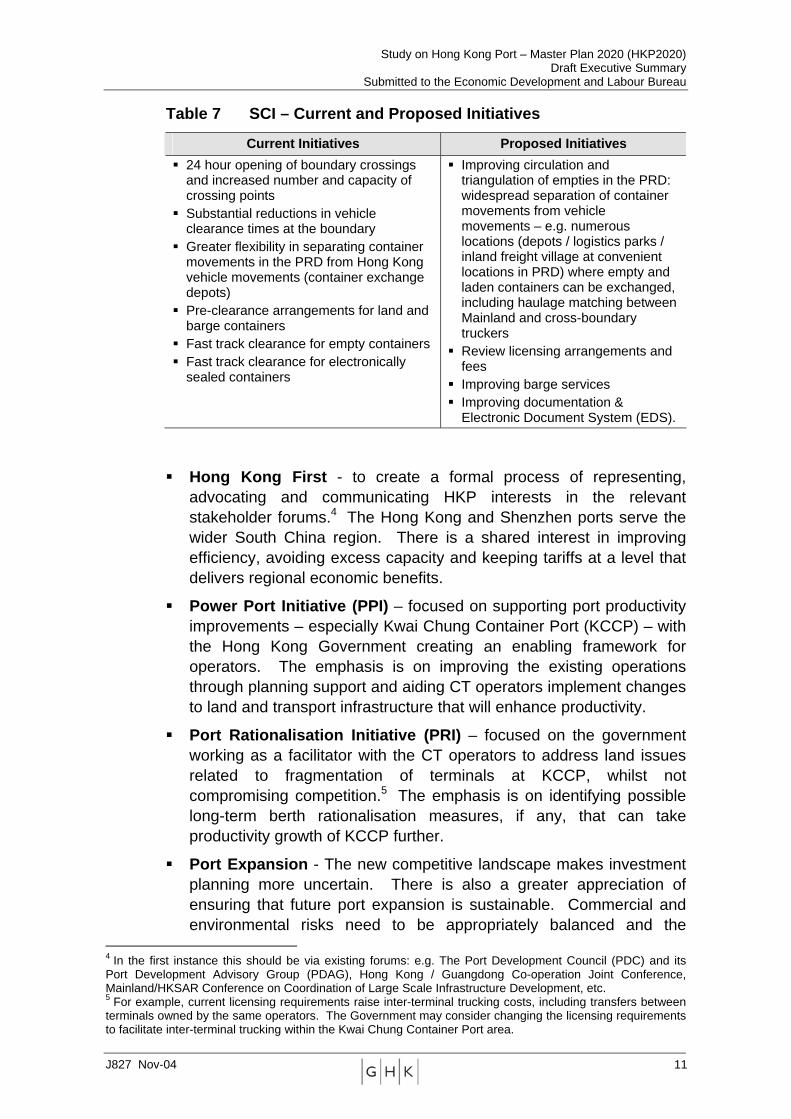
RECOMMENDED STRATEGY 6. The immediate and long-term initiatives to ensure HKP’s success as recommended by the Study are:
(a) Immediate: Super-connectivity Initiative (SCI) – building on current initiatives and implement complementary measures to improve boundary crossing, raise efficiency of trucking movements and seek to review licensing and registration fees including those levied by the Guangdong authorities to reduce inland transport costs to HKP. Improving inland connectivity is critical to the port’s future.
(b) Then: Hong Kong First - to create a formal process of
representing, advocating and communicating HKP interests in the relevant stakeholder forums. The Hong Kong and Shenzhen ports serve the wider South China region. There is a shared interest in improving efficiency, avoiding excess capacity and keeping tariffs at a level that delivers regional economic benefits.
(c) Also: Power Port Initiative – focus on supporting port
productivity improvements – especially Kwai Chung Container Port (KCCP) – with the HKSAR Government creating an enabling framework for operators to capture efficiency gains.
(d) Later: Port Rationalisation Initiative – focus on the Government
working as a facilitator with the container terminal (CT) operators to consider, whilst not compromising competition, possible
- 5 -
measures on berth rationalization at KCCP so as to enhance productivity.
PORT EXPANSION 7. HKP is undergoing change as cargo patterns vary as a result of regional development. Flexibility in the timing and extent of new facilities is needed now more than ever. Based on the preferred forecast scenario in paragraph 5(f), the Indicative Master Plan recommends that CT10 with 3 new container berths will be required by the first half of the next decade and 3 more in subsequent years.
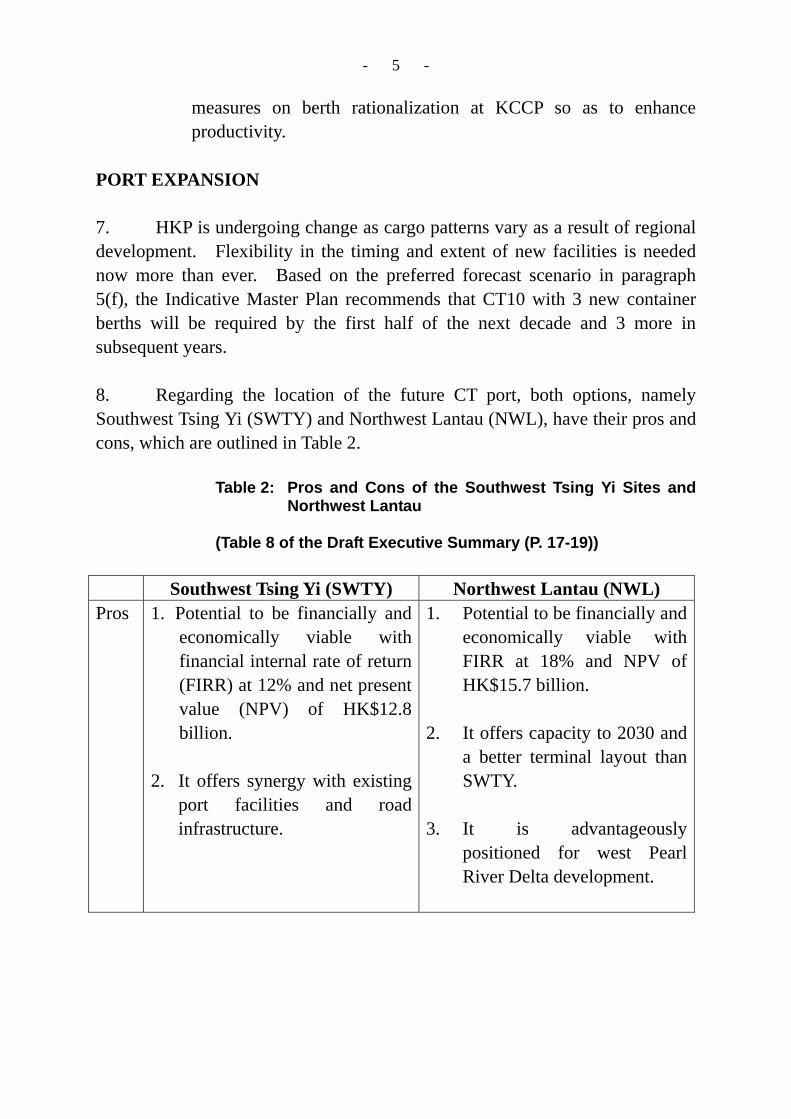
8. Regarding the location of the future CT port, both options, namely Southwest Tsing Yi (SWTY) and Northwest Lantau (NWL), have their pros and cons, which are outlined in Table 2.
Table 2: Pros and Cons of the Southwest Tsing Yi Sites and Northwest Lantau
(Table 8 of the Draft Executive Summary (P. 17-19))
Southwest Tsing Yi (SWTY) Northwest Lantau (NWL) Pros 1. Potential to be financially and
economically viable with financial internal rate of return (FIRR) at 12% and net present value (NPV) of HK$12.8 billion.
2. It offers synergy with existing
port facilities and road infrastructure.
1. Potential to be financially and economically viable with FIRR at 18% and NPV of HK$15.7 billion.
2. It offers capacity to 2030 and
a better terminal layout than SWTY.
3. It is advantageously
positioned for west Pearl River Delta development.
- 6 -
Southwest Tsing Yi (SWTY) Northwest Lantau (NWL) Cons 1. High land resumption costs and
reprovisioning of existing uses would have impacts on development costs and programme.
2. There is limited expansion
opportunity beyond 2020. 3. Possible impacts on Harbour
Area Treatment Scheme. 4. Impacts and cost on the
reprovisioning of oil depots installations and other land use.
1. It would generate ecological impacts, in particular on the Chinese White Dolphin habitat, and have visual impact on an undeveloped area.
2. It creates a split port. 3. It is dependent on new
strategic infrastructure, e.g. the Hong Kong-Zhuhai-Macao Bridge.
9. In view of the ecological impacts, an ecology study is recommended for NWL to better assess these risks. Meanwhile, it is prudent not to rule out SWTY at this stage. A further review of port expansion options should be undertaken later. 10. The Study concludes that building new facilities without first addressing HKP’s connectivity weakness is risky and unlikely to bring additional cargo and related benefits to Hong Kong. RECOMMENDATION 11. The recommended next steps are:
(a) address the cost differentials between HKP and neighbouring ports, (b) update the port cargo forecasts using a more comprehensive
methodology that takes into account latest developments and data regarding the demand and supply of facilities in South China, the
- 7 -
competitiveness of HKP and the likely demand,
(c) conduct an ecology study on NWL as soon as practicable.
12. With regard to (a) in paragraph 11 above, the Government continues to facilitate the dialogue between the relevant parties on THC, and we have been consulting the stakeholders1 on ways to reduce cross boundary haulage costs. One important initiative is to discuss with the Guangdong authorities the licensing, regulatory and customs requirements on HK cross-boundary truck through:
(i) relaxation of the “4-up-4-down rule”; (ii) relaxation of the “1-truck-1-driver rule”; (iii) review of the indirect licensing scheme for cross boundary
container trucks; and (iv) enhancement in inland customs services.
This initiative is strongly supported by the major trade and industry associations involved in trading, trucking and CT operations. We are proactively taking forward the proposals for discussion with the Guangdong authorities. 13. As regards (b) and (c) in paragraph 11, the Government is planning to take forward these recommendations.
CONSULTATION 14. The findings and recommendations of the HKP2020 Study have been endorsed by the PDC, Logistics Development Council and Maritime Industry 1 An industry proposal on reducing cross boundary trucking cost was submitted by 10 industry
organizations, including the Container Transportation Employees General Union, Hong Kong Container Tractor Owner Association, Lok Ma Chau-Hong Kong Freight Association, Hong Kong (Cross Border) Transportation Drivers' Association, Hong Kong Container Terminal Operators Association, Goods Vehicle Fleet Owners Association Limited, Hong Kong Shippers’ Council, Federation of Hong Kong Industries, Hong Kong Liner Shipping Association and Hong Kong Logistics Association, and the Hon Ms Miriam Lau on 28 September 2004. The Government is following up on the proposal through the SCI.
- 8 -
Council. The Draft Executive Summary will be posted on the website of the PDC after it is presented to the LegCo Economic Services Panel for public consultation for about 3 months up to end of February 2005. After collecting the views of the industry and the public on the Study, we will further consult the stakeholders to work out an implementation programme. In the meantime, we will work on the recommendations in paragraph 12 above. ADVICE SOUGHT 15. Members are invited to note and comment on the findings and recommendations in the HKP2020 Study. Economic Development and Labour Bureau 15 November 2004
Study on Hong Kong Port – Master Plan 2020 Draft Executive Summary
Economic Development and Labour Bureau
November 2004 GHK (Hong Kong) Ltd 23/F, Neich Tower, 128 Gloucester Road, Wanchai, Hong Kong Tel: (852) 2868 6980 Fax: (852) 2530 4302 [email protected] www.ghkint.com
In association with Scott Wilson Limited BMT Asia Pacific Insignia Brooke, Murray Harrison, State Development and Planning Comprehensive Transportation Research Institute and Atkins China Ltd.
Annex
Study on Hong Kong Port – Master Plan 2020 (HKP2020) Draft Executive Summary
Submitted to the Economic Development and Labour Bureau
J827 Nov-04 i
TABLE OF CONTENTS
1 INTRODUCTION ............................................................................................1
2 A COMPETITIVE SEA CHANGE ...................................................................1
Non-container cargo ................................................................................3
2.2 PORT CHOICE DETERMINANTS ....................................................................4
Reducing Inland Transport Costs is Mission Critical to Hong Kong’s
Future ...............................................................................................5
THCs also Make a Difference ..................................................................6
Role of Shipping Lines.............................................................................6
2.3 MORE PORTS - MORE CAPACITY...................................................................6
3 FUTURE DEMAND.........................................................................................7
Planning for Smart Growth.......................................................................9
4 STRATEGY .................................................................................................. 10
4.2 MEETING THE CHALLENGE ........................................................................ 10
5 PORT PLANNING ........................................................................................ 13
5.2 CONTAINER TERMINAL EXPANSION ............................................................ 15
6 MAKING IT HAPPEN ................................................................................... 20
Study on Hong Kong Port – Master Plan 2020 (HKP2020) Draft Executive Summary
Submitted to the Economic Development and Labour Bureau
J827 Nov-04 1
1 INTRODUCTION
1.1.1 This Executive Summary highlights the key findings and recommendations of the Study on Hong Kong Port – Master Plan 2020 (HKP2020) commissioned by the Economic Development and Labour Bureau and undertaken by GHK (Hong Kong) Ltd in partnership with Scott Wilson Limited.
1.1.2 The overall objective of HKP2020 is to formulate a competitive and sustainable strategy and master plan for port development over a 20-year planning time frame. The critical priority is enhancing the competitiveness of existing port assets. This will enable Hong Kong to:
! retain a leading position in the provision of port services in South China;
! provide a sound basis for further port expansion; and
! secure sustainable economic benefits for the HKSAR community.
1.1.3 The strategy formulation process has involved extensive industry consultation and close liaison with the Port Development Advisory Group of the Port Development Council. We would like to express our thanks to all the stakeholders who gave freely of their time and insight. Their inputs have greatly enhanced the quality of this study.
2 A COMPETITIVE SEA CHANGE
2.1.1 Hong Kong’s port (HKP) is a defining feature of the Hong Kong Special Administrative Region (HKSAR) economy and indeed identity. Taking into account interactions between core port industries and the rest of the economy, the port core sector constituted around 4% of Hong Kong’s GDP in 2002 and about 110,000 jobs, or 3.4% of total employment1 is closely linked to the port. Against a background of sustained growth over much of the past decade, Hong Kong has established itself as a world leader in port management and operational expertise. The future could be very different.
Import / Export Cargo (Direct ocean Cargo) – the “Key Value Driver”
2.1.2 Medium to long term trade growth prospects remain favourable for the region and the drivers of cargo base growth. Nevertheless, HKP is under threat as new port developments in Shenzhen capture market share of
1 Port core sector includes supporting activities for the port.
Study on Hong Kong Port – Master Plan 2020 (HKP2020) Draft Executive Summary
Submitted to the Economic Development and Labour Bureau
J827 Nov-04 2
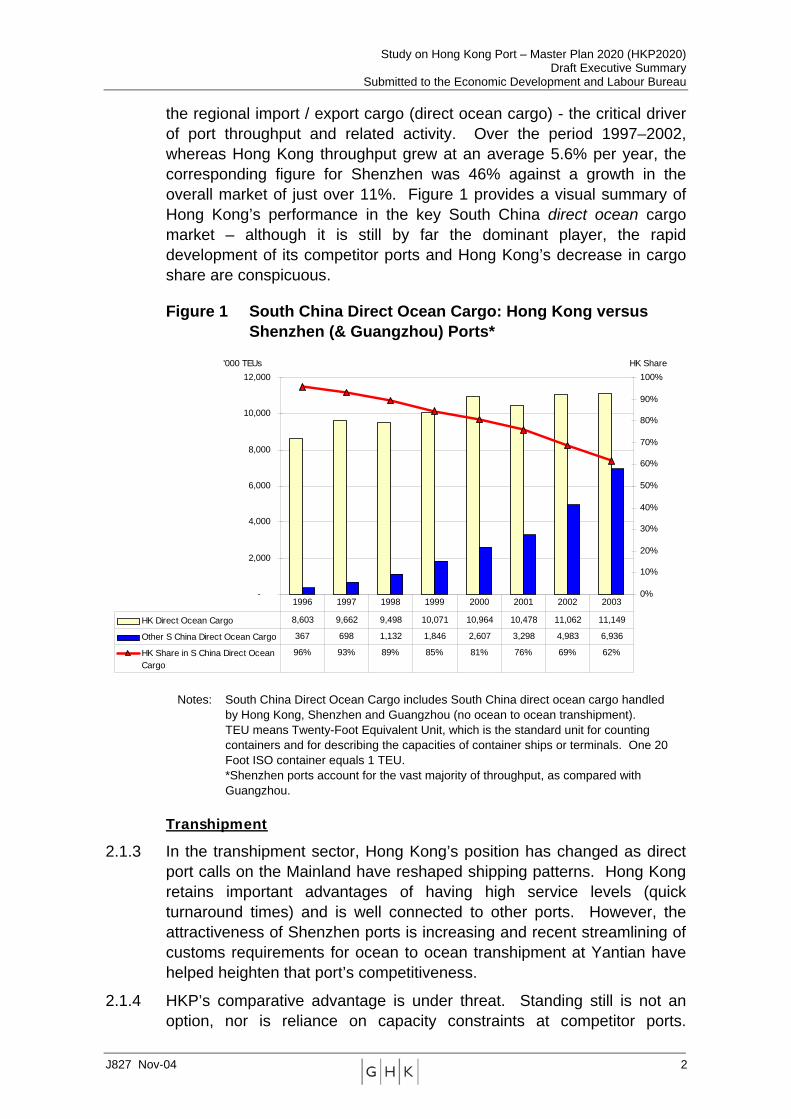
the regional import / export cargo (direct ocean cargo) - the critical driver of port throughput and related activity. Over the period 1997–2002, whereas Hong Kong throughput grew at an average 5.6% per year, the corresponding figure for Shenzhen was 46% against a growth in the overall market of just over 11%. Figure 1 provides a visual summary of Hong Kong’s performance in the key South China direct ocean cargo market – although it is still by far the dominant player, the rapid development of its competitor ports and Hong Kong’s decrease in cargo share are conspicuous.
Figure 1 South China Direct Ocean Cargo: Hong Kong versus Shenzhen (& Guangzhou) Ports*
Notes: South China Direct Ocean Cargo includes South China direct ocean cargo handled by Hong Kong, Shenzhen and Guangzhou (no ocean to ocean transhipment). TEU means Twenty-Foot Equivalent Unit, which is the standard unit for counting containers and for describing the capacities of container ships or terminals. One 20 Foot ISO container equals 1 TEU.
*Shenzhen ports account for the vast majority of throughput, as compared with Guangzhou.
Transhipment
2.1.3 In the transhipment sector, Hong Kong’s position has changed as direct port calls on the Mainland have reshaped shipping patterns. Hong Kong retains important advantages of having high service levels (quick turnaround times) and is well connected to other ports. However, the attractiveness of Shenzhen ports is increasing and recent streamlining of customs requirements for ocean to ocean transhipment at Yantian have helped heighten that port’s competitiveness.
2.1.4 HKP’s comparative advantage is under threat. Standing still is not an option, nor is reliance on capacity constraints at competitor ports.
-
2,000
4,000
6,000
8,000
10,000
12,000'000 TEUs
0%
10%
20%
30%
40%
50%
60%
70%
80%
90%
100%HK Share
HK Direct Ocean Cargo 8,603 9,662 9,498 10,071 10,964 10,478 11,062 11,149
Other S China Direct Ocean Cargo 367 698 1,132 1,846 2,607 3,298 4,983 6,936
HK Share in S China Direct OceanCargo
96% 93% 89% 85% 81% 76% 69% 62%
1996 1997 1998 1999 2000 2001 2002 2003
Study on Hong Kong Port – Master Plan 2020 (HKP2020) Draft Executive Summary
Submitted to the Economic Development and Labour Bureau
J827 Nov-04 3
Decisive and timely action is needed to regain its competitive advantage and secure future employment and wealth opportunities.
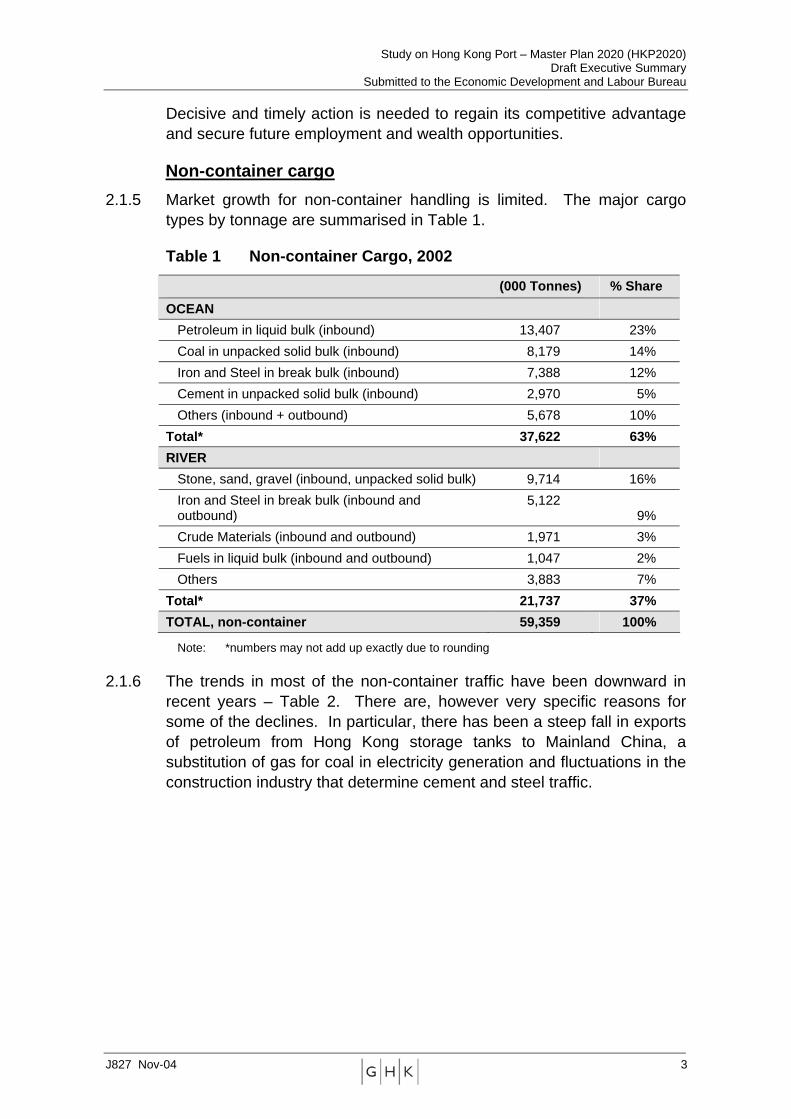
Non-container cargo 2.1.5 Market growth for non-container handling is limited. The major cargo
types by tonnage are summarised in Table 1.
Table 1 Non-container Cargo, 2002
(000 Tonnes) % Share OCEAN
Petroleum in liquid bulk (inbound) 13,407 23% Coal in unpacked solid bulk (inbound) 8,179 14% Iron and Steel in break bulk (inbound) 7,388 12% Cement in unpacked solid bulk (inbound) 2,970 5% Others (inbound + outbound) 5,678 10%
Total* 37,622 63% RIVER
Stone, sand, gravel (inbound, unpacked solid bulk) 9,714 16% Iron and Steel in break bulk (inbound and outbound)
5,122 9%
Crude Materials (inbound and outbound) 1,971 3% Fuels in liquid bulk (inbound and outbound) 1,047 2% Others 3,883 7%
Total* 21,737 37% TOTAL, non-container 59,359 100%
Note: *numbers may not add up exactly due to rounding
2.1.6 The trends in most of the non-container traffic have been downward in recent years – Table 2. There are, however very specific reasons for some of the declines. In particular, there has been a steep fall in exports of petroleum from Hong Kong storage tanks to Mainland China, a substitution of gas for coal in electricity generation and fluctuations in the construction industry that determine cement and steel traffic.
Study on Hong Kong Port – Master Plan 2020 (HKP2020) Draft Executive Summary
Submitted to the Economic Development and Labour Bureau
J827 Nov-04 4
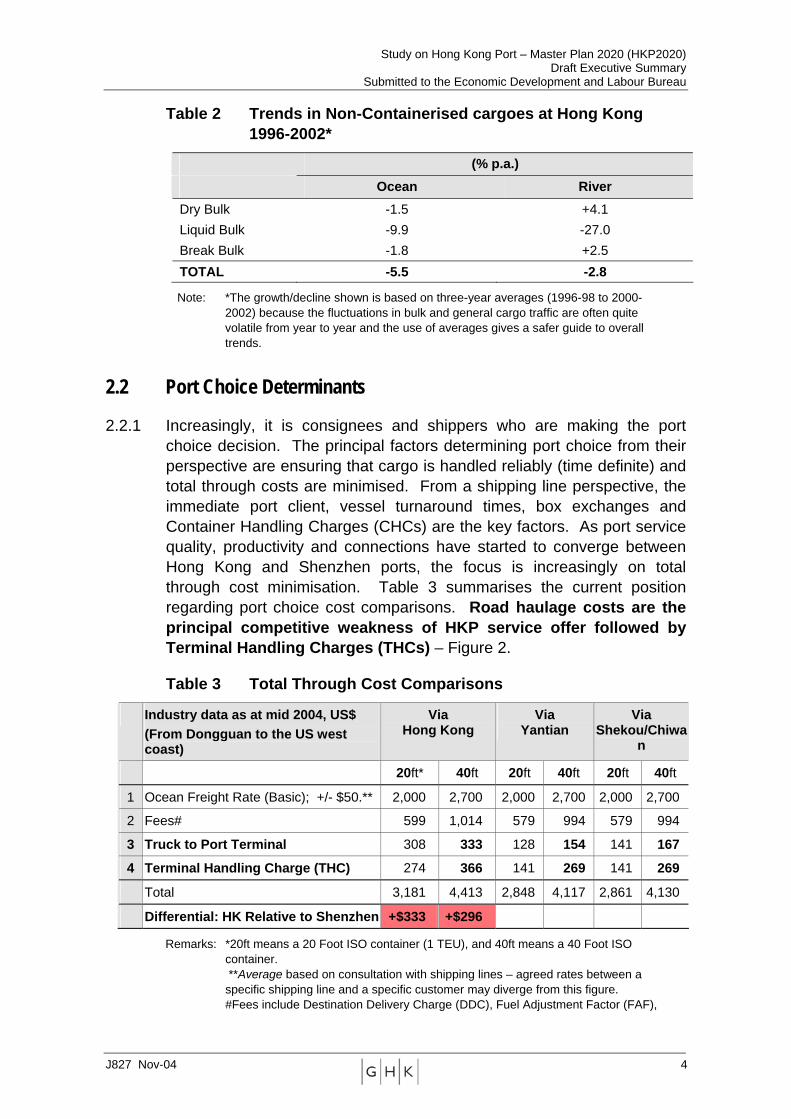
Table 2 Trends in Non-Containerised cargoes at Hong Kong 1996-2002*
(% p.a.) Ocean River
Dry Bulk -1.5 +4.1 Liquid Bulk -9.9 -27.0 Break Bulk -1.8 +2.5 TOTAL -5.5 -2.8
Note: *The growth/decline shown is based on three-year averages (1996-98 to 2000-2002) because the fluctuations in bulk and general cargo traffic are often quite volatile from year to year and the use of averages gives a safer guide to overall trends.
2.2 Port Choice Determinants
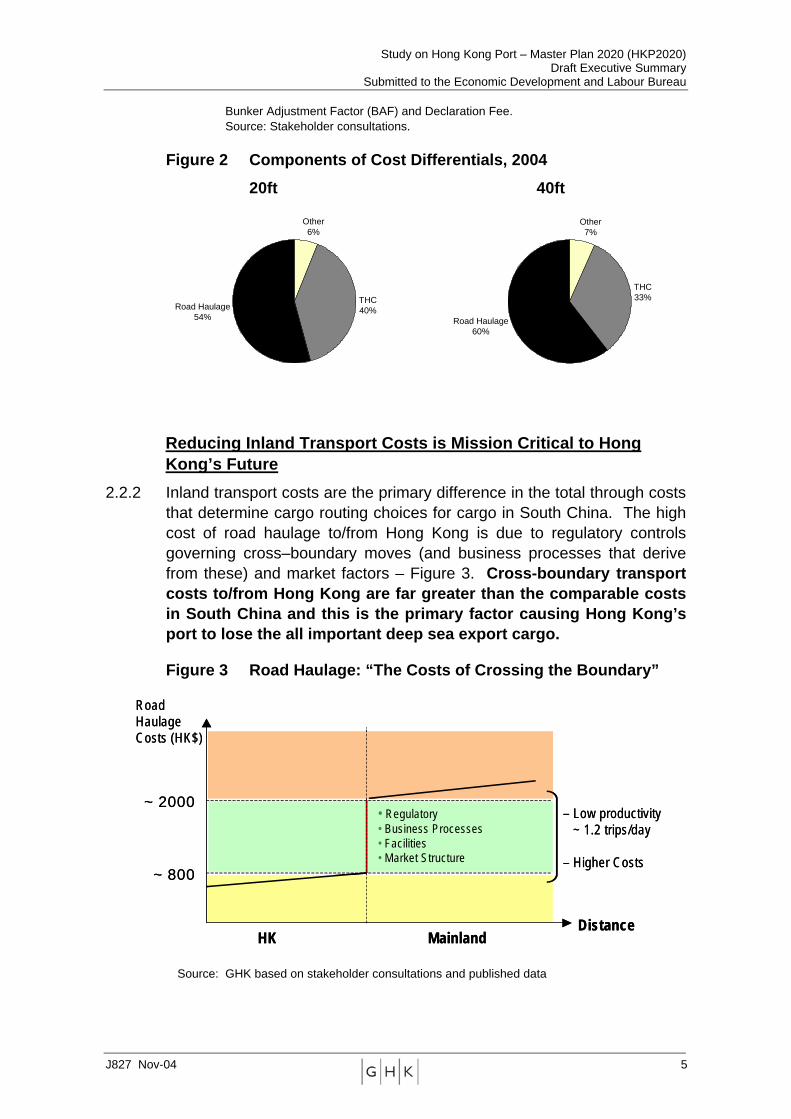
2.2.1 Increasingly, it is consignees and shippers who are making the port choice decision. The principal factors determining port choice from their perspective are ensuring that cargo is handled reliably (time definite) and total through costs are minimised. From a shipping line perspective, the immediate port client, vessel turnaround times, box exchanges and Container Handling Charges (CHCs) are the key factors. As port service quality, productivity and connections have started to converge between Hong Kong and Shenzhen ports, the focus is increasingly on total through cost minimisation. Table 3 summarises the current position regarding port choice cost comparisons. Road haulage costs are the principal competitive weakness of HKP service offer followed by Terminal Handling Charges (THCs) – Figure 2.
Table 3 Total Through Cost Comparisons
Industry data as at mid 2004, US$ (From Dongguan to the US west coast)
Via Hong Kong
Via Yantian
Via Shekou/Chiwa
n
20ft* 40ft 20ft 40ft 20ft 40ft
1 Ocean Freight Rate (Basic); +/- $50.** 2,000 2,700 2,000 2,700 2,000 2,700
2 Fees# 599 1,014 579 994 579 994
3 Truck to Port Terminal 308 333 128 154 141 167
4 Terminal Handling Charge (THC) 274 366 141 269 141 269
Total 3,181 4,413 2,848 4,117 2,861 4,130
Differential: HK Relative to Shenzhen +$333 +$296
Remarks: *20ft means a 20 Foot ISO container (1 TEU), and 40ft means a 40 Foot ISO container. **Average based on consultation with shipping lines – agreed rates between a specific shipping line and a specific customer may diverge from this figure. #Fees include Destination Delivery Charge (DDC), Fuel Adjustment Factor (FAF),
Study on Hong Kong Port – Master Plan 2020 (HKP2020) Draft Executive Summary
Submitted to the Economic Development and Labour Bureau
J827 Nov-04 5
Other6%
THC40%Road Haulage
54%
Other7%
THC33%
Road Haulage60%
Bunker Adjustment Factor (BAF) and Declaration Fee. Source: Stakeholder consultations.
Figure 2 Components of Cost Differentials, 2004
20ft 40ft
Reducing Inland Transport Costs is Mission Critical to Hong Kong’s Future
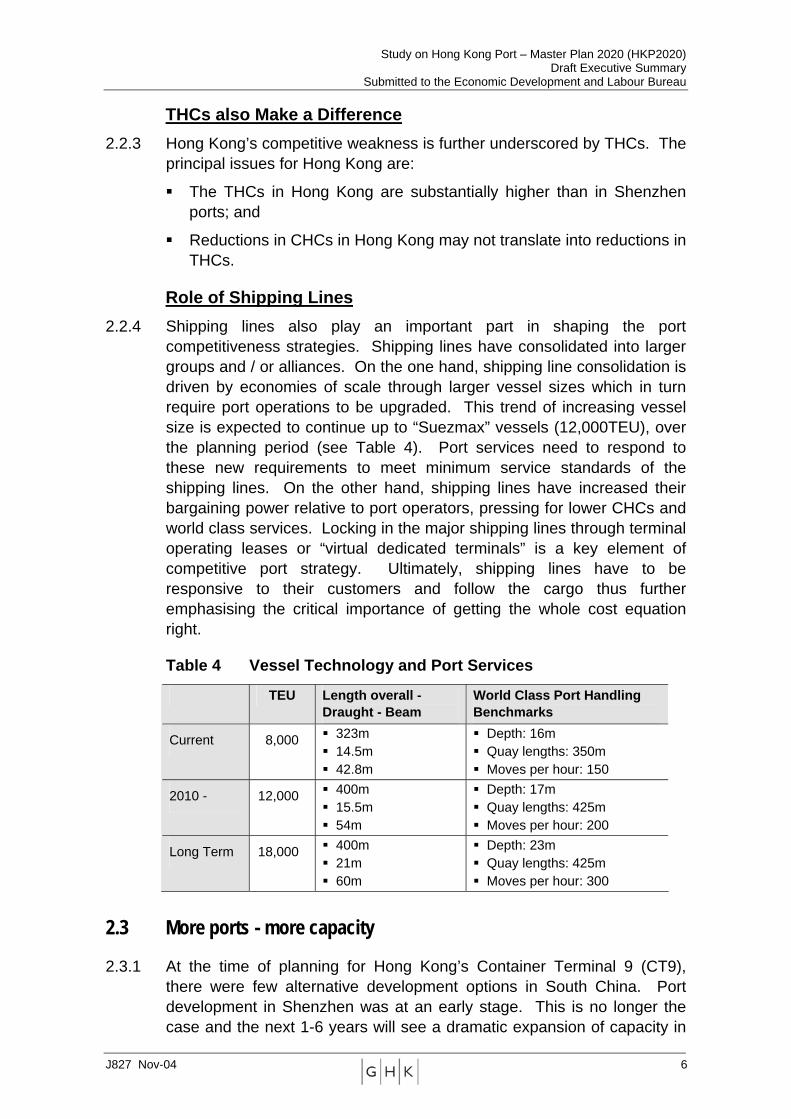
2.2.2 Inland transport costs are the primary difference in the total through costs that determine cargo routing choices for cargo in South China. The high cost of road haulage to/from Hong Kong is due to regulatory controls governing cross–boundary moves (and business processes that derive from these) and market factors – Figure 3. Cross-boundary transport costs to/from Hong Kong are far greater than the comparable costs in South China and this is the primary factor causing Hong Kong’s port to lose the all important deep sea export cargo.
Figure 3 Road Haulage: “The Costs of Crossing the Boundary”
Source: GHK based on stakeholder consultations and published data
– Low productivity~ 1.2 trips/day
– Higher Costs~ 800
~ 2000
Road HaulageCosts (HK$)
HK MainlandDistance
• Regulatory• Business Processes• Facilities• Market Structure
– Low productivity~ 1.2 trips/day
– Higher Costs~ 800
~ 2000
Road HaulageCosts (HK$)
HK MainlandDistance
• Regulatory• Business Processes• Facilities• Market Structure
Study on Hong Kong Port – Master Plan 2020 (HKP2020) Draft Executive Summary
Submitted to the Economic Development and Labour Bureau
J827 Nov-04 6
THCs also Make a Difference 2.2.3 Hong Kong’s competitive weakness is further underscored by THCs. The
principal issues for Hong Kong are:
! The THCs in Hong Kong are substantially higher than in Shenzhen ports; and
! Reductions in CHCs in Hong Kong may not translate into reductions in THCs.
Role of Shipping Lines 2.2.4 Shipping lines also play an important part in shaping the port
competitiveness strategies. Shipping lines have consolidated into larger groups and / or alliances. On the one hand, shipping line consolidation is driven by economies of scale through larger vessel sizes which in turn require port operations to be upgraded. This trend of increasing vessel size is expected to continue up to “Suezmax” vessels (12,000TEU), over the planning period (see Table 4). Port services need to respond to these new requirements to meet minimum service standards of the shipping lines. On the other hand, shipping lines have increased their bargaining power relative to port operators, pressing for lower CHCs and world class services. Locking in the major shipping lines through terminal operating leases or “virtual dedicated terminals” is a key element of competitive port strategy. Ultimately, shipping lines have to be responsive to their customers and follow the cargo thus further emphasising the critical importance of getting the whole cost equation right.
Table 4 Vessel Technology and Port Services
TEU Length overall - Draught - Beam
World Class Port Handling Benchmarks
Current 8,000 ! 323m ! 14.5m ! 42.8m
! Depth: 16m ! Quay lengths: 350m ! Moves per hour: 150
2010 - 12,000 ! 400m ! 15.5m ! 54m
! Depth: 17m ! Quay lengths: 425m ! Moves per hour: 200
Long Term 18,000 ! 400m ! 21m ! 60m
! Depth: 23m ! Quay lengths: 425m ! Moves per hour: 300
2.3 More ports - more capacity
2.3.1 At the time of planning for Hong Kong’s Container Terminal 9 (CT9), there were few alternative development options in South China. Port development in Shenzhen was at an early stage. This is no longer the case and the next 1-6 years will see a dramatic expansion of capacity in
Study on Hong Kong Port – Master Plan 2020 (HKP2020) Draft Executive Summary
Submitted to the Economic Development and Labour Bureau
J827 Nov-04 7
the Pearl River Delta (PRD). Between 2004 and 2010, total Container Terminal (CT) capacity is likely to increase by over 44%, reaching 41.2m TEUs. While HKP operators are also the principal operators in Shenzhen and have an interest in “managing expansion”, greater capacity is likely to exert a downward pressure on tariffs across the region and reshape the provision of port services both in Hong Kong and the wider region.
Competing Port “Offers”
2.3.2 Service quality continues to converge between Hong Kong and Shenzhen ports and there is downward pressure on tariffs. Minimum customer service requirements can be achieved at both Hong Kong and Shenzhen ports. In effect, port services purchasing decisions are increasingly price sensitive. The position of Hong Kong relative to its immediate competitors is summarised in Table 5. The challenge for Hong Kong is to refashion its value proposition to port customers - the critical strategic imperatives are to maximise the efficiency of existing assets safeguarding the sustainability of the port.
Table 5 A Shift in Comparative Advantage
Hong Kong Shenzhen Inland Transport Linkages
High cross-boundary costs Lower road haulage costs
Shipping Line Charges (Terminal Handling Charges)
THCs are a barrier – may be convergence over medium term
THCs at Shenzhen ports tend to be lower
Port Tariffs (Container Handling Charges)
CHCs are converging Advantage eroding as CHCs converge
Port Service Quality High quality but as Shenzhen ports develop the gap will be narrowed
Service quality is converging with HK
Regulatory Environment Simple and transparent Regulatory environment is improving fast and should drive convergence
Productivity Land & environmental constraints limit productivity improvements
More land available to support CT productivity and relatively little environmental regulation
Expansion New berths are expensive – focus on efficiency gains
CT development costs are lower
Advantage
3 FUTURE DEMAND
3.1.1 The future market for port services is marked by the favourable growth prospects of the cargo base and increased competition for Hong Kong. Growth of the cargo base is generally expected to be robust over much of
Study on Hong Kong Port – Master Plan 2020 (HKP2020) Draft Executive Summary
Submitted to the Economic Development and Labour Bureau
J827 Nov-04 8
the planning period with a tapering of growth rate as the regional economy matures. Globalisation and the Mainland’s continuing process of liberalisation (including the impacts of WTO accession) are the key drivers of trade growth in the port hinterland. The basic planning parameters are:
! Growth in world trade in manufacturing goods: 9% average per annum;
! Strong growth in Guangdong exports and imports: 10% average per annum, falling to 7% average 2010 to 2020.
3.1.2 The challenge is for Hong Kong to capture market share of the direct cargo segments in the first instance and transhipment in the second. Traffic projections based on the Port Cargo Forecasts (PCF) model under different scenarios were generated in Table 6. The basic steps were: ! Forecast traffic based on a continuation of existing trends (in terms of
competitiveness between HKP and Shenzhen, growth in throughputs, etc.);
! Re-run the forecast incorporating the potential impact of committed programmes and projects (Scenario A - “do nothing more”); then
! Re-run the forecast incorporating a package of competitiveness enhancement measures designed to increase Hong Kong’s market share and that are assumed to work as planned (Scenario B - “maximum competitiveness”);
! Re-run the forecast traffic allowing for variations in the degree of control and effectiveness of the competitiveness enhancement measures – in effect, applying a discounting factor to the effectiveness of the proposed measures and creating a range of potential traffic patterns (Scenarios B1, B2, C1, C2); and finally
! Identify a preferred planning scenario to guide port planning.
3.1.3 Table 6 provides further details, including the projections under the different scenarios.
Table 6 Future Port Traffic Scenarios
Scenario Key Parameters Growth Volume in TEU M (02- 20) 2005 2010 2015 2020 Scenario A Existing trends plus committed
infrastructure (but otherwise assuming no competitiveness enhancement measures) ! Shenzhen Western Corridor ! Cross-Boundary Initiatives ! The Hong Kong-Zhuhai-Macao (HK-Z-
M) Bridge
3.5% 22.84 26.14 31.94 35.32
Scenario B1 Built on Scenario A, but with 5.0% 24.82 30.64 40.38 46.46
Study on Hong Kong Port – Master Plan 2020 (HKP2020) Draft Executive Summary
Submitted to the Economic Development and Labour Bureau
J827 Nov-04 9
competitiveness enhancement measures including those outside HK control and assuming that measure are fully effective: ! Seamless cross-boundary formalities ! Reduce trucking operating costs ! Increased triangulation (better
matching of empty and laden containers)
! Lock-in major port users ! Modify/enhance port assets to ensure
flexibility and efficient servicing of large vessels
Scenario B2 Same as Scenario B1 but excluding “increased triangulation” 4.7% 23.83 29.14 38.27 43.51
Scenario C1 All the enhancement measures under Scenario B1 are only partially (60%) effective 4.5% 24.03 28.84 37.00 42.00
Scenario C2 (Preferred Scenario)
Same as Scenario B2, but measures are only partially (60%) effective 4.2% 23.44 27.94 35.74 40.23
Planning for Smart Growth 3.1.4 It is prudent to expect market shares to converge between Hong Kong
and Shenzhen ports. Within that context Hong Kong needs to plan for smart growth – economically beneficial and profitable growth of port traffic. The preferred scenario C2 is built on:2
! The “continuation of existing trends” taking into account committed projects; and
! A package of policy and investment initiatives to support the Hong Kong port’s competitiveness (see next section).
3.1.5 The forecast results of the preferred scenario suggest that:
! Total Hong Kong ocean container throughput could increase from 13.9m TEUs in 2002 to 31.8m TEUs in 2020. However, as the base expands, the annual growth rate is expected to slow down from 5.7% during 2010-15 to 3.4% during 2015-20.
! Hong Kong’s river trade volume is expected to increase from 5.2m TEUs in 2002, to 8.5m TEUs in 2020.
! Total Hong Kong container traffic is forecast to reach 23.4m TEUs in 2005, 27.9m TEUs in 2010 and 40.2m TEUs in 2020.
2 It is critical that the port planning process is focused on competitiveness and the actions needed to achieve this. In this regard it is not helpful to focus simply on a “base case”, as all the actions required to enhance HKP’s competitiveness are an integral part of a “realistic” port planning programme. However, the B Scenario assumes that a range of initiatives, some outside HK Government control, are fully effective – this is clearly towards the upper end of likely throughput projections. The C2 Scenario includes a number of enhancement measures – i.e. “planning for success”, however it acknowledges that measures may not be fully effective and that certain measures may not be implemented as the Hong Kong Government has little control over them. As such, it has been selected as the preferred projection for planning purposes.
Study on Hong Kong Port – Master Plan 2020 (HKP2020) Draft Executive Summary
Submitted to the Economic Development and Labour Bureau
J827 Nov-04 10
! Due to the competition from Shenzhen ports, the share of the South China direct ocean cargo base routing via HKP is expected to fall from 66% in 2005, to 57% in 2010 and 51% in 2020.3
3.1.6 These forecasts are not a given. They are dependent on a number of competitiveness enhancement measures being implemented – critically, measures to improve HKP’s connectivity to its hinterland. If immediate progress is not made on this issue, then throughput is likely to be substantially reduced. The demand for any new facilities in the foreseeable future would then be delayed.
4 STRATEGY
4.1.1 The overriding objective for Hong Kong is to have a port sector that is a successful, safe, sustainable and a major contributor to the wealth of Hong Kong and the wider South China region. The key policy driver is that the provision of port services and facilities should be market driven. Within this context the guiding principles of HKP’s strategy are:
! Efficiency: Improving the efficiency of port services to best meet demand.
! Competitiveness: The focus of the strategy is to support and enhance the competitiveness of Hong Kong’s port and related service offers;
! Partnership: Working with the private sector to ensure the delivery of world-class port services.
! Sustainability: Ensuring the port makes a positive and lasting contribution to economic and social well being, without unacceptable environmental impacts.
4.2 Meeting the Challenge
4.2.1 The report identifies a number of short, medium and long-term priorities to ensure HKP’s continued success. These are:
! Super-connectivity Initiative (SCI) – building on current initiatives and implement complementary measures to improve boundary crossing, raise the efficiency of trucking movements and review licensing and registration fees (including increased separation of container movements from vehicle movements to improve circulation and triangulation of empties in the PRD) thus reducing inland transport costs to HKP. These initiatives are described in Table 7.
3 As Figure 1 illustrated, HK’s share of the South China Direct (Import / Export) cargo in 2003 was estimated to already have dropped to 62%. The PCF was undertaken using 2002 as the base year and it is clear that in the short-term, HK’s competitiveness and market share have been declining more quickly than projected under the C2 planning scenario. The need for action is clear if the C2 Scenario is to be realised.
Study on Hong Kong Port – Master Plan 2020 (HKP2020) Draft Executive Summary
Submitted to the Economic Development and Labour Bureau
J827 Nov-04 11
Table 7 SCI – Current and Proposed Initiatives
Current Initiatives Proposed Initiatives ! 24 hour opening of boundary crossings
and increased number and capacity of crossing points
! Substantial reductions in vehicle clearance times at the boundary
! Greater flexibility in separating container movements in the PRD from Hong Kong vehicle movements (container exchange depots)
! Pre-clearance arrangements for land and barge containers
! Fast track clearance for empty containers! Fast track clearance for electronically
sealed containers
! Improving circulation and triangulation of empties in the PRD: widespread separation of container movements from vehicle movements – e.g. numerous locations (depots / logistics parks / inland freight village at convenient locations in PRD) where empty and laden containers can be exchanged, including haulage matching between Mainland and cross-boundary truckers
! Review licensing arrangements and fees
! Improving barge services ! Improving documentation &
Electronic Document System (EDS).
! Hong Kong First - to create a formal process of representing, advocating and communicating HKP interests in the relevant stakeholder forums.4 The Hong Kong and Shenzhen ports serve the wider South China region. There is a shared interest in improving efficiency, avoiding excess capacity and keeping tariffs at a level that delivers regional economic benefits.
! Power Port Initiative (PPI) – focused on supporting port productivity improvements – especially Kwai Chung Container Port (KCCP) – with the Hong Kong Government creating an enabling framework for operators. The emphasis is on improving the existing operations through planning support and aiding CT operators implement changes to land and transport infrastructure that will enhance productivity.
! Port Rationalisation Initiative (PRI) – focused on the government working as a facilitator with the CT operators to address land issues related to fragmentation of terminals at KCCP, whilst not compromising competition.5 The emphasis is on identifying possible long-term berth rationalisation measures, if any, that can take productivity growth of KCCP further.
! Port Expansion - The new competitive landscape makes investment planning more uncertain. There is also a greater appreciation of ensuring that future port expansion is sustainable. Commercial and environmental risks need to be appropriately balanced and the
4 In the first instance this should be via existing forums: e.g. The Port Development Council (PDC) and its Port Development Advisory Group (PDAG), Hong Kong / Guangdong Co-operation Joint Conference, Mainland/HKSAR Conference on Coordination of Large Scale Infrastructure Development, etc. 5 For example, current licensing requirements raise inter-terminal trucking costs, including transfers between terminals owned by the same operators. The Government may consider changing the licensing requirements to facilitate inter-terminal trucking within the Kwai Chung Container Port area.
Study on Hong Kong Port – Master Plan 2020 (HKP2020) Draft Executive Summary
Submitted to the Economic Development and Labour Bureau
J827 Nov-04 12
environmental footprint of the port minimised. It is prudent to prepare for possible expansion as planning and construction lead times are lengthy and the process complex acknowledging the long lead times associated with CT development. It is recommended that the planning process can be taken forward at the earliest opportunity once the effectiveness of the SCI is clearer.
4.2.2 The sequencing logic is important:
! Firstly, to focus resources on the critical issue for port competitiveness and economic contribution – the SCI;
! Secondly, to ensure that the Port, Maritime and Logistics Development Unit resources (and those of other key stakeholders, both public and private sectors) are not diluted across too many initiatives; and
! Thirdly, getting the SCI started must take precedence over all other initiatives in the immediate term. The focus must be on outcomes.
4.2.3 Getting inland connectivity right is crucial to the port’s future economic potential. The second priority is to support productivity and efficiency improvements across the port with specific emphasis on the CTs – getting the most from existing assets should leverage considerable benefits to Hong Kong. With considerable capacity in the market this initiative is likely to be less critical in the short run. In the longer term, the PRI and Expansion become more important. The initial steps preparing for potential expansion can be started in the short-term as the lead times are long. The effectiveness of the PPI and PRI will influence the timing of any potential expansion should this be feasible.
Study on Hong Kong Port – Master Plan 2020 (HKP2020) Draft Executive Summary
Submitted to the Economic Development and Labour Bureau
J827 Nov-04 13
5 PORT PLANNING
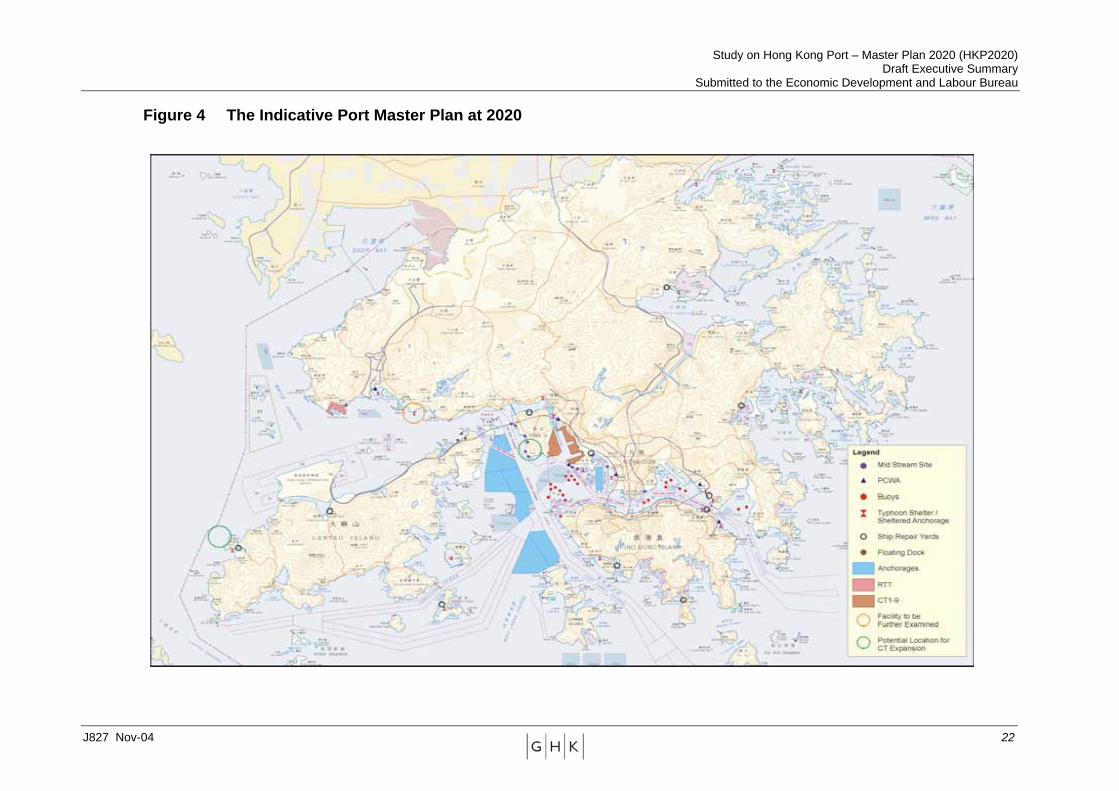
5.1.1 The port is undergoing significant change as cargo patterns vary as a result of regional development. Flexibility in the timing and extent of new facilities is needed now more than ever. From the C2 Scenario adopted from the Port Cargo Forecasts, the projected demands were compared to the predicted future capacities of the existing port facilities. Progressive productivity increases were assumed in all port operations with time as improved equipment and methods were adopted. This identified when new port facilities might be needed and the extent of such new facilities should the assumptions behind the C2 forecast be met. Figure 4 indicates the future layout of HKP facilities at 2020 according to the indicative Masterplan.
Container Terminals
5.1.2 In the short-term, significant additional capacity is being added to the container port with the phased completion of CT9. The preferred scenario forecasts indicate that no new container berths will be needed until the first half of the next decade. To increase the competitiveness of the port in the period up to then, the emphasis is on getting the most from existing facilities – this should leverage considerable benefits to Hong Kong. Cost-effective ways to extend capacities (the PPI and PRI) should be sought whilst ensuring that an adequate level of competition within the port is maintained. Land-side constraints are the most pressing.
5.1.3 The maximum capacity of the existing container port is estimated to be around 18.6MTEU upon full completion of CT9, with potential to increase by another 1.7MTEU and possibly more if additional land and other productivity measures are introduced.
Anchorages and Buoys
5.1.4 Mid-stream vessels are becoming larger and many are either too long or too deep-draughted to use the Government Mooring Buoys which are mostly around Kellet Bank. It is recommended that surplus Buoys are removed to save costs and the resulting areas reallocated for anchorages for suitably sized vessels. Within the study period, growth in the Mid-stream is predicted to strain the capacity of the existing anchorages. It is not considered cost effective to extend anchorages further south and west between Cheung Chau and Lamma and build a protective breakwater. Instead, a series of measures to increase productivity at anchorages are recommended, including reviewing charges to encourage faster turn-around and discourage non cargo-working uses at the sites closest to mid-stream sites. Consideration should also be given to expanding anchorages in other areas such as north of Lantau, near Tuen Mun and near Tseung Kwan O if congestion risks rise sufficiently.
Study on Hong Kong Port – Master Plan 2020 (HKP2020) Draft Executive Summary
Submitted to the Economic Development and Labour Bureau
J827 Nov-04 14
Mid-stream Sites (MSS)
5.1.5 The next few years are expected to see significant changes in the port mix due to additional capacity coming on-stream and the Hong Kong container terminals having to compete with Shenzhen and each other for market share. Whilst the mid-stream is a low cost operation compared to the container terminals, some of its higher value cargo on larger vessels may be attracted to the terminals. To retain flexibility to respond to changing volumes, it is recommended that the existing mix of long-term and short-term sites be retained, with some short-term tenancies extended to encourage greater investment in facilities to increase throughput and efficiency. The possibility and feasibility of upgrading some waterfront sites outside the inner harbour for alongside berthing should be kept under review.
Public Cargo Working Areas (PCWAs)
5.1.6 These were identified as the least efficient port facility with questionable economic benefit. As many sites occupied relatively high value waterfront sites with high redevelopment potential, it is recommended that three out of the existing eight PCWAs are phased out progressively by 2020.
River Trade Terminal (RTT)
5.1.7 The terminal was designed to handle both break-bulk and container cargoes, and with time the proportion of container cargo is increasing. The RTT is achieving quay front productivities higher than PCWAs but less than CTs. Overall, like the CTs, throughput is constrained by the landside capacity, not the quay frontage.
5.1.8 Forecasts show that container capacity will need to be increased but break-bulk is more than adequate. It is expected that the operator will adjust to these demands by converting break-bulk areas to containers, thus maximising the productivity of his terminal. Consequently a new terminal is deemed not necessary in the study period.
Typhoon Shelters
5.1.9 Subject to future demand and supply situation, one additional typhoon shelter may be needed in a timely manner to meet the possible deficit.
Ship Repair Yard
5.1.10 Demand for ship repair yards will depend upon the quality of competing services offered by nearby PRD facilities. It is possible that one local shipyard may not be needed by 2015 and another by 2030.
Back-up Land
5.1.11 Total demand is predicted to increase with port throughput during the study period, but there is no gross shortage of territorial supply in the
Study on Hong Kong Port – Master Plan 2020 (HKP2020) Draft Executive Summary
Submitted to the Economic Development and Labour Bureau
J827 Nov-04 15
short to medium term. The port layout in 2020 has already taken into account the immediate adjacent port back-up area of approximately 10 ha per berth. The trend for back-up land uses to move over the boundary nearer the cargo centres in the PRD is expected to continue, and changes to cross boundary trucking and / or the location of empty depots could have a marked impact upon the amount of land needed in Hong Kong.
5.2 Container Terminal Expansion
5.2.1 If the preferred scenario is realised, and assuming certain productivity improvements at HK’s existing facilities, then there is likely to be a need for new CTs in the first half of the next decade. Four locations were identified for future terminal expansion. However, the East Lantau site contradicts the strategic planning intentions to develop the adjacent area of North Lantau into a significant new tourism node and would also be limited by the Government’s Deed of Restrictive Covenants for nearby Disneyland. The West Tuen Mun site is limited by the high volumes of marine traffic present in Urmston Road and strong ocean currents. In addition, the required new approach channel situated outside HK waters will bring substantial planning and operational difficulties. The study decided to drop these two sites and proceeded to further investigate the remaining two – South West Tsing Yi (SWTY) and North West Lantau (NWL). These sites were subjected to a number of technical assessments covering: land use compatibility, engineering feasibility, transport planning, environmental impacts, marine impacts, financial and economic performance and finally a sustainability assessment. The key characteristics of the two sites are presented below.
Southwest Tsing Yi
! The site is characterised by its industrial nature and suffers from a degraded environment.
! Much of the site is currently occupied, primarily by oil terminals and other ancillary facilities. Therefore substantial costs would likely be incurred in acquiring the site and the displaced land uses would have to be re-provisioned, generating a number of additional impacts.
! The site offers synergy with existing port facilities and road infrastructure.
! The site requires less reclamation (74 ha) than NWL, but at a location closer to the central harbour.
! However, there is limited expansion opportunity beyond 2020 and some site constraints in terms of terminal layout.
Study on Hong Kong Port – Master Plan 2020 (HKP2020) Draft Executive Summary
Submitted to the Economic Development and Labour Bureau
J827 Nov-04 16
! Key concerns are: the high land resumption costs and reprovisioning of existing uses; the possible impact on the Harbour Area Treatment Scheme (HATS) discharge (and harbour water quality); waste management and the need to decontaminate the site.
Northwest Lantau
! The site is characterised by its rural nature.
! The site would form an offshore island to the northwest of Tai O and involve extensive reclamation (245 ha). The potential site configurations are somewhat constrained by the airport restriction zone, boundary of Hong Kong territorial waters, proposed alignment of the HK-Z-M Bridge and Tai O Development.
! It offers capacity to 2030 and a better terminal layout than SWTY.
! However, it creates a split port and is dependent on new strategic infrastructure (e.g. the HK-Z-M Bridge or a new standalone link to North Lantau Highway).
! Development at NWL would generate ecological impacts – in particular on the Chinese White Dolphin habitat – and have a visual impact on a previously undeveloped rural area.
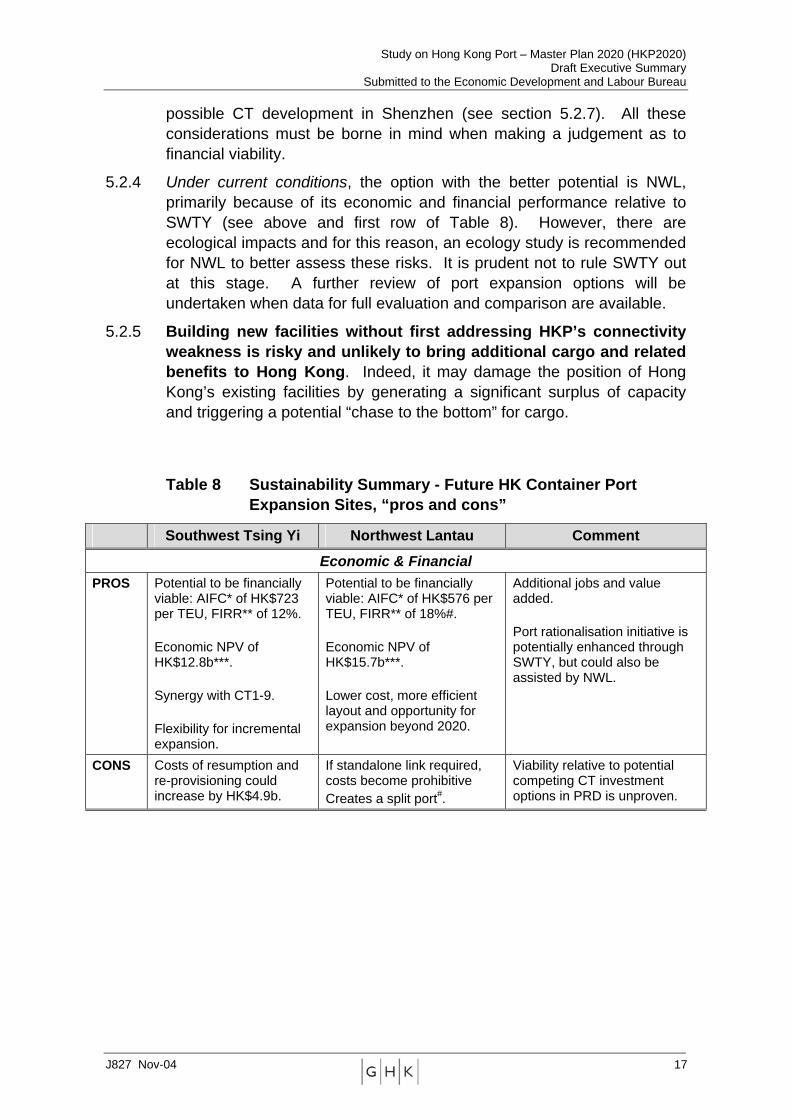
5.2.2 Table 8 provides a summary of the key pros and cons comparison between the two development options as highlighted by the sustainability assessment undertaken for HKP2020. Development at either SWTY or NWL could bring a number of benefits to Hong Kong including additional jobs and value added. Both options have the potential to be financially and economically viable if market conditions are favourable, and have an economic net present value over the planning period of $12.8b for SWTY and $15.7b for NWL – this is an indication of the economic return that could be generated for Hong Kong.6
5.2.3 However, it should be stressed that the assessment of financial viability is based on a number of assumptions, in particular an average container handling charge (CHC) of around $800 per TEU. 7 Exact charges however, are difficult to determine due to the differential pricing structure of port operations and confidentiality. The approach to calculating financial viability and any possible surplus assumes a zero premium.8 Moreover, consideration must be given to possible competing CT investment options – how attractive to an investor is CT10 versus a
6 Evaluations of SWTY and NWL included economic and financial assessment. The economic assessment addresses the CT investment from the perspective of society in Hong Kong – in other words, the economic return that Hong Kong might earn from its port, whereas the financial assessment addresses the investment in terms of commercial viability – i.e. from the perspective of a potential investor, rather than the wider Hong Kong society. 7 Current prime headline rate CHCs are in the range $1,000-$1,500/TEU and are falling – the average CHC is around $800/TEU. 8 The approach used seeks to assess what surplus might be available for allocation between the private sector and Government – i.e. the potential premium that might be paid is an “output” from the assessment rather than an “input”.
Study on Hong Kong Port – Master Plan 2020 (HKP2020) Draft Executive Summary
Submitted to the Economic Development and Labour Bureau
J827 Nov-04 17
possible CT development in Shenzhen (see section 5.2.7). All these considerations must be borne in mind when making a judgement as to financial viability.
5.2.4 Under current conditions, the option with the better potential is NWL, primarily because of its economic and financial performance relative to SWTY (see above and first row of Table 8). However, there are ecological impacts and for this reason, an ecology study is recommended for NWL to better assess these risks. It is prudent not to rule SWTY out at this stage. A further review of port expansion options will be undertaken when data for full evaluation and comparison are available.
5.2.5 Building new facilities without first addressing HKP’s connectivity weakness is risky and unlikely to bring additional cargo and related benefits to Hong Kong. Indeed, it may damage the position of Hong Kong’s existing facilities by generating a significant surplus of capacity and triggering a potential “chase to the bottom” for cargo.
Table 8 Sustainability Summary - Future HK Container Port Expansion Sites, “pros and cons”
Southwest Tsing Yi Northwest Lantau Comment
Economic & Financial PROS Potential to be financially
viable: AIFC* of HK$723 per TEU, FIRR** of 12%. Economic NPV of HK$12.8b***. Synergy with CT1-9. Flexibility for incremental expansion.
Potential to be financially viable: AIFC* of HK$576 per TEU, FIRR** of 18%#. Economic NPV of HK$15.7b***. Lower cost, more efficient layout and opportunity for expansion beyond 2020.
Additional jobs and value added. Port rationalisation initiative is potentially enhanced through SWTY, but could also be assisted by NWL.
CONS Costs of resumption and re-provisioning could increase by HK$4.9b.
If standalone link required, costs become prohibitive Creates a split port#.
Viability relative to potential competing CT investment options in PRD is unproven.
Study on Hong Kong Port – Master Plan 2020 (HKP2020) Draft Executive Summary
Submitted to the Economic Development and Labour Bureau
J827 Nov-04 18
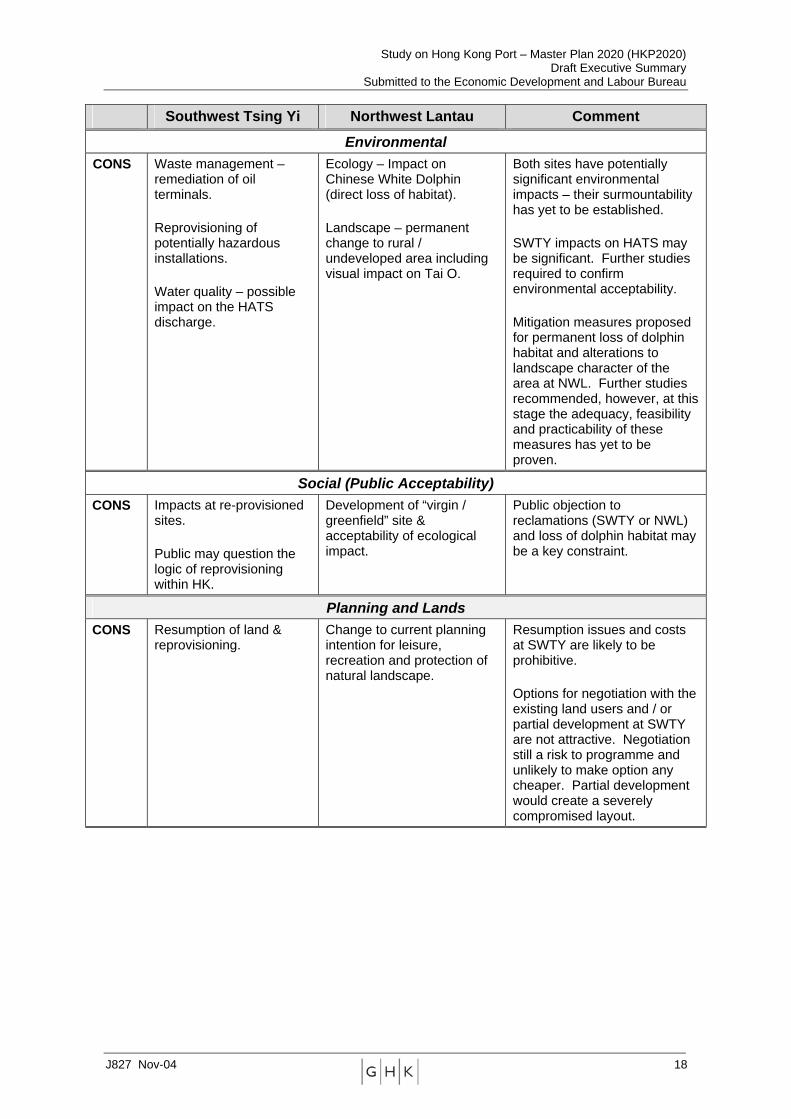
Southwest Tsing Yi Northwest Lantau Comment
Environmental CONS Waste management –
remediation of oil terminals. Reprovisioning of potentially hazardous installations. Water quality – possible impact on the HATS discharge.
Ecology – Impact on Chinese White Dolphin (direct loss of habitat). Landscape – permanent change to rural / undeveloped area including visual impact on Tai O.
Both sites have potentially significant environmental impacts – their surmountability has yet to be established. SWTY impacts on HATS may be significant. Further studies required to confirm environmental acceptability. Mitigation measures proposed for permanent loss of dolphin habitat and alterations to landscape character of the area at NWL. Further studies recommended, however, at this stage the adequacy, feasibility and practicability of these measures has yet to be proven.
Social (Public Acceptability) CONS Impacts at re-provisioned
sites. Public may question the logic of reprovisioning within HK.
Development of “virgin / greenfield” site & acceptability of ecological impact.
Public objection to reclamations (SWTY or NWL) and loss of dolphin habitat may be a key constraint.
Planning and Lands CONS Resumption of land &
reprovisioning.
Change to current planning intention for leisure, recreation and protection of natural landscape.
Resumption issues and costs at SWTY are likely to be prohibitive. Options for negotiation with the existing land users and / or partial development at SWTY are not attractive. Negotiation still a risk to programme and unlikely to make option any cheaper. Partial development would create a severely compromised layout.
Study on Hong Kong Port – Master Plan 2020 (HKP2020) Draft Executive Summary
Submitted to the Economic Development and Labour Bureau
J827 Nov-04 19
Southwest Tsing Yi Northwest Lantau Comment
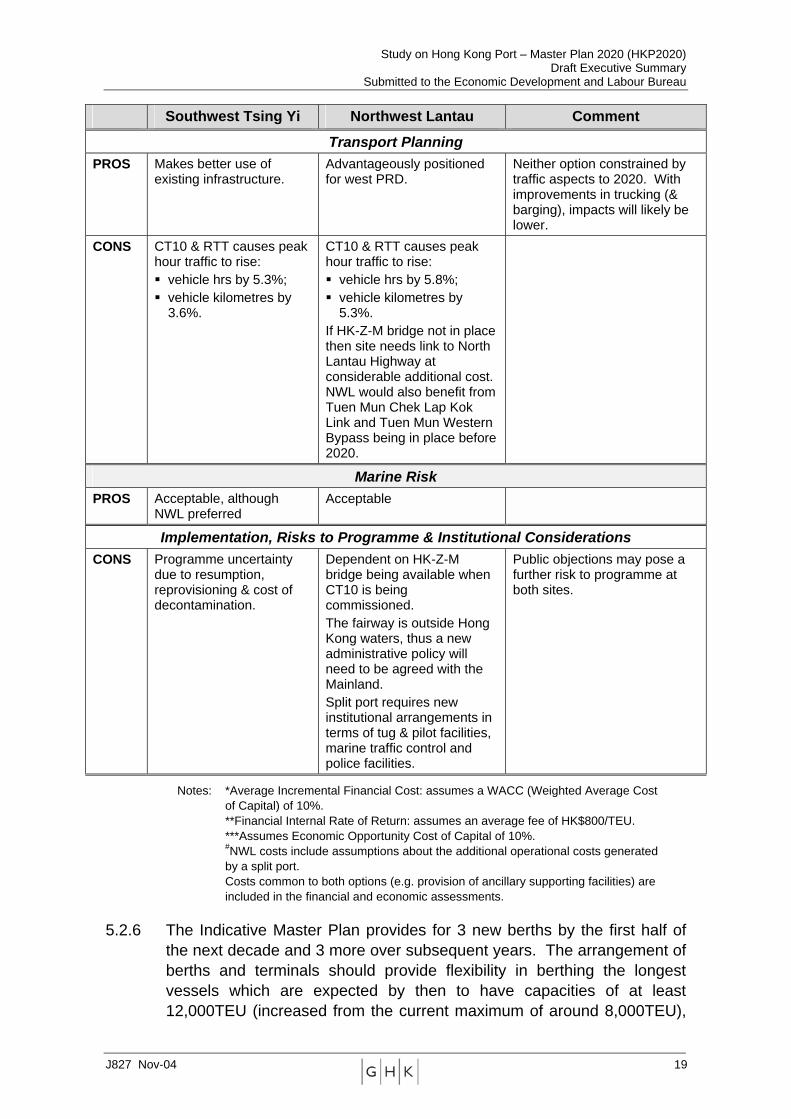
Transport Planning PROS Makes better use of
existing infrastructure. Advantageously positioned for west PRD.
Neither option constrained by traffic aspects to 2020. With improvements in trucking (& barging), impacts will likely be lower.
CONS CT10 & RTT causes peak hour traffic to rise: ! vehicle hrs by 5.3%; ! vehicle kilometres by
3.6%.
CT10 & RTT causes peak hour traffic to rise: ! vehicle hrs by 5.8%; ! vehicle kilometres by
5.3%. If HK-Z-M bridge not in place then site needs link to North Lantau Highway at considerable additional cost. NWL would also benefit from Tuen Mun Chek Lap Kok Link and Tuen Mun Western Bypass being in place before 2020.
Marine Risk PROS Acceptable, although
NWL preferred Acceptable
Implementation, Risks to Programme & Institutional Considerations CONS Programme uncertainty
due to resumption, reprovisioning & cost of decontamination.
Dependent on HK-Z-M bridge being available when CT10 is being commissioned. The fairway is outside Hong Kong waters, thus a new administrative policy will need to be agreed with the Mainland. Split port requires new institutional arrangements in terms of tug & pilot facilities, marine traffic control and police facilities.
Public objections may pose a further risk to programme at both sites.
Notes: *Average Incremental Financial Cost: assumes a WACC (Weighted Average Cost of Capital) of 10%. **Financial Internal Rate of Return: assumes an average fee of HK$800/TEU. ***Assumes Economic Opportunity Cost of Capital of 10%.
#NWL costs include assumptions about the additional operational costs generated by a split port. Costs common to both options (e.g. provision of ancillary supporting facilities) are included in the financial and economic assessments.
5.2.6 The Indicative Master Plan provides for 3 new berths by the first half of the next decade and 3 more over subsequent years. The arrangement of berths and terminals should provide flexibility in berthing the longest vessels which are expected by then to have capacities of at least 12,000TEU (increased from the current maximum of around 8,000TEU),
Study on Hong Kong Port – Master Plan 2020 (HKP2020) Draft Executive Summary
Submitted to the Economic Development and Labour Bureau
J827 Nov-04 20
lengths of up to 400m or possibly a little more, and require depths of up to 17m. The new CTs are projected to have a container throughput of 8.1MTEU by 2020 and could generate significant economic benefits for Hong Kong – a possible additional 22,500 jobs and $11.14 billion additional value added in 2020.
Competing Port Investment Options
5.2.7 Despite the potential benefits offered by CT expansion, terminal infrastructure construction over the boundary is estimated to be about 70% of the cost in Hong Kong. Hong Kong operating costs are also likely to be greater than Shenzhen largely due to differences in wage rates.
5.2.8 This is not to say there should be no further port expansion in Hong Kong. However, it re-iterates the need to concentrate attention on maximising returns from Hong Kong’s current port assets as an immediate priority – this is the most sustainable strategy. This then becomes a key supporting step for further CT construction. As market conditions change then the economics of future CT construction may also change. The Government will continuously monitor market conditions and respond to the issues and opportunities emerging.
6 MAKING IT HAPPEN
6.1.1 Hong Kong’s port is at a turning point. South China export cargo – the value driver of the port - is increasingly being diverted to Shenzhen ports. Market share here delivers value-added and jobs. As critical mass builds up at the PRD ports and significant capacity expansion comes on stream Hong Kong’s port future is in the balance and with it a major asset of the economy. Standing still threatens employment and income.
6.1.2 The stakes are high but what needs to be done is clear. Road haulage costs are the problem and they need to be reduced. THCs need to be placed on a par with Shenzhen ports. Hong Kong Government – at the most senior levels – is committed to the port and will take a leading role in securing these results. Implementing the SCI and focusing on its effectiveness is the challenge. These are the priorities for immediate action.
6.1.3 Successful achievement in improving the cost competitiveness of Hong Kong then “triggers” an emphasis on getting the most from existing assets – the PPI. Hong Kong’s historical investment in port assets can deliver a decisive advantage relative to high cost new CTs. Using existing assets better also limits the environmental footprint of the port. Improving productivity is good for the economy and the environment – a win–win!
6.1.4 The next steps are to:
Study on Hong Kong Port – Master Plan 2020 (HKP2020) Draft Executive Summary
Submitted to the Economic Development and Labour Bureau
J827 Nov-04 21
i. Immediately implement the Super Connectivity Initiative;
ii. Update the port cargo forecasts taking into account latest developments and data; review the demand and supply of facilities in South China, the competitiveness of Hong Kong port and the likely demand and timing for CT10; and
iii. Undertake an Ecology Study for a potential CT10 at NWL as soon as practicable.
6.1.5 A lot needs to be done to secure continued growth in throughput which will decide the way forward for the future expansion of HKP. Planning for this must not detract from the pressing need to deliver on the short term priorities.
6.1.6 Hong Kong as always will be ready for the challenge.
Study on Hong Kong Port – Master Plan 2020 (HKP2020) Draft Executive Summary
Submitted to the Economic Development and Labour Bureau
J827 Nov-04 22
Figure 4 The Indicative Port Master Plan at 2020
Study on Hong Kong Port – Master Plan 2020 (HKP2020) Draft Executive Summary
Submitted to the Economic Development and Labour Bureau
J827 Nov-04 23
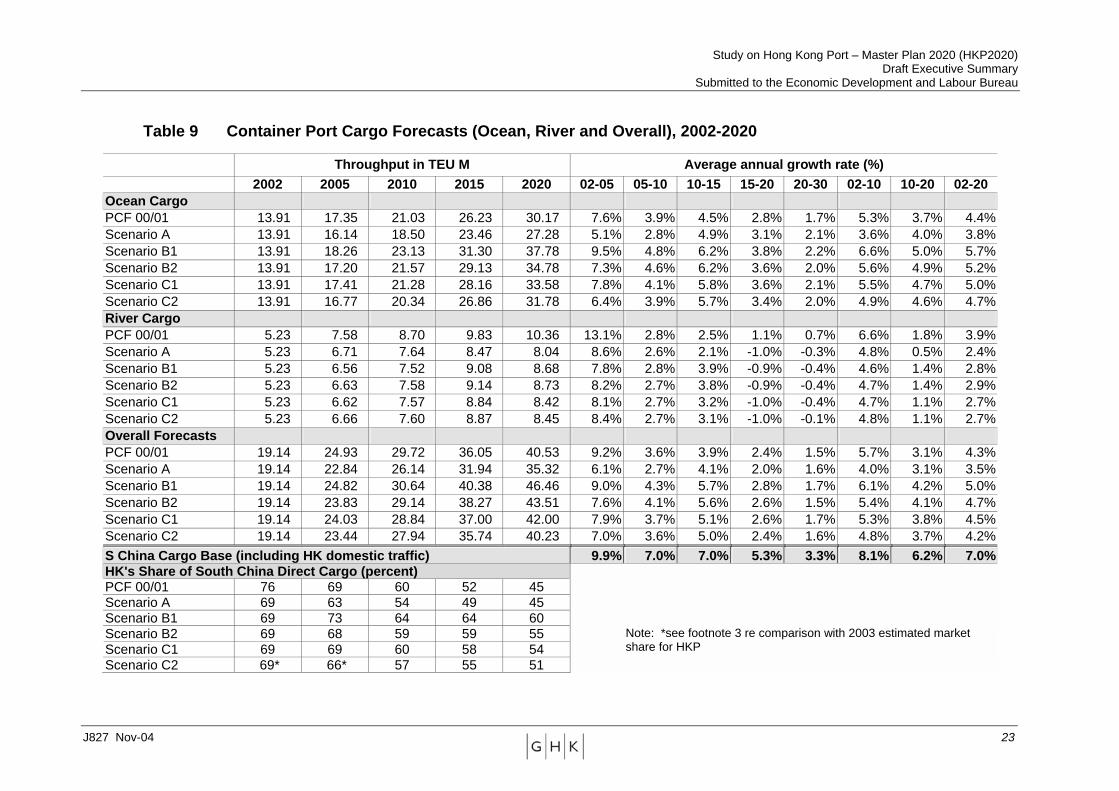
Table 9 Container Port Cargo Forecasts (Ocean, River and Overall), 2002-2020
Throughput in TEU M Average annual growth rate (%) 2002 2005 2010 2015 2020 02-05 05-10 10-15 15-20 20-30 02-10 10-20 02-20
Ocean Cargo PCF 00/01 13.91 17.35 21.03 26.23 30.17 7.6% 3.9% 4.5% 2.8% 1.7% 5.3% 3.7% 4.4% Scenario A 13.91 16.14 18.50 23.46 27.28 5.1% 2.8% 4.9% 3.1% 2.1% 3.6% 4.0% 3.8% Scenario B1 13.91 18.26 23.13 31.30 37.78 9.5% 4.8% 6.2% 3.8% 2.2% 6.6% 5.0% 5.7% Scenario B2 13.91 17.20 21.57 29.13 34.78 7.3% 4.6% 6.2% 3.6% 2.0% 5.6% 4.9% 5.2% Scenario C1 13.91 17.41 21.28 28.16 33.58 7.8% 4.1% 5.8% 3.6% 2.1% 5.5% 4.7% 5.0% Scenario C2 13.91 16.77 20.34 26.86 31.78 6.4% 3.9% 5.7% 3.4% 2.0% 4.9% 4.6% 4.7% River Cargo PCF 00/01 5.23 7.58 8.70 9.83 10.36 13.1% 2.8% 2.5% 1.1% 0.7% 6.6% 1.8% 3.9% Scenario A 5.23 6.71 7.64 8.47 8.04 8.6% 2.6% 2.1% -1.0% -0.3% 4.8% 0.5% 2.4% Scenario B1 5.23 6.56 7.52 9.08 8.68 7.8% 2.8% 3.9% -0.9% -0.4% 4.6% 1.4% 2.8% Scenario B2 5.23 6.63 7.58 9.14 8.73 8.2% 2.7% 3.8% -0.9% -0.4% 4.7% 1.4% 2.9% Scenario C1 5.23 6.62 7.57 8.84 8.42 8.1% 2.7% 3.2% -1.0% -0.4% 4.7% 1.1% 2.7% Scenario C2 5.23 6.66 7.60 8.87 8.45 8.4% 2.7% 3.1% -1.0% -0.1% 4.8% 1.1% 2.7% Overall Forecasts PCF 00/01 19.14 24.93 29.72 36.05 40.53 9.2% 3.6% 3.9% 2.4% 1.5% 5.7% 3.1% 4.3% Scenario A 19.14 22.84 26.14 31.94 35.32 6.1% 2.7% 4.1% 2.0% 1.6% 4.0% 3.1% 3.5% Scenario B1 19.14 24.82 30.64 40.38 46.46 9.0% 4.3% 5.7% 2.8% 1.7% 6.1% 4.2% 5.0% Scenario B2 19.14 23.83 29.14 38.27 43.51 7.6% 4.1% 5.6% 2.6% 1.5% 5.4% 4.1% 4.7% Scenario C1 19.14 24.03 28.84 37.00 42.00 7.9% 3.7% 5.1% 2.6% 1.7% 5.3% 3.8% 4.5% Scenario C2 19.14 23.44 27.94 35.74 40.23 7.0% 3.6% 5.0% 2.4% 1.6% 4.8% 3.7% 4.2% S China Cargo Base (including HK domestic traffic) 9.9% 7.0% 7.0% 5.3% 3.3% 8.1% 6.2% 7.0% HK's Share of South China Direct Cargo (percent) PCF 00/01 76 69 60 52 45 Scenario A 69 63 54 49 45 Scenario B1 69 73 64 64 60 Scenario B2 69 68 59 59 55 Scenario C1 69 69 60 58 54
Note: *see footnote 3 re comparison with 2003 estimated market share for HKP
Scenario C2 69* 66* 57 55 51