Legislative Assembly - Australian Electoral Commission · Legislative Assembly. 2017 State General...
30
Candidates .................................................................................................................. 1 Two-Candidate Preferred Result ................................................................................. 11 Elected Members of Parliament .................................................................................. 14 Statewide Margins by District – 2017 .......................................................................... 16 Final Distribution of Preferences Summary ................................................................. 18 First Preference Votes ................................................................................................. 19 Types of Votes by District ............................................................................................ 20 Types of Votes by Region – Metropolitan .................................................................... 21 Types of Votes by Region – Country ........................................................................... 22 Informal Voting Summary ............................................................................................ 23 Informal Survey – Metropolitan.................................................................................... 24 Informal Survey – Country ........................................................................................... 25 State General Elections: Comparative Summary 2001 to 2017 .................................. 26 First Preference Votes: Comparative Summary 2001 to 2017 .................................... 27 Types of Votes: Comparative Summary 2001 to 2017 ................................................ 28 Types of Votes and Turnout Percentages: Comparative Summary 2001 to 2017 ...... 29 Legislative Assembly
-
Upload
trinhkhuong -
Category
Documents
-
view
217 -
download
0
Transcript of Legislative Assembly - Australian Electoral Commission · Legislative Assembly. 2017 State General...
Candidates .................................................................................................................. 1Two-Candidate Preferred Result ................................................................................. 11Elected Members of Parliament .................................................................................. 14Statewide Margins by District – 2017 .......................................................................... 16Final Distribution of Preferences Summary ................................................................. 18First Preference Votes ................................................................................................. 19Types of Votes by District ............................................................................................ 20Types of Votes by Region – Metropolitan .................................................................... 21Types of Votes by Region – Country ........................................................................... 22Informal Voting Summary ............................................................................................ 23Informal Survey – Metropolitan.................................................................................... 24Informal Survey – Country ........................................................................................... 25
State General Elections: Comparative Summary 2001 to 2017 .................................. 26
First Preference Votes: Comparative Summary 2001 to 2017 .................................... 27
Types of Votes: Comparative Summary 2001 to 2017 ................................................ 28
Types of Votes and Turnout Percentages: Comparative Summary 2001 to 2017 ...... 29
LegislativeAssembly
2017 State General ElectionResults and Statistics Report
1
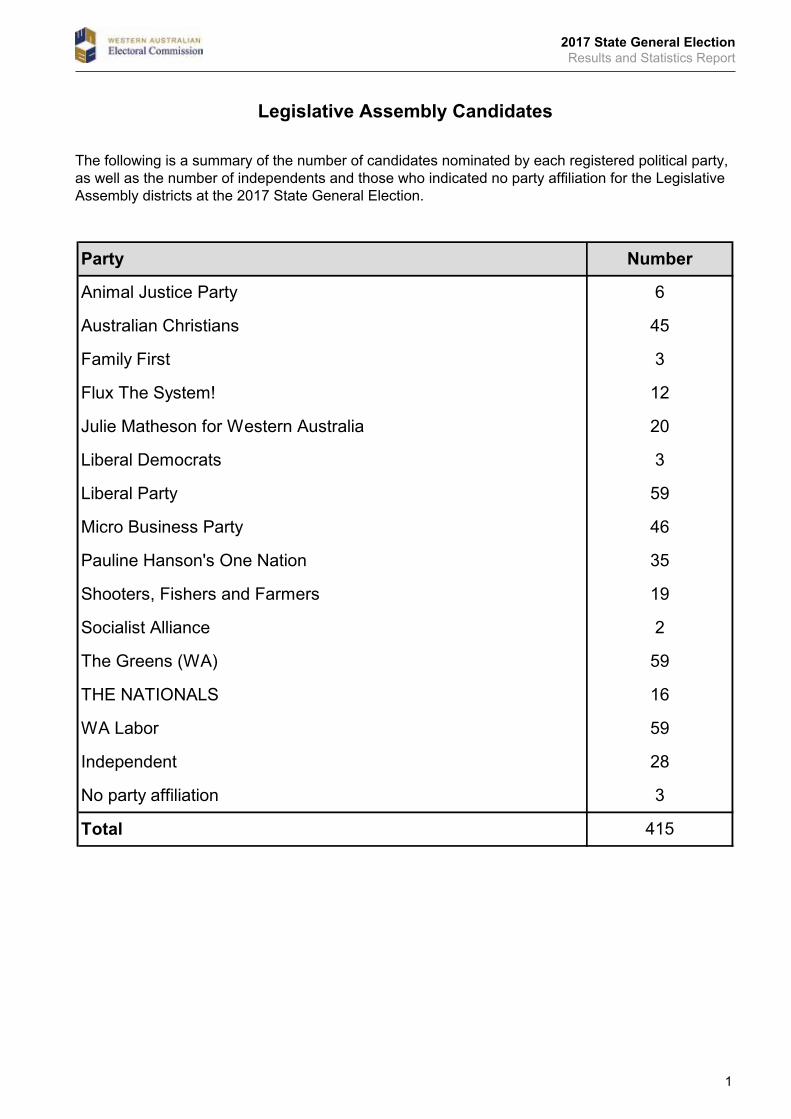
Legislative Assembly Candidates
Independent 28
No party affiliation 3
Total 415
The Greens (WA) 59
THE NATIONALS 16
WA Labor 59
Pauline Hanson's One Nation 35
Shooters, Fishers and Farmers 19
Socialist Alliance 2
Liberal Democrats 3
Liberal Party 59
Micro Business Party 46
Family First 3
Flux The System! 12
Julie Matheson for Western Australia 20
Party Number
Animal Justice Party 6
Australian Christians 45
The following is a summary of the number of candidates nominated by each registered political party, as well as the number of independents and those who indicated no party affiliation for the Legislative Assembly districts at the 2017 State General Election.
2017 State General ElectionResults and Statistics Report
2
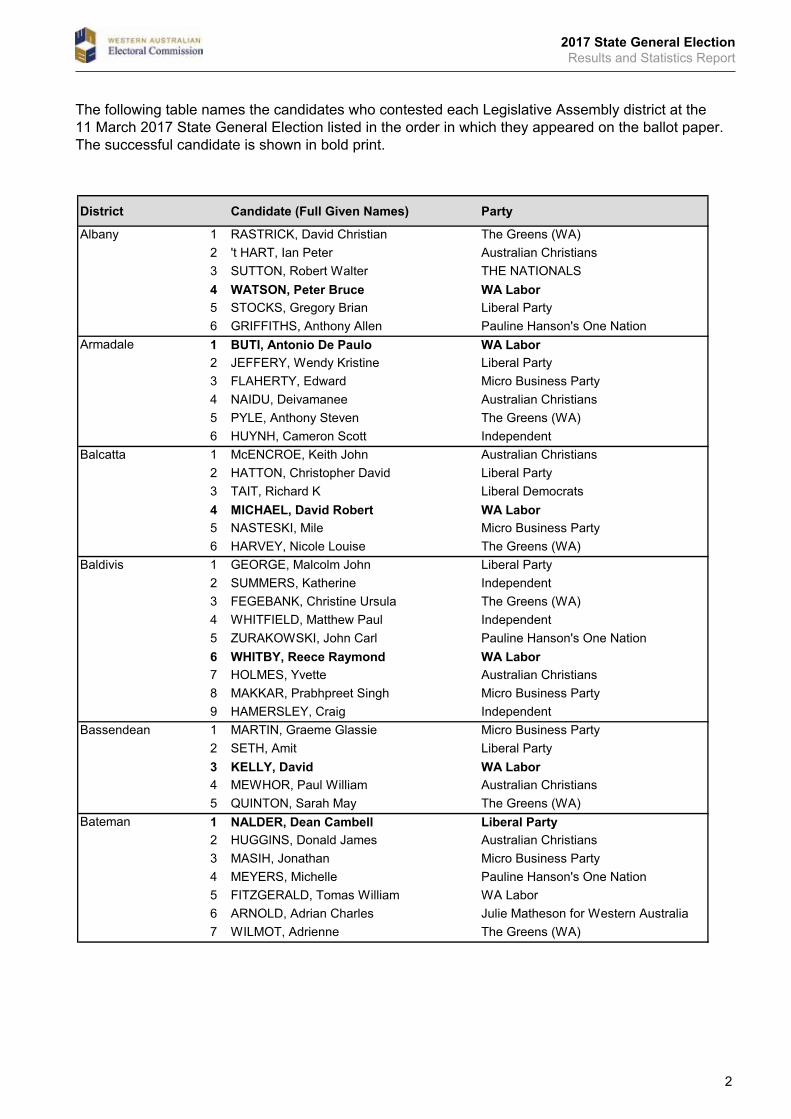
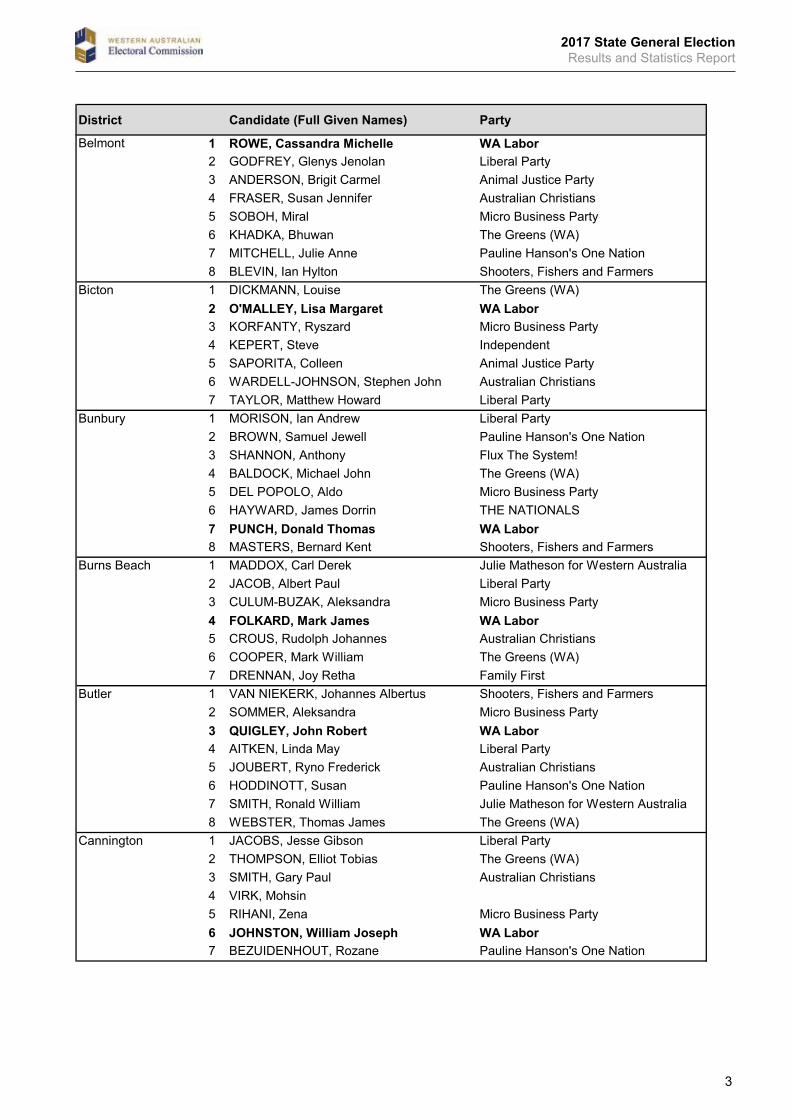
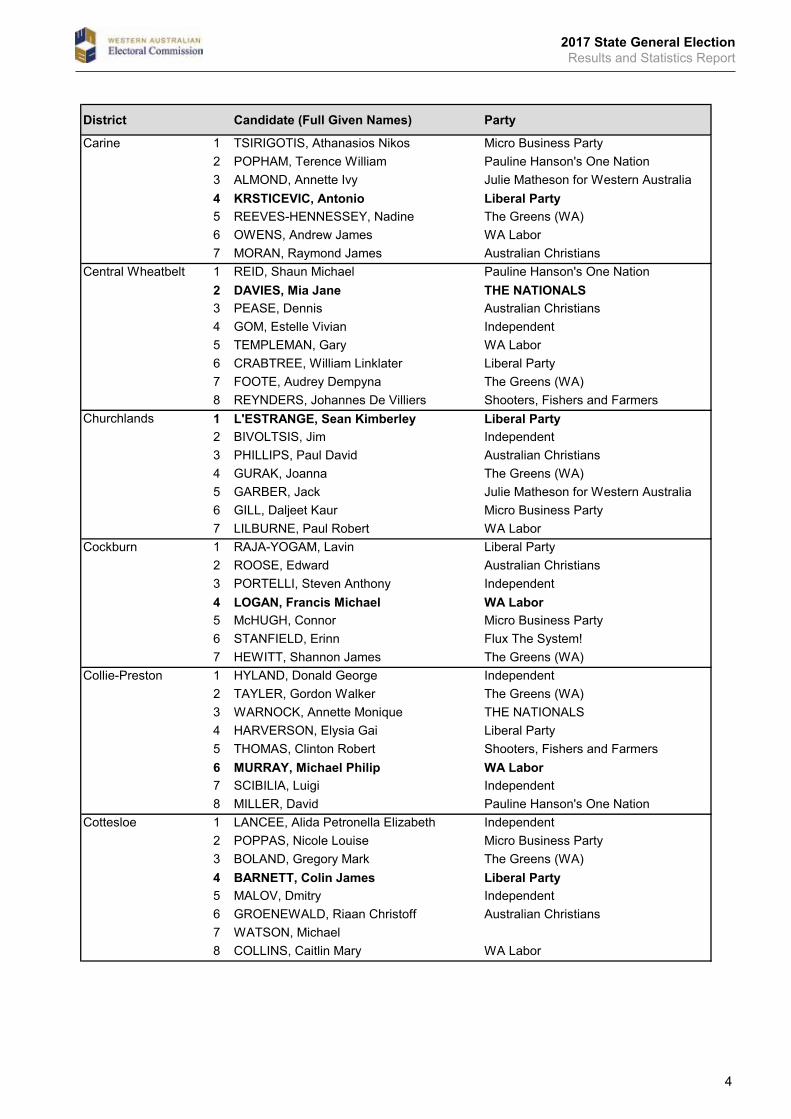
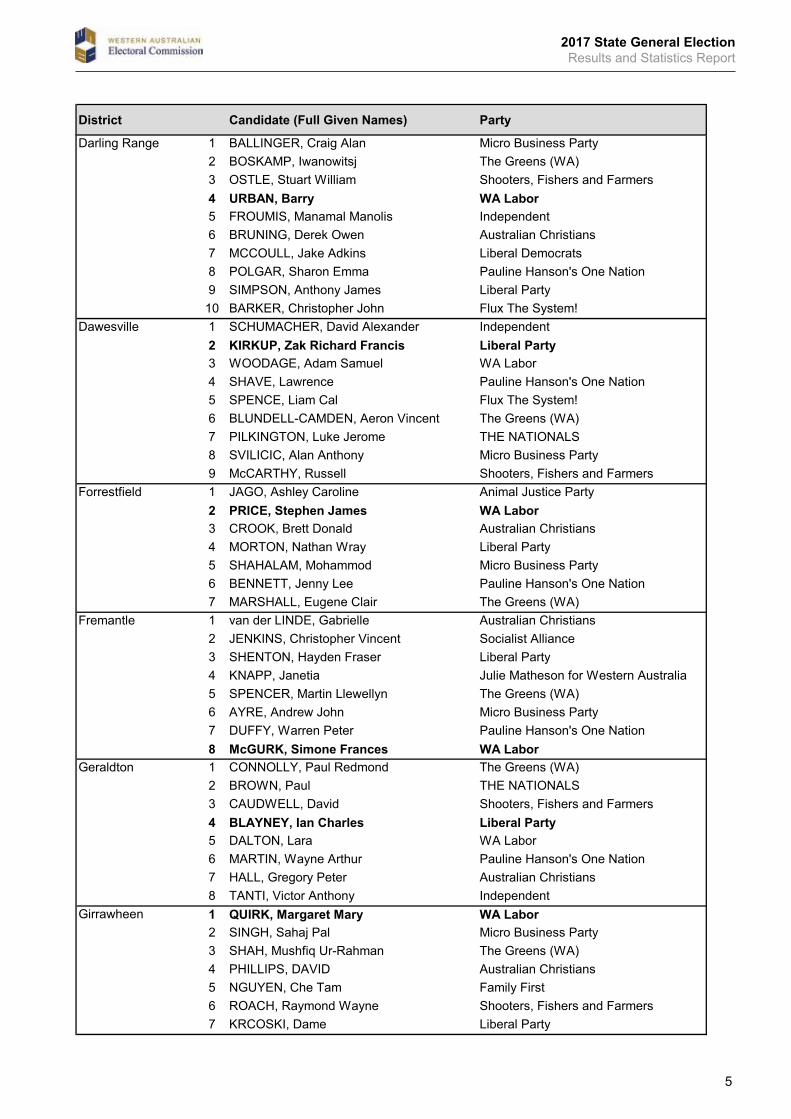
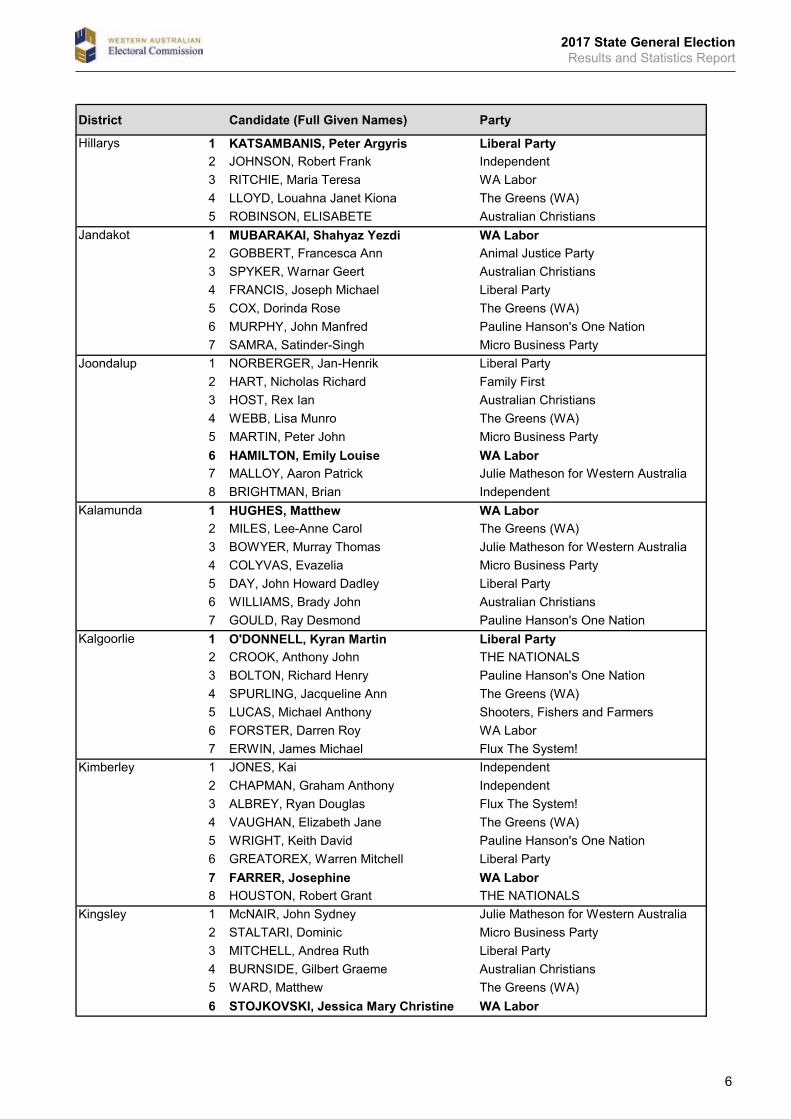
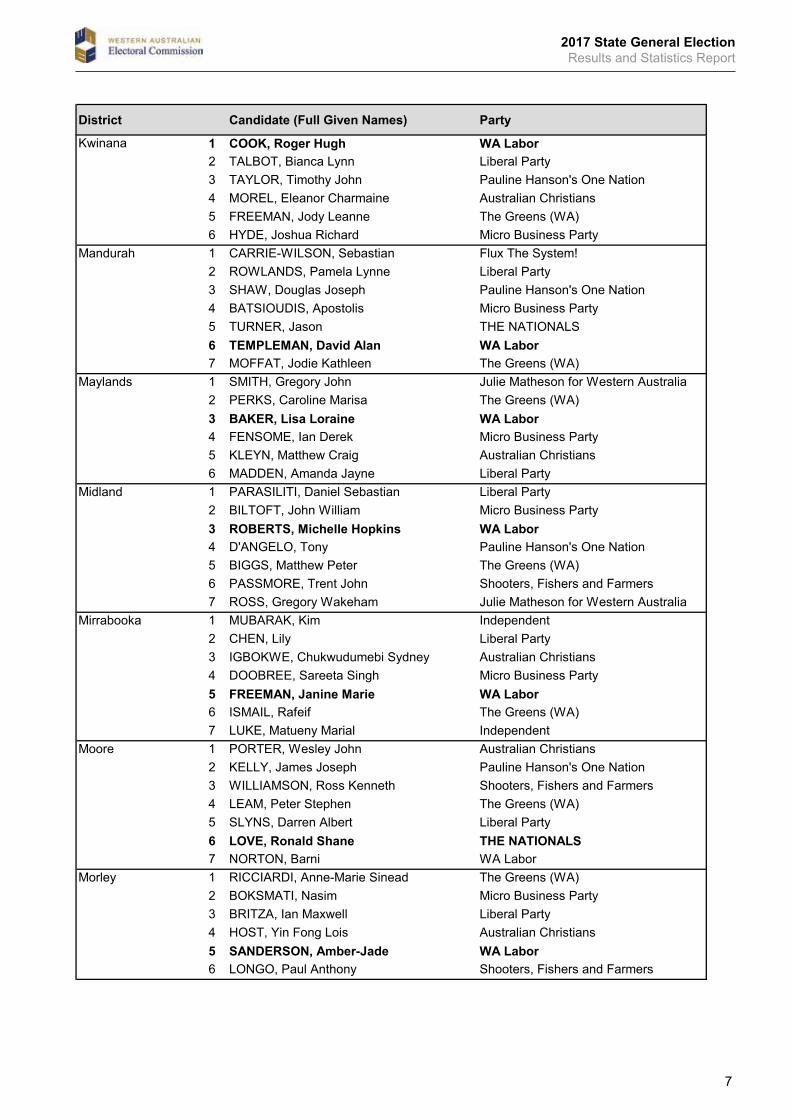
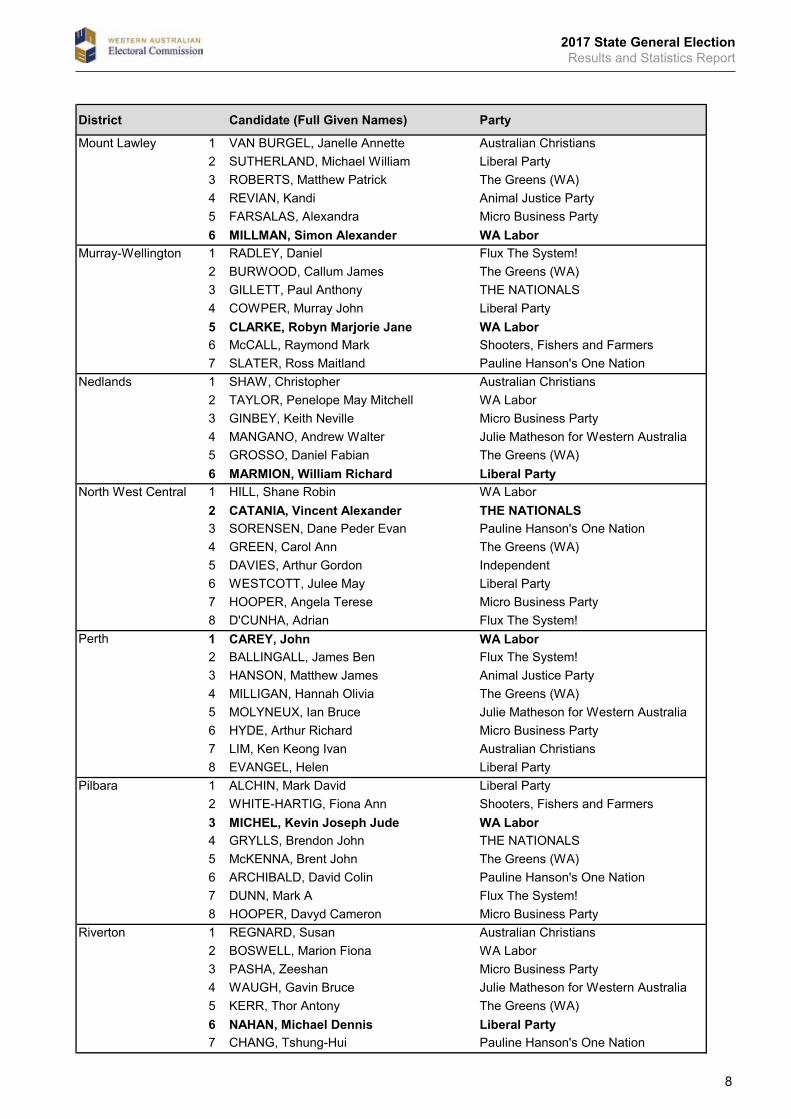
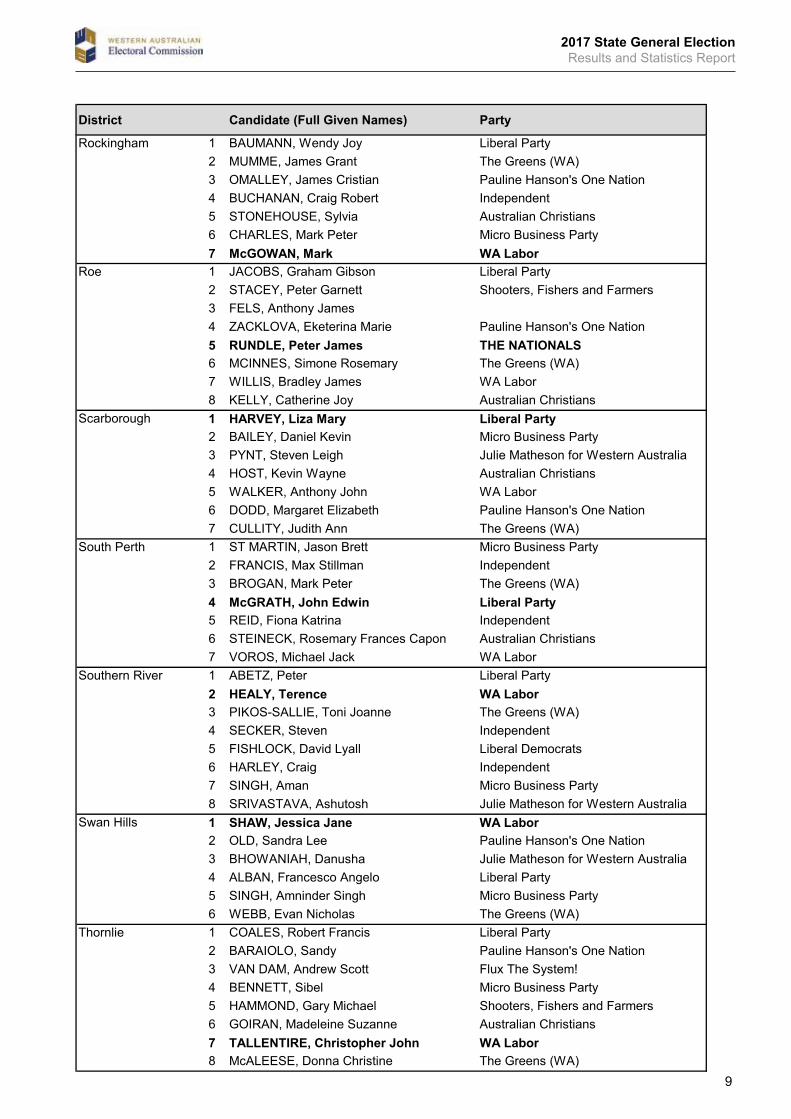
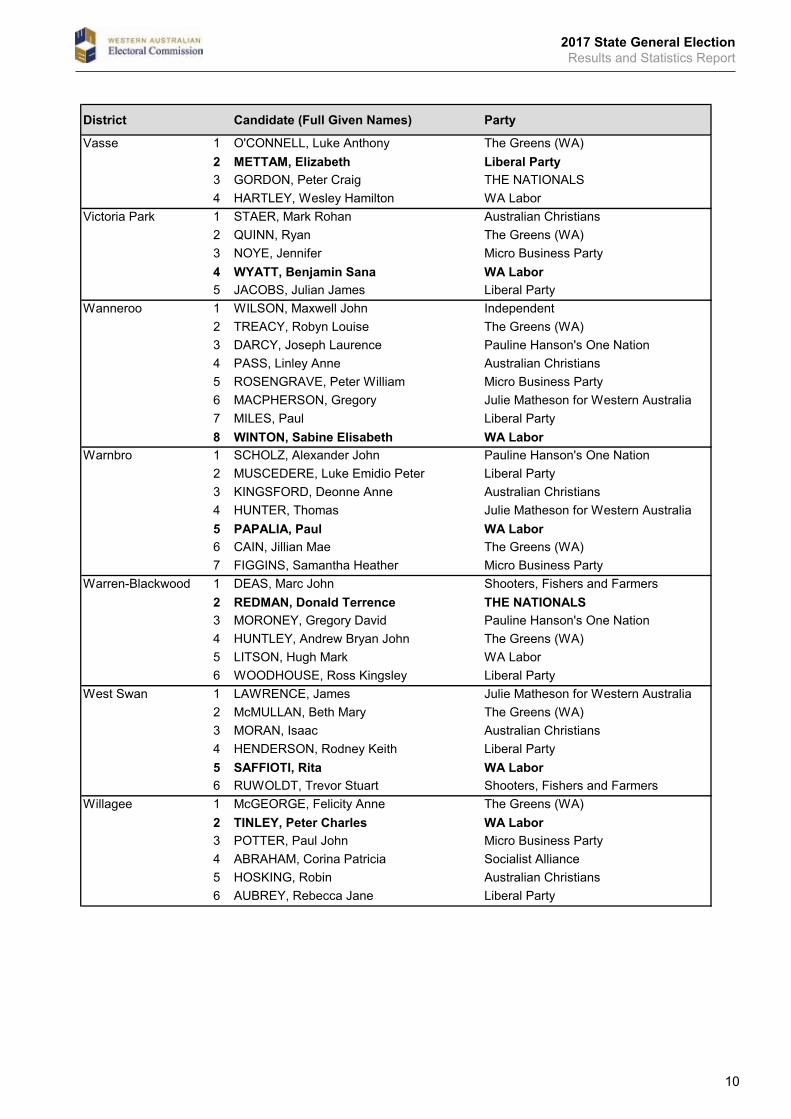
The following table names the candidates who contested each Legislative Assembly district at the 11 March 2017 State General Election listed in the order in which they appeared on the ballot paper. The successful candidate is shown in bold print.
District Candidate (Full Given Names) Party
Albany 1 RASTRICK, David Christian The Greens (WA)2 't HART, Ian Peter Australian Christians3 SUTTON, Robert Walter THE NATIONALS4 WATSON, Peter Bruce WA Labor5 STOCKS, Gregory Brian Liberal Party6 GRIFFITHS, Anthony Allen Pauline Hanson's One Nation
Armadale 1 BUTI, Antonio De Paulo WA Labor2 JEFFERY, Wendy Kristine Liberal Party3 FLAHERTY, Edward Micro Business Party4 NAIDU, Deivamanee Australian Christians5 PYLE, Anthony Steven The Greens (WA)6 HUYNH, Cameron Scott Independent
Balcatta 1 McENCROE, Keith John Australian Christians2 HATTON, Christopher David Liberal Party3 TAIT, Richard K Liberal Democrats4 MICHAEL, David Robert WA Labor5 NASTESKI, Mile Micro Business Party6 HARVEY, Nicole Louise The Greens (WA)
Baldivis 1 GEORGE, Malcolm John Liberal Party2 SUMMERS, Katherine Independent3 FEGEBANK, Christine Ursula The Greens (WA)4 WHITFIELD, Matthew Paul Independent5 ZURAKOWSKI, John Carl Pauline Hanson's One Nation6 WHITBY, Reece Raymond WA Labor7 HOLMES, Yvette Australian Christians8 MAKKAR, Prabhpreet Singh Micro Business Party9 HAMERSLEY, Craig Independent
Bassendean 1 MARTIN, Graeme Glassie Micro Business Party2 SETH, Amit Liberal Party3 KELLY, David WA Labor4 MEWHOR, Paul William Australian Christians5 QUINTON, Sarah May The Greens (WA)
Bateman 1 NALDER, Dean Cambell Liberal Party2 HUGGINS, Donald James Australian Christians3 MASIH, Jonathan Micro Business Party4 MEYERS, Michelle Pauline Hanson's One Nation5 FITZGERALD, Tomas William WA Labor6 ARNOLD, Adrian Charles Julie Matheson for Western Australia7 WILMOT, Adrienne The Greens (WA)
The following table shows the candidates who contested each Legislative Assembly district at the 11 March 2017 State General
Election listed in the order in which they appeared on the ballot paper. The successful candidate is shown in bold print.
2017 State General ElectionResults and Statistics Report
3
District Candidate (Full Given Names) Party
Belmont 1 ROWE, Cassandra Michelle WA Labor2 GODFREY, Glenys Jenolan Liberal Party3 ANDERSON, Brigit Carmel Animal Justice Party4 FRASER, Susan Jennifer Australian Christians5 SOBOH, Miral Micro Business Party6 KHADKA, Bhuwan The Greens (WA)7 MITCHELL, Julie Anne Pauline Hanson's One Nation8 BLEVIN, Ian Hylton Shooters, Fishers and Farmers
Bicton 1 DICKMANN, Louise The Greens (WA)2 O'MALLEY, Lisa Margaret WA Labor3 KORFANTY, Ryszard Micro Business Party4 KEPERT, Steve Independent5 SAPORITA, Colleen Animal Justice Party6 WARDELL-JOHNSON, Stephen John Australian Christians7 TAYLOR, Matthew Howard Liberal Party
Bunbury 1 MORISON, Ian Andrew Liberal Party2 BROWN, Samuel Jewell Pauline Hanson's One Nation3 SHANNON, Anthony Flux The System!4 BALDOCK, Michael John The Greens (WA)5 DEL POPOLO, Aldo Micro Business Party6 HAYWARD, James Dorrin THE NATIONALS7 PUNCH, Donald Thomas WA Labor8 MASTERS, Bernard Kent Shooters, Fishers and Farmers
Burns Beach 1 MADDOX, Carl Derek Julie Matheson for Western Australia2 JACOB, Albert Paul Liberal Party3 CULUM-BUZAK, Aleksandra Micro Business Party4 FOLKARD, Mark James WA Labor5 CROUS, Rudolph Johannes Australian Christians6 COOPER, Mark William The Greens (WA)7 DRENNAN, Joy Retha Family First
Butler 1 VAN NIEKERK, Johannes Albertus Shooters, Fishers and Farmers2 SOMMER, Aleksandra Micro Business Party3 QUIGLEY, John Robert WA Labor4 AITKEN, Linda May Liberal Party5 JOUBERT, Ryno Frederick Australian Christians6 HODDINOTT, Susan Pauline Hanson's One Nation7 SMITH, Ronald William Julie Matheson for Western Australia8 WEBSTER, Thomas James The Greens (WA)
Cannington 1 JACOBS, Jesse Gibson Liberal Party2 THOMPSON, Elliot Tobias The Greens (WA)3 SMITH, Gary Paul Australian Christians4 VIRK, Mohsin 5 RIHANI, Zena Micro Business Party6 JOHNSTON, William Joseph WA Labor7 BEZUIDENHOUT, Rozane Pauline Hanson's One Nation
2017 State General ElectionResults and Statistics Report
4
District Candidate (Full Given Names) Party
Carine 1 TSIRIGOTIS, Athanasios Nikos Micro Business Party2 POPHAM, Terence William Pauline Hanson's One Nation3 ALMOND, Annette Ivy Julie Matheson for Western Australia4 KRSTICEVIC, Antonio Liberal Party5 REEVES-HENNESSEY, Nadine The Greens (WA)6 OWENS, Andrew James WA Labor7 MORAN, Raymond James Australian Christians
Central Wheatbelt 1 REID, Shaun Michael Pauline Hanson's One Nation2 DAVIES, Mia Jane THE NATIONALS3 PEASE, Dennis Australian Christians4 GOM, Estelle Vivian Independent5 TEMPLEMAN, Gary WA Labor6 CRABTREE, William Linklater Liberal Party7 FOOTE, Audrey Dempyna The Greens (WA)8 REYNDERS, Johannes De Villiers Shooters, Fishers and Farmers
Churchlands 1 L'ESTRANGE, Sean Kimberley Liberal Party2 BIVOLTSIS, Jim Independent3 PHILLIPS, Paul David Australian Christians4 GURAK, Joanna The Greens (WA)5 GARBER, Jack Julie Matheson for Western Australia6 GILL, Daljeet Kaur Micro Business Party7 LILBURNE, Paul Robert WA Labor
Cockburn 1 RAJA-YOGAM, Lavin Liberal Party2 ROOSE, Edward Australian Christians3 PORTELLI, Steven Anthony Independent4 LOGAN, Francis Michael WA Labor5 McHUGH, Connor Micro Business Party6 STANFIELD, Erinn Flux The System!7 HEWITT, Shannon James The Greens (WA)
Collie-Preston 1 HYLAND, Donald George Independent2 TAYLER, Gordon Walker The Greens (WA)3 WARNOCK, Annette Monique THE NATIONALS4 HARVERSON, Elysia Gai Liberal Party5 THOMAS, Clinton Robert Shooters, Fishers and Farmers6 MURRAY, Michael Philip WA Labor7 SCIBILIA, Luigi Independent8 MILLER, David Pauline Hanson's One Nation
Cottesloe 1 LANCEE, Alida Petronella Elizabeth Independent2 POPPAS, Nicole Louise Micro Business Party3 BOLAND, Gregory Mark The Greens (WA)4 BARNETT, Colin James Liberal Party5 MALOV, Dmitry Independent6 GROENEWALD, Riaan Christoff Australian Christians7 WATSON, Michael 8 COLLINS, Caitlin Mary WA Labor
2017 State General ElectionResults and Statistics Report
5
District Candidate (Full Given Names) Party
Darling Range 1 BALLINGER, Craig Alan Micro Business Party2 BOSKAMP, Iwanowitsj The Greens (WA)3 OSTLE, Stuart William Shooters, Fishers and Farmers4 URBAN, Barry WA Labor5 FROUMIS, Manamal Manolis Independent6 BRUNING, Derek Owen Australian Christians7 MCCOULL, Jake Adkins Liberal Democrats8 POLGAR, Sharon Emma Pauline Hanson's One Nation9 SIMPSON, Anthony James Liberal Party
10 BARKER, Christopher John Flux The System!Dawesville 1 SCHUMACHER, David Alexander Independent
2 KIRKUP, Zak Richard Francis Liberal Party3 WOODAGE, Adam Samuel WA Labor4 SHAVE, Lawrence Pauline Hanson's One Nation5 SPENCE, Liam Cal Flux The System!6 BLUNDELL-CAMDEN, Aeron Vincent The Greens (WA)7 PILKINGTON, Luke Jerome THE NATIONALS8 SVILICIC, Alan Anthony Micro Business Party9 McCARTHY, Russell Shooters, Fishers and Farmers
Forrestfield 1 JAGO, Ashley Caroline Animal Justice Party2 PRICE, Stephen James WA Labor3 CROOK, Brett Donald Australian Christians4 MORTON, Nathan Wray Liberal Party5 SHAHALAM, Mohammod Micro Business Party6 BENNETT, Jenny Lee Pauline Hanson's One Nation7 MARSHALL, Eugene Clair The Greens (WA)
Fremantle 1 van der LINDE, Gabrielle Australian Christians2 JENKINS, Christopher Vincent Socialist Alliance3 SHENTON, Hayden Fraser Liberal Party4 KNAPP, Janetia Julie Matheson for Western Australia5 SPENCER, Martin Llewellyn The Greens (WA)6 AYRE, Andrew John Micro Business Party7 DUFFY, Warren Peter Pauline Hanson's One Nation8 McGURK, Simone Frances WA Labor
Geraldton 1 CONNOLLY, Paul Redmond The Greens (WA)2 BROWN, Paul THE NATIONALS3 CAUDWELL, David Shooters, Fishers and Farmers4 BLAYNEY, Ian Charles Liberal Party5 DALTON, Lara WA Labor6 MARTIN, Wayne Arthur Pauline Hanson's One Nation7 HALL, Gregory Peter Australian Christians8 TANTI, Victor Anthony Independent
Girrawheen 1 QUIRK, Margaret Mary WA Labor2 SINGH, Sahaj Pal Micro Business Party3 SHAH, Mushfiq Ur-Rahman The Greens (WA)4 PHILLIPS, DAVID Australian Christians5 NGUYEN, Che Tam Family First6 ROACH, Raymond Wayne Shooters, Fishers and Farmers7 KRCOSKI, Dame Liberal Party
2017 State General ElectionResults and Statistics Report
6
District Candidate (Full Given Names) Party
Hillarys 1 KATSAMBANIS, Peter Argyris Liberal Party2 JOHNSON, Robert Frank Independent3 RITCHIE, Maria Teresa WA Labor4 LLOYD, Louahna Janet Kiona The Greens (WA)5 ROBINSON, ELISABETE Australian Christians
Jandakot 1 MUBARAKAI, Shahyaz Yezdi WA Labor2 GOBBERT, Francesca Ann Animal Justice Party3 SPYKER, Warnar Geert Australian Christians4 FRANCIS, Joseph Michael Liberal Party5 COX, Dorinda Rose The Greens (WA)6 MURPHY, John Manfred Pauline Hanson's One Nation7 SAMRA, Satinder-Singh Micro Business Party
Joondalup 1 NORBERGER, Jan-Henrik Liberal Party2 HART, Nicholas Richard Family First3 HOST, Rex Ian Australian Christians4 WEBB, Lisa Munro The Greens (WA)5 MARTIN, Peter John Micro Business Party6 HAMILTON, Emily Louise WA Labor7 MALLOY, Aaron Patrick Julie Matheson for Western Australia8 BRIGHTMAN, Brian Independent
Kalamunda 1 HUGHES, Matthew WA Labor2 MILES, Lee-Anne Carol The Greens (WA)3 BOWYER, Murray Thomas Julie Matheson for Western Australia4 COLYVAS, Evazelia Micro Business Party5 DAY, John Howard Dadley Liberal Party6 WILLIAMS, Brady John Australian Christians7 GOULD, Ray Desmond Pauline Hanson's One Nation
Kalgoorlie 1 O'DONNELL, Kyran Martin Liberal Party2 CROOK, Anthony John THE NATIONALS3 BOLTON, Richard Henry Pauline Hanson's One Nation4 SPURLING, Jacqueline Ann The Greens (WA)5 LUCAS, Michael Anthony Shooters, Fishers and Farmers6 FORSTER, Darren Roy WA Labor7 ERWIN, James Michael Flux The System!
Kimberley 1 JONES, Kai Independent2 CHAPMAN, Graham Anthony Independent3 ALBREY, Ryan Douglas Flux The System!4 VAUGHAN, Elizabeth Jane The Greens (WA)5 WRIGHT, Keith David Pauline Hanson's One Nation6 GREATOREX, Warren Mitchell Liberal Party7 FARRER, Josephine WA Labor8 HOUSTON, Robert Grant THE NATIONALS
Kingsley 1 McNAIR, John Sydney Julie Matheson for Western Australia2 STALTARI, Dominic Micro Business Party3 MITCHELL, Andrea Ruth Liberal Party4 BURNSIDE, Gilbert Graeme Australian Christians5 WARD, Matthew The Greens (WA)6 STOJKOVSKI, Jessica Mary Christine WA Labor
2017 State General ElectionResults and Statistics Report
7
District Candidate (Full Given Names) Party
Kwinana 1 COOK, Roger Hugh WA Labor2 TALBOT, Bianca Lynn Liberal Party3 TAYLOR, Timothy John Pauline Hanson's One Nation4 MOREL, Eleanor Charmaine Australian Christians5 FREEMAN, Jody Leanne The Greens (WA)6 HYDE, Joshua Richard Micro Business Party
Mandurah 1 CARRIE-WILSON, Sebastian Flux The System!2 ROWLANDS, Pamela Lynne Liberal Party3 SHAW, Douglas Joseph Pauline Hanson's One Nation4 BATSIOUDIS, Apostolis Micro Business Party5 TURNER, Jason THE NATIONALS6 TEMPLEMAN, David Alan WA Labor7 MOFFAT, Jodie Kathleen The Greens (WA)
Maylands 1 SMITH, Gregory John Julie Matheson for Western Australia2 PERKS, Caroline Marisa The Greens (WA)3 BAKER, Lisa Loraine WA Labor4 FENSOME, Ian Derek Micro Business Party5 KLEYN, Matthew Craig Australian Christians6 MADDEN, Amanda Jayne Liberal Party
Midland 1 PARASILITI, Daniel Sebastian Liberal Party2 BILTOFT, John William Micro Business Party3 ROBERTS, Michelle Hopkins WA Labor4 D'ANGELO, Tony Pauline Hanson's One Nation5 BIGGS, Matthew Peter The Greens (WA)6 PASSMORE, Trent John Shooters, Fishers and Farmers7 ROSS, Gregory Wakeham Julie Matheson for Western Australia
Mirrabooka 1 MUBARAK, Kim Independent2 CHEN, Lily Liberal Party3 IGBOKWE, Chukwudumebi Sydney Australian Christians4 DOOBREE, Sareeta Singh Micro Business Party5 FREEMAN, Janine Marie WA Labor6 ISMAIL, Rafeif The Greens (WA)7 LUKE, Matueny Marial Independent
Moore 1 PORTER, Wesley John Australian Christians2 KELLY, James Joseph Pauline Hanson's One Nation3 WILLIAMSON, Ross Kenneth Shooters, Fishers and Farmers4 LEAM, Peter Stephen The Greens (WA)5 SLYNS, Darren Albert Liberal Party6 LOVE, Ronald Shane THE NATIONALS7 NORTON, Barni WA Labor
Morley 1 RICCIARDI, Anne-Marie Sinead The Greens (WA)2 BOKSMATI, Nasim Micro Business Party3 BRITZA, Ian Maxwell Liberal Party4 HOST, Yin Fong Lois Australian Christians5 SANDERSON, Amber-Jade WA Labor6 LONGO, Paul Anthony Shooters, Fishers and Farmers
2017 State General ElectionResults and Statistics Report
8
District Candidate (Full Given Names) Party
Mount Lawley 1 VAN BURGEL, Janelle Annette Australian Christians2 SUTHERLAND, Michael William Liberal Party3 ROBERTS, Matthew Patrick The Greens (WA)4 REVIAN, Kandi Animal Justice Party5 FARSALAS, Alexandra Micro Business Party6 MILLMAN, Simon Alexander WA Labor
Murray-Wellington 1 RADLEY, Daniel Flux The System!2 BURWOOD, Callum James The Greens (WA)3 GILLETT, Paul Anthony THE NATIONALS4 COWPER, Murray John Liberal Party5 CLARKE, Robyn Marjorie Jane WA Labor6 McCALL, Raymond Mark Shooters, Fishers and Farmers7 SLATER, Ross Maitland Pauline Hanson's One Nation
Nedlands 1 SHAW, Christopher Australian Christians2 TAYLOR, Penelope May Mitchell WA Labor3 GINBEY, Keith Neville Micro Business Party4 MANGANO, Andrew Walter Julie Matheson for Western Australia5 GROSSO, Daniel Fabian The Greens (WA)6 MARMION, William Richard Liberal Party
North West Central 1 HILL, Shane Robin WA Labor2 CATANIA, Vincent Alexander THE NATIONALS3 SORENSEN, Dane Peder Evan Pauline Hanson's One Nation4 GREEN, Carol Ann The Greens (WA)5 DAVIES, Arthur Gordon Independent6 WESTCOTT, Julee May Liberal Party7 HOOPER, Angela Terese Micro Business Party8 D'CUNHA, Adrian Flux The System!
Perth 1 CAREY, John WA Labor2 BALLINGALL, James Ben Flux The System!3 HANSON, Matthew James Animal Justice Party4 MILLIGAN, Hannah Olivia The Greens (WA)5 MOLYNEUX, Ian Bruce Julie Matheson for Western Australia6 HYDE, Arthur Richard Micro Business Party7 LIM, Ken Keong Ivan Australian Christians8 EVANGEL, Helen Liberal Party
Pilbara 1 ALCHIN, Mark David Liberal Party2 WHITE-HARTIG, Fiona Ann Shooters, Fishers and Farmers3 MICHEL, Kevin Joseph Jude WA Labor4 GRYLLS, Brendon John THE NATIONALS5 McKENNA, Brent John The Greens (WA)6 ARCHIBALD, David Colin Pauline Hanson's One Nation7 DUNN, Mark A Flux The System!8 HOOPER, Davyd Cameron Micro Business Party
Riverton 1 REGNARD, Susan Australian Christians2 BOSWELL, Marion Fiona WA Labor3 PASHA, Zeeshan Micro Business Party4 WAUGH, Gavin Bruce Julie Matheson for Western Australia5 KERR, Thor Antony The Greens (WA)6 NAHAN, Michael Dennis Liberal Party7 CHANG, Tshung-Hui Pauline Hanson's One Nation
2017 State General ElectionResults and Statistics Report
9
District Candidate (Full Given Names) Party
Rockingham 1 BAUMANN, Wendy Joy Liberal Party2 MUMME, James Grant The Greens (WA)3 OMALLEY, James Cristian Pauline Hanson's One Nation4 BUCHANAN, Craig Robert Independent5 STONEHOUSE, Sylvia Australian Christians6 CHARLES, Mark Peter Micro Business Party7 McGOWAN, Mark WA Labor
Roe 1 JACOBS, Graham Gibson Liberal Party2 STACEY, Peter Garnett Shooters, Fishers and Farmers3 FELS, Anthony James4 ZACKLOVA, Eketerina Marie Pauline Hanson's One Nation5 RUNDLE, Peter James THE NATIONALS6 MCINNES, Simone Rosemary The Greens (WA)7 WILLIS, Bradley James WA Labor8 KELLY, Catherine Joy Australian Christians
Scarborough 1 HARVEY, Liza Mary Liberal Party2 BAILEY, Daniel Kevin Micro Business Party3 PYNT, Steven Leigh Julie Matheson for Western Australia4 HOST, Kevin Wayne Australian Christians5 WALKER, Anthony John WA Labor6 DODD, Margaret Elizabeth Pauline Hanson's One Nation7 CULLITY, Judith Ann The Greens (WA)
South Perth 1 ST MARTIN, Jason Brett Micro Business Party2 FRANCIS, Max Stillman Independent3 BROGAN, Mark Peter The Greens (WA)4 McGRATH, John Edwin Liberal Party5 REID, Fiona Katrina Independent6 STEINECK, Rosemary Frances Capon Australian Christians7 VOROS, Michael Jack WA Labor
Southern River 1 ABETZ, Peter Liberal Party2 HEALY, Terence WA Labor3 PIKOS-SALLIE, Toni Joanne The Greens (WA)4 SECKER, Steven Independent5 FISHLOCK, David Lyall Liberal Democrats6 HARLEY, Craig Independent7 SINGH, Aman Micro Business Party8 SRIVASTAVA, Ashutosh Julie Matheson for Western Australia
Swan Hills 1 SHAW, Jessica Jane WA Labor2 OLD, Sandra Lee Pauline Hanson's One Nation3 BHOWANIAH, Danusha Julie Matheson for Western Australia4 ALBAN, Francesco Angelo Liberal Party5 SINGH, Amninder Singh Micro Business Party6 WEBB, Evan Nicholas The Greens (WA)
Thornlie 1 COALES, Robert Francis Liberal Party2 BARAIOLO, Sandy Pauline Hanson's One Nation3 VAN DAM, Andrew Scott Flux The System!4 BENNETT, Sibel Micro Business Party5 HAMMOND, Gary Michael Shooters, Fishers and Farmers6 GOIRAN, Madeleine Suzanne Australian Christians7 TALLENTIRE, Christopher John WA Labor8 McALEESE, Donna Christine The Greens (WA)
2017 State General ElectionResults and Statistics Report
10
District Candidate (Full Given Names) Party
Vasse 1 O'CONNELL, Luke Anthony The Greens (WA)2 METTAM, Elizabeth Liberal Party3 GORDON, Peter Craig THE NATIONALS4 HARTLEY, Wesley Hamilton WA Labor
Victoria Park 1 STAER, Mark Rohan Australian Christians2 QUINN, Ryan The Greens (WA)3 NOYE, Jennifer Micro Business Party4 WYATT, Benjamin Sana WA Labor5 JACOBS, Julian James Liberal Party
Wanneroo 1 WILSON, Maxwell John Independent2 TREACY, Robyn Louise The Greens (WA)3 DARCY, Joseph Laurence Pauline Hanson's One Nation4 PASS, Linley Anne Australian Christians5 ROSENGRAVE, Peter William Micro Business Party6 MACPHERSON, Gregory Julie Matheson for Western Australia7 MILES, Paul Liberal Party8 WINTON, Sabine Elisabeth WA Labor
Warnbro 1 SCHOLZ, Alexander John Pauline Hanson's One Nation2 MUSCEDERE, Luke Emidio Peter Liberal Party3 KINGSFORD, Deonne Anne Australian Christians4 HUNTER, Thomas Julie Matheson for Western Australia5 PAPALIA, Paul WA Labor6 CAIN, Jillian Mae The Greens (WA)7 FIGGINS, Samantha Heather Micro Business Party
Warren-Blackwood 1 DEAS, Marc John Shooters, Fishers and Farmers2 REDMAN, Donald Terrence THE NATIONALS3 MORONEY, Gregory David Pauline Hanson's One Nation4 HUNTLEY, Andrew Bryan John The Greens (WA)5 LITSON, Hugh Mark WA Labor6 WOODHOUSE, Ross Kingsley Liberal Party
West Swan 1 LAWRENCE, James Julie Matheson for Western Australia2 McMULLAN, Beth Mary The Greens (WA)3 MORAN, Isaac Australian Christians4 HENDERSON, Rodney Keith Liberal Party5 SAFFIOTI, Rita WA Labor6 RUWOLDT, Trevor Stuart Shooters, Fishers and Farmers
Willagee 1 McGEORGE, Felicity Anne The Greens (WA)2 TINLEY, Peter Charles WA Labor3 POTTER, Paul John Micro Business Party4 ABRAHAM, Corina Patricia Socialist Alliance5 HOSKING, Robin Australian Christians6 AUBREY, Rebecca Jane Liberal Party
2017 State General ElectionResults and Statistics Report
11
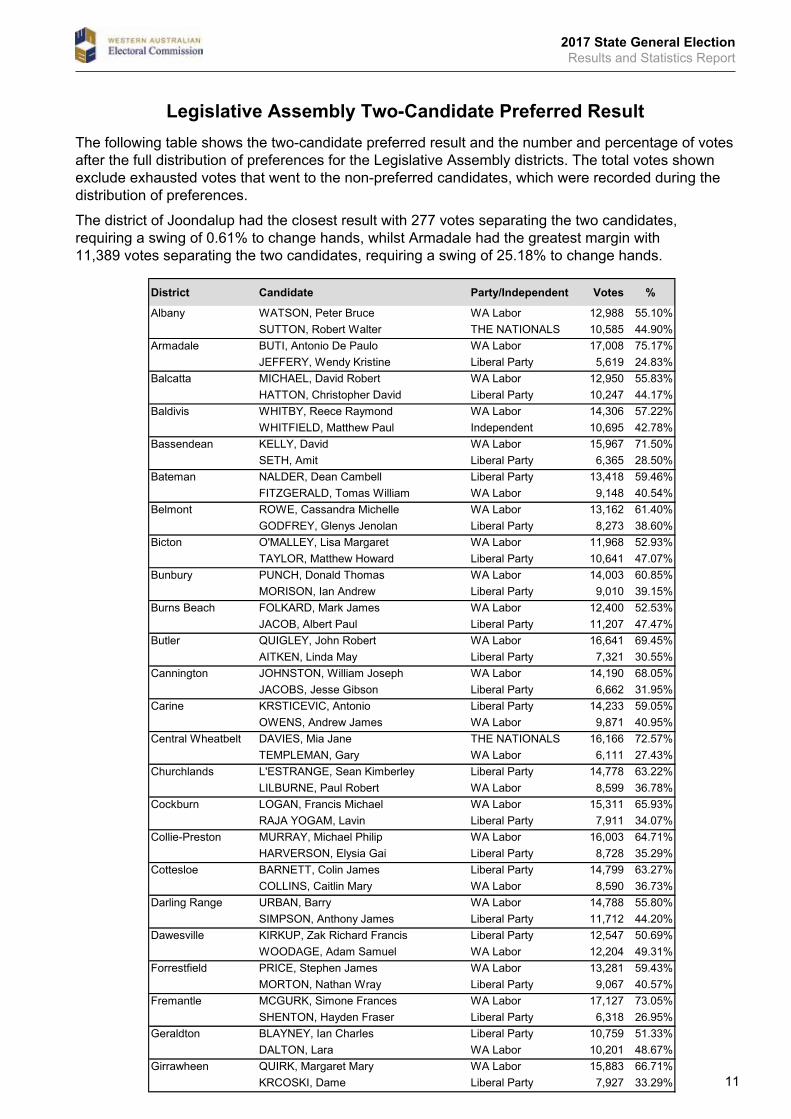
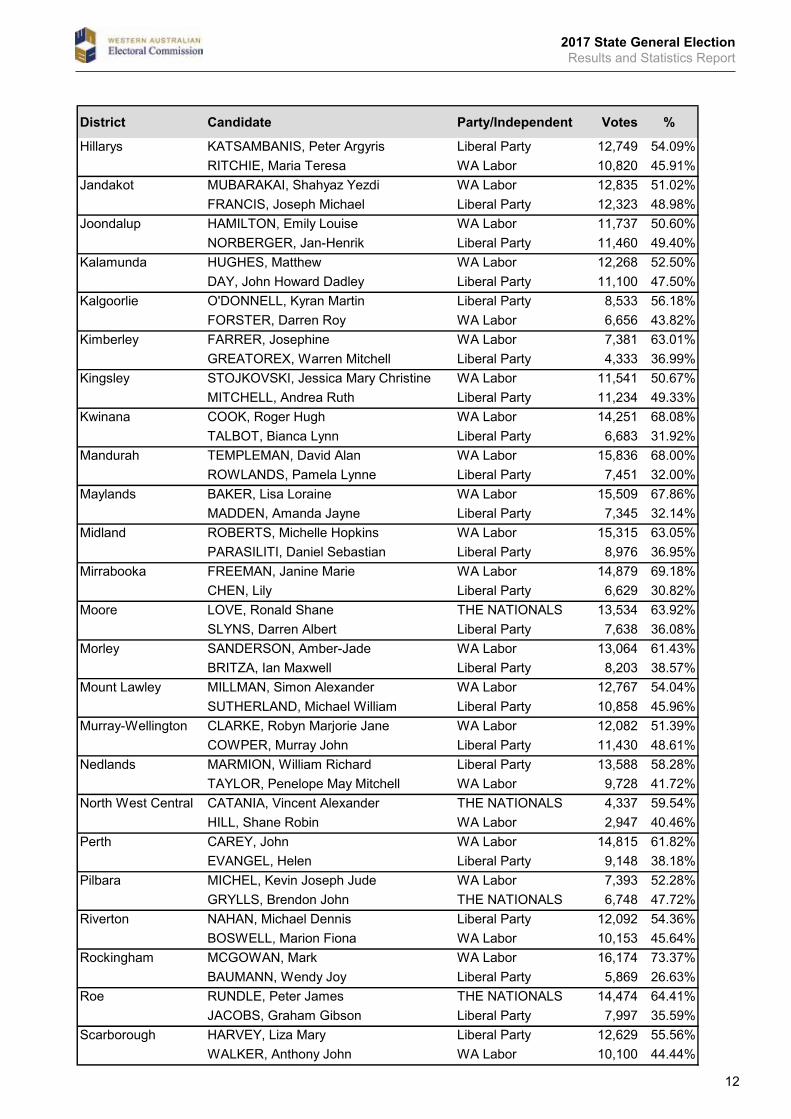
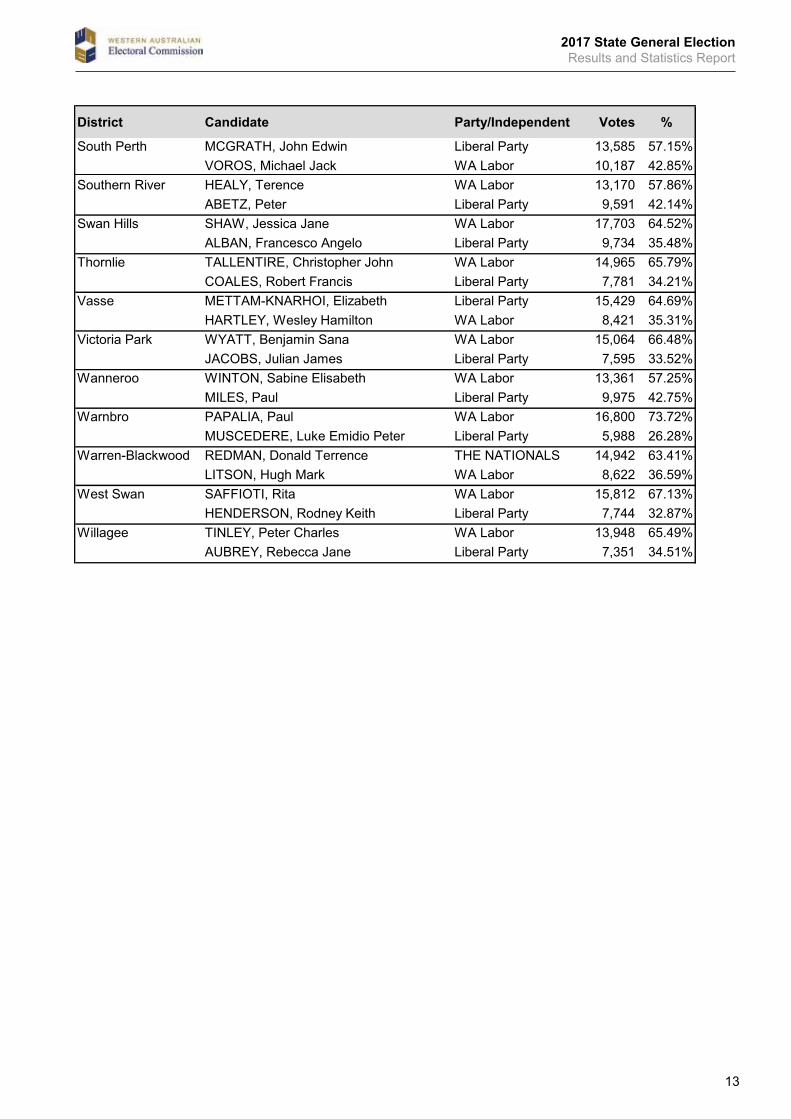
Legislative Assembly Two-Candidate Preferred ResultThe following table shows the two-candidate preferred result and the number and percentage of votes after the full distribution of preferences for the Legislative Assembly districts. The total votes shown exclude exhausted votes that went to the non-preferred candidates, which were recorded during the distribution of preferences.
The district of Joondalup had the closest result with 277 votes separating the two candidates, requiring a swing of 0.61% to change hands, whilst Armadale had the greatest margin with 11,389 votes separating the two candidates, requiring a swing of 25.18% to change hands.
District Candidate Party/Independent Votes %
Albany WATSON, Peter Bruce WA Labor 12,988 55.10%SUTTON, Robert Walter THE NATIONALS 10,585 44.90%
Armadale BUTI, Antonio De Paulo WA Labor 17,008 75.17%JEFFERY, Wendy Kristine Liberal Party 5,619 24.83%
Balcatta MICHAEL, David Robert WA Labor 12,950 55.83%HATTON, Christopher David Liberal Party 10,247 44.17%
Baldivis WHITBY, Reece Raymond WA Labor 14,306 57.22%WHITFIELD, Matthew Paul Independent 10,695 42.78%
Bassendean KELLY, David WA Labor 15,967 71.50%SETH, Amit Liberal Party 6,365 28.50%
Bateman NALDER, Dean Cambell Liberal Party 13,418 59.46%FITZGERALD, Tomas William WA Labor 9,148 40.54%
Belmont ROWE, Cassandra Michelle WA Labor 13,162 61.40%GODFREY, Glenys Jenolan Liberal Party 8,273 38.60%
Bicton O'MALLEY, Lisa Margaret WA Labor 11,968 52.93%TAYLOR, Matthew Howard Liberal Party 10,641 47.07%
Bunbury PUNCH, Donald Thomas WA Labor 14,003 60.85%MORISON, Ian Andrew Liberal Party 9,010 39.15%
Burns Beach FOLKARD, Mark James WA Labor 12,400 52.53%JACOB, Albert Paul Liberal Party 11,207 47.47%
Butler QUIGLEY, John Robert WA Labor 16,641 69.45%AITKEN, Linda May Liberal Party 7,321 30.55%
Cannington JOHNSTON, William Joseph WA Labor 14,190 68.05%JACOBS, Jesse Gibson Liberal Party 6,662 31.95%
Carine KRSTICEVIC, Antonio Liberal Party 14,233 59.05%OWENS, Andrew James WA Labor 9,871 40.95%
Central Wheatbelt DAVIES, Mia Jane THE NATIONALS 16,166 72.57%TEMPLEMAN, Gary WA Labor 6,111 27.43%
Churchlands L'ESTRANGE, Sean Kimberley Liberal Party 14,778 63.22%LILBURNE, Paul Robert WA Labor 8,599 36.78%
Cockburn LOGAN, Francis Michael WA Labor 15,311 65.93%RAJA YOGAM, Lavin Liberal Party 7,911 34.07%
Collie-Preston MURRAY, Michael Philip WA Labor 16,003 64.71%HARVERSON, Elysia Gai Liberal Party 8,728 35.29%
Cottesloe BARNETT, Colin James Liberal Party 14,799 63.27%COLLINS, Caitlin Mary WA Labor 8,590 36.73%
Darling Range URBAN, Barry WA Labor 14,788 55.80%SIMPSON, Anthony James Liberal Party 11,712 44.20%
Dawesville KIRKUP, Zak Richard Francis Liberal Party 12,547 50.69%WOODAGE, Adam Samuel WA Labor 12,204 49.31%
Forrestfield PRICE, Stephen James WA Labor 13,281 59.43%MORTON, Nathan Wray Liberal Party 9,067 40.57%
Fremantle MCGURK, Simone Frances WA Labor 17,127 73.05%SHENTON, Hayden Fraser Liberal Party 6,318 26.95%
Geraldton BLAYNEY, Ian Charles Liberal Party 10,759 51.33%DALTON, Lara WA Labor 10,201 48.67%
Girrawheen QUIRK, Margaret Mary WA Labor 15,883 66.71%KRCOSKI, Dame Liberal Party 7,927 33.29%
2017 State General ElectionResults and Statistics Report
12
District Candidate Party/Independent Votes %
Hillarys KATSAMBANIS, Peter Argyris Liberal Party 12,749 54.09%RITCHIE, Maria Teresa WA Labor 10,820 45.91%
Jandakot MUBARAKAI, Shahyaz Yezdi WA Labor 12,835 51.02%FRANCIS, Joseph Michael Liberal Party 12,323 48.98%
Joondalup HAMILTON, Emily Louise WA Labor 11,737 50.60%NORBERGER, Jan-Henrik Liberal Party 11,460 49.40%
Kalamunda HUGHES, Matthew WA Labor 12,268 52.50%DAY, John Howard Dadley Liberal Party 11,100 47.50%
Kalgoorlie O'DONNELL, Kyran Martin Liberal Party 8,533 56.18%FORSTER, Darren Roy WA Labor 6,656 43.82%
Kimberley FARRER, Josephine WA Labor 7,381 63.01%GREATOREX, Warren Mitchell Liberal Party 4,333 36.99%
Kingsley STOJKOVSKI, Jessica Mary Christine WA Labor 11,541 50.67%MITCHELL, Andrea Ruth Liberal Party 11,234 49.33%
Kwinana COOK, Roger Hugh WA Labor 14,251 68.08%TALBOT, Bianca Lynn Liberal Party 6,683 31.92%
Mandurah TEMPLEMAN, David Alan WA Labor 15,836 68.00%ROWLANDS, Pamela Lynne Liberal Party 7,451 32.00%
Maylands BAKER, Lisa Loraine WA Labor 15,509 67.86%MADDEN, Amanda Jayne Liberal Party 7,345 32.14%
Midland ROBERTS, Michelle Hopkins WA Labor 15,315 63.05%PARASILITI, Daniel Sebastian Liberal Party 8,976 36.95%
Mirrabooka FREEMAN, Janine Marie WA Labor 14,879 69.18%CHEN, Lily Liberal Party 6,629 30.82%
Moore LOVE, Ronald Shane THE NATIONALS 13,534 63.92%SLYNS, Darren Albert Liberal Party 7,638 36.08%
Morley SANDERSON, Amber-Jade WA Labor 13,064 61.43%BRITZA, Ian Maxwell Liberal Party 8,203 38.57%
Mount Lawley MILLMAN, Simon Alexander WA Labor 12,767 54.04%SUTHERLAND, Michael William Liberal Party 10,858 45.96%
Murray-Wellington CLARKE, Robyn Marjorie Jane WA Labor 12,082 51.39%COWPER, Murray John Liberal Party 11,430 48.61%
Nedlands MARMION, William Richard Liberal Party 13,588 58.28%TAYLOR, Penelope May Mitchell WA Labor 9,728 41.72%
North West Central CATANIA, Vincent Alexander THE NATIONALS 4,337 59.54%HILL, Shane Robin WA Labor 2,947 40.46%
Perth CAREY, John WA Labor 14,815 61.82%EVANGEL, Helen Liberal Party 9,148 38.18%
Pilbara MICHEL, Kevin Joseph Jude WA Labor 7,393 52.28%GRYLLS, Brendon John THE NATIONALS 6,748 47.72%
Riverton NAHAN, Michael Dennis Liberal Party 12,092 54.36%BOSWELL, Marion Fiona WA Labor 10,153 45.64%
Rockingham MCGOWAN, Mark WA Labor 16,174 73.37%BAUMANN, Wendy Joy Liberal Party 5,869 26.63%
Roe RUNDLE, Peter James THE NATIONALS 14,474 64.41%JACOBS, Graham Gibson Liberal Party 7,997 35.59%
Scarborough HARVEY, Liza Mary Liberal Party 12,629 55.56%WALKER, Anthony John WA Labor 10,100 44.44%
2017 State General ElectionResults and Statistics Report
13
District Candidate Party/Independent Votes %
South Perth MCGRATH, John Edwin Liberal Party 13,585 57.15%VOROS, Michael Jack WA Labor 10,187 42.85%
Southern River HEALY, Terence WA Labor 13,170 57.86%ABETZ, Peter Liberal Party 9,591 42.14%
Swan Hills SHAW, Jessica Jane WA Labor 17,703 64.52%ALBAN, Francesco Angelo Liberal Party 9,734 35.48%
Thornlie TALLENTIRE, Christopher John WA Labor 14,965 65.79%COALES, Robert Francis Liberal Party 7,781 34.21%
Vasse METTAM-KNARHOI, Elizabeth Liberal Party 15,429 64.69%HARTLEY, Wesley Hamilton WA Labor 8,421 35.31%
Victoria Park WYATT, Benjamin Sana WA Labor 15,064 66.48%JACOBS, Julian James Liberal Party 7,595 33.52%
Wanneroo WINTON, Sabine Elisabeth WA Labor 13,361 57.25%MILES, Paul Liberal Party 9,975 42.75%
Warnbro PAPALIA, Paul WA Labor 16,800 73.72%MUSCEDERE, Luke Emidio Peter Liberal Party 5,988 26.28%
Warren-Blackwood REDMAN, Donald Terrence THE NATIONALS 14,942 63.41%LITSON, Hugh Mark WA Labor 8,622 36.59%
West Swan SAFFIOTI, Rita WA Labor 15,812 67.13%HENDERSON, Rodney Keith Liberal Party 7,744 32.87%
Willagee TINLEY, Peter Charles WA Labor 13,948 65.49%AUBREY, Rebecca Jane Liberal Party 7,351 34.51%
2017 State General ElectionResults and Statistics Report
14
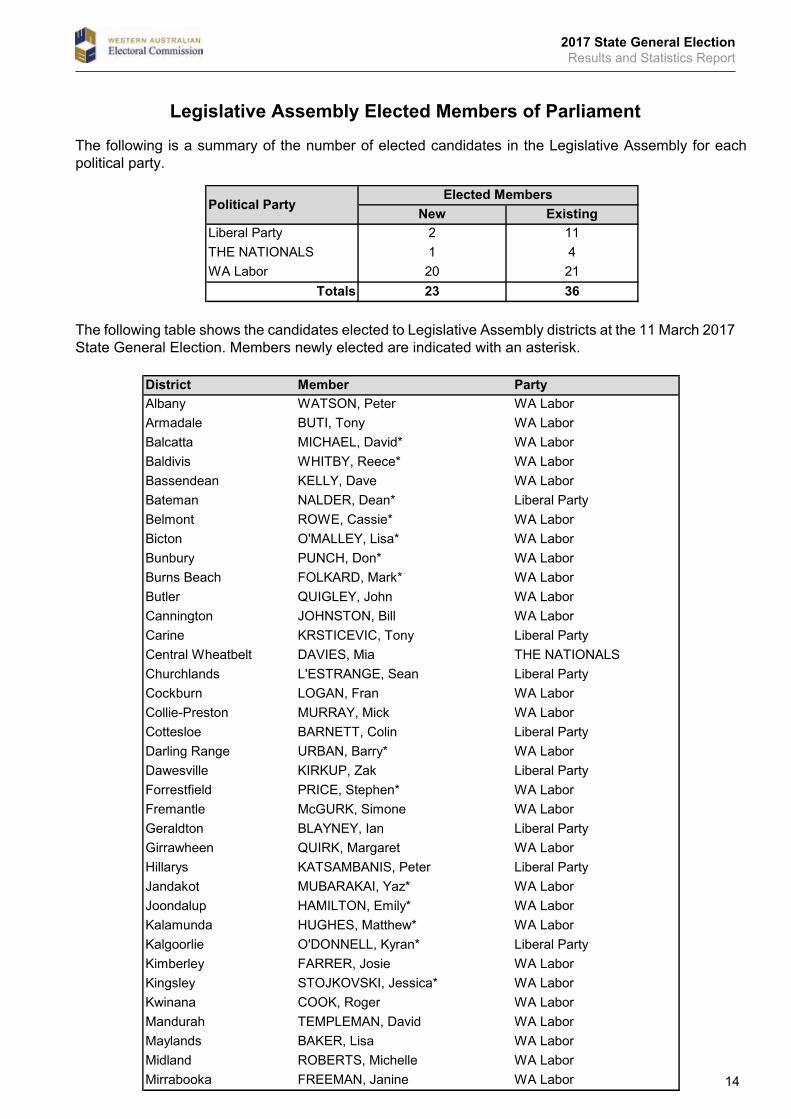
Legislative Assembly Elected Members of Parliament
The following is a summary of the number of elected candidates in the Legislative Assembly for each political party.
New Existing2 111 420 2123 36
The following is a summary of the number of elected candidates in the Legislative Assembly for each political party.
Political Party
Mirrabooka FREEMAN, Janine WA Labor
Maylands BAKER, Lisa WA LaborMidland ROBERTS, Michelle WA Labor
Kwinana COOK, Roger WA LaborMandurah TEMPLEMAN, David WA Labor
Kimberley FARRER, Josie WA LaborKingsley STOJKOVSKI, Jessica* WA Labor
Kalamunda HUGHES, Matthew* WA LaborKalgoorlie O'DONNELL, Kyran* Liberal Party
Jandakot MUBARAKAI, Yaz* WA LaborJoondalup HAMILTON, Emily* WA Labor
Girrawheen QUIRK, Margaret WA LaborHillarys KATSAMBANIS, Peter Liberal Party
Fremantle McGURK, Simone WA LaborGeraldton BLAYNEY, Ian Liberal Party
Dawesville KIRKUP, Zak Liberal PartyForrestfield PRICE, Stephen* WA Labor
Cottesloe BARNETT, Colin Liberal PartyDarling Range URBAN, Barry* WA Labor
Cockburn LOGAN, Fran WA LaborCollie-Preston MURRAY, Mick WA Labor
Central Wheatbelt DAVIES, Mia THE NATIONALSChurchlands L'ESTRANGE, Sean Liberal Party
Cannington JOHNSTON, Bill WA LaborCarine KRSTICEVIC, Tony Liberal Party
Burns Beach FOLKARD, Mark* WA LaborButler QUIGLEY, John WA Labor
Bicton O'MALLEY, Lisa* WA LaborBunbury PUNCH, Don* WA Labor
Bateman NALDER, Dean* Liberal PartyBelmont ROWE, Cassie* WA Labor
Baldivis WHITBY, Reece* WA LaborBassendean KELLY, Dave WA Labor
Armadale BUTI, Tony WA LaborBalcatta MICHAEL, David* WA Labor
Liberal Party
Elected Members
District Member PartyAlbany WATSON, Peter WA Labor
THE NATIONALSWA Labor
Totals
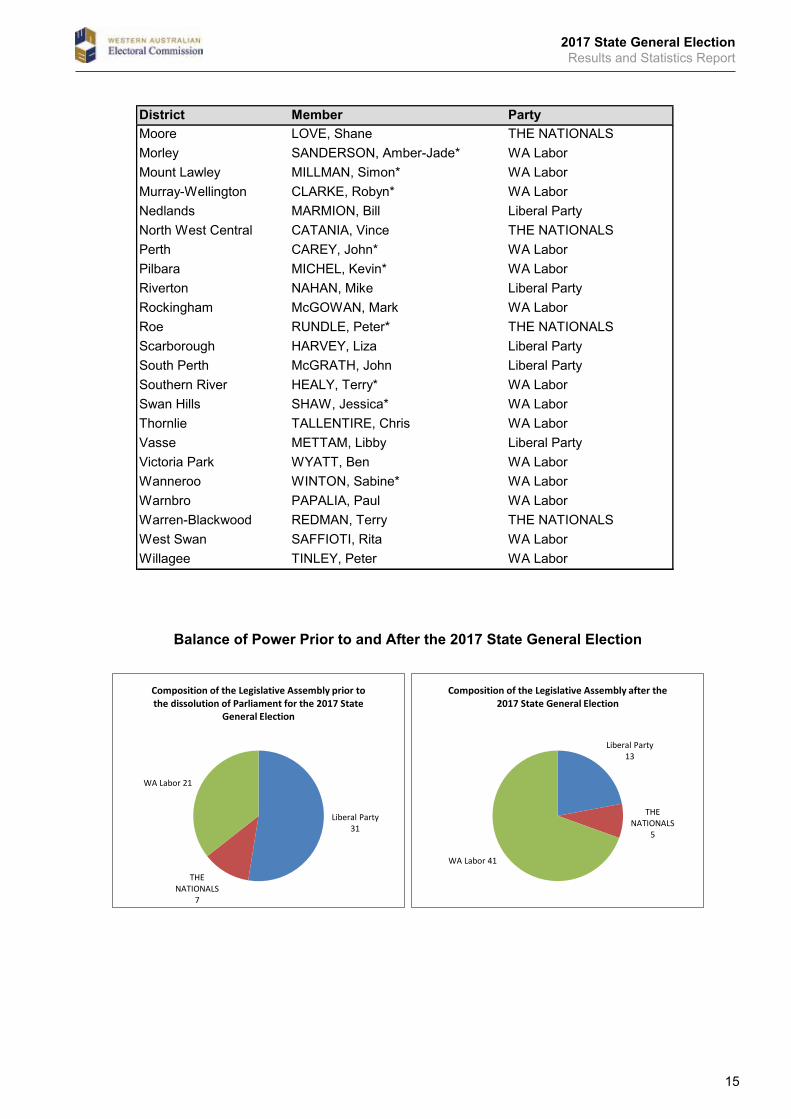
The following table shows the candidates elected to Legislative Assembly districts at the 11 March 2017 State General Election. Members newly elected are indicated
with an asterisk.
The following table shows the candidates elected to Legislative Assembly districts at the 11 March 2017 State General Election. Members newly elected are indicated with an asterisk.
New Existing2 111 420 2123 36
The following is a summary of the number of elected candidates in the Legislative Assembly for each political party.
Political Party
Mirrabooka FREEMAN, Janine WA Labor
Maylands BAKER, Lisa WA LaborMidland ROBERTS, Michelle WA Labor
Kwinana COOK, Roger WA LaborMandurah TEMPLEMAN, David WA Labor
Kimberley FARRER, Josie WA LaborKingsley STOJKOVSKI, Jessica* WA Labor
Kalamunda HUGHES, Matthew* WA LaborKalgoorlie O'DONNELL, Kyran* Liberal Party
Jandakot MUBARAKAI, Yaz* WA LaborJoondalup HAMILTON, Emily* WA Labor
Girrawheen QUIRK, Margaret WA LaborHillarys KATSAMBANIS, Peter Liberal Party
Fremantle McGURK, Simone WA LaborGeraldton BLAYNEY, Ian Liberal Party
Dawesville KIRKUP, Zak Liberal PartyForrestfield PRICE, Stephen* WA Labor
Cottesloe BARNETT, Colin Liberal PartyDarling Range URBAN, Barry* WA Labor
Cockburn LOGAN, Fran WA LaborCollie-Preston MURRAY, Mick WA Labor
Central Wheatbelt DAVIES, Mia THE NATIONALSChurchlands L'ESTRANGE, Sean Liberal Party
Cannington JOHNSTON, Bill WA LaborCarine KRSTICEVIC, Tony Liberal Party
Burns Beach FOLKARD, Mark* WA LaborButler QUIGLEY, John WA Labor
Bicton O'MALLEY, Lisa* WA LaborBunbury PUNCH, Don* WA Labor
Bateman NALDER, Dean* Liberal PartyBelmont ROWE, Cassie* WA Labor
Baldivis WHITBY, Reece* WA LaborBassendean KELLY, Dave WA Labor
Armadale BUTI, Tony WA LaborBalcatta MICHAEL, David* WA Labor
Liberal Party
Elected Members
District Member PartyAlbany WATSON, Peter WA Labor
THE NATIONALSWA Labor
Totals
The following table shows the candidates elected to Legislative Assembly districts at the 11 March 2017 State General Election. Members newly elected are indicated
with an asterisk.
2017 State General ElectionResults and Statistics Report
15
District Member Party
West Swan SAFFIOTI, Rita WA LaborWillagee TINLEY, Peter WA Labor
Warnbro PAPALIA, Paul WA LaborWarren-Blackwood REDMAN, Terry THE NATIONALS
Victoria Park WYATT, Ben WA LaborWanneroo WINTON, Sabine* WA Labor
Thornlie TALLENTIRE, Chris WA LaborVasse METTAM, Libby Liberal Party
Southern River HEALY, Terry* WA LaborSwan Hills SHAW, Jessica* WA Labor
Scarborough HARVEY, Liza Liberal PartySouth Perth McGRATH, John Liberal Party
Rockingham McGOWAN, Mark WA LaborRoe RUNDLE, Peter* THE NATIONALS
Pilbara MICHEL, Kevin* WA LaborRiverton NAHAN, Mike Liberal Party
North West Central CATANIA, Vince THE NATIONALSPerth CAREY, John* WA Labor
Murray-Wellington CLARKE, Robyn* WA LaborNedlands MARMION, Bill Liberal Party
Morley SANDERSON, Amber-Jade* WA LaborMount Lawley MILLMAN, Simon* WA Labor
Moore LOVE, Shane THE NATIONALS
Liberal Party 13
THE NATIONALS
5
WA Labor 41
Composition of the Legislative Assembly after the 2017 State General Election
Liberal Party 31
THE NATIONALS
7
WA Labor 21
Composition of the Legislative Assembly prior to the dissolution of Parliament for the 2017 State
General Election
Balance of Power Prior to and After the 2017 State General Election
District Member Party
West Swan SAFFIOTI, Rita WA LaborWillagee TINLEY, Peter WA Labor
Warnbro PAPALIA, Paul WA LaborWarren-Blackwood REDMAN, Terry THE NATIONALS
Victoria Park WYATT, Ben WA LaborWanneroo WINTON, Sabine* WA Labor
Thornlie TALLENTIRE, Chris WA LaborVasse METTAM, Libby Liberal Party
Southern River HEALY, Terry* WA LaborSwan Hills SHAW, Jessica* WA Labor
Scarborough HARVEY, Liza Liberal PartySouth Perth McGRATH, John Liberal Party
Rockingham McGOWAN, Mark WA LaborRoe RUNDLE, Peter* THE NATIONALS
Pilbara MICHEL, Kevin* WA LaborRiverton NAHAN, Mike Liberal Party
North West Central CATANIA, Vince THE NATIONALSPerth CAREY, John* WA Labor
Murray-Wellington CLARKE, Robyn* WA LaborNedlands MARMION, Bill Liberal Party
Morley SANDERSON, Amber-Jade* WA LaborMount Lawley MILLMAN, Simon* WA Labor
Moore LOVE, Shane THE NATIONALS
Liberal Party 13
THE NATIONALS
5
WA Labor 41
Composition of the Legislative Assembly after the 2017 State General Election
Liberal Party 31
THE NATIONALS
7
WA Labor 21
Composition of the Legislative Assembly prior to the dissolution of Parliament for the 2017 State
General Election
2017 State General ElectionResults and Statistics Report
16
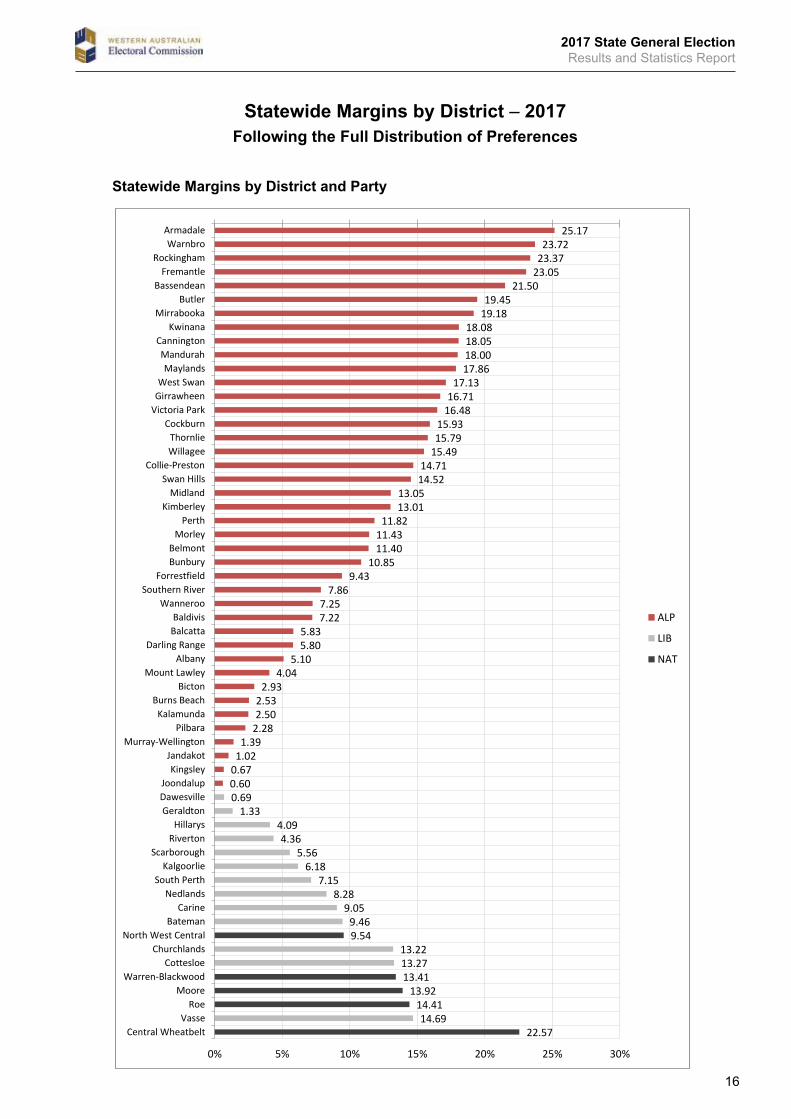
Statewide Margins by District – 2017
Statewide Margins by District and Party Statewide Margins by District and PartyDistrict ALP LIB NATAlbany 5.10%
ALP 41 Armadale 25.17%LIB 13 Balcatta 5.83%NAT 5 Baldivis 7.22%
TOTAL 59 Bassendean 21.50%Bateman 9.46%Belmont 11.40%Bicton 2.93%Bunbury 10.85%Burns Beach 2.53%Butler 19.45%Cannington 18.05%Carine 9.05%Central Wheatbelt 22.57%Churchlands 13.22%Cockburn 15.93%Collie-Preston 14.71%Cottesloe 13.27%Darling Range 5.80%Dawesville 0.69%Forrestfield 9.43%Fremantle 23.05%Geraldton 1.33%Girrawheen 16.71%Hillarys 4.09%Jandakot 1.02%Joondalup 0.60%Kalamunda 2.50%Kalgoorlie 6.18%Kimberley 13.01%Kingsley 0.67%Kwinana 18.08%Mandurah 18.00%Maylands 17.86%Midland 13.05%Mirrabooka 19.18%Moore 13.92%Morley 11.43%Mount Lawley 4.04%Murray-Wellington 1.39%Nedlands 8.28%North West Central 9.54%Perth 11.82%Pilbara 2.28%Riverton 4.36%Rockingham 23.37%Roe 14.41%Scarborough 5.56%South Perth 7.15%Southern River 7.86%Swan Hills 14.52%Thornlie 15.79%Vasse 14.69%Victoria Park 16.48%Wanneroo 7.25%Warnbro 23.72%Warren-Blackwood 13.41%West Swan 17.13%Willagee 15.49%
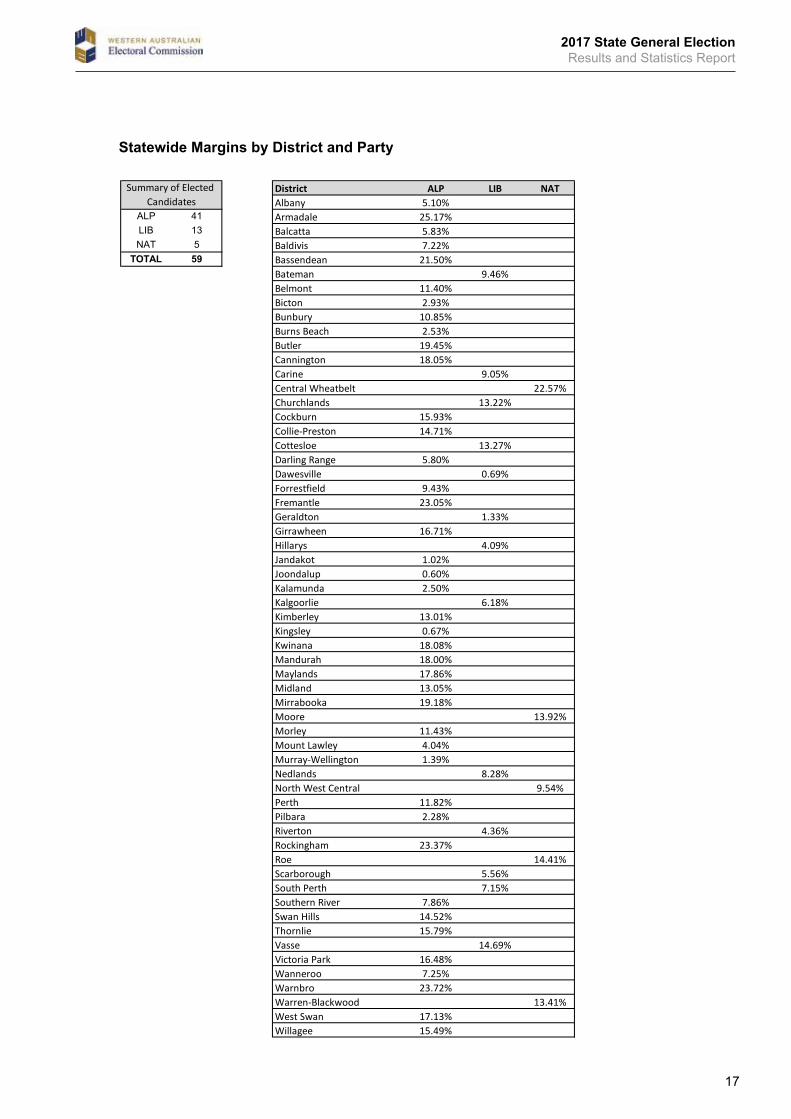
Summary of Elected Candidates
5.10 25.17
5.83 7.22
21.50
11.40 2.93
10.85 2.53
19.45 18.05
15.93 14.71
5.80
9.43 23.05
16.71
1.02 0.60
2.50
13.01 0.67
18.08 18.00 17.86
13.05 19.18
11.43 4.04
1.39
11.82 2.28
23.37
7.86 14.52
15.79
16.48 7.25
23.72
17.13 15.49
9.46
9.05
13.22
13.27
0.69
1.33
4.09
6.18
8.28
4.36
5.56 7.15
14.69
22.57
13.92
9.54
14.41
13.41
0% 5% 10% 15% 20% 25% 30%
AlbanyArmadale
BalcattaBaldivis
BassendeanBatemanBelmont
BictonBunbury
Burns BeachButler
CanningtonCarine
Central WheatbeltChurchlands
CockburnCollie-Preston
CottesloeDarling Range
DawesvilleForrestfield
FremantleGeraldton
GirrawheenHillarys
JandakotJoondalup
KalamundaKalgoorlieKimberley
KingsleyKwinana
MandurahMaylands
MidlandMirrabooka
MooreMorley
Mount LawleyMurray-Wellington
NedlandsNorth West Central
PerthPilbara
RivertonRockingham
RoeScarboroughSouth Perth
Southern RiverSwan Hills
ThornlieVasse
Victoria ParkWanneroo
WarnbroWarren-Blackwood
West SwanWillagee
ALP
LIB
NAT
25.17 23.72
23.37 23.05
21.50 19.45
19.18 18.08 18.05 18.00 17.86
17.13 16.71
16.48 15.93 15.79
15.49 14.71 14.52
13.05 13.01
11.82 11.43 11.40
10.85 9.43
7.86 7.25 7.22
5.83 5.80
5.10 4.04
2.93 2.53 2.50
2.28 1.39
1.02 0.67 0.60 0.69
1.33 4.09 4.36
5.56 6.18
7.15 8.28
9.05 9.46
13.22 13.27
14.69
9.54
13.41 13.92
14.41
22.57
0% 5% 10% 15% 20% 25% 30%
ArmadaleWarnbro
RockinghamFremantle
BassendeanButler
MirrabookaKwinana
CanningtonMandurahMaylands
West SwanGirrawheen
Victoria ParkCockburn
ThornlieWillagee
Collie-PrestonSwan Hills
MidlandKimberley
PerthMorley
BelmontBunbury
ForrestfieldSouthern River
WannerooBaldivisBalcatta
Darling RangeAlbany
Mount LawleyBicton
Burns BeachKalamunda
PilbaraMurray-Wellington
JandakotKingsley
JoondalupDawesvilleGeraldton
HillarysRiverton
ScarboroughKalgoorlie
South PerthNedlands
CarineBateman
North West CentralChurchlands
CottesloeWarren-Blackwood
MooreRoe
VasseCentral Wheatbelt
ALP
LIB
NAT
Statewide Margins by District and Party
Following the Full Distribution of Preferences
2017 State General ElectionResults and Statistics Report
17
Statewide Margins by District and PartyStatewide Margins by District and Party Statewide Margins by District and Party
District ALP LIB NATAlbany 5.10%
ALP 41 Armadale 25.17%LIB 13 Balcatta 5.83%NAT 5 Baldivis 7.22%
TOTAL 59 Bassendean 21.50%Bateman 9.46%Belmont 11.40%Bicton 2.93%Bunbury 10.85%Burns Beach 2.53%Butler 19.45%Cannington 18.05%Carine 9.05%Central Wheatbelt 22.57%Churchlands 13.22%Cockburn 15.93%Collie-Preston 14.71%Cottesloe 13.27%Darling Range 5.80%Dawesville 0.69%Forrestfield 9.43%Fremantle 23.05%Geraldton 1.33%Girrawheen 16.71%Hillarys 4.09%Jandakot 1.02%Joondalup 0.60%Kalamunda 2.50%Kalgoorlie 6.18%Kimberley 13.01%Kingsley 0.67%Kwinana 18.08%Mandurah 18.00%Maylands 17.86%Midland 13.05%Mirrabooka 19.18%Moore 13.92%Morley 11.43%Mount Lawley 4.04%Murray-Wellington 1.39%Nedlands 8.28%North West Central 9.54%Perth 11.82%Pilbara 2.28%Riverton 4.36%Rockingham 23.37%Roe 14.41%Scarborough 5.56%South Perth 7.15%Southern River 7.86%Swan Hills 14.52%Thornlie 15.79%Vasse 14.69%Victoria Park 16.48%Wanneroo 7.25%Warnbro 23.72%Warren-Blackwood 13.41%West Swan 17.13%Willagee 15.49%
Summary of Elected Candidates
5.10 25.17
5.83 7.22
21.50
11.40 2.93
10.85 2.53
19.45 18.05
15.93 14.71
5.80
9.43 23.05
16.71
1.02 0.60
2.50
13.01 0.67
18.08 18.00 17.86
13.05 19.18
11.43 4.04
1.39
11.82 2.28
23.37
7.86 14.52
15.79
16.48 7.25
23.72
17.13 15.49
9.46
9.05
13.22
13.27
0.69
1.33
4.09
6.18
8.28
4.36
5.56 7.15
14.69
22.57
13.92
9.54
14.41
13.41
0% 5% 10% 15% 20% 25% 30%
AlbanyArmadale
BalcattaBaldivis
BassendeanBatemanBelmont
BictonBunbury
Burns BeachButler
CanningtonCarine
Central WheatbeltChurchlands
CockburnCollie-Preston
CottesloeDarling Range
DawesvilleForrestfield
FremantleGeraldton
GirrawheenHillarys
JandakotJoondalup
KalamundaKalgoorlieKimberley
KingsleyKwinana
MandurahMaylands
MidlandMirrabooka
MooreMorley
Mount LawleyMurray-Wellington
NedlandsNorth West Central
PerthPilbara
RivertonRockingham
RoeScarboroughSouth Perth
Southern RiverSwan Hills
ThornlieVasse
Victoria ParkWanneroo
WarnbroWarren-Blackwood
West SwanWillagee
ALP
LIB
NAT
25.17 23.72
23.37 23.05
21.50 19.45
19.18 18.08 18.05 18.00 17.86
17.13 16.71
16.48 15.93 15.79
15.49 14.71 14.52
13.05 13.01
11.82 11.43 11.40
10.85 9.43
7.86 7.25 7.22
5.83 5.80
5.10 4.04
2.93 2.53 2.50
2.28 1.39
1.02 0.67 0.60 0.69
1.33 4.09 4.36
5.56 6.18
7.15 8.28
9.05 9.46
13.22 13.27
14.69
9.54
13.41 13.92
14.41
22.57
0% 5% 10% 15% 20% 25% 30%
ArmadaleWarnbro
RockinghamFremantle
BassendeanButler
MirrabookaKwinana
CanningtonMandurahMaylands
West SwanGirrawheen
Victoria ParkCockburn
ThornlieWillagee
Collie-PrestonSwan Hills
MidlandKimberley
PerthMorley
BelmontBunbury
ForrestfieldSouthern River
WannerooBaldivisBalcatta
Darling RangeAlbany
Mount LawleyBicton
Burns BeachKalamunda
PilbaraMurray-Wellington
JandakotKingsley
JoondalupDawesvilleGeraldton
HillarysRiverton
ScarboroughKalgoorlie
South PerthNedlands
CarineBateman
North West CentralChurchlands
CottesloeWarren-Blackwood
MooreRoe
VasseCentral Wheatbelt
ALP
LIB
NAT
2017 State General ElectionResults and Statistics Report
18
Final Distribution of Preferences SummaryFinal Distribution of Preferences Summary
District % % Total Valid Votes Exhausted Informal Total Votes
Armadale 17,008 ALP 75.17% 5,619 LIB 24.83% 22,634 7 1,325 23,959
Balcatta 12,950 ALP 55.83% 10,247 LIB 44.17% 23,203 6 1,426 24,629
Bassendean 15,967 ALP 71.50% 6,365 LIB 28.50% 22,342 10 1,455 23,797
Bateman 9,148 ALP 40.54% 13,418 LIB 59.46% 22,569 3 792 23,361
Belmont 13,162 ALP 61.40% 8,273 LIB 38.60% 21,450 15 1,169 22,619
Bicton 11,968 ALP 52.93% 10,641 LIB 47.07% 22,617 8 695 23,312
Bunbury 14,003 ALP 60.85% 9,010 LIB 39.15% 23,029 16 1,150 24,179
Burns Beach 12,400 ALP 52.53% 11,207 LIB 47.47% 23,614 7 1,325 24,939
Butler 16,641 ALP 69.45% 7,321 LIB 30.55% 23,966 4 1,226 25,192
Cannington 14,190 ALP 68.05% 6,662 LIB 31.95% 20,871 19 1,086 21,957
Carine 9,871 ALP 40.95% 14,233 LIB 59.05% 24,111 7 885 24,996
Churchlands 8,599 ALP 36.78% 14,778 LIB 63.22% 23,384 7 787 24,171
Cockburn 15,311 ALP 65.93% 7,911 LIB 34.07% 23,234 12 1,354 24,588
Collie-Preston 16,003 ALP 64.71% 8,728 LIB 35.29% 24,751 20 1,086 25,837
Cottesloe 8,590 ALP 36.73% 14,799 LIB 63.27% 23,405 16 819 24,224
Darling Range 14,788 ALP 55.80% 11,712 LIB 44.20% 26,519 19 1,357 27,876
Dawesville 12,204 ALP 49.31% 12,547 LIB 50.69% 24,765 14 1,267 26,032
Forrestfield 13,281 ALP 59.43% 9,067 LIB 40.57% 22,353 5 1,217 23,570
Fremantle 17,127 ALP 73.05% 6,318 LIB 26.95% 23,458 13 1,112 24,570
Geraldton 10,201 ALP 48.67% 10,759 LIB 51.33% 20,974 14 937 21,911
Girrawheen 15,883 ALP 66.71% 7,927 LIB 33.29% 23,819 9 1,375 25,194
Hillarys 10,820 ALP 45.91% 12,749 LIB 54.09% 23,575 6 938 24,513
Jandakot 12,835 ALP 51.02% 12,323 LIB 48.98% 25,163 5 1,030 26,193
Joondalup 11,737 ALP 50.60% 11,460 LIB 49.40% 23,204 7 1,070 24,274
Kalamunda 12,268 ALP 52.50% 11,100 LIB 47.50% 23,373 5 939 24,312
Kalgoorlie 6,656 ALP 43.82% 8,533 LIB 56.18% 15,197 8 649 15,846
Kimberley 7,381 ALP 63.01% 4,333 LIB 36.99% 11,719 5 498 12,217
Kingsley 11,541 ALP 50.67% 11,234 LIB 49.33% 22,778 3 963 23,741
Kwinana 14,251 ALP 68.08% 6,683 LIB 31.92% 20,940 6 1,078 22,018
Mandurah 15,836 ALP 68.00% 7,451 LIB 32.00% 23,295 8 1,262 24,557
Maylands 15,509 ALP 67.86% 7,345 LIB 32.14% 22,861 7 1,171 24,032
Midland 15,315 ALP 63.05% 8,976 LIB 36.95% 24,303 12 1,195 25,498
Mirrabooka 14,879 ALP 69.18% 6,629 LIB 30.82% 21,521 13 2,009 23,530
Morley 13,064 ALP 61.43% 8,203 LIB 38.57% 21,277 10 1,340 22,617
Mount Lawley 12,767 ALP 54.04% 10,858 LIB 45.96% 23,633 8 1,099 24,732
Murray-Wellington 12,082 ALP 51.39% 11,430 LIB 48.61% 23,525 13 1,275 24,800
Nedlands 9,728 ALP 41.72% 13,588 LIB 58.28% 23,321 5 780 24,101
Perth 14,815 ALP 61.82% 9,148 LIB 38.18% 23,971 8 907 24,878
Riverton 10,153 ALP 45.64% 12,092 LIB 54.36% 22,251 6 850 23,101
Rockingham 16,174 ALP 73.37% 5,869 LIB 26.63% 22,054 11 998 23,052
Scarborough 10,100 ALP 44.44% 12,629 LIB 55.56% 22,733 4 930 23,663
South Perth 10,187 ALP 42.85% 13,585 LIB 57.15% 23,779 7 897 24,676
Southern River 13,170 ALP 57.86% 9,591 LIB 42.14% 22,765 4 1,145 23,910
Swan Hills 17,703 ALP 64.52% 9,734 LIB 35.48% 27,442 5 1,231 28,673
Thornlie 14,965 ALP 65.79% 7,781 LIB 34.21% 22,768 22 1,451 24,219
Vasse 8,421 ALP 35.31% 15,429 LIB 64.69% 23,853 3 992 24,845
Victoria Park 15,064 ALP 66.48% 7,595 LIB 33.52% 22,677 18 1,025 23,702
Wanneroo 13,361 ALP 57.25% 9,975 LIB 42.75% 23,344 8 996 24,340
Warnbro 16,800 ALP 73.72% 5,988 LIB 26.28% 22,799 11 1,022 23,821
West Swan 15,812 ALP 67.13% 7,744 LIB 32.87% 23,568 12 1,473 25,041
Willagee 13,948 ALP 65.49% 7,351 LIB 34.51% 21,306 7 957 22,263
666,637 57.39% 494,948 42.61% 1,162,063 478 56,015 1,218,078
District % % Total Valid Votes Exhausted Informal Total Votes
Albany 12,988 ALP 55.10% 10,585 NAT 44.90% 23,586 13 838 24,424
Baldivis 14,306 ALP 57.22% 10,695 IND 42.78% 25,012 11 1,188 26,200
Central Wheatbelt 16,166 NAT 72.57% 6,111 ALP 27.43% 22,293 16 954 23,247
Moore 13,534 NAT 63.92% 7,638 LIB 36.08% 21,195 23 876 22,071
North West Central 4,337 NAT 59.54% 2,947 ALP 40.46% 7,291 7 349 7,640
Pilbara 7,393 ALP 52.28% 6,748 NAT 47.72% 14,144 3 677 14,821
Roe 14,474 NAT 64.41% 7,997 LIB 35.59% 22,484 13 883 23,367
Warren-Blackwood 14,942 NAT 63.41% 8,622 ALP 36.59% 23,572 8 1,080 24,652
98,140 61.54% 61,343 38.46% 159,577 94 6,845 166,422
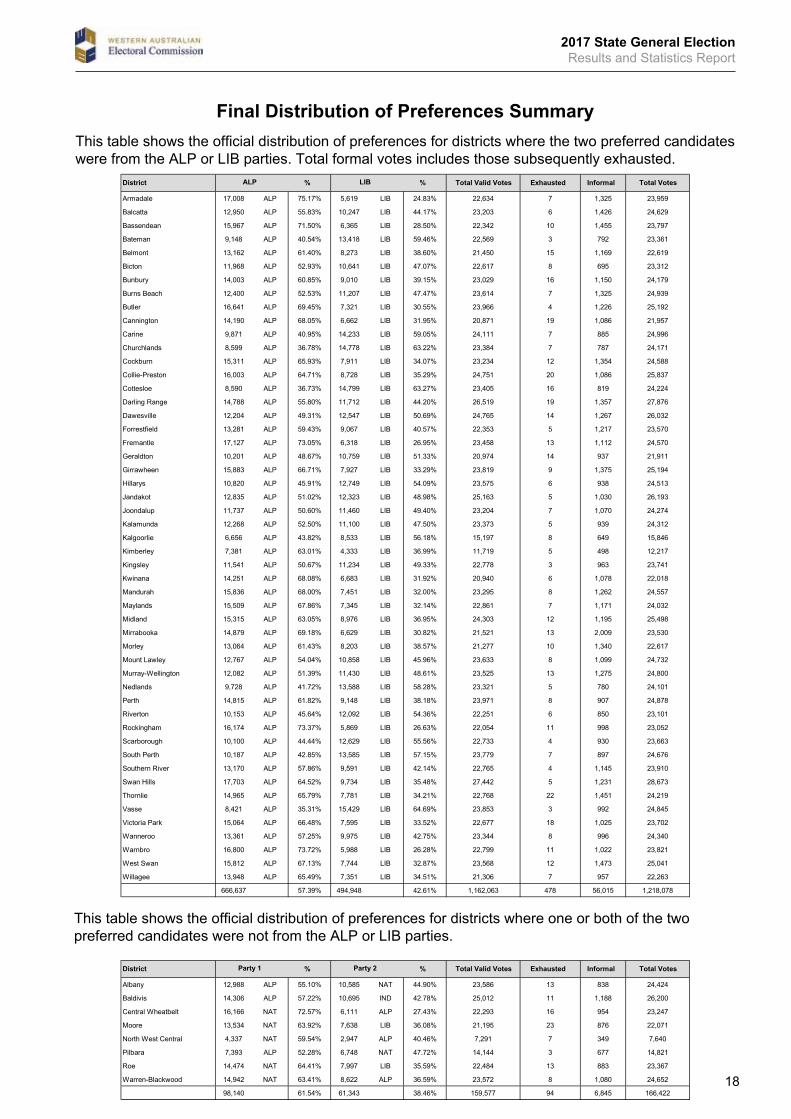
This table shows the official distribution of preferences for districts where one or both of the two preferred candidates were not from the ALP and Coalition parties.
Party 1 Party 2
This table shows the official distribution of preferences for districts where the two preferred candidates were from the ALP and Coalition parties.
ALP LIB
This table shows the official distribution of preferences for districts where the two preferred candidates were from the ALP or LIB parties. Total formal votes includes those subsequently exhausted.
Final Distribution of Preferences Summary
District % % Total Valid Votes Exhausted Informal Total Votes
Armadale 17,008 ALP 75.17% 5,619 LIB 24.83% 22,634 7 1,325 23,959
Balcatta 12,950 ALP 55.83% 10,247 LIB 44.17% 23,203 6 1,426 24,629
Bassendean 15,967 ALP 71.50% 6,365 LIB 28.50% 22,342 10 1,455 23,797
Bateman 9,148 ALP 40.54% 13,418 LIB 59.46% 22,569 3 792 23,361
Belmont 13,162 ALP 61.40% 8,273 LIB 38.60% 21,450 15 1,169 22,619
Bicton 11,968 ALP 52.93% 10,641 LIB 47.07% 22,617 8 695 23,312
Bunbury 14,003 ALP 60.85% 9,010 LIB 39.15% 23,029 16 1,150 24,179
Burns Beach 12,400 ALP 52.53% 11,207 LIB 47.47% 23,614 7 1,325 24,939
Butler 16,641 ALP 69.45% 7,321 LIB 30.55% 23,966 4 1,226 25,192
Cannington 14,190 ALP 68.05% 6,662 LIB 31.95% 20,871 19 1,086 21,957
Carine 9,871 ALP 40.95% 14,233 LIB 59.05% 24,111 7 885 24,996
Churchlands 8,599 ALP 36.78% 14,778 LIB 63.22% 23,384 7 787 24,171
Cockburn 15,311 ALP 65.93% 7,911 LIB 34.07% 23,234 12 1,354 24,588
Collie-Preston 16,003 ALP 64.71% 8,728 LIB 35.29% 24,751 20 1,086 25,837
Cottesloe 8,590 ALP 36.73% 14,799 LIB 63.27% 23,405 16 819 24,224
Darling Range 14,788 ALP 55.80% 11,712 LIB 44.20% 26,519 19 1,357 27,876
Dawesville 12,204 ALP 49.31% 12,547 LIB 50.69% 24,765 14 1,267 26,032
Forrestfield 13,281 ALP 59.43% 9,067 LIB 40.57% 22,353 5 1,217 23,570
Fremantle 17,127 ALP 73.05% 6,318 LIB 26.95% 23,458 13 1,112 24,570
Geraldton 10,201 ALP 48.67% 10,759 LIB 51.33% 20,974 14 937 21,911
Girrawheen 15,883 ALP 66.71% 7,927 LIB 33.29% 23,819 9 1,375 25,194
Hillarys 10,820 ALP 45.91% 12,749 LIB 54.09% 23,575 6 938 24,513
Jandakot 12,835 ALP 51.02% 12,323 LIB 48.98% 25,163 5 1,030 26,193
Joondalup 11,737 ALP 50.60% 11,460 LIB 49.40% 23,204 7 1,070 24,274
Kalamunda 12,268 ALP 52.50% 11,100 LIB 47.50% 23,373 5 939 24,312
Kalgoorlie 6,656 ALP 43.82% 8,533 LIB 56.18% 15,197 8 649 15,846
Kimberley 7,381 ALP 63.01% 4,333 LIB 36.99% 11,719 5 498 12,217
Kingsley 11,541 ALP 50.67% 11,234 LIB 49.33% 22,778 3 963 23,741
Kwinana 14,251 ALP 68.08% 6,683 LIB 31.92% 20,940 6 1,078 22,018
Mandurah 15,836 ALP 68.00% 7,451 LIB 32.00% 23,295 8 1,262 24,557
Maylands 15,509 ALP 67.86% 7,345 LIB 32.14% 22,861 7 1,171 24,032
Midland 15,315 ALP 63.05% 8,976 LIB 36.95% 24,303 12 1,195 25,498
Mirrabooka 14,879 ALP 69.18% 6,629 LIB 30.82% 21,521 13 2,009 23,530
Morley 13,064 ALP 61.43% 8,203 LIB 38.57% 21,277 10 1,340 22,617
Mount Lawley 12,767 ALP 54.04% 10,858 LIB 45.96% 23,633 8 1,099 24,732
Murray-Wellington 12,082 ALP 51.39% 11,430 LIB 48.61% 23,525 13 1,275 24,800
Nedlands 9,728 ALP 41.72% 13,588 LIB 58.28% 23,321 5 780 24,101
Perth 14,815 ALP 61.82% 9,148 LIB 38.18% 23,971 8 907 24,878
Riverton 10,153 ALP 45.64% 12,092 LIB 54.36% 22,251 6 850 23,101
Rockingham 16,174 ALP 73.37% 5,869 LIB 26.63% 22,054 11 998 23,052
Scarborough 10,100 ALP 44.44% 12,629 LIB 55.56% 22,733 4 930 23,663
South Perth 10,187 ALP 42.85% 13,585 LIB 57.15% 23,779 7 897 24,676
Southern River 13,170 ALP 57.86% 9,591 LIB 42.14% 22,765 4 1,145 23,910
Swan Hills 17,703 ALP 64.52% 9,734 LIB 35.48% 27,442 5 1,231 28,673
Thornlie 14,965 ALP 65.79% 7,781 LIB 34.21% 22,768 22 1,451 24,219
Vasse 8,421 ALP 35.31% 15,429 LIB 64.69% 23,853 3 992 24,845
Victoria Park 15,064 ALP 66.48% 7,595 LIB 33.52% 22,677 18 1,025 23,702
Wanneroo 13,361 ALP 57.25% 9,975 LIB 42.75% 23,344 8 996 24,340
Warnbro 16,800 ALP 73.72% 5,988 LIB 26.28% 22,799 11 1,022 23,821
West Swan 15,812 ALP 67.13% 7,744 LIB 32.87% 23,568 12 1,473 25,041
Willagee 13,948 ALP 65.49% 7,351 LIB 34.51% 21,306 7 957 22,263
666,637 57.39% 494,948 42.61% 1,162,063 478 56,015 1,218,078
District % % Total Valid Votes Exhausted Informal Total Votes
Albany 12,988 ALP 55.10% 10,585 NAT 44.90% 23,586 13 838 24,424
Baldivis 14,306 ALP 57.22% 10,695 IND 42.78% 25,012 11 1,188 26,200
Central Wheatbelt 16,166 NAT 72.57% 6,111 ALP 27.43% 22,293 16 954 23,247
Moore 13,534 NAT 63.92% 7,638 LIB 36.08% 21,195 23 876 22,071
North West Central 4,337 NAT 59.54% 2,947 ALP 40.46% 7,291 7 349 7,640
Pilbara 7,393 ALP 52.28% 6,748 NAT 47.72% 14,144 3 677 14,821
Roe 14,474 NAT 64.41% 7,997 LIB 35.59% 22,484 13 883 23,367
Warren-Blackwood 14,942 NAT 63.41% 8,622 ALP 36.59% 23,572 8 1,080 24,652
98,140 61.54% 61,343 38.46% 159,577 94 6,845 166,422
This table shows the official distribution of preferences for districts where one or both of the two preferred candidates were not from the ALP and Coalition parties.
Party 1 Party 2
This table shows the official distribution of preferences for districts where the two preferred candidates were from the ALP and Coalition parties.
ALP LIB
This table shows the official distribution of preferences for districts where one or both of the two preferred candidates were not from the ALP or LIB parties.
2017 State General ElectionResults and Statistics Report
19
Legislative AssemblyFirst Preference Votes
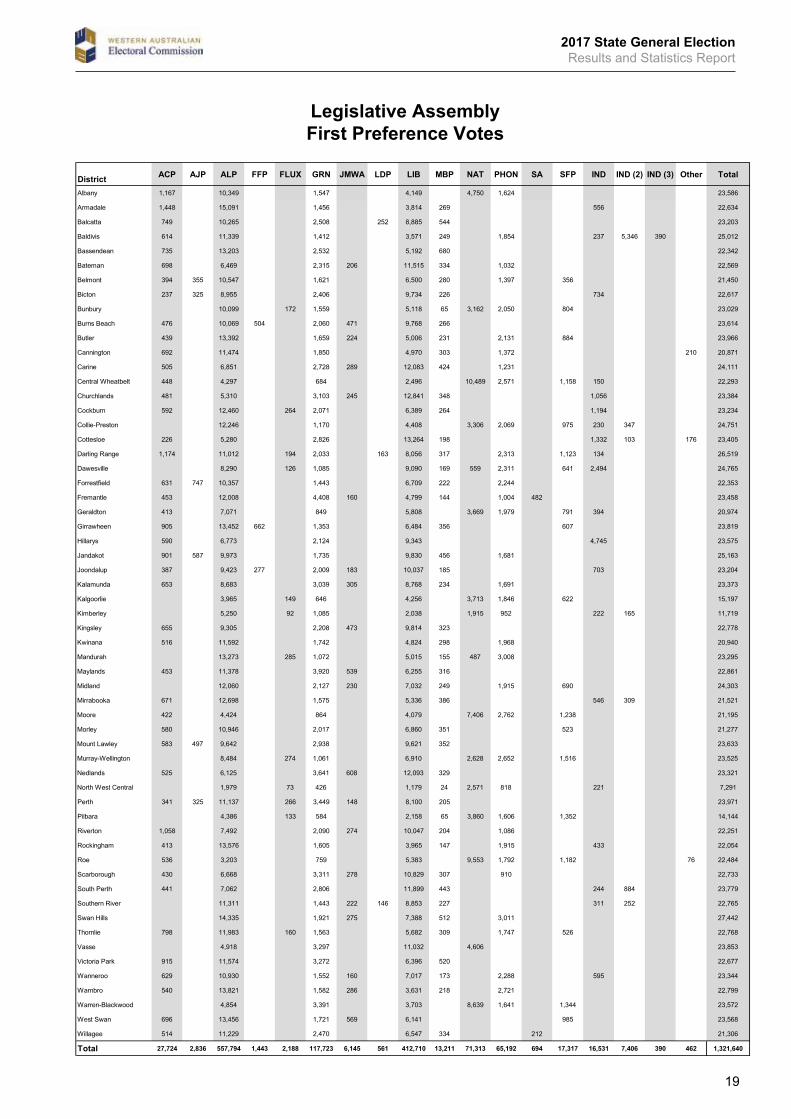
Legislative Assembly First Preference Votes
District ACP AJP ALP FFP FLUX GRN JMWA LDP LIB MBP NAT PHON SA SFP IND IND (2) IND (3) Other Total
Albany 1,167 10,349 1,547 4,149 4,750 1,624 23,586
Armadale 1,448 15,091 1,456 3,814 269 556 22,634
Balcatta 749 10,265 2,508 252 8,885 544 23,203
Baldivis 614 11,339 1,412 3,571 249 1,854 237 5,346 390 25,012
Bassendean 735 13,203 2,532 5,192 680 22,342
Bateman 698 6,469 2,315 206 11,515 334 1,032 22,569
Belmont 394 355 10,547 1,621 6,500 280 1,397 356 21,450
Bicton 237 325 8,955 2,406 9,734 226 734 22,617
Bunbury 10,099 172 1,559 5,118 65 3,162 2,050 804 23,029
Burns Beach 476 10,069 504 2,060 471 9,768 266 23,614
Butler 439 13,392 1,659 224 5,006 231 2,131 884 23,966
Cannington 692 11,474 1,850 4,970 303 1,372 210 20,871
Carine 505 6,851 2,728 289 12,083 424 1,231 24,111
Central Wheatbelt 448 4,297 684 2,496 10,489 2,571 1,158 150 22,293
Churchlands 481 5,310 3,103 245 12,841 348 1,056 23,384
Cockburn 592 12,460 264 2,071 6,389 264 1,194 23,234
Collie-Preston 12,246 1,170 4,408 3,306 2,069 975 230 347 24,751
Cottesloe 226 5,280 2,826 13,264 198 1,332 103 176 23,405
Darling Range 1,174 11,012 194 2,033 163 8,056 317 2,313 1,123 134 26,519
Dawesville 8,290 126 1,085 9,090 169 559 2,311 641 2,494 24,765
Forrestfield 631 747 10,357 1,443 6,709 222 2,244 22,353
Fremantle 453 12,008 4,408 160 4,799 144 1,004 482 23,458
Geraldton 413 7,071 849 5,808 3,669 1,979 791 394 20,974
Girrawheen 905 13,452 662 1,353 6,484 356 607 23,819
Hillarys 590 6,773 2,124 9,343 4,745 23,575
Jandakot 901 587 9,973 1,735 9,830 456 1,681 25,163
Joondalup 387 9,423 277 2,009 183 10,037 185 703 23,204
Kalamunda 653 8,683 3,039 305 8,768 234 1,691 23,373
Kalgoorlie 3,965 149 646 4,256 3,713 1,846 622 15,197
Kimberley 5,250 92 1,085 2,038 1,915 952 222 165 11,719
Kingsley 655 9,305 2,208 473 9,814 323 22,778
Kwinana 516 11,592 1,742 4,824 298 1,968 20,940
Mandurah 13,273 285 1,072 5,015 155 487 3,008 23,295
Maylands 453 11,378 3,920 539 6,255 316 22,861
Midland 12,060 2,127 230 7,032 249 1,915 690 24,303
Mirrabooka 671 12,698 1,575 5,336 386 546 309 21,521
Moore 422 4,424 864 4,079 7,406 2,762 1,238 21,195
Morley 580 10,946 2,017 6,860 351 523 21,277
Mount Lawley 583 497 9,642 2,938 9,621 352 23,633
Murray-Wellington 8,484 274 1,061 6,910 2,628 2,652 1,516 23,525
Nedlands 525 6,125 3,641 608 12,093 329 23,321
North West Central 1,979 73 426 1,179 24 2,571 818 221 7,291
Perth 341 325 11,137 266 3,449 148 8,100 205 23,971
Pilbara 4,386 133 584 2,158 65 3,860 1,606 1,352 14,144
Riverton 1,058 7,492 2,090 274 10,047 204 1,086 22,251
Rockingham 413 13,576 1,605 3,965 147 1,915 433 22,054
Roe 536 3,203 759 5,383 9,553 1,792 1,182 76 22,484
Scarborough 430 6,668 3,311 278 10,829 307 910 22,733
South Perth 441 7,062 2,806 11,899 443 244 884 23,779
Southern River 11,311 1,443 222 146 8,853 227 311 252 22,765
Swan Hills 14,335 1,921 275 7,388 512 3,011 27,442
Thornlie 798 11,983 160 1,563 5,682 309 1,747 526 22,768
Vasse 4,918 3,297 11,032 4,606 23,853
Victoria Park 915 11,574 3,272 6,396 520 22,677
Wanneroo 629 10,930 1,552 160 7,017 173 2,288 595 23,344
Warnbro 540 13,821 1,582 286 3,631 218 2,721 22,799
Warren-Blackwood 4,854 3,391 3,703 8,639 1,641 1,344 23,572
West Swan 696 13,456 1,721 569 6,141 985 23,568
Willagee 514 11,229 2,470 6,547 334 212 21,306
Total 27,724 2,836 557,794 1,443 2,188 117,723 6,145 561 412,710 13,211 71,313 65,192 694 17,317 16,531 7,406 390 462 1,321,640
2017 State General ElectionResults and Statistics Report
20
Legislative AssemblyTypes of Votes by District
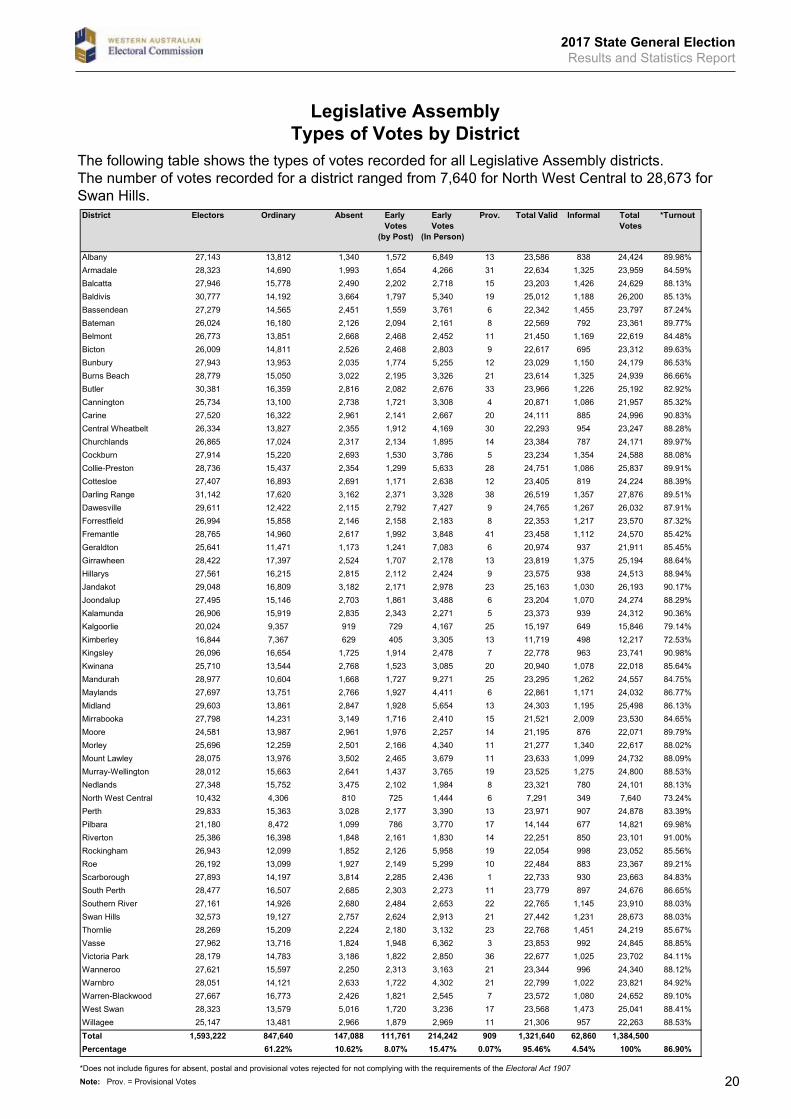
The following table shows the types of votes recorded for all Legislative Assembly districts.The number of votes recorded for a district ranged from 7,640 for North West Central to 28,673 for Swan Hills.
Electors Absent Early Votes
(by Post)
Early Votes
(In Person)
Prov. Total Valid Informal Total Votes
*Turnout
27,143 1,340 1,572 6,849 13 23,586 838 24,424 89.98%28,323 1,993 1,654 4,266 31 22,634 1,325 23,959 84.59%27,946 2,490 2,202 2,718 15 23,203 1,426 24,629 88.13%30,777 3,664 1,797 5,340 19 25,012 1,188 26,200 85.13%27,279 2,451 1,559 3,761 6 22,342 1,455 23,797 87.24%26,024 2,126 2,094 2,161 8 22,569 792 23,361 89.77%26,773 2,668 2,468 2,452 11 21,450 1,169 22,619 84.48%26,009 2,526 2,468 2,803 9 22,617 695 23,312 89.63%27,943 2,035 1,774 5,255 12 23,029 1,150 24,179 86.53%28,779 3,022 2,195 3,326 21 23,614 1,325 24,939 86.66%30,381 2,816 2,082 2,676 33 23,966 1,226 25,192 82.92%25,734 2,738 1,721 3,308 4 20,871 1,086 21,957 85.32%27,520 2,961 2,141 2,667 20 24,111 885 24,996 90.83%26,334 2,355 1,912 4,169 30 22,293 954 23,247 88.28%26,865 2,317 2,134 1,895 14 23,384 787 24,171 89.97%27,914 2,693 1,530 3,786 5 23,234 1,354 24,588 88.08%28,736 2,354 1,299 5,633 28 24,751 1,086 25,837 89.91%27,407 2,691 1,171 2,638 12 23,405 819 24,224 88.39%31,142 3,162 2,371 3,328 38 26,519 1,357 27,876 89.51%29,611 2,115 2,792 7,427 9 24,765 1,267 26,032 87.91%26,994 2,146 2,158 2,183 8 22,353 1,217 23,570 87.32%28,765 2,617 1,992 3,848 41 23,458 1,112 24,570 85.42%25,641 1,173 1,241 7,083 6 20,974 937 21,911 85.45%28,422 2,524 1,707 2,178 13 23,819 1,375 25,194 88.64%27,561 2,815 2,112 2,424 9 23,575 938 24,513 88.94%29,048 3,182 2,171 2,978 23 25,163 1,030 26,193 90.17%27,495 2,703 1,861 3,488 6 23,204 1,070 24,274 88.29%26,906 2,835 2,343 2,271 5 23,373 939 24,312 90.36%20,024 919 729 4,167 25 15,197 649 15,846 79.14%16,844 629 405 3,305 13 11,719 498 12,217 72.53%26,096 1,725 1,914 2,478 7 22,778 963 23,741 90.98%25,710 2,768 1,523 3,085 20 20,940 1,078 22,018 85.64%28,977 1,668 1,727 9,271 25 23,295 1,262 24,557 84.75%27,697 2,766 1,927 4,411 6 22,861 1,171 24,032 86.77%29,603 2,847 1,928 5,654 13 24,303 1,195 25,498 86.13%27,798 3,149 1,716 2,410 15 21,521 2,009 23,530 84.65%24,581 2,961 1,976 2,257 14 21,195 876 22,071 89.79%25,696 2,501 2,166 4,340 11 21,277 1,340 22,617 88.02%28,075 3,502 2,465 3,679 11 23,633 1,099 24,732 88.09%28,012 2,641 1,437 3,765 19 23,525 1,275 24,800 88.53%27,348 3,475 2,102 1,984 8 23,321 780 24,101 88.13%10,432 810 725 1,444 6 7,291 349 7,640 73.24%29,833 3,028 2,177 3,390 13 23,971 907 24,878 83.39%21,180 1,099 786 3,770 17 14,144 677 14,821 69.98%25,386 1,848 2,161 1,830 14 22,251 850 23,101 91.00%26,943 1,852 2,126 5,958 19 22,054 998 23,052 85.56%26,192 1,927 2,149 5,299 10 22,484 883 23,367 89.21%27,893 3,814 2,285 2,436 1 22,733 930 23,663 84.83%28,477 2,685 2,303 2,273 11 23,779 897 24,676 86.65%27,161 2,680 2,484 2,653 22 22,765 1,145 23,910 88.03%32,573 2,757 2,624 2,913 21 27,442 1,231 28,673 88.03%28,269 2,224 2,180 3,132 23 22,768 1,451 24,219 85.67%27,962 1,824 1,948 6,362 3 23,853 992 24,845 88.85%28,179 3,186 1,822 2,850 36 22,677 1,025 23,702 84.11%27,621 2,250 2,313 3,163 21 23,344 996 24,340 88.12%28,051 2,633 1,722 4,302 21 22,799 1,022 23,821 84.92%27,667 2,426 1,821 2,545 7 23,572 1,080 24,652 89.10%28,323 5,016 1,720 3,236 17 23,568 1,473 25,041 88.41%25,147 2,966 1,879 2,969 11 21,306 957 22,263 88.53%
1,593,222 147,088 111,761 214,242 909 1,321,640 62,860 1,384,50010.62% 8.07% 15.47% 0.07% 95.46% 4.54% 100% 86.90%
Note:
2
Southern River 14,926Swan Hills 19,127Thornlie 15,209
* Does not include figures for absent, postal and provisional votes rejected for not complying with the requirements of the Electoral Act 1907Prov. = Provisional Votes
Willagee 13,481Total 847,640Percentage 61.22%
Warnbro 14,121Warren-Blackwood 16,773West Swan 13,579
Vasse 13,716Victoria Park 14,783
Roe 13,099Scarborough 14,197South Perth 16,507
Pilbara 8,472Riverton 16,398Rockingham 12,099
Nedlands 15,752North West Central 4,306Perth 15,363
Morley 12,259Mount Lawley 13,976Murray-Wellington 15,663
Midland 13,861Mirrabooka 14,231Moore 13,987
Kwinana 13,544Mandurah 10,604Maylands 13,751
Kalgoorlie 9,357Kimberley 7,367Kingsley 16,654
Jandakot 16,809Joondalup 15,146Kalamunda 15,919
Geraldton 11,471Girrawheen 17,397Hillarys 16,215
Dawesville 12,422Forrestfield 15,858Fremantle 14,960
Collie-Preston 15,437Cottesloe 16,893Darling Range 17,620
Central Wheatbelt 13,827Churchlands 17,024Cockburn 15,220
Cannington 13,100Carine 16,322
Bicton 14,811Bunbury 13,953Burns Beach 15,050
Wanneroo 15,597
District Ordinary
Albany 13,812
Legislative Assembly - Types of Votes by District
Bassendean 14,565Bateman 16,180Belmont 13,851
Armadale 14,690Balcatta 15,778Baldivis 14,192
Butler 16,359
The following table shows the types of votes recorded for all Legislative Assembly districts. The number of votes recorded for a district ranged from 7,640 for North West Central to 28,673 for Swan Hills.
*Does not include figures for absent, postal and provisional votes rejected for not complying with the requirements of the Electoral Act 1907
Note: Prov. = Provisional Votes
2017 State General ElectionResults and Statistics Report
21
Legislative AssemblyTypes of Votes by Region – Metropolitan
District Electors Ordinary Absent Early Votes(by Post)
Early Votes(In Person) Prov. Total Valid Informal Total Votes *Turnout
1 Armadale 28,323 14,690 1,993 1,654 4,266 31 22,634 1,325 23,959 84.59%2 Bassendean 27,279 14,565 2,451 1,559 3,761 6 22,342 1,455 23,797 87.24%3 Belmont 26,773 13,851 2,668 2,468 2,452 11 21,450 1,169 22,619 84.48%4 Darling Range 31,142 17,620 3,162 2,371 3,328 38 26,519 1,357 27,876 89.51%5 Forrestfield 26,994 15,858 2,146 2,158 2,183 8 22,353 1,217 23,570 87.32%6 Kalamunda 26,906 15,919 2,835 2,343 2,271 5 23,373 939 24,312 90.36%7 Maylands 27,697 13,751 2,766 1,927 4,411 6 22,861 1,171 24,032 86.77%8 Midland 29,603 13,861 2,847 1,928 5,654 13 24,303 1,195 25,498 86.13%9 Mirrabooka 27,798 14,231 3,149 1,716 2,410 15 21,521 2,009 23,530 84.65%
10 Morley 25,696 12,259 2,501 2,166 4,340 11 21,277 1,340 22,617 88.02%11 Mount Lawley 28,075 13,976 3,502 2,465 3,679 11 23,633 1,099 24,732 88.09%12 Swan Hills 32,573 19,127 2,757 2,624 2,913 21 27,442 1,231 28,673 88.03%13 Thornlie 28,269 15,209 2,224 2,180 3,132 23 22,768 1,451 24,219 85.67%14 West Swan 28,323 13,579 5,016 1,720 3,236 17 23,568 1,473 25,041 88.41%
Total 395,451 208,496 40,017 29,279 48,036 216 326,044 18,431 344,475 87.11%
Percentage 60.53% 11.62% 8.50% 13.94% 0.06% 94.65% 5.35% 100.00%
District Electors Ordinary Absent Early Votes(by Post)
Early Votes(In Person) Prov. Total Valid Informal Total Votes *Turnout
1 Balcatta 27,946 15,778 2,490 2,202 2,718 15 23,203 1,426 24,629 88.13%2 Burns Beach 28,779 15,050 3,022 2,195 3,326 21 23,614 1,325 24,939 86.66%3 Butler 30,381 16,359 2,816 2,082 2,676 33 23,966 1,226 25,192 82.92%4 Carine 27,520 16,322 2,961 2,141 2,667 20 24,111 885 24,996 90.83%5 Churchlands 26,865 17,024 2,317 2,134 1,895 14 23,384 787 24,171 89.97%6 Cottesloe 27,407 16,893 2,691 1,171 2,638 12 23,405 819 24,224 88.39%7 Girrawheen 28,422 17,397 2,524 1,707 2,178 13 23,819 1,375 25,194 88.64%8 Hillarys 27,561 16,215 2,815 2,112 2,424 9 23,575 938 24,513 88.94%9 Joondalup 27,495 15,146 2,703 1,861 3,488 6 23,204 1,070 24,274 88.29%
10 Kingsley 26,096 16,654 1,725 1,914 2,478 7 22,778 963 23,741 90.98%11 Nedlands 27,348 15,752 3,475 2,102 1,984 8 23,321 780 24,101 88.13%12 Perth 29,833 15,363 3,028 2,177 3,390 13 23,971 907 24,878 83.39%13 Scarborough 27,893 14,197 3,814 2,285 2,436 1 22,733 930 23,663 84.83%14 Wanneroo 27,621 15,597 2,250 2,313 3,163 21 23,344 996 24,340 88.12%
Total 391,167 223,747 38,631 28,396 37,461 193 328,428 14,427 342,855 87.65%
Percentage 65.26% 11.27% 8.28% 10.93% 0.06% 95.79% 4.21% 100.00%
District Electors Ordinary Absent Early Votes(by Post)
Early Votes(In Person) Prov. Total Valid Informal Total Votes *Turnout
1 Baldivis 30,777 14,192 3,664 1,797 5,340 19 25,012 1,188 26,200 85.13%2 Bateman 26,024 16,180 2,126 2,094 2,161 8 22,569 792 23,361 89.77%3 Bicton 26,009 14,811 2,526 2,468 2,803 9 22,617 695 23,312 89.63%4 Cannington 25,734 13,100 2,738 1,721 3,308 4 20,871 1,086 21,957 85.32%5 Cockburn 27,914 15,220 2,693 1,530 3,786 5 23,234 1,354 24,588 88.08%6 Fremantle 28,765 14,960 2,617 1,992 3,848 41 23,458 1,112 24,570 85.42%7 Jandakot 29,048 16,809 3,182 2,171 2,978 23 25,163 1,030 26,193 90.17%8 Kwinana 25,710 13,544 2,768 1,523 3,085 20 20,940 1,078 22,018 85.64%9 Riverton 25,386 16,398 1,848 2,161 1,830 14 22,251 850 23,101 91.00%
10 Rockingham 26,943 12,099 1,852 2,126 5,958 19 22,054 998 23,052 85.56%11 South Perth 28,477 16,507 2,685 2,303 2,273 11 23,779 897 24,676 86.65%12
Southern River 27,161 14,926 2,680 2,484 2,653 22 22,765 1,145 23,910 88.03%
13 Victoria Park 28,179 14,783 3,186 1,822 2,850 36 22,677 1,025 23,702 84.11%14 Warnbro 28,051 14,121 2,633 1,722 4,302 21 22,799 1,022 23,821 84.92%15 Willagee 25,147 13,481 2,966 1,879 2,969 11 21,306 957 22,263 88.53%
Total 409,325 221,131 40,164 29,793 50,144 263 341,495 15,229 356,724 87.15%
Percentage 61.99% 11.26% 8.35% 14.06% 0.07% 95.73% 4.27% 100.00%
Electors Ordinary Absent Early Votes(by Post)
Early Votes(In Person) Prov. Total Valid Informal Total Votes *Turnout
Total 1,195,943 653,374 118,812 87,468 135,641 672 995,967 48,087 1,044,054 87.30%
Percentage 62.58% 11.38% 8.38% 12.99% 0.06% 95.39% 4.61% 100.00%
Metro Regions Summary
Legislative Assembly
Types of Vote by Region - Metro
East Metropolitan Region
North Metropolitan Region
South Metropolitan Region
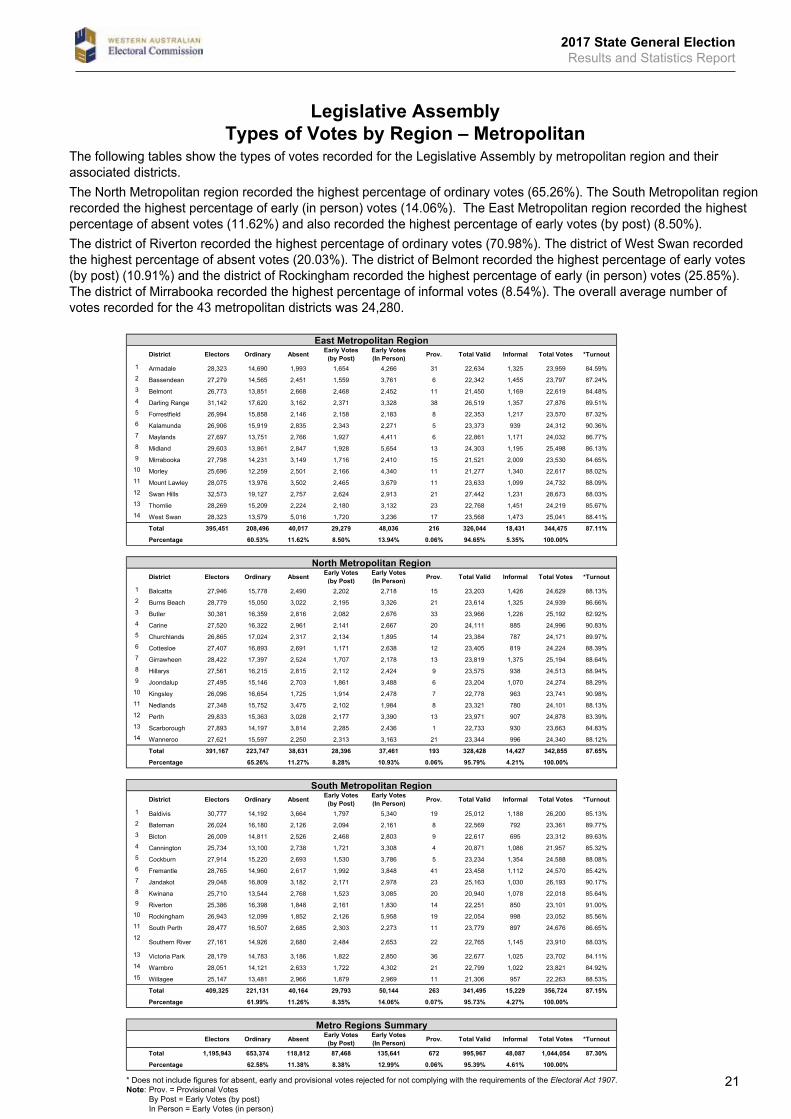
The following tables show the types of votes recorded for the Legislative Assembly by metropolitan region and their associated districts.The North Metropolitan region recorded the highest percentage of ordinary votes (65.26%). The South Metropolitan region recorded the highest percentage of early (in person) votes (14.06%). The East Metropolitan region recorded the highest percentage of absent votes (11.62%) and also recorded the highest percentage of early votes (by post) (8.50%).The district of Riverton recorded the highest percentage of ordinary votes (70.98%). The district of West Swan recorded the highest percentage of absent votes (20.03%). The district of Belmont recorded the highest percentage of early votes (by post) (10.91%) and the district of Rockingham recorded the highest percentage of early (in person) votes (25.85%). The district of Mirrabooka recorded the highest percentage of informal votes (8.54%). The overall average number of votes recorded for the 43 metropolitan districts was 24,280.
* Does not include figures for absent, early and provisional votes rejected for not complying with the requirements of the Electoral Act 1907.Note: Prov. = Provisional Votes By Post = Early Votes (by post) In Person = Early Votes (in person)
2017 State General ElectionResults and Statistics Report
22
Legislative AssemblyTypes of Votes by Region – Country
District Electors Ordinary Absent Early Votes(by Post)
Early Votes(In Person) Prov. Total Valid Informal Total Votes *Turnout
1 Central Wheatbelt 26,334 13,827 2,355 1,912 4,169 30 22,293 954 23,247 88.28%2 Geraldton 25,641 11,471 1,173 1,241 7,083 6 20,974 937 21,911 85.45%3 Moore 24,581 13,987 2,961 1,976 2,257 14 21,195 876 22,071 89.79%4 Roe 26,192 13,099 1,927 2,149 5,299 10 22,484 883 23,367 89.21%
Total 102,748 52,384 8,416 7,278 18,808 60 86,946 3,650 90,596 88.17%
Percentage 57.82% 9.29% 8.03% 20.76% 0.07% 95.97% 4.03% 100.00%
District Electors Ordinary Absent Early Votes(by Post)
Early Votes(In Person) Prov. Total Valid Informal Total Votes *Turnout
1 Kalgoorlie 20,024 9,357 919 729 4,167 25 15,197 649 15,846 79.14%2 Kimberley 16,844 7,367 629 405 3,305 13 11,719 498 12,217 72.53%3 North West Central 10,432 4,306 810 725 1,444 6 7,291 349 7,640 73.24%4 Pilbara 21,180 8,472 1,099 786 3,770 17 14,144 677 14,821 69.98%
Total 68,480 29,502 3,457 2,645 12,686 61 48,351 2,173 50,524 73.78%
Percentage 58.39% 6.84% 5.24% 25.11% 0.12% 95.70% 4.30% 100.00%
District Electors Ordinary Absent Early Votes(by Post)
Early Votes(In Person) Prov. Total Valid Informal Total Votes *Turnout
1 Albany 27,143 13,812 1,340 1,572 6,849 13 23,586 838 24,424 89.98%2 Bunbury 27,943 13,953 2,035 1,774 5,255 12 23,029 1,150 24,179 86.53%3 Collie-Preston 28,736 15,437 2,354 1,299 5,633 28 24,751 1,086 25,837 89.91%4 Dawesville 29,611 12,422 2,115 2,792 7,427 9 24,765 1,267 26,032 87.91%5 Mandurah 28,977 10,604 1,668 1,727 9,271 25 23,295 1,262 24,557 84.75%6 Murray-Wellington 28,012 15,663 2,641 1,437 3,765 19 23,525 1,275 24,800 88.53%7 Vasse 27,962 13,716 1,824 1,948 6,362 3 23,853 992 24,845 88.85%8 Warren-Blackwood 27,667 16,773 2,426 1,821 2,545 7 23,572 1,080 24,652 89.10%
Total 226,051 112,380 16,403 14,370 47,107 116 190,376 8,950 199,326 88.18%
Percentage 56.38% 8.23% 7.21% 23.63% 0.06% 95.51% 4.49% 100.00%
Electors Ordinary Absent Early Votes(by Post)
Early Votes(In Person) Prov. Total Valid Informal Total Votes *Turnout
Total 397,279 194,266 28,276 24,293 78,601 237 325,673 14,773 340,446 85.69%
Percentage 57.06% 8.31% 7.14% 23.09% 0.07% 95.66% 4.34% 100.00%
Mining and Pastoral Region
South West Region
Country Regions Summary
Legislative Assembly
Types of Vote by Region - Country/Other
Agricultural Region
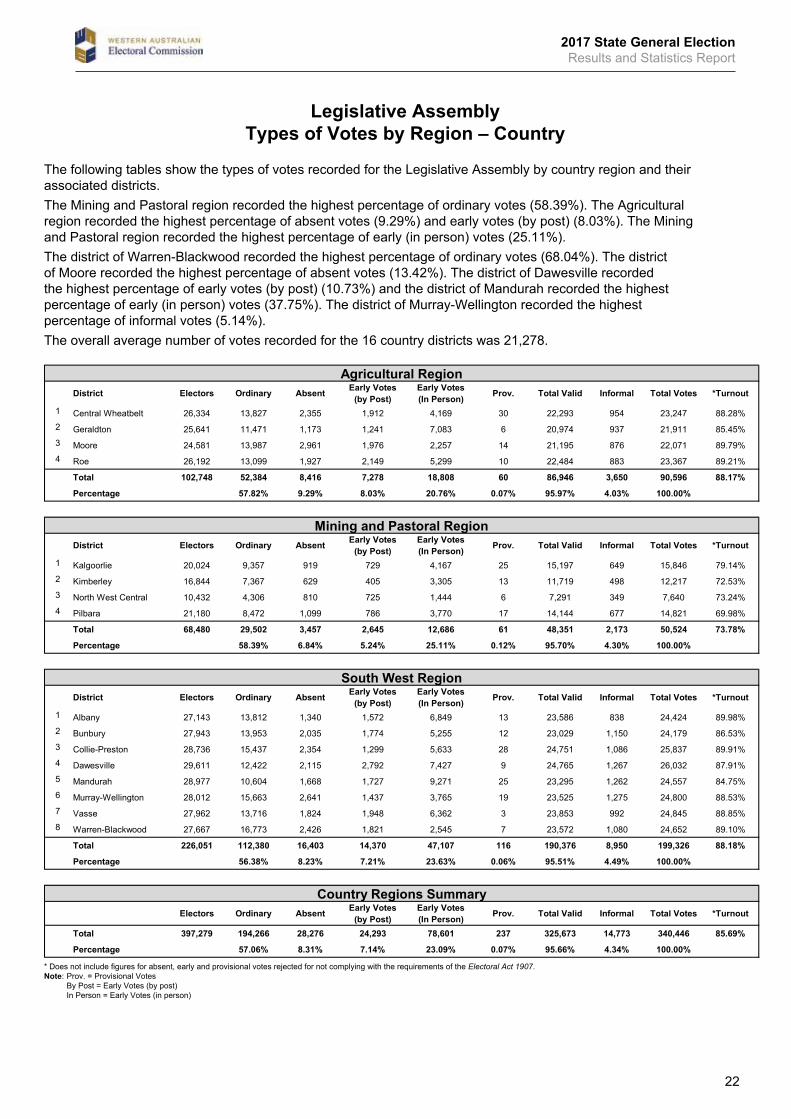
The following tables show the types of votes recorded for the Legislative Assembly by country region and their associated districts.The Mining and Pastoral region recorded the highest percentage of ordinary votes (58.39%). The Agricultural region recorded the highest percentage of absent votes (9.29%) and early votes (by post) (8.03%). The Mining and Pastoral region recorded the highest percentage of early (in person) votes (25.11%).The district of Warren-Blackwood recorded the highest percentage of ordinary votes (68.04%). The district of Moore recorded the highest percentage of absent votes (13.42%). The district of Dawesville recorded the highest percentage of early votes (by post) (10.73%) and the district of Mandurah recorded the highest percentage of early (in person) votes (37.75%). The district of Murray-Wellington recorded the highest percentage of informal votes (5.14%).The overall average number of votes recorded for the 16 country districts was 21,278.
* Does not include figures for absent, early and provisional votes rejected for not complying with the requirements of the Electoral Act 1907.Note: Prov. = Provisional Votes By Post = Early Votes (by post) In Person = Early Votes (in person)
2017 State General ElectionResults and Statistics Report
23
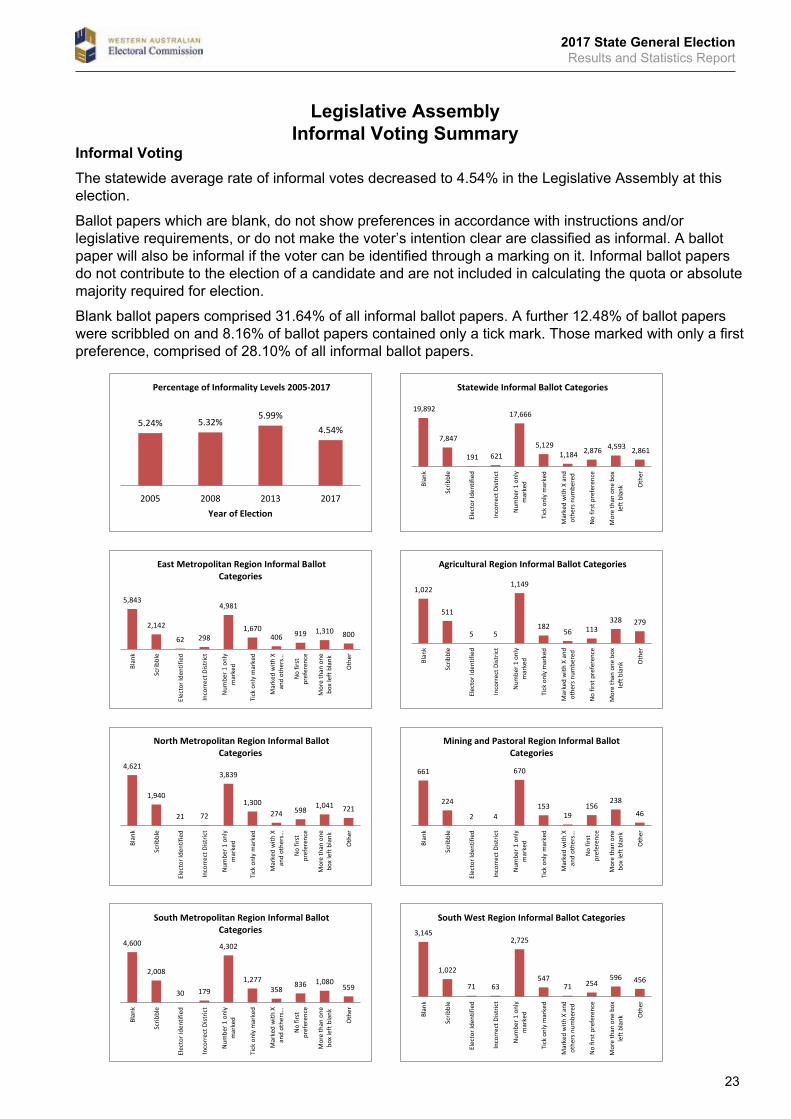
Legislative AssemblyInformal Voting Summary
5.24% 5.32% 5.99%
4.54%
2005 2008 2013 2017Year of Election
Percentage of Informality Levels 2005-2017
19,892
7,847
191 621
17,666
5,129 1,184 2,876 4,593 2,861
Blan
k
Scrib
ble
Elec
tor I
dent
ified
Inco
rrec
t Dist
rict
Num
ber 1
onl
ym
arke
d
Tick
onl
y m
arke
d
Mar
ked
with
X a
ndot
hers
num
bere
d
No
first
pre
fere
nce
Mor
e th
an o
ne b
oxle
ft b
lank O
ther
Statewide Informal Ballot Categories
5,843
2,142
62 298
4,981
1,670 406 919 1,310 800
Blan
k
Scrib
ble
Elec
tor I
dent
ified
Inco
rrec
t Dist
rict
Num
ber 1
onl
ym
arke
d
Tick
onl
y m
arke
d
Mar
ked
with
Xan
d ot
hers
…
No
first
pref
eren
ce
Mor
e th
an o
nebo
x le
ft b
lank
Oth
er
East Metropolitan Region Informal Ballot Categories
4,621
1,940
21 72
3,839
1,300 274 598 1,041 721
Blan
k
Scrib
ble
Elec
tor I
dent
ified
Inco
rrec
t Dist
rict
Num
ber 1
onl
ym
arke
d
Tick
onl
y m
arke
d
Mar
ked
with
Xan
d ot
hers
…
No
first
pref
eren
ce
Mor
e th
an o
nebo
x le
ft b
lank
Oth
er
North Metropolitan Region Informal Ballot Categories
4,600
2,008
30 179
4,302
1,277 358
836 1,080 559
Blan
k
Scrib
ble
Elec
tor I
dent
ified
Inco
rrec
t Dist
rict
Num
ber 1
onl
ym
arke
d
Tick
onl
y m
arke
d
Mar
ked
with
Xan
d ot
hers
…
No
first
pref
eren
ce
Mor
e th
an o
nebo
x le
ft b
lank
Oth
er
South Metropolitan Region Informal Ballot Categories
1,022
511
5 5
1,149
182 56 113
328 279
Blan
k
Scrib
ble
Elec
tor I
dent
ified
Inco
rrec
t Dist
rict
Num
ber 1
onl
ym
arke
d
Tick
onl
y m
arke
d
Mar
ked
with
X a
ndot
hers
num
bere
d
No
first
pre
fere
nce
Mor
e th
an o
ne b
oxle
ft b
lank O
ther
Agricultural Region Informal Ballot Categories
661
224
2 4
670
153 19
156 238
46
Blan
k
Scrib
ble
Elec
tor I
dent
ified
Inco
rrec
t Dist
rict
Num
ber 1
onl
ym
arke
d
Tick
onl
y m
arke
d
Mar
ked
with
Xan
d ot
hers
…
No
first
pref
eren
ce
Mor
e th
an o
nebo
x le
ft b
lank
Oth
er
Mining and Pastoral Region Informal Ballot Categories
3,145
1,022
71 63
2,725
547 71 254
596 456
Blan
k
Scrib
ble
Elec
tor I
dent
ified
Inco
rrec
t Dist
rict
Num
ber 1
onl
ym
arke
d
Tick
onl
y m
arke
d
Mar
ked
with
X a
ndot
hers
num
bere
d
No
first
pre
fere
nce
Mor
e th
an o
ne b
oxle
ft b
lank O
ther
South West Region Informal Ballot Categories
Informal Voting The statewide average rate of informal votes decreased to 4.54% in the Legislative Assembly at this election.
Ballot papers which are blank, do not show preferences in accordance with instructions and/or legislative requirements, or do not make the voter’s intention clear are classified as informal. A ballot paper will also be informal if the voter can be identified through a marking on it. Informal ballot papers do not contribute to the election of a candidate and are not included in calculating the quota or absolute majority required for election.
Blank ballot papers comprised 31.64% of all informal ballot papers. A further 12.48% of ballot papers were scribbled on and 8.16% of ballot papers contained only a tick mark. Those marked with only a first preference, comprised of 28.10% of all informal ballot papers.
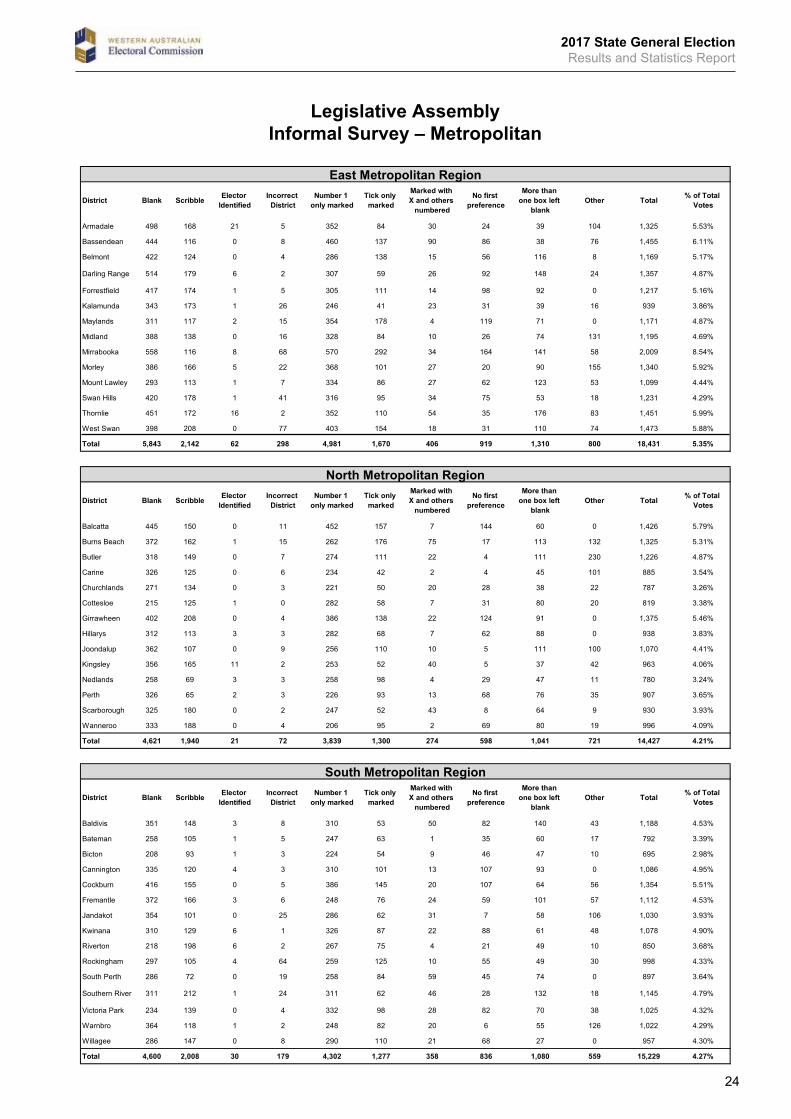
2017 State General ElectionResults and Statistics Report
24
Legislative AssemblyInformal Survey – Metropolitan
District Blank Scribble Elector Identified
Incorrect District
Number 1 only marked
Tick only marked
Marked with X and others
numbered
No first preference
More than one box left
blankOther Total % of Total
Votes
Armadale 498 168 21 5 352 84 30 24 39 104 1,325 5.53%
Bassendean 444 116 0 8 460 137 90 86 38 76 1,455 6.11%
Belmont 422 124 0 4 286 138 15 56 116 8 1,169 5.17%
Darling Range 514 179 6 2 307 59 26 92 148 24 1,357 4.87%
Forrestfield 417 174 1 5 305 111 14 98 92 0 1,217 5.16%
Kalamunda 343 173 1 26 246 41 23 31 39 16 939 3.86%
Maylands 311 117 2 15 354 178 4 119 71 0 1,171 4.87%
Midland 388 138 0 16 328 84 10 26 74 131 1,195 4.69%
Mirrabooka 558 116 8 68 570 292 34 164 141 58 2,009 8.54%
Morley 386 166 5 22 368 101 27 20 90 155 1,340 5.92%
Mount Lawley 293 113 1 7 334 86 27 62 123 53 1,099 4.44%
Swan Hills 420 178 1 41 316 95 34 75 53 18 1,231 4.29%
Thornlie 451 172 16 2 352 110 54 35 176 83 1,451 5.99%
West Swan 398 208 0 77 403 154 18 31 110 74 1,473 5.88%
Total 5,843 2,142 62 298 4,981 1,670 406 919 1,310 800 18,431 5.35%
District Blank Scribble Elector Identified
Incorrect District
Number 1 only marked
Tick only marked
Marked with X and others
numbered
No first preference
More than one box left
blankOther Total % of Total
Votes
Balcatta 445 150 0 11 452 157 7 144 60 0 1,426 5.79%
Burns Beach 372 162 1 15 262 176 75 17 113 132 1,325 5.31%
Butler 318 149 0 7 274 111 22 4 111 230 1,226 4.87%
Carine 326 125 0 6 234 42 2 4 45 101 885 3.54%
Churchlands 271 134 0 3 221 50 20 28 38 22 787 3.26%
Cottesloe 215 125 1 0 282 58 7 31 80 20 819 3.38%
Girrawheen 402 208 0 4 386 138 22 124 91 0 1,375 5.46%
Hillarys 312 113 3 3 282 68 7 62 88 0 938 3.83%
Joondalup 362 107 0 9 256 110 10 5 111 100 1,070 4.41%
Kingsley 356 165 11 2 253 52 40 5 37 42 963 4.06%
Nedlands 258 69 3 3 258 98 4 29 47 11 780 3.24%
Perth 326 65 2 3 226 93 13 68 76 35 907 3.65%
Scarborough 325 180 0 2 247 52 43 8 64 9 930 3.93%
Wanneroo 333 188 0 4 206 95 2 69 80 19 996 4.09%
Total 4,621 1,940 21 72 3,839 1,300 274 598 1,041 721 14,427 4.21%
District Blank Scribble Elector Identified
Incorrect District
Number 1 only marked
Tick only marked
Marked with X and others
numbered
No first preference
More than one box left
blankOther Total % of Total
Votes
Baldivis 351 148 3 8 310 53 50 82 140 43 1,188 4.53%
Bateman 258 105 1 5 247 63 1 35 60 17 792 3.39%
Bicton 208 93 1 3 224 54 9 46 47 10 695 2.98%
Cannington 335 120 4 3 310 101 13 107 93 0 1,086 4.95%
Cockburn 416 155 0 5 386 145 20 107 64 56 1,354 5.51%
Fremantle 372 166 3 6 248 76 24 59 101 57 1,112 4.53%
Jandakot 354 101 0 25 286 62 31 7 58 106 1,030 3.93%
Kwinana 310 129 6 1 326 87 22 88 61 48 1,078 4.90%
Riverton 218 198 6 2 267 75 4 21 49 10 850 3.68%
Rockingham 297 105 4 64 259 125 10 55 49 30 998 4.33%
South Perth 286 72 0 19 258 84 59 45 74 0 897 3.64%
Southern River 311 212 1 24 311 62 46 28 132 18 1,145 4.79%
Victoria Park 234 139 0 4 332 98 28 82 70 38 1,025 4.32%
Warnbro 364 118 1 2 248 82 20 6 55 126 1,022 4.29%
Willagee 286 147 0 8 290 110 21 68 27 0 957 4.30%
Total 4,600 2,008 30 179 4,302 1,277 358 836 1,080 559 15,229 4.27%
Legislative Assembly Informal Survey - Metro and Country
East Metropolitan Region
North Metropolitan Region
South Metropolitan Region
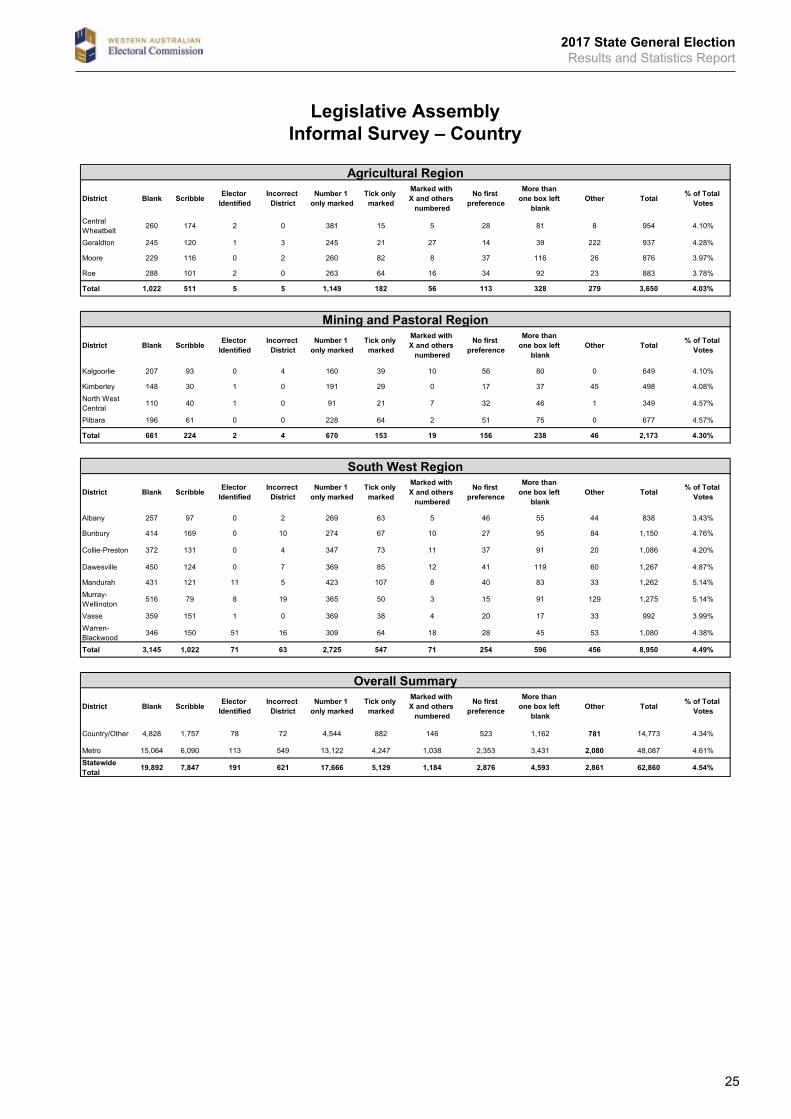
2017 State General ElectionResults and Statistics Report
25
Legislative AssemblyInformal Survey – Country
District Blank Scribble Elector Identified
Incorrect District
Number 1 only marked
Tick only marked
Marked with X and others
numbered
No first preference
More than one box left
blankOther Total % of Total
Votes
Central Wheatbelt
260 174 2 0 381 15 5 28 81 8 954 4.10%
Geraldton 245 120 1 3 245 21 27 14 39 222 937 4.28%
Moore 229 116 0 2 260 82 8 37 116 26 876 3.97%
Roe 288 101 2 0 263 64 16 34 92 23 883 3.78%
Total 1,022 511 5 5 1,149 182 56 113 328 279 3,650 4.03%
District Blank Scribble Elector Identified
Incorrect District
Number 1 only marked
Tick only marked
Marked with X and others
numbered
No first preference
More than one box left
blankOther Total % of Total
Votes
Kalgoorlie 207 93 0 4 160 39 10 56 80 0 649 4.10%
Kimberley 148 30 1 0 191 29 0 17 37 45 498 4.08%North West Central
110 40 1 0 91 21 7 32 46 1 349 4.57%
Pilbara 196 61 0 0 228 64 2 51 75 0 677 4.57%
Total 661 224 2 4 670 153 19 156 238 46 2,173 4.30%
District Blank Scribble Elector Identified
Incorrect District
Number 1 only marked
Tick only marked
Marked with X and others
numbered
No first preference
More than one box left
blankOther Total % of Total
Votes
Albany 257 97 0 2 269 63 5 46 55 44 838 3.43%
Bunbury 414 169 0 10 274 67 10 27 95 84 1,150 4.76%
Collie-Preston 372 131 0 4 347 73 11 37 91 20 1,086 4.20%
Dawesville 450 124 0 7 369 85 12 41 119 60 1,267 4.87%
Mandurah 431 121 11 5 423 107 8 40 83 33 1,262 5.14%Murray-Wellington
516 79 8 19 365 50 3 15 91 129 1,275 5.14%
Vasse 359 151 1 0 369 38 4 20 17 33 992 3.99%Warren-Blackwood
346 150 51 16 309 64 18 28 45 53 1,080 4.38%
Total 3,145 1,022 71 63 2,725 547 71 254 596 456 8,950 4.49%
District Blank Scribble Elector Identified
Incorrect District
Number 1 only marked
Tick only marked
Marked with X and others
numbered
No first preference
More than one box left
blankOther Total % of Total
Votes
Country/Other 4,828 1,757 78 72 4,544 882 146 523 1,162 781 14,773 4.34%
Metro 15,064 6,090 113 549 13,122 4,247 1,038 2,353 3,431 2,080 48,087 4.61%Statewide Total 19,892 7,847 191 621 17,666 5,129 1,184 2,876 4,593 2,861 62,860 4.54%
South West Region
Overall Summary
Agricultural Region
Mining and Pastoral Region
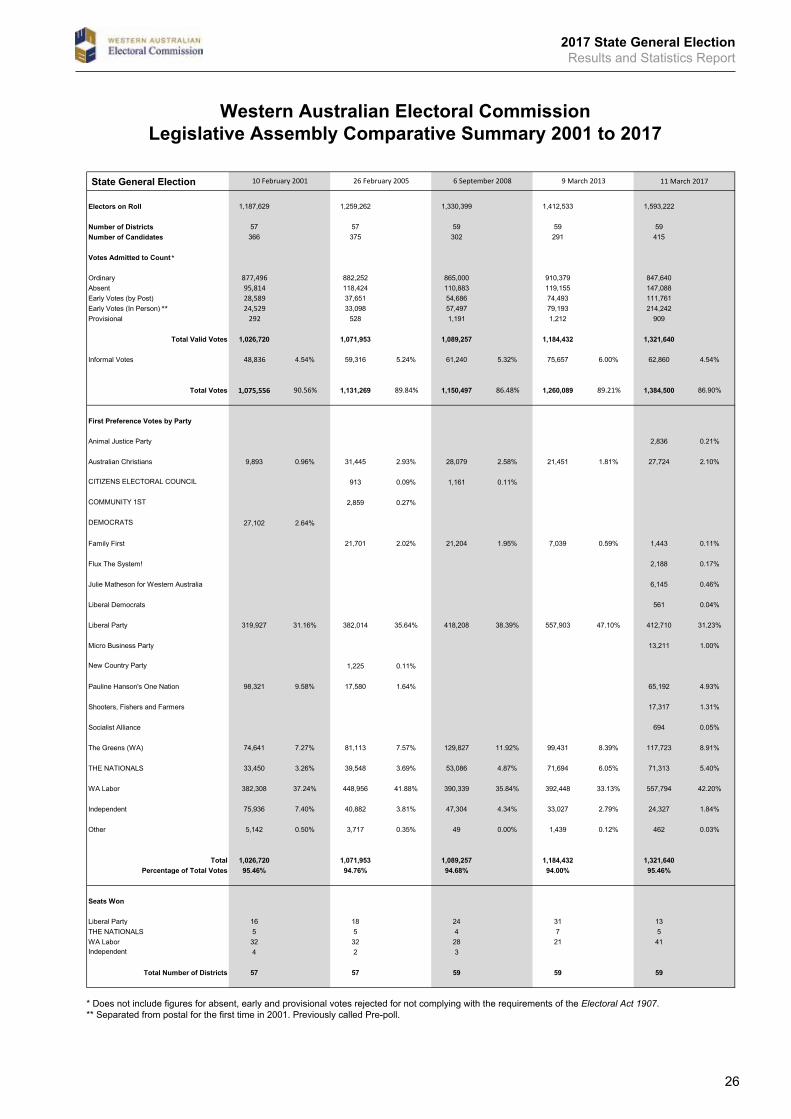
2017 State General ElectionResults and Statistics Report
26
Western Australian Electoral Commission Legislative Assembly Comparative Summary 2001 to 2017
Western Australian Electoral Commission Legislative Assembly Comparative Summary 2001 to 2017
State General Election
Electors on Roll 1,187,629 1,259,262 1,330,399 1,412,533 1,593,222
Number of Districts 57 57 59 59 59Number of Candidates 366 375 302 291 415
Votes Admitted to Count
Ordinary 877,496 882,252 865,000 910,379 847,640Absent 95,814 118,424 110,883 119,155 147,088Early Votes (by Post) 28,589 37,651 54,686 74,493 111,761Early Votes (In Person) 24,529 33,098 57,497 79,193 214,242Provisional 292 528 1,191 1,212 909
Total Valid Votes 1,026,720 1,071,953 1,089,257 1,184,432 1,321,640
Informal Votes 48,836 4.54% 59,316 5.24% 61,240 5.32% 75,657 6.00% 62,860 4.54%
Total Votes 1,075,556 90.56% 1,131,269 89.84% 1,150,497 86.48% 1,260,089 89.21% 1,384,500 86.90%
First Preference Votes by Party
Animal Justice Party 2,836 0.21%
Australian Christians 9,893 0.96% 31,445 2.93% 28,079 2.58% 21,451 1.81% 27,724 2.10%
CITIZENS ELECTORAL COUNCIL 913 0.09% 1,161 0.11%
COMMUNITY 1ST 2,859 0.27%
DEMOCRATS 27,102 2.64%
Family First 21,701 2.02% 21,204 1.95% 7,039 0.59% 1,443 0.11%
Flux The System! 2,188 0.17%
Julie Matheson for Western Australia 6,145 0.46%
Liberal Democrats 561 0.04%
Liberal Party 319,927 31.16% 382,014 35.64% 418,208 38.39% 557,903 47.10% 412,710 31.23%
Micro Business Party 13,211 1.00%
New Country Party 1,225 0.11%
Pauline Hanson's One Nation 98,321 9.58% 17,580 1.64% 65,192 4.93%
Shooters, Fishers and Farmers 17,317 1.31%
Socialist Alliance 694 0.05%
The Greens (WA) 74,641 7.27% 81,113 7.57% 129,827 11.92% 99,431 8.39% 117,723 8.91%
THE NATIONALS 33,450 3.26% 39,548 3.69% 53,086 4.87% 71,694 6.05% 71,313 5.40%
WA Labor 382,308 37.24% 448,956 41.88% 390,339 35.84% 392,448 33.13% 557,794 42.20%
Independent 75,936 7.40% 40,882 3.81% 47,304 4.34% 33,027 2.79% 24,327 1.84%
Other 5,142 0.50% 3,717 0.35% 49 0.00% 1,439 0.12% 462 0.03%
Total 1,026,720 1,071,953 1,089,257 1,184,432 1,321,640Percentage of Total Votes 95.46% 94.76% 94.68% 94.00% 95.46%
Seats Won
Liberal Party 16 18 24 31 13THE NATIONALS 5 5 4 7 5WA Labor 32 32 28 21 41Independent 4 2 3
Total Number of Districts 57 57 59 59 59
26 February 200510 February 2001 11 March 20179 March 20136 September 2008
* Does not include figures for absent, early and provisional votes rejected for not complying with the requirements of the Electoral Act 1907.** Separated from postal for the first time in 2001. Previously called Pre-poll.
*
**
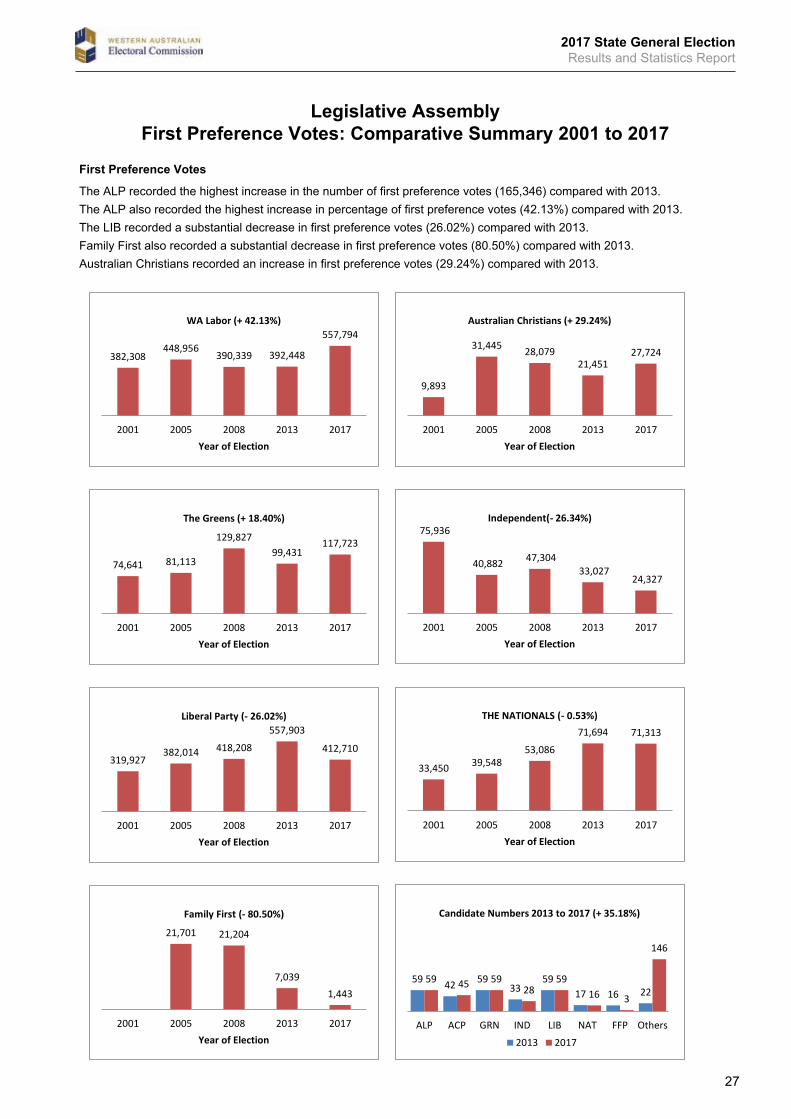
2017 State General ElectionResults and Statistics Report
27
Legislative AssemblyFirst Preference Votes: Comparative Summary 2001 to 2017
ALPACPGRNINDLIB
NATFFP
557,794
392,448 390,339 448,956
382,308
20172013200820052001Year of Election
WA Labor (+ 42.13%)
27,724 21,451
28,079 31,445
9,893
20172013200820052001Year of Election
Australian Christians (+ 29.24%)
117,723 99,431
129,827
81,113 74,641
20172013200820052001Year of Election
The Greens (+ 18.40%)
24,327 33,027
47,304 40,882
75,936
20172013200820052001Year of Election
Independent(- 26.34%)
412,710
557,903
418,208 382,014 319,927
20172013200820052001Year of Election
Liberal Party (- 26.02%)
71,313 71,694
53,086 39,548 33,450
20172013200820052001Year of Election
THE NATIONALS (- 0.53%)
1,443 7,039
21,204 21,701
20172013200820052001Year of Election
Family First (- 80.50%)
59 42 59 33
59 17 16 22
59 45 59 28
59 16 3
146
ALP ACP GRN IND LIB NAT FFP Others
Candidate Numbers 2013 to 2017 (+ 35.18%)
2013 2017
First Preference Votes
The ALP recorded the highest increase in the number of first preference votes (165,346) compared with 2013.The ALP also recorded the highest increase in percentage of first preference votes (42.13%) compared with 2013.The LIB recorded a substantial decrease in first preference votes (26.02%) compared with 2013.Family First also recorded a substantial decrease in first preference votes (80.50%) compared with 2013.Australian Christians recorded an increase in first preference votes (29.24%) compared with 2013.
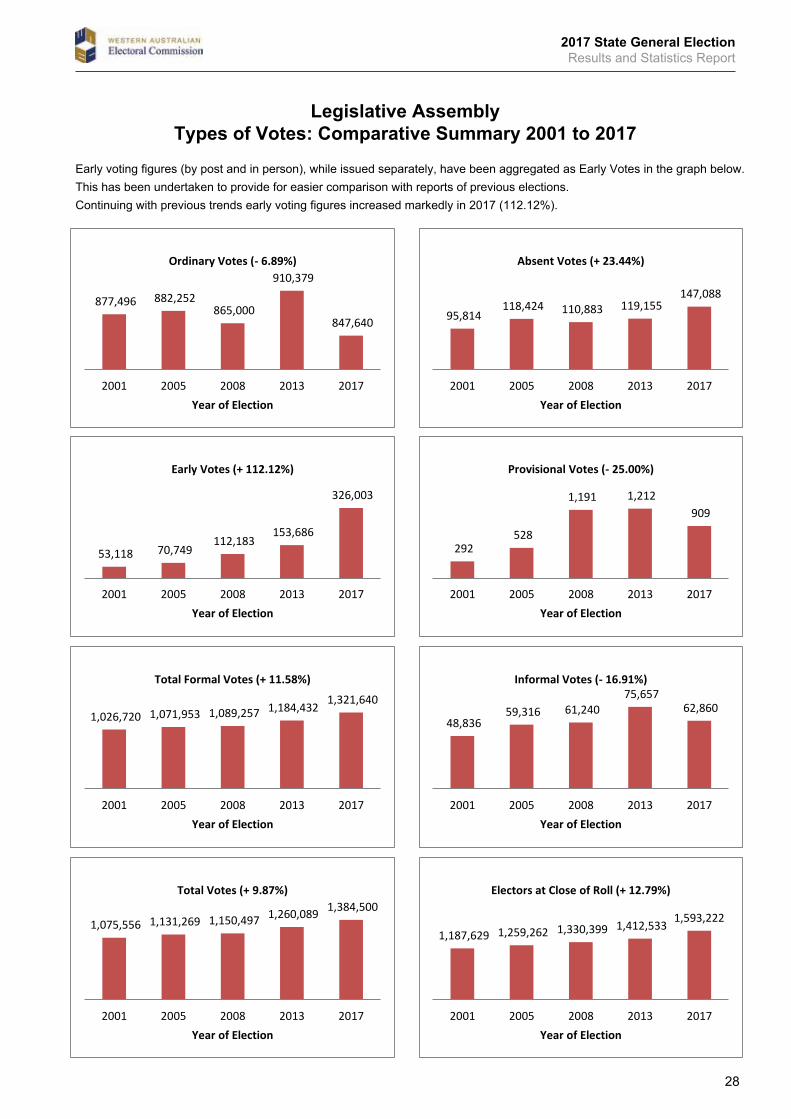
2017 State General ElectionResults and Statistics Report
28
Legislative AssemblyTypes of Votes: Comparative Summary 2001 to 2017
877,496 882,252 865,000
910,379
847,640
2001 2005 2008 2013 2017Year of Election
Ordinary Votes (- 6.89%)
53,118 70,749 112,183
153,686
326,003
2001 2005 2008 2013 2017Year of Election
Early Votes (+ 112.12%)
1,026,720 1,071,953 1,089,257 1,184,432 1,321,640
2001 2005 2008 2013 2017Year of Election
Total Formal Votes (+ 11.58%)
1,075,556 1,131,269 1,150,497 1,260,089 1,384,500
2001 2005 2008 2013 2017Year of Election
Total Votes (+ 9.87%)
95,814 118,424 110,883 119,155
147,088
2001 2005 2008 2013 2017Year of Election
Absent Votes (+ 23.44%)
292 528
1,191 1,212 909
2001 2005 2008 2013 2017Year of Election
Provisional Votes (- 25.00%)
48,836 59,316 61,240
75,657 62,860
2001 2005 2008 2013 2017Year of Election
Informal Votes (- 16.91%)
1,187,629 1,259,262 1,330,399 1,412,533 1,593,222
2001 2005 2008 2013 2017Year of Election
Electors at Close of Roll (+ 12.79%)
Early voting figures (by post and in person), while issued separately, have been aggregated as Early Votes in the graph below.This has been undertaken to provide for easier comparison with reports of previous elections.Continuing with previous trends early voting figures increased markedly in 2017 (112.12%).
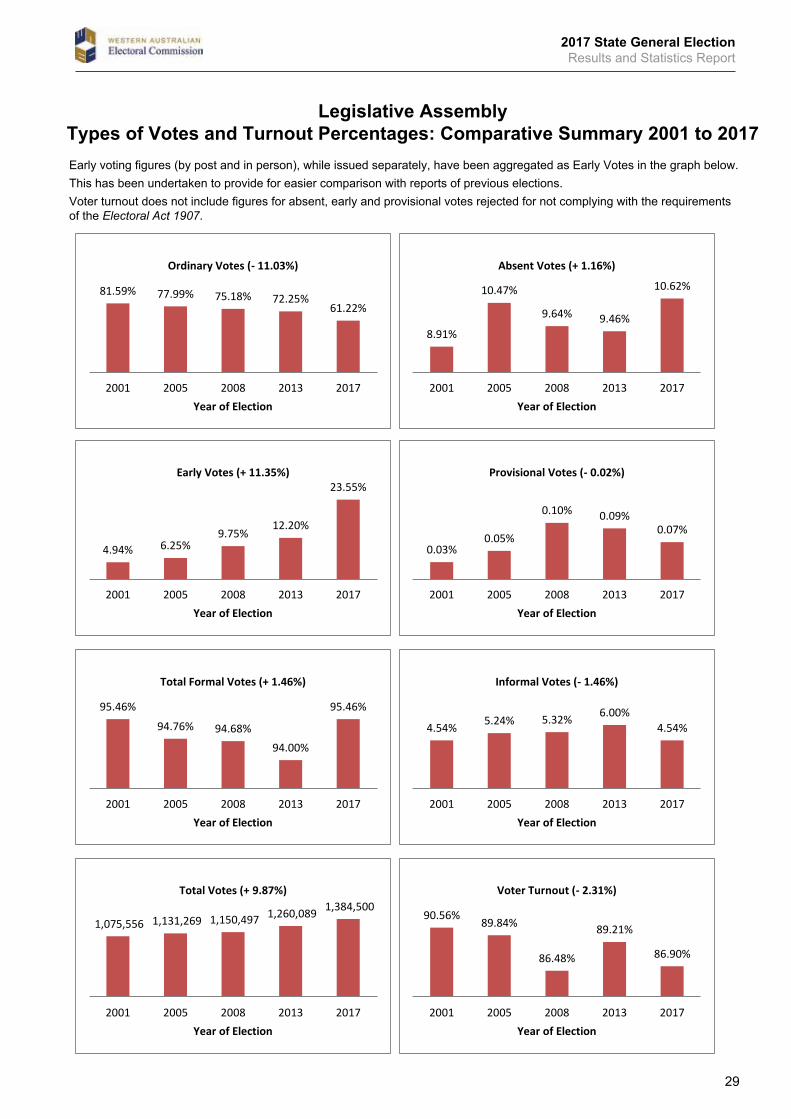
2017 State General ElectionResults and Statistics Report
29
Legislative AssemblyTypes of Votes and Turnout Percentages: Comparative Summary 2001 to 2017
81.59% 77.99% 75.18% 72.25% 61.22%
2001 2005 2008 2013 2017Year of Election
Ordinary Votes (- 11.03%)
4.94% 6.25% 9.75%
12.20%
23.55%
2001 2005 2008 2013 2017Year of Election
Early Votes (+ 11.35%)
95.46%
94.76% 94.68% 94.00%
95.46%
2001 2005 2008 2013 2017Year of Election
Total Formal Votes (+ 1.46%)
1,075,556 1,131,269 1,150,497 1,260,089 1,384,500
2001 2005 2008 2013 2017Year of Election
Total Votes (+ 9.87%)
8.91%
10.47%
9.64% 9.46%
10.62%
2001 2005 2008 2013 2017Year of Election
Absent Votes (+ 1.16%)
0.03% 0.05%
0.10% 0.09% 0.07%
2001 2005 2008 2013 2017Year of Election
Provisional Votes (- 0.02%)
4.54% 5.24% 5.32% 6.00% 4.54%
2001 2005 2008 2013 2017Year of Election
Informal Votes (- 1.46%)
90.56% 89.84%
86.48%
89.21%
86.90%
2001 2005 2008 2013 2017Year of Election
Voter Turnout (- 2.31%)
Early voting figures (by post and in person), while issued separately, have been aggregated as Early Votes in the graph below.This has been undertaken to provide for easier comparison with reports of previous elections.Voter turnout does not include figures for absent, early and provisional votes rejected for not complying with the requirements of the Electoral Act 1907.