
Legal Responsibility for Child Protective Services · Legal Responsibility for Child Protective...
52
2002 Data Book The Texas Department of Protective and Regulatory Services 35 Legal Responsibility for Child Protective Services Statutory References Social Security Act Texas Family Code Human Resources Code Major Provisions • Definitions of abuse and neglect of children; • Mandatory reporting of suspected abuse or neglect of children; • Prepare and disseminate statistics by county relating to CPS in an annual report made available to the legislature and general public; • Responsibility for receiving reports of suspected abuse or neglect of children; • Responsibility for thorough investigation of a report of child abuse or neglect allegedly committed by a person responsible for a child’s care, custody or welfare; • Responsibility to assign priorities and prescribe investigative procedures for investigations based on the severity and immediacy of the alleged harm to the child; • Take action to protect abused and neglected children from further harm; • Establish review teams to evaluate department casework and decision-making related to investigations of child abuse or neglect. • Employ a CPS investigations coordinator (Risk Director) to conduct staff reviews and evaluations of cases determined to involve high risk, monitor cases with multiple referrals, and approve decisions and assessments related to investigations which involve a high risk to the health or safety of a child. • Work with children and their families, providing services to prevent further abuse, help alleviate the effects of the abuse suffered, prevent removal of the child from the home, and provide reunification services when appropriate for the return of the child to the home; • When necessary, secure appropriate court orders and take possession of a child if there is an immediate danger to the physical health or safety of the child or the child has been a victim of neglect or sexual abuse and that continuation in the home would be contrary to the child’s welfare; • Make reasonable efforts to secure the return of the child; • Develop a service plan in conference with the child’s parents to determine return of the child to the child’s parents, termination of parental rights and placement of the child for adoption, or because of the child’s special needs or exceptional circumstances continue the child’s care out of the child’s home; • Provide substitute care for children until the problems have been sufficiently resolved; • Provide permanent placement for children who cannot safely return to their home. • Establish a database of all verified foster homes willing to accept foster care placement of a child in care; • Recruit potential adoptive parents for children whose parents have had their parental rights terminated.
Transcript of Legal Responsibility for Child Protective Services · Legal Responsibility for Child Protective...

2002 Data Book The Texas Department of Protective and Regulatory Services
35
Legal Responsibility for Child Protective Services Statutory References
Social Security Act Texas Family Code Human Resources Code
Major Provisions
• Definitions of abuse and neglect of children; • Mandatory reporting of suspected abuse or neglect of children; • Prepare and disseminate statistics by county relating to CPS in an annual report made available to the
legislature and general public; • Responsibility for receiving reports of suspected abuse or neglect of children; • Responsibility for thorough investigation of a report of child abuse or neglect allegedly committed by a
person responsible for a child’s care, custody or welfare; • Responsibility to assign priorities and prescribe investigative procedures for investigations based on the
severity and immediacy of the alleged harm to the child; • Take action to protect abused and neglected children from further harm; • Establish review teams to evaluate department casework and decision-making related to investigations of
child abuse or neglect. • Employ a CPS investigations coordinator (Risk Director) to conduct staff reviews and evaluations of
cases determined to involve high risk, monitor cases with multiple referrals, and approve decisions and assessments related to investigations which involve a high risk to the health or safety of a child.
• Work with children and their families, providing services to prevent further abuse, help alleviate the effects of the abuse suffered, prevent removal of the child from the home, and provide reunification services when appropriate for the return of the child to the home;
• When necessary, secure appropriate court orders and take possession of a child if there is an immediate danger to the physical health or safety of the child or the child has been a victim of neglect or sexual abuse and that continuation in the home would be contrary to the child’s welfare;
• Make reasonable efforts to secure the return of the child; • Develop a service plan in conference with the child’s parents to determine return of the child to the
child’s parents, termination of parental rights and placement of the child for adoption, or because of the child’s special needs or exceptional circumstances continue the child’s care out of the child’s home;
• Provide substitute care for children until the problems have been sufficiently resolved; • Provide permanent placement for children who cannot safely return to their home. • Establish a database of all verified foster homes willing to accept foster care placement of a child in care; • Recruit potential adoptive parents for children whose parents have had their parental rights terminated.

2002 Data Book The Texas Department of Protective and Regulatory Services
36
Concepts Guiding Risk Determination
Child Vulnerability Home Environment Caregiver Capability Quality of Care Child Fragility Stressors Knowledge Quality of connection Child Behavior Dangerous Exposure Skills Emotional care Capacity Physical care
Social Environment Response to CPS Maltreatment Pattern Social climate Attitude Chronicity Social violence Deception Current severity Trends
Fiscal Year 2002 Expenditures and Staffing CPS Staff Costs $225,453,368
4,689 Direct Delivery (supervisors, workers, clerical) 5,069 Total Staff
Purchased Services $50,815,798
• Counseling/Evaluation/Testing • Homemaker Services • Parent/Community Groups • Post Adoption Services Program • Day Care Services . . . and many more
Foster Care Payments $300,376,050 Adoption Subsidy Payments $83,194,340 Federally Funded Special Projects, Staff Costs and Purchased Services $2,812,033 21 Total Staff

2002 Data Book The Texas Department of Protective and Regulatory Services
Region Child Population Children in Investigations*
Children inConfirmed
Investigations*
ChildrenReceiving Services
Lubbock (1) 213,184 12,566 3,845 1,562Abilene (2) 137,504 7,786 2,626 1,618Arlington (3) 1,576,751 65,189 17,245 8,062Tyler (4) 257,425 14,383 3,961 2,555Beaumont (5) 189,099 10,324 2,697 1,078Houston (6) 1,425,669 52,631 15,506 8,039Austin (7) 607,088 31,571 8,425 3,522San Antonio (8) 615,573 29,881 8,308 6,135Midland (9) 147,475 7,252 2,064 1,616El Paso (10) 227,298 8,026 2,017 1,353Edinburg (11) 589,642 27,236 7,500 6,252Other 0 19 5 5
Total 5,986,708 266,864 74,199 41,797
* Includes child victims as well as other children in home who are not victims of abuse or neglect
Children in Investigations of Child Abuse/NeglectFiscal Year 2002
266,864
74,199
41,797
0
50,000
100,000
150,000
200,000
250,000
300,000
Children in investigations Children in confirmedinvestigations
Children receiving services
Texas Total Child Population = 5,986,708
37

2002 Data Book The Texas Department of Protective and Regulatory Services
38
Texas Total Child Population Ages Birth Through 17 Years by County
Fiscal Year 2002
State Total 5,986,708
Region 7 607,088
6 Region 5 189,099
10
Region 9 147,475
Region 1 213,184
Region 2 137,504 Region 3
1,576,751 Region 4 257,425
Region 6 1,425,669
Region 11 589,642
Region 8 615,573
Region 10 227,298
1
2 34
57
11
8
9
Population
Under 2,000 2,000 to 5,000 5,000 to 10,000 10,000 to 50,000 50,000 to 100,000 100,000 and Over Population data source: Texas State Data Center, Texas A&M University

2002 Data Book The Texas Department of Protective and Regulatory Services
Services Families Children
Intakes ** 15,550 38,124Investigations 10,438 25,592Family Preservation 4,379 12,679Intensified Services 1,868 4,984Substitute Care 11,161 14,983Family Reunification 884 2,130Plan is Adoption N/A 4,709
Total Cases 44,280 103,201
* Does not include contracted direct delivery services** Includes intakes assigned, intakes not assigned, and case-related special requests
Average Monthly NumberChild Protective Services Direct Delivery Cases*
Fiscal Year 2002
39

2002 Data Book The Texas Department of Protective and Regulatory Services
Note: In fiscal year 2002 DPRS implemented a revised methodology for calculation of the weighted caseload. Intake cases which are predominately handled by a centralized hotline were excluded from the case counts as were theworkers. Previous fiscal years have been recalculated to be consistent with the revised methodology.
Average Monthly Weighted CPS Caseload
Fiscal Year 2002
Average Monthly Weighted CPS Caseload per Worker by Fiscal Year
per Worker by Region
27.2
23.0
17.2
20.3
15.0
26.824.5
26.1 25.9
10.1
18.921.3
0
10
20
30
Lubbock
(1)
Abilene
(2)
Arlingto
n (3)
Tyler (4
)
Beaumont
(5)
Houston
(6)
Austin (
7)
San Anto
nio (8)
Midland
(9)
El Paso
(10)
Edinbur
g (11) Sta
te
21.321.519.7
17.2
0
10
20
30
1999 2000 2001 2002
40

2002 Data Book The Texas Department of Protective and Regulatory Services
Average Monthly Percent of Children Receiving CPS Purchased Services by Region
Fiscal Year 2002
13.1
51.5
12.9 10.8
20.1
6.7
32.4
20.7 22.428.0
22.818.2
0
10
20
30
40
50
60
Lubbock (1) Abilene (2) Arlington (3) Tyler (4) Beaumont (5) Houston (6)
(Percent)
11.2 11.5
27.4
18.4
6.8
12.613.016.0
22.3
37.132.2
21.0
0
10
20
30
40
50
60
Austin (7) San Antonio (8) Midland (9) El Paso (10) Edinburg (11) State
(Percent)
In-Home Care Substitute Care
41

2002 Data Book The Texas Department of Protective and Regulatory Services
Region Information & Referral
Case-related Special Request
Non Case-related Special Request
Reports of Alleged
Abuse/NeglectTotal
Lubbock (1) 6 67 3 18 94Abilene (2) 17 93 0 93 203Arlington (3) 99 536 1 834 1,470Tyler (4) 15 93 3 331 442Beaumont (5) 17 82 4 170 273Houston (6) 1,872 346 3 81 2,302Austin (7) 35 229 0 216 480San Antonio (8) 16 156 1 58 231Midland (9) 2 12 2 14 30El Paso (10) 52 82 13 40 187Edinburg (11) 48 128 23 132 331Unknown 22 328 2 251 603Statewide Intake 328,594 1,544 275 257,789 588,202
State Total 330,795 3,696 330 260,027 594,848
* Includes Adult Protective, Child Protective, and Licensing Programs
Total Number of Calls* by RegionFiscal Year 2002
42

2002 Data Book The Texas Department of Protective and Regulatory Services
* Reports meeting the statutory definition of child abuse/neglect with sufficient identifying information are assigned. ** Reports not meeting the statutory definition or without sufficient identifying information to locate the family are not assigned.*** Region unknown
Note: Information and referral requests, written or verbal are not included in the data in these charts and graphs.
Reports of Child Abuse/Neglect by RegionFiscal Year 2002
Reports of Child Abuse/Neglect by Fiscal Year
7,33
2
4,78
6 9,70
9
6,03
4
29,6
38
19,4
89
16,7
95
4,23
5
4,49
5
14,5
62
26854
1,21
7 5,14
4
1,02
8
1,14
9 5,59
6
2,94
5
4,22
4
963
800
1,31
6
277
40,4
43
0
10,000
20,000
30,000
40,000
50,000
Lubbock
(1)
Abilene
(2)
Arlingto
n (3)
Tyler (4
)
Beaumont
(5)
Houston
(6)
Austin (
7)
San Anto
nio (8)
Midland
(9)
El Paso
(10)
Edinbur
g (11)
Other**
*
Assigned* Not assigned**
157,544142,910139,898
131,920
25,51328,85831,04629,379
0
25,000
50,000
75,000
100,000
125,000
150,000
175,000
1999 2000 2001 2002
Assigned* Not assigned**
43

2002 Data Book The Texas Department of Protective and Regulatory Services
The categories used to record the findings and initial assessment/investigation of child abuse/neglectare defined as: Confirmed Investigations
Reason to believe -- Based on a preponderance of evidence, staff concludedthat abuse or neglect occurred.
Unconfirmed InvestigationsRuled out -- Staff determined, based on available information, that it is reasonableto conclude that abuse or neglect has not occurred.Moved -- Before staff could reach a conclusion, the persons involved in the report moved and could not be located.Unable-to-determine -- Staff concluded that none of the other dispositions were appropriate.
Region Total Confirmed PercentConfirmed Unconfirmed
Lubbock (1) 6,069 1,670 27.5% 4,399Abilene (2) 3,965 1,179 29.7% 2,786Arlington (3) 31,306 7,415 23.7% 23,891Tyler (4) 7,370 1,762 23.9% 5,608Beaumont (5) 5,062 1,164 23.0% 3,898Houston (6) 24,395 6,485 26.6% 17,910Austin (7) 14,710 3,479 23.7% 11,231San Antonio (8) 13,213 3,202 24.2% 10,011Midland (9) 3,506 871 24.8% 2,635El Paso (10) 3,534 780 22.1% 2,754Edinburg (11) 12,119 2,890 23.8% 9,229Unknown 9 2 22.2% 7
State Total 125,258 30,899 24.7% 94,359
* PRS licensing staff investigations of child abuse/neglect in licensed child care facilities and registered family homes are not included in the above totals.
Note: For information regarding child abuse/nelgect investigations in child care facilities see "Complaint Investigations in Child Care Facilities" on page 90.
Child Abuse/Neglect Allegation Dispositions
Number of Child Abuse/Neglect Investigations*Fiscal Year 2002
44

2002 Data Book The Texas Department of Protective and Regulatory Services
Disposition of Investigation
No Significant Risk Identified
Risk Controlled
Risk Indicated
Risk Not Applicable
Blank/ Invalid Total
Confirmed 546 16,928 13,119 243 63 30,899Percent of Total 1.6% 26.2% 71.6% 3.4% 3.7% 24.7%
Unconfirmed 32,768 47,788 5,202 6,949 1,652 94,359Percent of Total 98.4% 73.8% 28.4% 96.6% 96.3% 75.3%
State Total 33,314 64,716 18,321 7,192 1,715 125,258
Note: Only investigations with a risk finding of "Risk Indicated" can be opened for further services. Opened for services is defined as services provided after the investigation was completed.
Risk Assessment Finding
Fiscal Year 2002of Child Abuse/Neglect Investigations
Case Action for Risk Indicated Investigations
Not Opened for Services
1,487 8.1%
Opened for Services 16,83491.9%
45
2002 Data Book The Texas Department of Protective and Regulatory Services
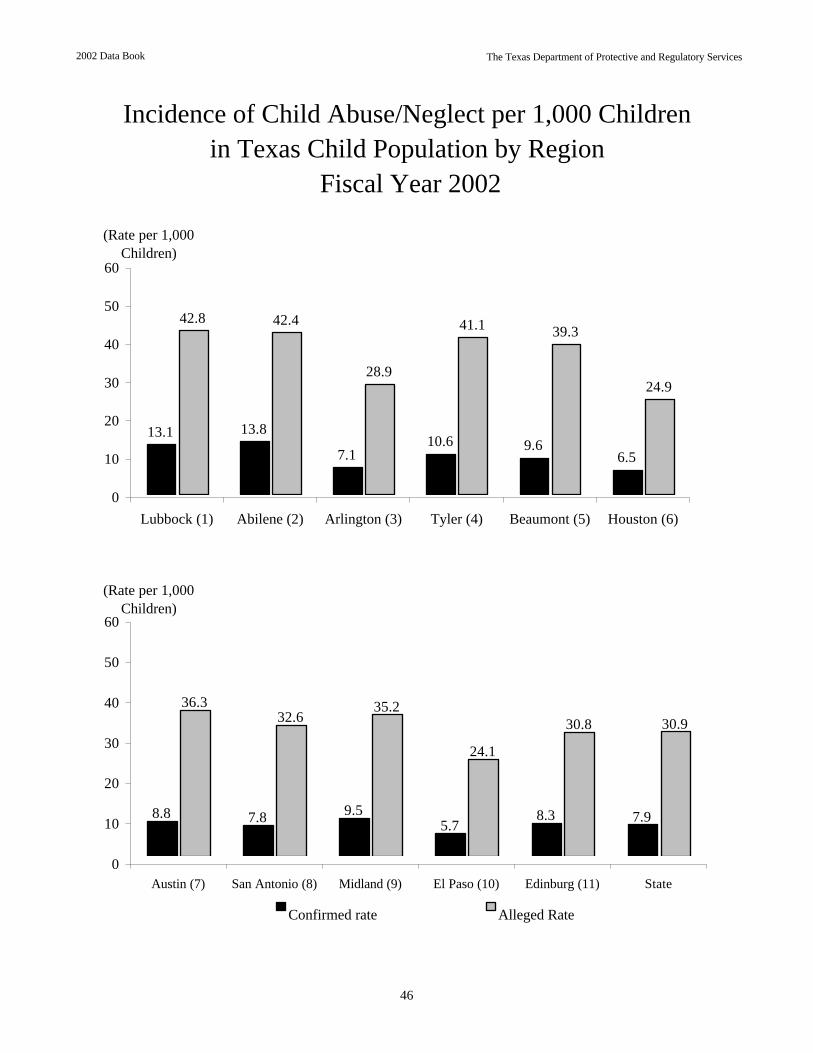
Incidence of Child Abuse/Neglect per 1,000 Childrenin Texas Child Population by Region
Fiscal Year 2002
13.1 13.8
7.110.6 9.6
6.5
42.8 42.4
28.9
41.1 39.3
24.9
0
10
20
30
40
50
60
Lubbock (1) Abilene (2) Arlington (3) Tyler (4) Beaumont (5) Houston (6)
(Rate per 1,000 Children)
8.8 7.8 9.55.7
8.3 7.9
36.332.6
35.2
24.1
30.8 30.9
0
10
20
30
40
50
60
Austin (7) San Antonio (8) Midland (9) El Paso (10) Edinburg (11) State
(Rate per 1,000 Children)
Confirmed rate Alleged Rate
46

2002 Data Book The Texas Department of Protective and Regulatory Services
Region AllegedVictims
ConfirmedVictims
UnconfirmedVictims
PercentConfirmed
Lubbock (1) 9,124 2,784 6,340 30.5%Abilene (2) 5,824 1,901 3,923 32.6%Arlington (3) 45,531 11,209 34,322 24.6%Tyler (4) 10,575 2,740 7,835 25.9%Beaumont (5) 7,429 1,817 5,612 24.5%Houston (6) 35,502 9,207 26,295 25.9%Austin (7) 22,046 5,351 16,695 24.3%San Antonio (8) 20,051 4,781 15,270 23.8%Midland (9) 5,186 1,405 3,781 27.1%El Paso (10) 5,478 1,301 4,177 23.7%Edinburg (11) 18,161 4,908 13,253 27.0%Other 17 5 12 29.4%
State Total 184,924 47,409 137,515 25.6%
Fiscal Year 2002
Alleged and Confirmed Victims of Child Abuse/Neglect by Region
47

2002 Data Book The Texas Department of Protective and Regulatory Services
48
Investigations of Child Abuse/Neglect by Region Fiscal Year 2002
State Total: 125,258
Region 1 6,069
Region 2 3,965
Region 9 3,506
Region 10 3,534
Region 8 13,213
Region 11 12,119
Region 7 14,710
Region 3 31,306 Region 4
7,370
Region 5 5,062
Region 6 24,395
* 9 investigations did not have regions designated.
Investigations
Under 5,000 5,000 to 10,000 10,000 to 15,000 15,000 to 20,000
20,000 and Over

2002 Data Book The Texas Department of Protective and Regulatory Services
49
Investigations of Child Abuse/Neglect by County Fiscal Year 2002
State Total: 125,258
Investigations
Under 100
100 to 250
250 to 500
500 to 1,000
1,000 to 2,000
2,000 and Over * 9 investigations did not have counties designated.

2002 Data Book The Texas Department of Protective and Regulatory Services
Sources Number Percent Number Percent Number Percent
Anonymous 10,030 7.1% 7,858 6.0% 10,079 6.8%Child Care Facility 1,956 1.4% 1,777 1.4% 1,836 1.2%Law Enforcement 17,464 12.3% 16,978 13.0% 18,878 12.8%Parent 12,914 9.1% 11,378 8.7% 13,337 9.0%Relative 16,769 11.8% 17,915 13.8% 20,038 13.7%School 28,285 20.0% 26,957 20.7% 29,704 20.2%Victim 970 0.7% 689 0.5% 807 0.5%Medical Personnel 19,460 13.7% 15,594 12.0% 18,522 12.6%Friend/Neighbor 12,486 8.8% 10,659 8.2% 11,440 7.8%PRS Staff 634 0.4% 448 0.3% 476 0.3%Other 16,707 11.8% 15,851 12.2% 18,113 12.3%Blank 3,979 2.8% 4,090 3.1% 4,186 2.8%
State Total 141,654 100.0% 130,194 100.0% 147,416 100.0%
Note: Reports of Abuse/Neglect situations may come from multiple sources.
Fiscal Year 2001
Investigations of Child Abuse/Neglect by Source of Report
Fiscal Year 2000 Fiscal Year 2002
50

2002 Data Book The Texas Department of Protective and Regulatory Services
51
Confirmed Victims of Child Abuse/Neglect by Region Fiscal Year 2002
State Total: 47,409
Region 1 2,784
Region 2 1,901
Region 9 1,405
Region 10 1,301
Region 8 4,781
Region 11 4,908
Region 7 5,351
Region 3 11,209 Region 4
2,740
Region 51,817
Region 69,207
Confirmed Victims
Under 2,000
2,000 to 4,000
4,000 to 6,000
6,000 to 8,000
8,000 and Over * 5 confirmed victims did not have regions designated.

2002 Data Book The Texas Department of Protective and Regulatory Services
52
Confirmed Victims of Child Abuse/Neglect by County Fiscal Year 2002
State Total: 47,409
Confirmed Victims
Under 50 50 to 100 100 to 200 200 to 500 500 to 1,000
1,000 and Over * 5 confirmed victims did not have a county designated.
1
2 3 4
57
6 8
11
910
2002 Data Book The Texas Department of Protective and Regulatory Services
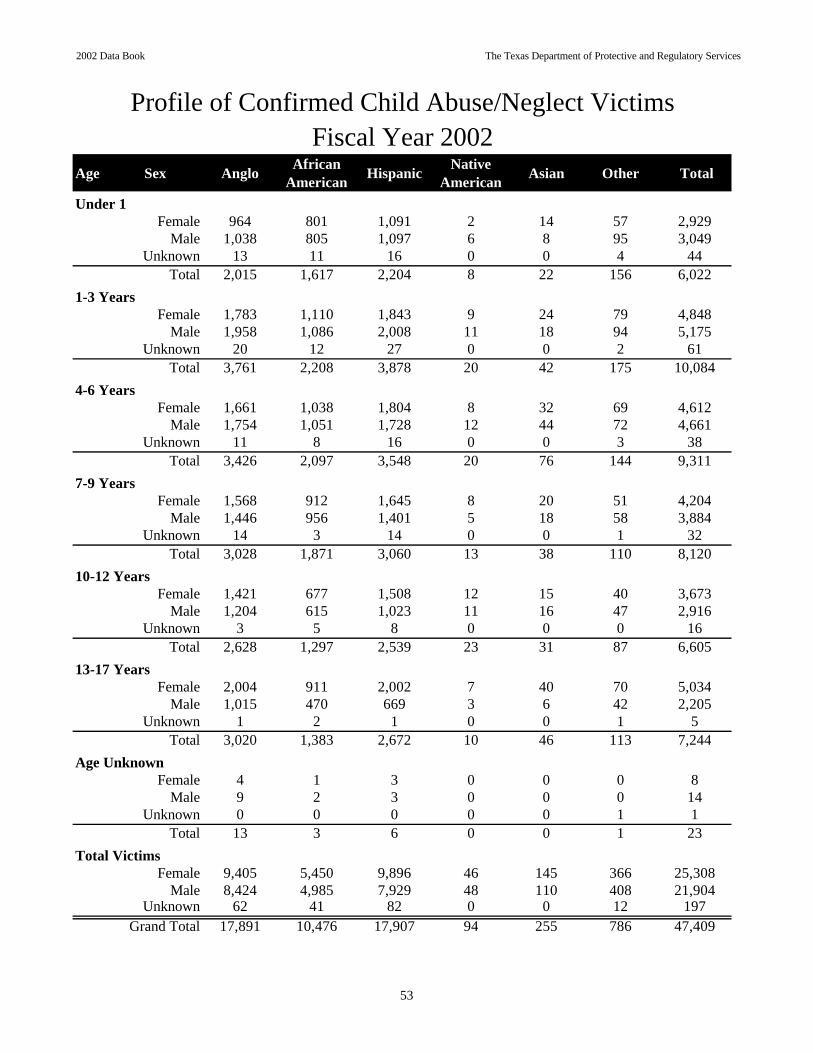
Age Sex Anglo AfricanAmerican Hispanic Native
American Asian Other Total
Under 1Female 964 801 1,091 2 14 57 2,929
Male 1,038 805 1,097 6 8 95 3,049Unknown 13 11 16 0 0 4 44
Total 2,015 1,617 2,204 8 22 156 6,0221-3 Years
Female 1,783 1,110 1,843 9 24 79 4,848Male 1,958 1,086 2,008 11 18 94 5,175
Unknown 20 12 27 0 0 2 61Total 3,761 2,208 3,878 20 42 175 10,084
4-6 YearsFemale 1,661 1,038 1,804 8 32 69 4,612
Male 1,754 1,051 1,728 12 44 72 4,661Unknown 11 8 16 0 0 3 38
Total 3,426 2,097 3,548 20 76 144 9,3117-9 Years
Female 1,568 912 1,645 8 20 51 4,204Male 1,446 956 1,401 5 18 58 3,884
Unknown 14 3 14 0 0 1 32Total 3,028 1,871 3,060 13 38 110 8,120
10-12 YearsFemale 1,421 677 1,508 12 15 40 3,673
Male 1,204 615 1,023 11 16 47 2,916Unknown 3 5 8 0 0 0 16
Total 2,628 1,297 2,539 23 31 87 6,60513-17 Years
Female 2,004 911 2,002 7 40 70 5,034Male 1,015 470 669 3 6 42 2,205
Unknown 1 2 1 0 0 1 5Total 3,020 1,383 2,672 10 46 113 7,244
Age UnknownFemale 4 1 3 0 0 0 8
Male 9 2 3 0 0 0 14Unknown 0 0 0 0 0 1 1
Total 13 3 6 0 0 1 23Total Victims
Female 9,405 5,450 9,896 46 145 366 25,308Male 8,424 4,985 7,929 48 110 408 21,904
Unknown 62 41 82 0 0 12 197Grand Total 17,891 10,476 17,907 94 255 786 47,409
Profile of Confirmed Child Abuse/Neglect VictimsFiscal Year 2002
53

2002 Data Book The Texas Department of Protective and Regulatory Services
Region PhysicalAbuse
SexualAbuse
EmotionalAbuse Abandonment Medical
Neglect
Lubbock (1) 655 361 82 27 124Abilene (2) 438 213 44 14 83Arlington (3) 3,177 1,702 322 153 460Tyler (4) 674 442 74 10 170Beaumont (5) 364 281 36 12 100Houston (6) 2,963 1,716 202 103 421Austin (7) 1,497 750 109 44 218San Antonio (8) 1,312 855 113 70 296Midland (9) 313 190 95 13 76El Paso (10) 320 124 70 13 62Edinburg (11) 1,087 656 113 27 234Other 0 0 0 0 0
State Total 12,800 7,290 1,260 486 2,244
Region PhysicalNeglect
NeglectfulSupervision
Refusal to Accept Parental Responsibility
UnduplicatedConfirmedVictims*
Lubbock (1) 509 1,630 45 2,784Abilene (2) 464 994 24 1,901Arlington (3) 1,624 5,665 160 11,209Tyler (4) 385 1,496 45 2,740Beaumont (5) 301 997 38 1,817Houston (6) 1,072 3,898 217 9,207Austin (7) 591 2,950 120 5,351San Antonio (8) 569 2,274 85 4,781Midland (9) 263 750 10 1,405El Paso (10) 215 705 15 1,301Edinburg (11) 766 2,824 55 4,908Other 4 0 1 5
State Total 6,763 24,183 815 47,409
* Victims have been unduplicated by investigation stage.
Note: Victims of different types of abuse and neglect are not additive because one victim may have multiple types of child abuse/neglect.
Confirmed Victims of Child Abuse/Neglect by TypeFiscal Year 2002
54

2002 Data Book The Texas Department of Protective and Regulatory Services
Characteristic N % N % N % N %
AgeUnder 18 724 1.8% 1,741 4.4% 7 0.0% 2,472 6.3%
18-25 6,843 17.5% 3,181 8.1% 23 0.1% 10,047 25.7%26-35 8,586 21.9% 5,408 13.8% 41 0.1% 14,035 35.8%36-45 4,382 11.2% 4,503 11.5% 15 0.0% 8,900 22.7%
Over 45 1,482 3.8% 2,184 5.6% 6 0.0% 3,672 9.4%Unknown 11 0.0% 15 0.0% 13 0.0% 39 0.1%
Marital StatusMarried 6,872 17.5% 7,148 18.3% 12 0.0% 14,032 35.8%
Widowed 367 0.9% 123 0.3% 0 0.0% 490 1.3%Separated 1,849 4.7% 1,104 2.8% 1 0.0% 2,954 7.5%Divorced 2,617 6.7% 1,397 3.6% 5 0.0% 4,019 10.3%
Single 5,855 14.9% 2,455 6.3% 10 0.0% 8,320 21.2%Unknown 3,916 10.0% 3,061 7.8% 73 0.2% 7,050 18.0%
N/A (Under 18) 552 1.4% 1,744 4.5% 4 0.0% 2,300 5.9%
EthnicityAnglo 9,473 24.2% 7,410 18.9% 21 0.1% 16,904 43.2%
African American 4,789 12.2% 2,847 7.3% 12 0.0% 7,648 19.5%Hispanic 7,260 18.5% 6,208 15.9% 15 0.0% 13,483 34.4%
Native American 47 0.1% 30 0.1% 0 0.0% 77 0.2%Asian 143 0.4% 119 0.3% 2 0.0% 264 0.7%Other 316 0.8% 418 1.1% 55 0.1% 789 2.0%
Relationship to Oldest VictimParent 19,560 49.9% 10,405 26.6% 32 0.1% 29,997 76.6%
Grandparent 1,010 2.6% 665 1.7% 1 0.0% 1,676 4.3%Sibling/Other Relative 326 0.8% 1,838 4.7% 1 0.0% 2,165 5.5%
Aunt/Uncle 472 1.2% 1,059 2.7% 1 0.0% 1,532 3.9%Parent's Paramour 182 0.5% 1,975 5.0% 4 0.0% 2,161 5.5%
Other Sub Care Giver 478 1.2% 1,090 2.8% 66 0.2% 1,634 4.2%
Total Perpetrators 22,028 56.2% 17,032 43.5% 105 0.3% 39,165 100.0%
Characteristics of Perpetrators in Confirmed Investigations of Child Abuse/Neglect
Fiscal Year 2002Female Male Unknown Total
55

2002 Data Book The Texas Department of Protective and Regulatory Services
Characteristics of Perpetrators in ConfirmedInvestigations of Child Abuse/Neglect
Fiscal Year 2002
Relationship to Oldest Victim
Parent's Paramour5.5%
Other Sub Care Giver4.2%
Aunt/Uncle3.9%
Sibling/Other Relative
5.5%
Grandparent4.3%
Parent76.6%
Marital Status
Widowed1.3%
Separated7.5%
Divorced10.3%
Single21.2%
Unknown18.0%
N/A (Under 18)5.9%
Married35.8%
56

2002 Data Book The Texas Department of Protective and Regulatory Services
Characteristics of Perpetrators in ConfirmedInvestigations of Child Abuse/Neglect
Fiscal Year 2002
Sex
Unknown0.3%
Male43.5%
Female56.2%
Age
26-35 35.8%
36-45 22.7%
18-2525.7%
Over 45 9.4%
Unknown 0.1%
Under 18 6.3%
Ethnicity
African American
19.5%
Anglo43.2%
Other2.0%
Asian0.7%Native
American0.2%
Hispanic34.4%
57

2002 Data Book The Texas Department of Protective and Regulatory Services
Region In-Home Direct Delivery
In-Home Purchased
Substitute Care Total
Lubbock (1) 372 7 288 667Abilene (2) 188 398 145 731Arlington (3) 1,484 450 1,475 3,409Tyler (4) 648 143 272 1,063Beaumont (5) 179 140 121 440Houston (6) 1,885 38 1,344 3,267Austin (7) 724 1 701 1,426San Antonio (8) 1,879 166 363 2,408Midland (9) 243 326 99 668El Paso (10) 413 24 57 494Edinburg (11) 1,240 705 315 2,260Other 0 0 2 2
State Total 9,255 2,398 5,182 16,835
Fiscal Year 2002
Family Cases Opened for Servicesas a Result of a Completed Investigation
In-Home Purchased
14.2%
Substitute Care
30.8% In-Home Direct Delivery55.0%
58

2002 Data Book The Texas Department of Protective and Regulatory Services
Region In-HomeDirect Delivery
In-HomePurchased
SubstituteCare Total
Lubbock (1) 933 15 683 1,631Abilene (2) 467 994 332 1,793Arlington (3) 3,811 1,262 3,387 8,460Tyler (4) 1,685 346 631 2,662Beaumont (5) 490 352 291 1,133Houston (6) 5,171 100 3,122 8,393Austin (7) 1,919 2 1,711 3,632San Antonio (8) 5,279 438 941 6,658Midland (9) 609 859 226 1,694El Paso (10) 1,180 62 143 1,385Edinburg (11) 3,627 2,032 814 6,473Other 0 0 5 5
State Total 25,171 6,462 12,286 43,919
as a Result of a Completed InvestigationChildren in Cases Opened for Services
Fiscal Year 2002
In-HomePurchased
14.7%
In-Home Direct Delivery
57.3%
SubstituteCare
28.0%
59
2002 Data Book The Texas Department of Protective and Regulatory Services
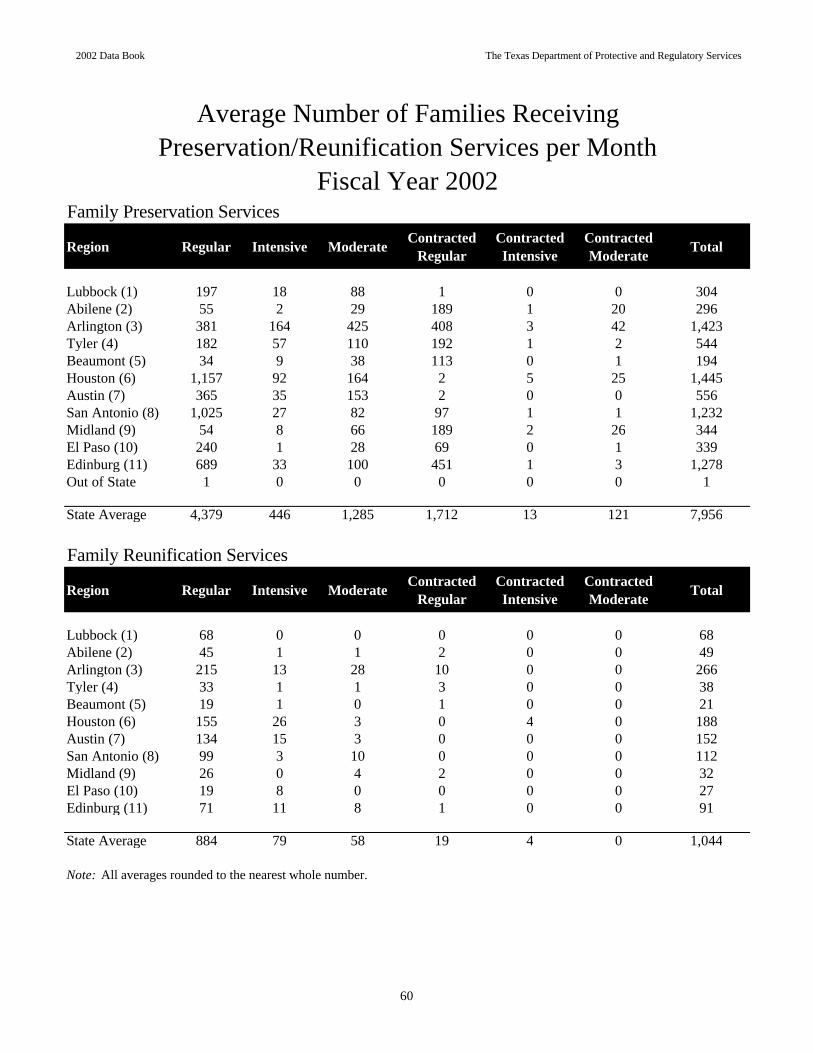
Family Preservation Services
Region Regular Intensive Moderate Contracted Regular
Contracted Intensive
Contracted Moderate Total
Lubbock (1) 197 18 88 1 0 0 304Abilene (2) 55 2 29 189 1 20 296Arlington (3) 381 164 425 408 3 42 1,423Tyler (4) 182 57 110 192 1 2 544Beaumont (5) 34 9 38 113 0 1 194Houston (6) 1,157 92 164 2 5 25 1,445Austin (7) 365 35 153 2 0 0 556San Antonio (8) 1,025 27 82 97 1 1 1,232Midland (9) 54 8 66 189 2 26 344El Paso (10) 240 1 28 69 0 1 339Edinburg (11) 689 33 100 451 1 3 1,278Out of State 1 0 0 0 0 0 1
State Average 4,379 446 1,285 1,712 13 121 7,956
Family Reunification Services
Region Regular Intensive Moderate Contracted Regular
Contracted Intensive
Contracted Moderate Total
Lubbock (1) 68 0 0 0 0 0 68Abilene (2) 45 1 1 2 0 0 49Arlington (3) 215 13 28 10 0 0 266Tyler (4) 33 1 1 3 0 0 38Beaumont (5) 19 1 0 1 0 0 21Houston (6) 155 26 3 0 4 0 188Austin (7) 134 15 3 0 0 0 152San Antonio (8) 99 3 10 0 0 0 112Midland (9) 26 0 4 2 0 0 32El Paso (10) 19 8 0 0 0 0 27Edinburg (11) 71 11 8 1 0 0 91
State Average 884 79 58 19 4 0 1,044
Note: All averages rounded to the nearest whole number.
Average Number of Families ReceivingPreservation/Reunification Services per Month
Fiscal Year 2002
60
2002 Data Book The Texas Department of Protective and Regulatory Services
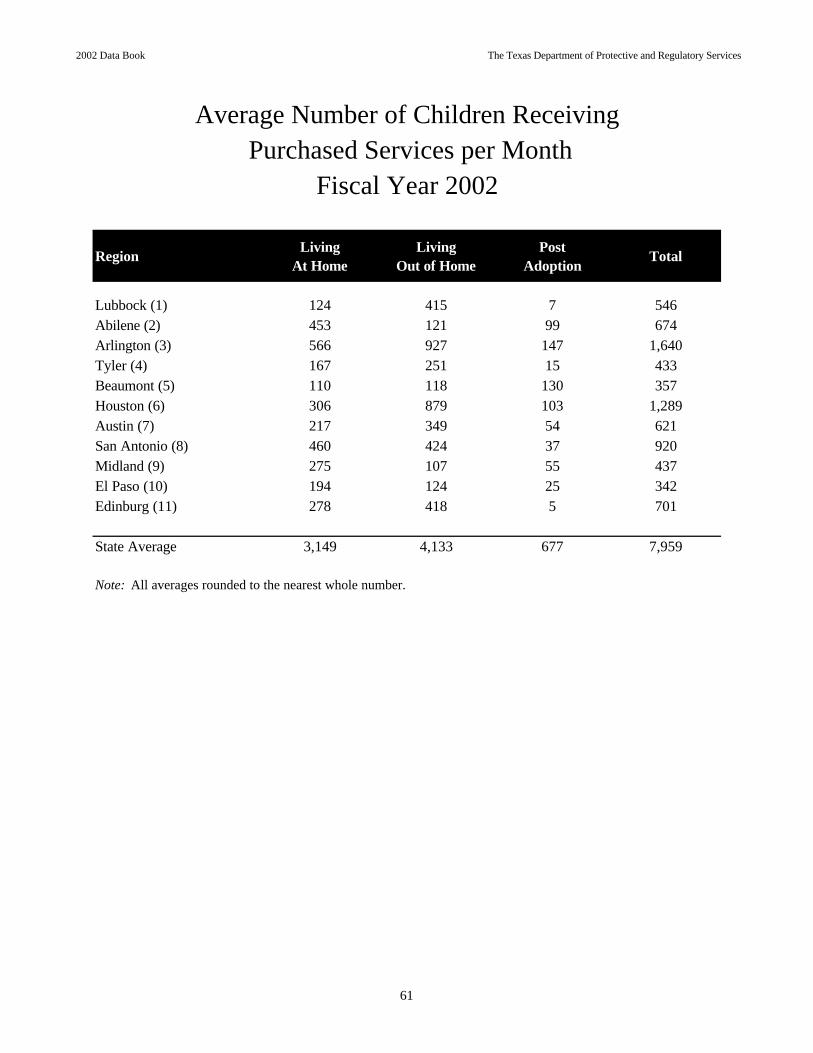
Region Living At Home
Living Out of Home
Post Adoption Total
Lubbock (1) 124 415 7 546Abilene (2) 453 121 99 674Arlington (3) 566 927 147 1,640Tyler (4) 167 251 15 433Beaumont (5) 110 118 130 357Houston (6) 306 879 103 1,289Austin (7) 217 349 54 621San Antonio (8) 460 424 37 920Midland (9) 275 107 55 437El Paso (10) 194 124 25 342Edinburg (11) 278 418 5 701
State Average 3,149 4,133 677 7,959
Note: All averages rounded to the nearest whole number.
Average Number of Children Receiving Purchased Services per Month
Fiscal Year 2002
61

2002 Data Book The Texas Department of Protective and Regulatory Services
62
Annual Number of Children in Foster Care by County Fiscal Year 2002
State Total: 24,515
Children in Foster Care
Under 100
100 to 250
250 to 500
500 to 1,000
1,000 and Over
1
2 3 4
5 7
6 8
11
9 10
Region 2 760 Region 3
5,668
Region 4 1195
Region 5672
Region 6 5,543
Region 7 3,409
Region 11 1,755
Region 8 2,985
Region 10 433
Region 9 530
Region 1 1,565

2002 Data Book The Texas Department of Protective and Regulatory Services
Note: A total of 11,309 children entered substitute care.
* Rate per 1,000 children
Point Prevalence Rate* for Children Entering Substitute CareFiscal Year 2002
Point Prevalence Rate* for Children in Substitute Care at the End of Fiscal Year 2002
3.0
2.11.9
2.3
1.51.9
2.4
1.81.4
0.7
1.51.9
0
1
2
3
4
Lubbock
(1)
Abilene
(2)
Arlingto
n (3)
Tyler (4
)
Beaumont
(5)
Houston
(6)
Austin (
7)
San Anto
nio (8)
Midland
(9)
El Paso
(10)
Edinbur
g (11) Sta
te
6.2
3.9
2.6
3.6
2.6
4.4 4.2
3.0
1.4
3.3
2.2
3.4
0
1
2
3
4
5
6
7
Lubbock
(1)
Abilene
(2)
Arlingto
n (3)
Tyler (4
)
Beaumont
(5)
Houston
(6)
Austin (
7)
San Anto
nio (8)
Midland
(9)
El Paso
(10)
Edinbur
g (11) Sta
te
63

2002 Data Book The Texas Department of Protective and Regulatory Services
Region
Lubbock (1)Abilene (2)Arlington (3)Tyler (4)Beaumont (5)Houston (6)Austin (7)San Antonio (8)Midland (9)El Paso (10)Edinburg (11)
Total
Note: Foster Care is a sub-set of Substitute Care, and includes youth who have aged out of PRS legal responsibility but remain in foster care.
Legal Status of Children in PRS Legal Responsibility
Number Percent
Care, Custody & Control 123 0.6%
Temporary Managing Conservatorship 10,448 49.4%
Permanent Managing Conservatorship Parental Rights Not Terminated 3,186 15.1% Parental Rights Terminated (All) 6,442 30.5% Parental Rights Terminated (One Parent) 538 2.5%
Possessory Conservatorship 409 1.9%
Total 21,146 100.0%
19,516 14,843
3261,277 1,000
1,994347281
2,722
3,3192,151
742989526
5,2182,873
924488
4,837
August 2002
1,095
401
Legal Status
3461,416
21,146
1,408609
4,567
at the End of Fiscal Year 2002Substitute
Care
1,312543
PRS Legal Responsibility
Children in PRS Legal Responsibility, inSubstitute Care, and in Foster Care Placements
472
2,6892,565440
Foster Care
4653,0484,115
64

2002 Data Book The Texas Department of Protective and Regulatory Services
Note: Foster care totals exclude youth age18 or 19 who remain in foster care but have aged out of PRS legal responsibility. Non-foster care placements include adoption, relative, own home, and other.
Children in PRS Legal Responsibility by Living ArrangementEnd of August Each Fiscal Year
11,79312,857 13,481
14,552
4,268
4,540
5,575
6,59416,061
17,397
19,056
21,146
0
5,000
10,000
15,000
20,000
25,000
1999 2000 2001 2002
Total PRS Legal Responsibility with Percent Change Over Previous YearNon-Foster CareFoster Care
8.3%increase
9.5%increase
11%increase
65

2002 Data Book The Texas Department of Protective and Regulatory Services
* Other includes independent living, hospitals, nursing homes, correctional facilities, and unauthorized absence (left without permission).
Children in PRS Legal Responsibilityin Non-Foster Care Placements
by Fiscal Year
857
2,0482,443
3,494
935 732
759
869
104
1,5111,2551,181
2,871
690
720
508
6,594
5,575
4,5404,268
0
1,000
2,000
3,000
4,000
5,000
6,000
7,000
1999 2000 2001 2002
Own Home Relative Adoption Other*
66

2002 Data Book The Texas Department of Protective and Regulatory Services
Note: Averages have been rounded to the nearest whole number.
Status of Children No Longer in PRS Legal Responsibility
Fiscal Year 2002
Other5.5%
Custody Given to Relatives
21.5%
Adoption Consummated
26.3%
Children Emancipated
10.1%
Returned Home36.6%
67

2002 Data Book The Texas Department of Protective and Regulatory Services
Permanency Goal of Children in Substitute Care for Whom PRS Had Legal Responsibility
on August 31, 2002
Note: Children counted had an approved permanency goal recorded. Policy allows up to 45 days from entry into care to record the permanency goal.
Family Reunification
28.3%
Adult Living10.7%
Permanent Placement with
Relatives8.7%
Adoption by Non-Relative
39.3%
Alternative Long-term Livng
13.0%
68

2002 Data Book The Texas Department of Protective and Regulatory Services
Fiscal Year State Paid Foster Care**
Title IV-EFoster Care
Other Care*
Total Children in Foster Care
Percent Change from Previous
Fiscal Year
1997 5,002 6,811 546 12,359 3.7%1998 4,810 7,099 240 12,149 -1.7%1999 4,795 7,187 58 12,040 -0.9%2000 5,272 7,842 103 13,218 9.8%2001 5,727 8,187 234 14,148 7.0%2002 6,304 8,884 87 15,274 15.6%
Region Title IV-EFoster Care
Lubbock (1) 685Abilene (2) 289Arlington (3) 1,677Tyler (4) 338Beaumont (5) 233Houston (6) 1,943Austin (7) 1,237San Antonio (8) 1,387Midland (9) 229El Paso (10) 172Edinburg (11) 687Blank Region 8
Total 8,884
* Cost of care not covered by Title IV-E or State Paid Foster Care** State Paid Foster Care may be funded with Federal Block Grant (TANF).Note: All averages rounded to the nearest whole number.
87
8328
21714
0
1113748
6,304
1,426943695137
185
Fiscal Year 2002Monthly Average by Region
State Paid Foster Care**
368218
1,450
Other Care*
63
Children in Foster CareMonthly Average by Fiscal Year
Children in Foster Care
386185
69

2002 Data Book The Texas Department of Protective and Regulatory Services
Number % Number % Number % Number %
AgeBirth - 2 1,696 15.7% 2,016 17.2% 2,622 19.1% 2,893 19.5%
3 - 5 1,452 13.4% 1,452 12.4% 1,775 12.9% 1,905 12.8%6 - 9 2,196 20.3% 2,329 19.8% 2,287 16.7% 2,448 16.5%
10 - 13 2,493 23.0% 2,637 22.5% 3,129 22.8% 3,293 22.2%14 - 17 2,889 26.7% 3,116 26.1% 3,668 26.7% 4,013 27.0%18 - 20 96 0.9% 243 2.0% 248 1.8% 291 2.0%
SexMale 5,692 52.6% 6,216 52.6% 7,299 53.2% 7,782 52.4%
Female 5,130 47.4% 5,556 47.2% 6,423 46.8% 7,052 47.5%Unknown 0 0.0% 21 0.2% 7 0.1% 9 0.1%
EthnicityAnglo 3,600 33.3% 3,980 33.8% 4,615 33.6% 4,886 32.9%
African American 3,579 33.1% 3,916 33.2% 4,322 31.5% 4,654 31.4%Hispanic 3,248 30.0% 3,613 30.6% 4,547 33.1% 4,994 33.6%
Native American 43 0.4% 60 0.5% 53 0.4% 52 0.4%Asian 25 0.2% 50 0.4% 66 0.5% 75 0.5%Other 327 3.0% 174 1.5% 126 0.9% 182 1.2%
Total 10,822 100.0% 11,793 100.0% 13,729 100.0% 14,843 100.0%
Demographics of Children in Foster Care
August 1999 August 2000 August 2001
by Fiscal Year
August 2002Characteristic
70

2002 Data Book The Texas Department of Protective and Regulatory Services
Number Rate Number Rate Number Rate
LOC 01 5,359 $16.96 5,548 $16.96 6,050 $19.97LOC 02 1,579 $36.33 1,564 $36.33 1,632 $47.73LOC 03 2,391 $62.15 2,737 $62.15 3,042 $67.99LOC 04 2,150 $88.42 2,348 $88.42 2,579 $88.42LOC 05 644 $106.66 704 $106.66 762 $121.55LOC 06 192 $200.98 185 $200.98 246 $209.84E2 14 $62.15 33 $62.15 40 $67.10E3 783 $97.50 798 $97.50 837 $99.47
All levels 13,112 13,917 15,190
Note: Calculations exclude children where cost of care was not covered by Title IV-E or state paid foster care.State Paid Foster Care may be funded with Federal Block Grant (TANF).Also, averages are rounded to the nearest whole number.
as of August 31, 2002
2000 2001 2002
Average Monthly Number of Children in Paid Foster Care by Level of Care (LOC)
Sources of Foster Care
Level of Care
Each Fiscal Year
Title IV-EFoster Care
8,88458.5%
State Paid Foster Care
6,30441.5%
71

2002 Data Book The Texas Department of Protective and Regulatory Services
Number of PRS Foster, Foster/Adoptive, andAdoptive Homes as of August 31, 2002
Region Foster Homes
Adoptive Homes**
Lubbock (1) 47 9Abilene (2) 18 30Arlington (3) 97 86Tyler (4) 65 28Beaumont (5) 49 15Houston (6) 253 119Austin (7) 137 98San Antonio (8) 103 59Midland (9) 23 34El Paso (10) 38 15Edinburg (11) 50 41Out of State 0 0
Total 880 534
* The Foster/Adopt Homes category includes legal risk homes and kinship homes.** This number does not include the homes open only for receipt of adoption subsidy.Note: Homes may be duplicated across Foster and Adoptive categories.
Fiscal Year 2002Children Placed in Adoptive Homes by Region
Foster/Adoptive Homes*
162135845197144433233207
2,639
6676
1401
15978
45
289
471
8510781108
482568
0
100
200
300
400
500
600
700
Lubbock
(1)
Abilene
(2)
Arlingto
n (3)
Tyler (4
)
Beaumont
(5)
Houston
(6)
Austin (
7)
San Anto
nio (8)
Midland
(9)
El Paso
(10)
Edinbur
g (11)
Total Adoption Placements: 2,473Total Unique Children: 2,465
72

2002 Data Book The Texas Department of Protective and Regulatory Services
Demographics of 2,465 Children Placed in Adoptive HomesFiscal Year 2002
Age
Under 1 year4.6%
13 years and Over
6.5%
6 - 12 years
33.5%
1 - 5 years
55.4%
Child Characteristics
52.0%
48.0%
No Special Characteristics
Disabling Condition
Ethnicity
Asian0.5%
Other1.3%
Native American
0.4%
Hispanic36.1%
Anglo31.8%
African American
29.9%
Sex
Female49.8%
Male50.2%
73
2002 Data Book The Texas Department of Protective and Regulatory Services
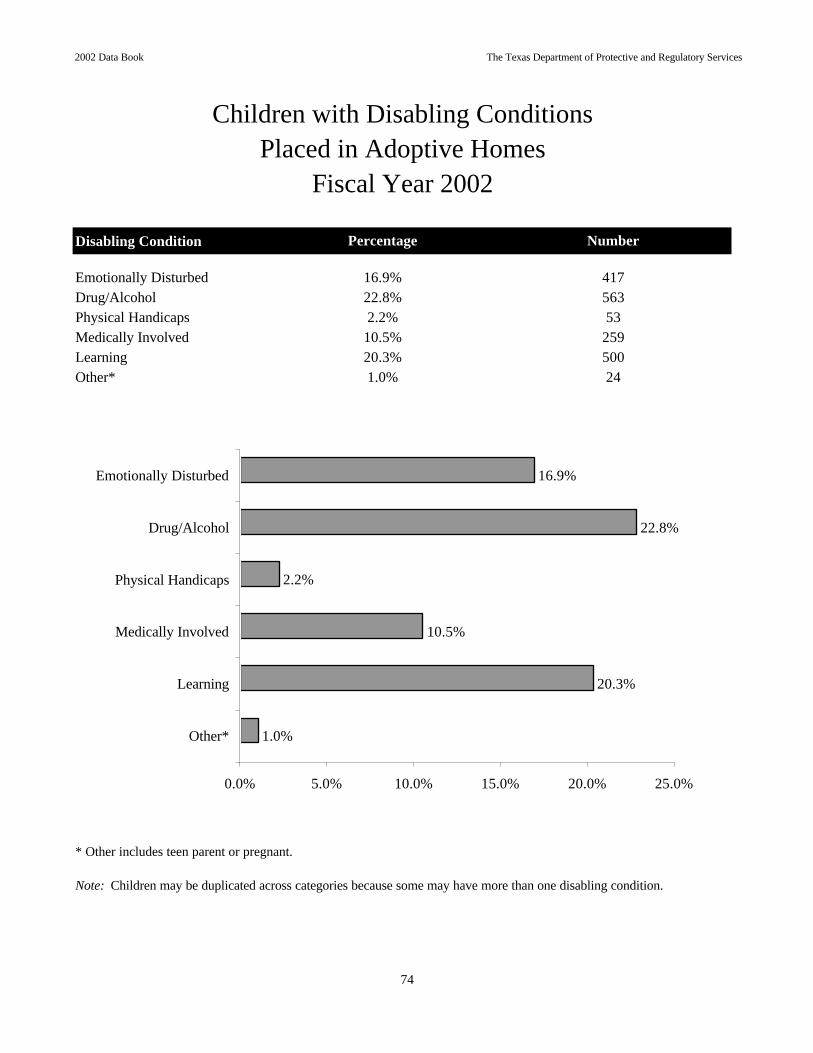
Disabling Condition
Emotionally DisturbedDrug/AlcoholPhysical HandicapsMedically InvolvedLearningOther*
* Other includes teen parent or pregnant.
Note: Children may be duplicated across categories because some may have more than one disabling condition.
25910.5%2.2%
56322.8%53
Children with Disabling ConditionsPlaced in Adoptive Homes
Fiscal Year 2002
16.9%
Percentage Number
417
20.3%1.0%
50024
1.0%
20.3%
10.5%
2.2%
22.8%
16.9%
0.0% 5.0% 10.0% 15.0% 20.0% 25.0%
Other*
Learning
Medically Involved
Physical Handicaps
Drug/Alcohol
Emotionally Disturbed
74

2002 Data Book The Texas Department of Protective and Regulatory Services
Fiscal Year 2002
Note: Subsidies include financial payments only, not medical and non-recurring subsidies.
Children in Consummated Adoptions by RegionFiscal Year 2002
Adoption Subsidy Per Month Average Number of Children Provided
9862
523
92 100
488
248
426
41 67103
0
100
200
300
400
500
600
Lubbock
(1)
Abilene
(2)
Arlingto
n (3)
Tyler (4
)
Beaumont
(5)
Houston
(6)
Austin (
7)
San Anto
nio (8)
Midland
(9)
El Paso
(10)
Edinbur
g (11)
510 388
3,597
544786
2,902
1,5832,004
230490
705
0
1,000
2,000
3,000
4,000
Lubbock
(1)
Abilene
(2)
Arlingto
n (3)
Tyler (4
)
Beaumont
(5)
Houston
(6)
Austin (
7)
San Anto
nio (8)
Midland
(9)
El Paso
(10)
Edinbur
g (11)
Total Consummated Adoptions: 2,248
75

2002 Data Book The Texas Department of Protective and Regulatory Services
Demographics of Children in Consummated AdoptionsFiscal Year 2002
Age
13 years and Over
6.5%
6 - 12 years
33.1%
1 - 5 years
57.5%
Under 1 year 3.0%
Ethnicity
Anglo32.6%
African American
30.8%
Hispanic 34.8%
Native American
0.2%Asian 0.2%
Other 1.4%
Sex
Male 51.1%
Female 48.9%
Total Consummated Adoptions: 2,248
76

2002 Data Book The Texas Department of Protective and Regulatory Services
Number % Number % Number % Number %
Race/ethnicity of parent(s) is same as child 1347 68.3% 1,253 63.4% 1,393 65.5% 1,347 65.1%
Race/ethnicity of one or both parents differs from child's (Transracial) 626 31.7% 722 36.6% 733 34.5% 721 34.9%
Total adoptions where race/ethnicity can be determined 1,973 100.0% 1,975 100.0% 2,126 100.0% 2,068 100.0%
Number % Number % Number % Number %
PRS 1,626 79.2% 1,590 77.1% 1,632 72.2% 1,513 67.3%
Private Agency 428 20.8% 473 22.9% 629 27.8% 735 32.7%
Total Consummations 2,054 100.0% 2,063 100.0% 2,261 100.0% 2,248 100.0%
2000 20011999 2002
Race/Ethnicity of Children and Adoptive Parentsby Fiscal Year
Adoption Consummations by Type of Agencyby Fiscal Year
2000 20011999 2002
77

2002 Data Book The Texas Department of Protective and Regulatory Services
CPS Outcomes Based on data from Fiscal Year 2002
Family Preservation Outcomes (measured from start of services to end of services)Average length of service 8.7 months
Family Reunification Outcomes(measured from first substitute care placement to placement in own home)Percent of children returned to own home 36.6 %Average number of placements per child 2.5Average length of service 9.8 monthsMedian length of service 7.8 months
Adoption Services Outcomes(measured from first substitute care placement to adoption consummation)Percent of children who left PRS legal responsibility with an adoption consummation 26.3 %Average number of placements per child 3.4Average length of service 28.8 months From Removal to Final Order 14.1 months From Final Order to Adoption Placement 11.3 months From Placement to Adoption Consummation 3.5 monthsMedian length of service 24.1 months
Permanent Relative Care Outcomes(measured from first substitute care placement to date PRS legal responsibility ended)Percent of children who left PRS legal responsibility to a relative placement 21.5 %Average number of placements 2.5Average length of service 12.9 monthsMedian length of service 11.3 months
78

2002 Data Book The Texas Department of Protective and Regulatory Services
Long-term Substitute Care Outcomes
Emancipation (includes children who left PRS legal responsibility by emancipation or turning 18)(measured from first substitute care placement to date PRS legal responsibility ended or date child turns 18 years of age)Percent of children who left PRS legal responsibility 10.1 %Average number of placements 8.8Average length of service 66 monthsMedian length of service 55.4 months
Other Long-term Substitute Care (measured from first substitute care placement to date PRS legal responsibility ended)Percent of children who left PRS legal responsibility 5.5 %Average number of placements 3.3Average length of service 12.6 monthsMedian length of service 5 months
Fiscal Year 2002 Recidivism Outcomes
For All Stages:(measured as a new confirmed reason to believe allegation within 12 months of the end of services or a return to substitute care or new Family Preservation services provided) 9.6 %For Family Preservation:
(measured as a new confirmed reason to believe allegation within 12 months of the end of Family Preservationservices or new Family Preservation services provided) 7.8 %For Family Reunification:(measured as a new confirmed reason to believe allegation or a return to substitute care within 12 months of the end of family reunification services) 14.4 %
79
2002 Data Book The Texas Department of Protective and Regulatory Services
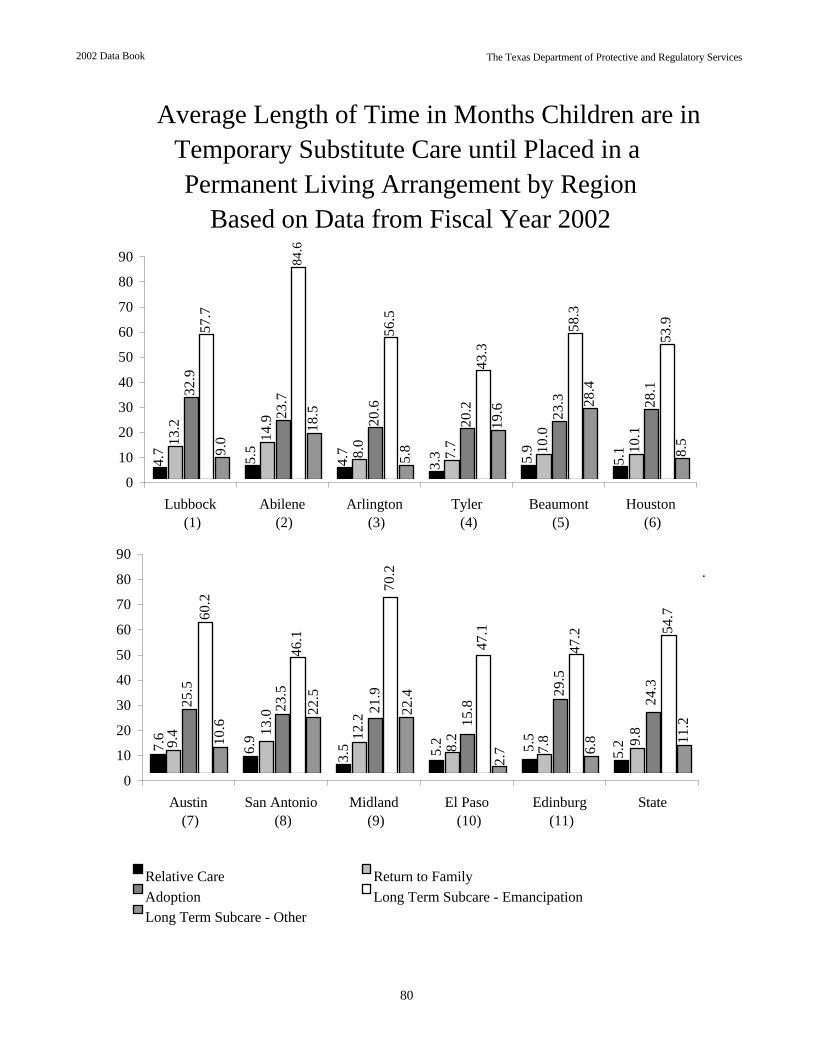
Average Length of Time in Months Children are in
Permanent Living Arrangement by Region Based on Data from Fiscal Year 2002
Temporary Substitute Care until Placed in a 4.
7 5.5
4.7
3.3 5.9
5.113
.2
14.9
8.0
7.7 10
.0
10.1
32.9
23.7
20.6
20.2 23
.3 28.1
57.7
56.5
43.3
58.3
53.9
9.0
18.5
5.8
19.6 28
.4
8.5
84.6
0
10
20
30
40
50
60
70
80
90
Lubbock (1)
Abilene (2)
Arlington (3)
Tyler (4)
Beaumont (5)
Houston (6)
5.25.26.97.6
5.5
3.5 9.
8
8.29.4 13
.0
7.812
.2
24.329
.5
15.821
.9
23.5
25.5
54.7
47.2
47.1
70.2
46.1
60.2
22.4
2.7 6.
8 11.2
22.5
10.6
0
10
20
30
40
50
60
70
80
90
Austin (7)
San Antonio (8)
Midland (9)
El Paso (10)
Edinburg (11)
State
Relative Care Return to FamilyAdoption Long Term Subcare - EmancipationLong Term Subcare - Other
80

2002 Data Book The Texas Department of Protective and Regulatory Services
* Children who left substitute care via an own home, permanent relative placement or adoption consummation and PRS legal responsibility was ended.
Length of Time in Care for Children Who Achieved Permanency Status*
During Fiscal Year 2002
62.3%
71.0%
64.5% 63.5% 62.6%
19.8%18.0% 18.1%
22.9% 23.1%
13.6%
17.50%
11.0%
17.9%
14.3%
0%
10%
20%
30%
40%
50%
60%
70%
80%
1998 1999 2000 2001 2002
0 to 12 months 13 to 24 months More than 24 months
81

2002 Data Book The Texas Department of Protective and Regulatory Services
Region Family Preservation
Family Reunification Adoption Relative Care
Long Term Subcare -
Emancipation
Long Term Subcare -
Other
Lubbock (1) 10.2 13.2 37.4 12.7 71.1 15.6Abilene (2) 6.1 14.9 30.4 12.7 101.4 21.8Arlington (3) 15.2 8.0 23.8 12.9 66.8 9.2Tyler (4) 7.4 7.7 27.5 9.3 54.6 24.2Beaumont (5) 6.9 10.0 28.8 11.9 72.3 31.2Houston (6) 8.1 10.1 33.0 14.3 68.7 10.9Austin (7) 8.5 9.4 30.6 14.0 67.3 9.2San Antonio (8) 6.9 13.0 26.5 15.0 59.5 19.9Midland (9) 6.7 12.2 32.6 12.7 69.8 15.8El Paso (10) 8.5 8.2 19.9 14.3 55.6 2.6Edinburg (11) 7.4 7.8 36.1 10.2 53.7 6.5
State 8.7 9.8 28.8 12.9 66.0 12.6
Average Length of Time in Months for Children Leaving PRS Responsibility by Type of Exit
Based on Data from Fiscal Year 2002
82
2002 Data Book The Texas Department of Protective and Regulatory Services
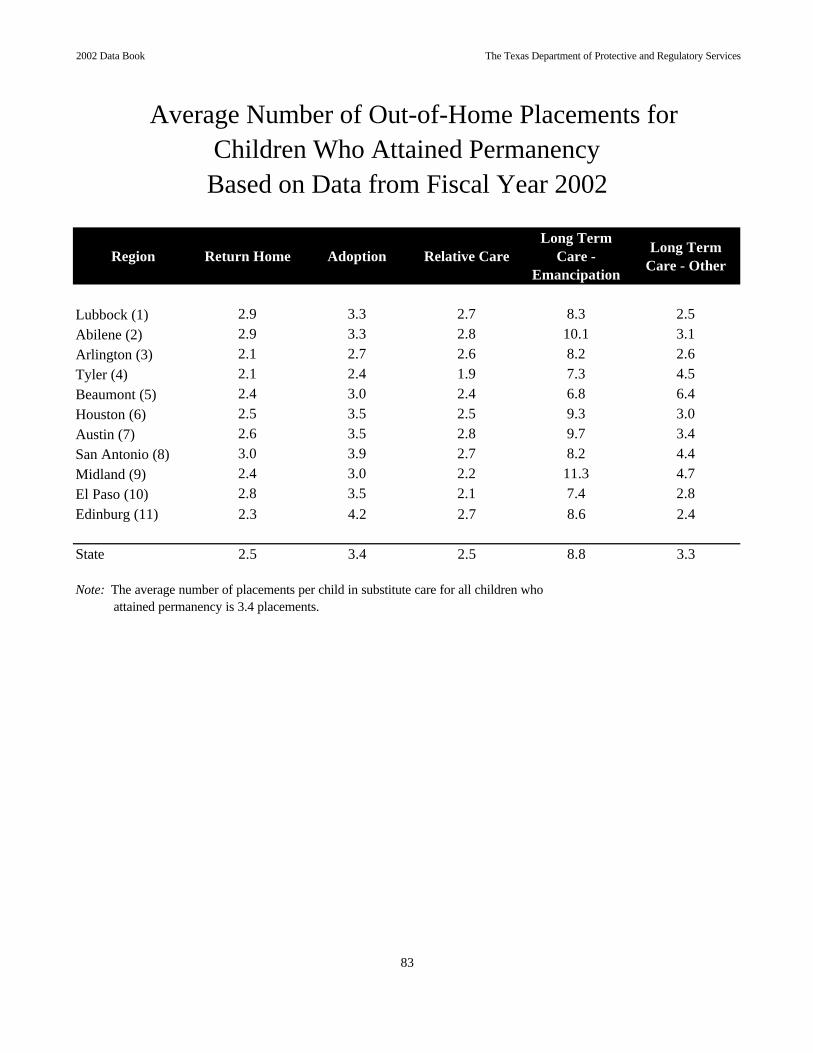
Region Return Home Adoption Relative CareLong Term
Care - Emancipation
Long Term Care - Other
Lubbock (1) 2.9 3.3 2.7 8.3 2.5Abilene (2) 2.9 3.3 2.8 10.1 3.1Arlington (3) 2.1 2.7 2.6 8.2 2.6Tyler (4) 2.1 2.4 1.9 7.3 4.5Beaumont (5) 2.4 3.0 2.4 6.8 6.4Houston (6) 2.5 3.5 2.5 9.3 3.0Austin (7) 2.6 3.5 2.8 9.7 3.4San Antonio (8) 3.0 3.9 2.7 8.2 4.4Midland (9) 2.4 3.0 2.2 11.3 4.7El Paso (10) 2.8 3.5 2.1 7.4 2.8Edinburg (11) 2.3 4.2 2.7 8.6 2.4
State 2.5 3.4 2.5 8.8 3.3
Note: The average number of placements per child in substitute care for all children who attained permanency is 3.4 placements.
Average Number of Out-of-Home Placements for Children Who Attained Permanency Based on Data from Fiscal Year 2002
83

2002 Data Book The Texas Department of Protective and Regulatory Services
9.7 months
7.5 months
45.8 months
33.3 months
Lubbock (1)Abilene (2)Arlington (3)Tyler (4)Beaumont (5)Houston (6)Austin (7)San Antonio (8)Midland (9)El Paso (10)Edinburg (11)
State
6.27.4
2.72.4
3.03.54.2
Region
3.02.3
2.02.42.52.7
7.3
3.33.32.72.43.03.53.5
3.4
3.9
2.5
7.48.76.36.46.66.88.57.8
10.0
Care ConsummatedTemporary Long-term Adoption
2.82.92.3
Care
Average Number of Placements for Children Who Left Substitute Care
Median length of service for children whose cases are still open in long-term substitute care.
Based on Data from Fiscal Year 2002
Substitute Care Outcomes for Cases Open
Average length of service for children whose cases are still open in temporary substitute care.
Median length of service for children whose cases are still open in temporary substitute care.
Average length of service for children whose cases are still open in long-term substitute care.
at End of Fiscal Year 2002
84

2002 Data Book The Texas Department of Protective and Regulatory Services
* 685 youth who were not served in FY 2002 received services prior to FY 2002.
Fiscal Year 2002
by Fiscal Year
Preparation for Adult Living (PAL) Services
Preparation for Adult Living (PAL) Services
Youth Ages 16 through 20
1,571 1,189 837 786 975
3,1104,297
2,310 2,822 3,684
5,272
4,4703,881 4,011 3,947
0
1,000
2,000
3,000
4,000
5,000
6,000
1998 1999 2000 2001 2002Not Served Served
The Preparation for Adult Living (PAL) program was implemented to ensure that older youth in substitute care are prepared for their departure from the Department of Protective and Regulatory Services’ care and support. The PAL program’s goal is to provide each youth with the skills and resources they will need to be a productive adult. The agency is required to provide PAL services to youth aged 16 and older who reside in PRS paid substitute care.
Not Served*975
Served4,297
85

2002 Data Book The Texas Department of Protective and Regulatory Services
Preparation for Adult Living (PAL) ServicesMovement of Youth in Fiscal Year 2002
4,395
1,696
1,477
4,614
0
500
1000
1500
2000
2500
3000
3500
4000
4500
5000
1Start of Year Entered During Exited During End of Year
86


