“Leftovers” on the way to Zero Waste? tle - Eco-Cycle · “Leftovers” on the way to Zero...
15
What is the best disposal option for the “Leftovers” on the way to Zero Waste? tle www.ecocycle.org/specialreports/leftovers By Dr. Jeffrey Morris Dr. Enzo Favoino Eric Lombardi Kate Bailey
Transcript of “Leftovers” on the way to Zero Waste? tle - Eco-Cycle · “Leftovers” on the way to Zero...

What is the best disposal option for the
“Leftovers” on the way to Zero Waste?
tle
www.ecocycle.org/specialreports/leftovers
By
Dr. Jeffrey Morris
Dr. Enzo Favoino
Eric Lombardi
Kate Bailey
What is the best disposal option for the “Leftovers” on the way to Zero Waste? | PAGE 2
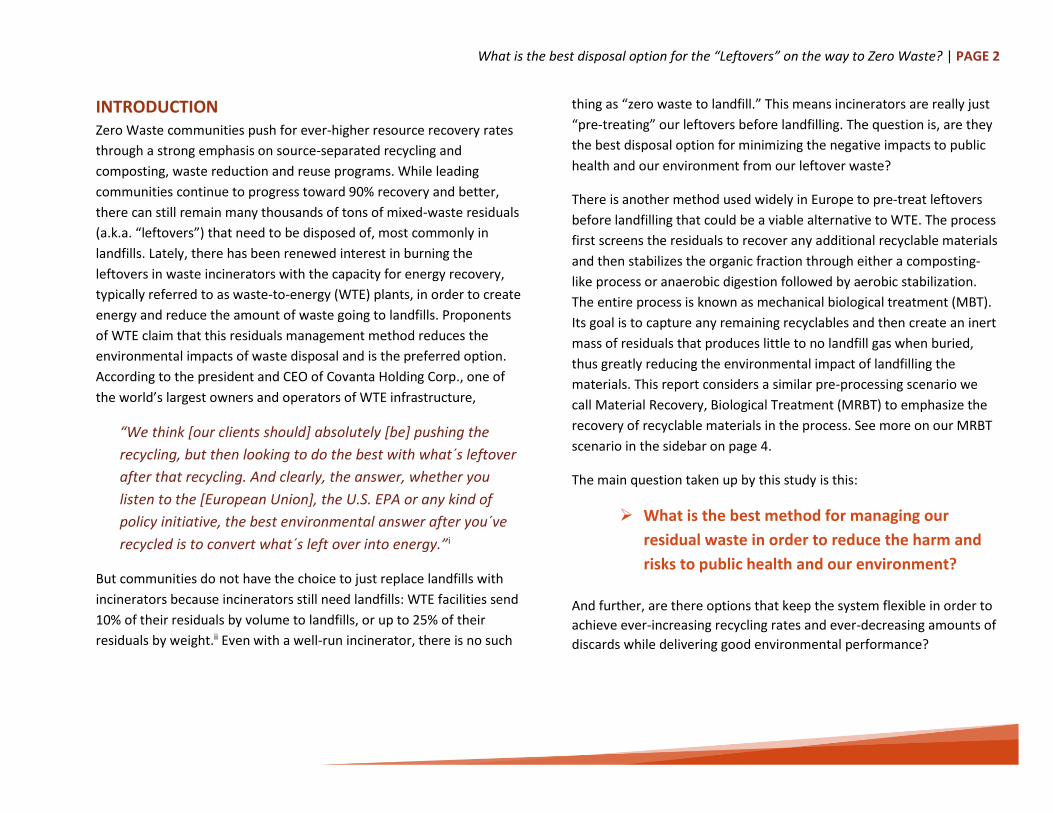
INTRODUCTION Zero Waste communities push for ever-higher resource recovery rates
through a strong emphasis on source-separated recycling and
composting, waste reduction and reuse programs. While leading
communities continue to progress toward 90% recovery and better,
there can still remain many thousands of tons of mixed-waste residuals
(a.k.a. “leftovers”) that need to be disposed of, most commonly in
landfills. Lately, there has been renewed interest in burning the
leftovers in waste incinerators with the capacity for energy recovery,
typically referred to as waste-to-energy (WTE) plants, in order to create
energy and reduce the amount of waste going to landfills. Proponents
of WTE claim that this residuals management method reduces the
environmental impacts of waste disposal and is the preferred option.
According to the president and CEO of Covanta Holding Corp., one of
the world’s largest owners and operators of WTE infrastructure,
“We think [our clients should] absolutely [be] pushing the
recycling, but then looking to do the best with what´s leftover
after that recycling. And clearly, the answer, whether you
listen to the [European Union], the U.S. EPA or any kind of
policy initiative, the best environmental answer after you´ve
recycled is to convert what´s left over into energy.”i
But communities do not have the choice to just replace landfills with
incinerators because incinerators still need landfills: WTE facilities send
10% of their residuals by volume to landfills, or up to 25% of their
residuals by weight.ii Even with a well-run incinerator, there is no such
thing as “zero waste to landfill.” This means incinerators are really just
“pre-treating” our leftovers before landfilling. The question is, are they
the best disposal option for minimizing the negative impacts to public
health and our environment from our leftover waste?
There is another method used widely in Europe to pre-treat leftovers
before landfilling that could be a viable alternative to WTE. The process
first screens the residuals to recover any additional recyclable materials
and then stabilizes the organic fraction through either a composting-
like process or anaerobic digestion followed by aerobic stabilization.
The entire process is known as mechanical biological treatment (MBT).
Its goal is to capture any remaining recyclables and then create an inert
mass of residuals that produces little to no landfill gas when buried,
thus greatly reducing the environmental impact of landfilling the
materials. This report considers a similar pre-processing scenario we
call Material Recovery, Biological Treatment (MRBT) to emphasize the
recovery of recyclable materials in the process. See more on our MRBT
scenario in the sidebar on page 4.
The main question taken up by this study is this:
What is the best method for managing our
residual waste in order to reduce the harm and
risks to public health and our environment?
And further, are there options that keep the system flexible in order to
achieve ever-increasing recycling rates and ever-decreasing amounts of
discards while delivering good environmental performance?

What is the best disposal option for the “Leftovers” on the way to Zero Waste? | PAGE 3
OUR APPROACH
To find the answer, we took the residual waste from a leading recycling
and composting community, Seattle, Washington, and ran it through
five different residual management scenarios based on the leading
technologies in the marketplace today (see figure at right):
1. Landfill with landfill-gas-to-energy (LFGTE) with two different
assumptions for gas collection efficiencies;
2. Waste-to-energy followed by landfilling (WTE-to-landfill) as
practiced by Covanta and others in the WTE industry;
3. Material Recovery, Biological Treatment followed by landfilling
(MRBT-to-landfill) with two different assumptions for recovery
of recyclables.
These technologies were chosen to represent commercial technologies
available on the market today in the U.S. and Europe. Conversion
technologies, such as pyrolysis, gasification and plasma arc, were not
considered since these technologies do not have commercial scale
facilities with real emissions data to model in this analysis.
We then used the Measuring Environmental Benefits Calculator
(MEBCalcTM), created by Dr. Jeffrey Morris, to assess each leftovers
management scenario across seven lifecycle environmental impacts:
climate change, acidification, eutrophication, respiratory diseases, non-
cancers, cancers, and ecotoxicity. These environmental impacts are
Direct to landfill
•LFGTE 80%: 80% of landfill gas captured and used for energy production
•LFGTE 40%: 40% of landfill gas captured and used for energy production
WTE to landfill
•WTE:mass burn incineration with energy recovery
MRBT to landfill
•MRBT Hi higher recovery of recyclables, no landfill gas capture
•MRBT Lo lower recovery of recyclables, no landfill gas capture

What is the best disposal option for the “Leftovers” on the way to Zero Waste? | PAGE 4
caused by the pollution emitted from the various waste
management activities used to handle discarded
products, packaging and other materials for recycling,
composting or disposal.
The composition of the residuals in our sample
community, Seattle, is an important element in this
analysis since most of the recyclables and compostables
were removed by source-separation efforts. Single-
family households in Seattle, Washington recovered 71%
of their discards in 2011, and Seattle has a detailed
analysis of the remaining 29% of its leftovers, which was
used as the basis for our study. (See Figure 4 on page 12
for more on what is leftover after recycling in Seattle.)
While Seattle’s high recycling rate makes it a national
leader, much of its remaining leftovers could have been
recycled or composted, leaving room for Seattle to
continue to expand its recovery efforts and push for
Zero Waste.
The study also assumed the energy generated from WTE
and LFGTE systems was used to offset energy that would
have been produced by natural gas as natural gas is the
predominant source of new electricity on the market
today in the U.S. Further assumptions about the
recovery rates of materials in the MRBT process and
other details from the analysis can be found at
www.ecocycle.org/specialreports/leftovers.
Material Recovery, Biological Treatment is a process to pre-treat leftover waste before
landfilling in order to recover additional materials for recycling and minimize the
impacts from landfilling. (See a schematic of the process on page 7.) MRBT can involve
different methods, but for this study we assumed the following steps:
Step 1: Source separation. After extensive source separation for recycling and
composting in the community, the remaining community leftovers are sent to an
MRBT facility.
Step 2: Material Recovery. The leftovers are sorted by machines and by hand to recover
and market additional recyclable materials, primarily mixed paper, PET and HDPE
plastics, metals and small appliances, and cardboard.
Step 3: Biological Treatment. The leftovers are then sent through a composting-like
system where the organic fraction biodegrades and reduces in total volume due to
moisture and carbon losses. The resulting stabilized output is often too dirty to market
as a soil amendment, so this study assumes the residual output is landfilled. However,
in some MRBT processes, the stabilized residuals may be used for restricted
applications, such as land reclamation of old mines and landfills or landscaping along
railways and highways, which increases the environmental benefits of using MRBT.
Step 4: Landfill. The remaining inert leftovers are then trucked to a landfill for burial.
Because the residuals have been stabilized and produce little to no landfill gas when
buried, we assumed the processed leftovers were buried in a landfill with no gas
capture system.
MRBT should not be confused with a mixed waste processing facility that relies upon
technology to separate recyclables from trash in place of asking residents and
businesses to source separate these materials first, such as was proposed recently in
Houston, Texas. MRBT can be a complement to source separation efforts to further
increase diversion rates and reduce the environmental impacts of a community's
leftovers, but it is not a replacement for source separation, which should be given
highest priority.
What is MRBT?

What is the best disposal option for the “Leftovers” on the way to Zero Waste? | PAGE 5
KEY FINDING The disposal option with the lowest overall environmental impact, as measured by monetized overall score, was MRBT-to-landfill. This held true
across both variations on the performance of an MRBT-to-landfill system, the high and low materials recovery rate scenarios for separating recyclables
from mixed waste. Our results are detailed in Figure 3 (page 8) and Table 1 (page 9).
Figure 1: The results showed MRBT-to-landfill had the lowest overall environmental and human health impacts.
-2.00
-1.00
0.00
1.00
2.00
3.00
MRBT HI MRBT LO LFGTE 80% LFGTE 40% WTE
-1.02
-0.50
-0.23
2.06
0.38
Monetized Overall Environmental Impact
The MRBT scenarios had the lowest environmental and health impacts
among all the disposal options.

What is the best disposal option for the “Leftovers” on the way to Zero Waste? | PAGE 6
OTHER KEY FINDINGS
1. All of the options studied to manage leftover waste resulted in
increased pollution in at least one of the seven public health and
environmental impact categories included in this study. This
reinforces the fact that waste disposal is not beneficial and should
be minimized, and priority should be given to waste reduction,
reuse and separate collections of recyclables and compostables.
2. The two MRBT-to-landfill scenarios had the lowest environmental
impacts across five of the seven public health and environmental
categories—acidification, eutrophication, respiratory diseases, non-
cancers and cancers. In terms of climate impacts, landfilling with
80% gas capture and electricity generation had lower climate
impacts than the MRBT-to-landfill scenario that assumed low
recovery rates for separating out recyclables. The direct-to-landfill
scenarios had lower ecotoxicity impacts than the MRBT-to-landfill
scenarios because of the benefits of using landfill gas to generate
electricity in place of electricity that would have come from natural
gas-fueled power plants. In the cases where anaerobic digestion is
used for biological stabilization in MRBT-to-landfill systems, the
energy production from anaerobic digestion may further (and
remarkably) improve the environmental performance of MRBT-to-
landfill compared with direct landfilling in terms of climate change
and ecotoxicity impacts.
3. MRBT-to-landfill, when utilized by a community with successful
recycling and composting programs, can help achieve very high
levels of resource recovery. The MRBT-to-landfill system modeled
for Seattle, WA helps achieve an 87% diversion rate for the
community—71% recovery from source-separated recycling and
composting, and another 16% diversion from MRBT, including the
recovery of additional recyclables from mechanically sorting the
leftovers and the moisture and carbon reduction from the aerobic
composting of the residuals. This remarkable recovery rate
demonstrates MRBT can move a community closer to Zero Waste
while still supporting source separation as the highest and best
priority.
4. The climate impacts of landfills depended highly upon the
effectiveness of the landfill gas capture system, with higher
capture rates leading to a lower climate impact and lower overall
environmental impact.
5. The combustion of waste for energy, either directly through WTE
plants or by burning the methane generated by organic materials
in the landfill, had higher relative human health impacts—
respiratory diseases, non-cancers, and cancers—than the non-
combustion MRBT-to-landfill scenarios. While these energy sources
displace the use of fossil fuels, they still emit pollution and
greenhouse gas emissions.

What is the best disposal option for the “Leftovers” on the way to Zero Waste? | PAGE 7
6. Communities should continue to focus on decreasing the
amount of leftovers they produce through recycling,
composting and waste reduction programs in order to achieve
the greatest environmental and public health benefits. While
MRBT-to-landfill is the best environmental option for disposing
of leftovers, it is no substitute for recycling and composting
programs that prevent the disposal of leftovers in the first
place. The environmental benefits of recycling and composting
were estimated at $120 per ton in Portland, Oregon using the
MEBCalc model used in this report.iii That means the
environmental benefits of recycling and composting are nearly
ten times greater than the best disposal option, reinforcing that
these programs should be the top priority for communities in
managing their discards.
Figure 2: Schematic of
an MRBT facility.
Graphic courtesy of Urbaser Ltd.

What is the best disposal option for the “Leftovers” on the way to Zero Waste? | PAGE 8
Figure 3: Standardized Environmental Impact Scores for the Five Management Options
for Leftover Waste Remaining after 70% Recycling
Bar lengths in Figure 3 represent the number of standard deviations above or below the average impact. For example, the potential climate impact for
MRBT Hi is 0.9 standard deviations below the average climate impact for all five disposal options, while direct disposal of mixed waste in a landfill with
just 40% capture of landfill gas is 2.3 standard deviations above the average climate impact for the five management options.
-3.00
0.00
3.00
ClimateChange
Acidification Eutrophication RespiratoryDiseases
Non-Cancers Cancers Ecotoxicity MonetizedOverall Score
Nu
mb
er o
f St
d. D
ev.
Ab
ove
/(B
elo
w) M
ean
MRBT Hi
MRBT Lo
LFGTE 80%
LFGTE 40%
WTE

What is the best disposal option for the “Leftovers” on the way to Zero Waste? | PAGE 9
Table 1: Environmental Impacts for the Five Management Options for Leftover Waste Remaining after 70% Recycling
Impact Category
Increase/Decrease in Environmental Impact Potential (measured in pounds of each impact category's indicator pollutant per incoming ton)
Monetized Impact ($/Ton of
Emissions)
MRBT Hi MRBT Lo LFGTE 80% LFGTE 40% WTE
Climate Change (eCO2) -3.90E+02 -1.50E+02 -3.60E+02 1.10E+03 1.30E+02 $40
Acidification (eSO2) -2.50E+00 -1.40E+00 2.80E+00 1.50E+00 -3.40E-02 $290
Eutrophication (eN) -1.80E+00 -1.30E+00 1.30E-01 1.20E-01 -1.10E-02 $4
Respiratory (ePM2.5) -7.00E-01 -4.90E-01 2.70E-02 1.50E-02 -2.80E-02 $10,000
Non-cancer (eT) -5.20E+01 -4.10E+01 -1.20E+01 1.20E+00 9.70E+01 $30
Cancer (eB) -3.20E-01 -1.50E-01 2.30E+00 1.20E+00 1.70E-01 $3,030
Ecotoxicity (e2,4-D) 1.00E-03 1.60E-03 3.60E-04 2.30E-04 5.10E-03 $3,280
MONETIZED OVERALL SCORE - $13 - $7 - $3 + $25 + $4
Table 1 compares the actual environmental impacts of each leftovers management strategy and then expresses the total environmental impact
as an economic cost in the bottom row through a technique called monetization.

What is the best disposal option for the “Leftovers” on the way to Zero Waste? | PAGE 10
EXPLANATION OF RESULTS Figure 3 on page 8 summarizes the relative impacts of each leftovers
management approach as they compare to each other. Any impact
above the midline is “relatively worse” when compared to the other
options. Likewise, impacts below the midline are relatively better in
terms of lower environmental impact. For example, looking at the
category for “Acidification,” the results show that burying waste
directly in landfills causes more acidification than pre-processing
leftovers through MRBT or WTE.
It can be difficult to objectively assess if it is more important to reduce
greenhouse gas emissions, cancer risks or water pollution because the
answer varies by individual and community, and depends upon a value-
based judgment and personal beliefs. Economists use a technique
called monetization to apply a dollar value to environmental impacts in
order to provide a more objective comparison across different impacts.
According to Dr. Morris,
“Monetization provides a method for evaluating trade-offs between
the different types of environmental impacts and is a standard
approach within the field of environmental economics. One
difficulty is that monetization is controversial, especially regarding
the issue of placing a dollar value on human and non-human lives.
The benefit of monetization is that it summarizes and aggregates
the environmental impacts into a single indicator for each
management option.”
The monetized score in Table 1 translates the seven environmental
impacts of the five disposal methods studied into economic benefits or
costs. The MRBT-to-landfill scenarios have a negative score, which
means there is a net environmental benefit to managing leftovers with
MRBT and the economic value of that benefit is between $7 and $13
per ton of MSW leftovers for a community that recycles and composts
most of its discards.
This should not be interpreted to mean producing waste is a good thing
for the environment. Rather, the results show that the overall
environmental pollution reductions and energy savings gained by
recovering and marketing the additional recyclable materials through
MRBT, and using these recycled materials to replace virgin materials for
manufacturing new products, more than offset the negative
environmental impacts that occur from landfilling residuals after MRBT.
WTE, by contrast, has a positive monetized score, which means it
results in a net environmental cost. Even though WTE facilities create
some environmental benefit because the energy they produce replaces
electricity generated by natural gas fueled power plants, the overall
detrimental impacts of WTE are greater than the benefits from energy
production. The result is an overall environmental harm to the
Curbside composting programs in cities such as Portland, OR (above)
and Seattle, WA are helping households recover 70% of their discards
while targeting even higher recovery rates.

What is the best disposal option for the “Leftovers” on the way to Zero Waste? | PAGE 12 11
community. This environmental cost is valued at $4 per ton for a
community that recycles and composts most of its discards. These
negative or positive monetized overall scores can also be considered
the environmental externality associated with each technology.
It is counter-intuitive to think that any type of waste disposal has a net
environmental “benefit” because it implies that producing waste could
be good for the environment. This is not true—producing, consuming
and throwing away materials causes harm to our environment. This
study only looks at the environmental impacts of waste disposal and
not the upstream impacts of creating the products and packaging that
end up as leftovers. When the entire cycle of resource extraction,
manufacturing and product consumption are also taken into account,
there is quite a substantial net cost to our environment from producing
and consuming products and packaging.
IMPLICATIONS
Source-separated recycling and composting programs, paired with
waste reduction and reuse campaigns, remain the best strategy for
managing discarded materials. While leading U.S. communities such as
Seattle are pushing 70% recycling rates, there are still more gains to be
made along the road to Zero Waste. This report does not pit source
separation against MRBT, but rather compares MRBT with other
disposal technologies—WTE and landfilling.
While recovery programs should remain the focus, communities are
continuously evaluating their disposal infrastructure and capacity, and
the impacts of their leftovers. When doing so, it is paramount for the
community to keep in mind how its discards stream will change as
recovery rates increase. By looking ahead and considering the best
options for managing its leftovers in the present and the future, a
MRBT-to-landfill is not a replacement or substitution for
source-separated recycling and composting, but it is a
valuable tool for helping communities reduce the
environmental impacts from the disposal of their leftovers
on the way to Zero Waste.

What is the best disposal option for the “Leftovers” on the way to Zero Waste? | PAGE 12
community can find the technology that best fits its goals of increasing
recovery, decreasing disposal and reducing environmental risks. The
goal is to avoid investing in disposal technologies that are not
compatible with a decreasing amount of leftovers or lead to more
pollution and detrimental environmental and public health impacts.
In the U.S. today, communities debating future infrastructure
investments to dispose of their leftovers are rarely considering the best
environmental option—MRBT-to-landfill. This study proves this landfill
pre-processing system is environmentally preferable to both WTE
facilities and direct landfilling because it recovers the greatest amount
of additional recyclables, stabilizes the organic fraction of the residuals,
reduces the amount of material to be disposed of in a landfill, and
minimizes the negative environmental and public health impacts of
landfilling leftovers compared to the available alternatives. MRBT-to-
landfill is still not preferable to recovering materials through recycling
and composting programs, but it is the best environmental option for
disposal in the interim while recovery efforts and rates improve.
FLEXIBILITY FOR THE FUTURE
The MRBT-to-landfill system provides other important benefits for the
community that are harder to quantify. Foremost is the flexibility and
dual-purpose of the technology, which allows for the processing of
clean or dirty material streams as a community’s needs change. For
example, as a community diverts more and more of its discards, getting
closer to Zero Waste, the biological stabilization component of an
MRBT facility can shift to receiving and processing source-separated
organics (SSO) and producing valuable soil amendments. By contrast,
WTE-to-landfill systems are designed and built for a never-decreasing
Material Percentage of leftovers
Food 28.8%
Animal byproducts 12.8%
Disposable diapers 9.9%
Compostable/soiled paper 7.3%
Mixed low-grade paper 4.9%
Other plastic film 4.4%
Textiles/clothing 3.2%
Mixed/other paper 1.4%
Durable plastic products 1.3%
Mixed textiles 1.2%
Total of Leftovers 75.1%
Figure 4: Top ten materials in household leftovers in Seattle,
WA after recycling and composting. Find the full study at
http://www.seattle.gov/util/Documents/Reports/SolidWast
eReports/CompositionStudies/index.htm.
What’s in the leftovers?

What is the best disposal option for the “Leftovers” on the way to Zero Waste? | PAGE 12 13
annual amount of leftovers, often negotiated through a “put or pay”
contract where the community is liable to fuel the plant for 20-30
years. As communities recover more resources and generate fewer
leftovers, WTE facilities must find alternative waste to fuel the burner,
putting the WTE system in direct competition with higher recovery
rates. WTE facilities cannot be a bridge to a Zero Waste future when
their economic and operational model is dependent upon a constant
source of leftover waste. On the other hand, MRBT systems can shift
processing capacities to source-separated feedstocks and will not suffer
financially as a community keeps going all the way to 90% diversion or
higher.
MRBT facilities require a markedly shorter time to be designed, built
and put into operation than new WTE or landfill facilities, which
translates into a faster reduction in the negative environmental impacts
of waste disposal and the volume of waste headed to landfills, which
could quickly extend the life of existing landfills. MRBT is also scalable
and can be designed to serve much smaller waste management districts
than conventional mass-burn WTE facilities. This allows a community to
treat and manage its leftovers locally, helping the community be more
self-reliant and best fulfilling the proximity principle.
Finally, MRBT facilities can facilitate further materials recovery in the
future if paired with a research component to understand the
composition of the remaining dry residuals and evaluate strategies to
target additional recovery of these items. For example, the mechanical
sorting system may also pull many non-recyclable dry items from the
mixed waste and use this as a starting point to work with industry to
redesign their packaging and products so that they can be recovered
instead of disposed. Once items like this are sorted and clearly
identified, the manufacturers can be incentivized (or penalized) in
accordance with a community’s goals.
ECONOMIC ANALYSIS
While this study does not compare the economic impacts of managing
leftovers across these three leading disposal technologies, we believe
MRBT-to-landfill does hold a significant economic advantage over WTE,
and this could be the focus of a future study. The MRBT option is a
much less expensive system to build than WTE, and it can be more
quickly implemented in order to reduce the amount of waste headed to
landfills and reduce the associated negative impacts. It also offers a
flexible processing approach that can be repurposed to handle
increasing levels of source-separated organics and recyclables as the
amount of mixed waste decreases. The lower upfront facility costs and
process flexibility from MRBT are significant positives considering that
the amount of mixed waste residuals needing disposal will be a moving
target over time as communities steadily increase their
recycling/composting rates and decrease their total waste amounts.
Experience from the European Union with similar MBT facilities
supports all of the evidence in favor of MRBT-to-landfill identified
above:
MBT is inherently more flexible than incineration
There is less public opposition to these technologies than to
larger, less flexible technologies, like incineration, so it is
generally far quicker to achieve planning and environmental
permitting.
It is quicker to build and start operating facilities.
MBT is cheaper to build and operate facilities.iv

What is the best disposal option for the “Leftovers” on the way to Zero Waste? | PAGE 14
CONCLUSIONS WTE facilities are not the best environmental option for managing
leftover waste and they are not a bridge to a Zero Waste future, as
claimed by the WTE industry. After maximizing their source-separated
recycling and composting efforts, communities looking to minimize the
environmental impacts of their remaining waste should pursue an
MRBT-to-landfill system because it recovers the greatest amount of
additional recyclables, stabilizes the organic fraction of the residuals,
reduces the amount of material to be disposed of in a landfill, and
minimizes the negative environmental and public health impacts of
landfilling leftovers compared to the available alternative technologies.
This study shows that it is reasonable to conclude that the MRBT option
is not only the best environmental practice for disposing of residuals,
but it is also the best community strategic option as well. MRBT is not a
replacement or substitution for source-separated recycling and
composting, but it is a valuable tool for helping communities reduce the
environmental impacts from the disposal of their leftovers on the way
to Zero Waste.
ABOUT THE AUTHORS Dr. Jeffrey Morris is an economist and lifecycle assessment expert with
Sound Resource Management Group based in Olympia, Washington.
Dr. Enzo Favoino is a Senior Researcher at Scuola Agraria del Parco di
Monza in Milan, Italy. Eric Lombardi is the Executive Director of Eco-
Cycle, a Zero Waste social enterprise based in Boulder, Colorado. Kate
Bailey is the Senior Analyst for Eco-Cycle. We all work professionally on
the environmental impacts of different waste management approaches
and strategies intended to maximize materials recovery.
Read more about MEBCalcTM and lifecycle analysis, learn about our assumptions around capture
and efficiency rates, and more at www.ecocycle.org/specialreports/leftovers.

What is the best disposal option for the “Leftovers” on the way to Zero Waste? | PAGE 15
REFERENCES
i Waste & Recycling News, 2012. “Covanta CEO weighs in on less waste, e-waste.” April 16, 2012. Available at http://www.wasterecyclingnews.com/article/20120416/NEWS99/304169980/covanta-ceo-weighs-in-on-less-waste-e-waste. Accessed on March 11, 2013. ii Energy Recovery Council, 2011. “FAQ Page: Is the Ash from Waste-to-Energy Plants Safe?” Available at http://www.energyrecoverycouncil.org/faq#ash. Accessed on September 19, 2011. EPA, 2010. Municipal Solid Waste in the United States: 2009 Facts and Figures. Available at http://www.epa.gov/osw/nonhaz/municipal/msw99.htm. iii Morris, Jeffrey, 2009. “The Environmental Value of Metro Region Recycling for 2007.” Available at http://www.zerowaste.com/docs/Environmental%20Value%20of%202007%20Metro%20Recycling%20-%20final.pdf. iv Friends of the Earth, 2008. Briefing: Mechanical and Biological Treatment. Available at http://www.foe.co.uk/resource/briefings/mchnical_biolo_treatmnt.pdf. Accessed on March 11, 2013.