Lee, C.M., Mudaliar, M.A.V., Haggart, D.R., Wolf, C.R ...eprints.gla.ac.uk/75131/1/75131.pdf ·...
22
Lee, C.M., Mudaliar, M.A.V., Haggart, D.R., Wolf, C.R., Miele, G., Vass, J.K., Higham, D.J., and Crowther, D. (2012) Simultaneous non-negative matrix factorization for multiple large scale gene expression datasets in toxicology. PLoS ONE, 7 (12). e48238. ISSN 1932-6203 Copyright © 2012 The Authors http://eprints.gla.ac.uk/75131 Deposited on: 13 February 2013 Enlighten – Research publications by members of the University of Glasgow http://eprints.gla.ac.uk
Transcript of Lee, C.M., Mudaliar, M.A.V., Haggart, D.R., Wolf, C.R ...eprints.gla.ac.uk/75131/1/75131.pdf ·...

Lee, C.M., Mudaliar, M.A.V., Haggart, D.R., Wolf, C.R., Miele, G., Vass, J.K., Higham, D.J., and Crowther, D. (2012) Simultaneous non-negative matrix factorization for multiple large scale gene expression datasets in toxicology. PLoS ONE, 7 (12). e48238. ISSN 1932-6203
Copyright © 2012 The Authors http://eprints.gla.ac.uk/75131 Deposited on: 13 February 2013
Enlighten – Research publications by members of the University of Glasgow http://eprints.gla.ac.uk

Simultaneous Non-Negative Matrix Factorization forMultiple Large Scale Gene Expression Datasets inToxicologyClare M. Lee1, Manikhandan A. V. Mudaliar2, D. R. Haggart5, C. Roland Wolf3,4, Gino Miele5, J. Keith Vass1,
Desmond J. Higham1*, Daniel Crowther6
1 Department of Mathematics and Statistics, University of Strathclyde, Glasgow, United Kingdom, 2 College of Medical, Veterinary and Life Sciences, University of Glasgow,
Glasgow, United Kingdom, 3 University of Dundee Medical Research Institute, Ninewells Hospital & Medical School, Dundee, United Kingdom, 4 CXR Biosciences Ltd,
Dundee, United Kingdom, 5 Epsistem Ltd., Manchester, United Kingdom, 6 Sanofi, Frankfurt am Main, Germany
Abstract
Non-negative matrix factorization is a useful tool for reducing the dimension of large datasets. This work considerssimultaneous non-negative matrix factorization of multiple sources of data. In particular, we perform the first study thatinvolves more than two datasets. We discuss the algorithmic issues required to convert the approach into a practicalcomputational tool and apply the technique to new gene expression data quantifying the molecular changes in four tissuetypes due to different dosages of an experimental panPPAR agonist in mouse. This study is of interest in toxicology because,whilst PPARs form potential therapeutic targets for diabetes, it is known that they can induce serious side-effects. Ourresults show that the practical simultaneous non-negative matrix factorization developed here can add value to the dataanalysis. In particular, we find that factorizing the data as a single object allows us to distinguish between the four tissuetypes, but does not correctly reproduce the known dosage level groups. Applying our new approach, which treats the fourtissue types as providing distinct, but related, datasets, we find that the dosage level groups are respected. The newalgorithm then provides separate gene list orderings that can be studied for each tissue type, and compared with theordering arising from the single factorization. We find that many of our conclusions can be corroborated with knownbiological behaviour, and others offer new insights into the toxicological effects. Overall, the algorithm shows promise forearly detection of toxicity in the drug discovery process.
Citation: Lee CM, Mudaliar MAV, Haggart DR, Wolf CR, Miele G, et al. (2012) Simultaneous Non-Negative Matrix Factorization for Multiple Large Scale GeneExpression Datasets in Toxicology. PLoS ONE 7(12): e48238. doi:10.1371/journal.pone.0048238
Editor: Ramin Homayouni, University of Memphis, United States of America
Received February 14, 2012; Accepted September 25, 2012; Published December 14, 2012
Copyright: � 2012 Lee et al. This is an open-access article distributed under the terms of the Creative Commons Attribution License, which permits unrestricteduse, distribution, and reproduction in any medium, provided the original author and source are credited.
Funding: This work was supported by the Translational Medicine Research Collaboration—a consortium made up of the Universities of Aberdeen, Dundee,Edinburgh and Glasgow, the four associated NHS Health Boards (Grampian, Tayside, Lothian and Greater Glasgow & Clyde), Scottish Enterprise and Pfizer, byEPSRC Grant EP/E49370/1, by the Knowledge Transfer Account of the University of Strathclyde and by the 2007 DTI grant ‘‘New serum Biomarkers for Preclinicaland Clinical Drug Safety Assessment’’. CML and DJH were supported by the Engineering and Physical Sciences Research Council of the UK, under theirFundamentals of Complexity Science call. DJH was funded by a Fellowship from the Leverhulme Trust. The funders had no role in study design, data collectionand analysis, decision to publish, or preparation of the manuscript.
Competing Interests: DC was employed by Pfizer and legacy company Wyeth during the course of this work and is now employed by Sanofi. GM wasemployed by Pfizer and legacy company Wyeth during the course of this work and is now employed by Epistem. CRW is employed by CXR. Pfizer agreed to thepublication of this manuscript. MM, DRH and JKV were funded through the TMRC. This does not alter the authors’ adherence to all the PLOS ONE policies onsharing data and materials.
* E-mail: [email protected]
Introduction
The aim of this work is to highlight the usefulness of a recently
proposed extension to the technique of non-negative matrix
factorization (NMF) by demonstrating its promise for early
detection of toxicity in the drug discovery process. In particular,
we (a) show that any number of related datasets can be treated
simultaneously with this approach, (b) deal with practical issues
that arise when the algorithm is applied to real datasets, (c)
demonstrate its use with a new large scale microrray dataset, and
(d) interpret the results from a biological perspective.
Computational BackgroundNMF seeks to represent a large complex dataset in terms of
smaller factors. The name covers many algorithms. Each
approximates a non-negative matrix as the product of two or
more smaller non-negative matrices, by attempting to minimise
some objective function. Lee and Seung [1] showed that when
applying multiplicative non-negative factorization to images of
faces, each row/column pair of the factors expresses a recognisable
facial feature. These techniques have since been used in many
settings to learn parts of the data as well as to factorize and cluster
datasets. For example, when applied to text data in [1] the
algorithm can differentiate multiple meanings of the same word by
context. On microarray data, NMF has been used to find patterns
in genes or samples, typically bi-clustering both groups in a similar
manner to two-way hierachical clustering [2–7]. The review article
[8] shows how NMF has also been successful in other areas of
computational biology, including molecular pattern discovery,
class comparison and biomedical informatics. The new challenge
that we address in this work is to apply the NMF methodology to
multiple, related, large scale, data sets simultaneously. We use the
PLOS ONE | www.plosone.org 1 December 2012 | Volume 7 | Issue 12 | e48238
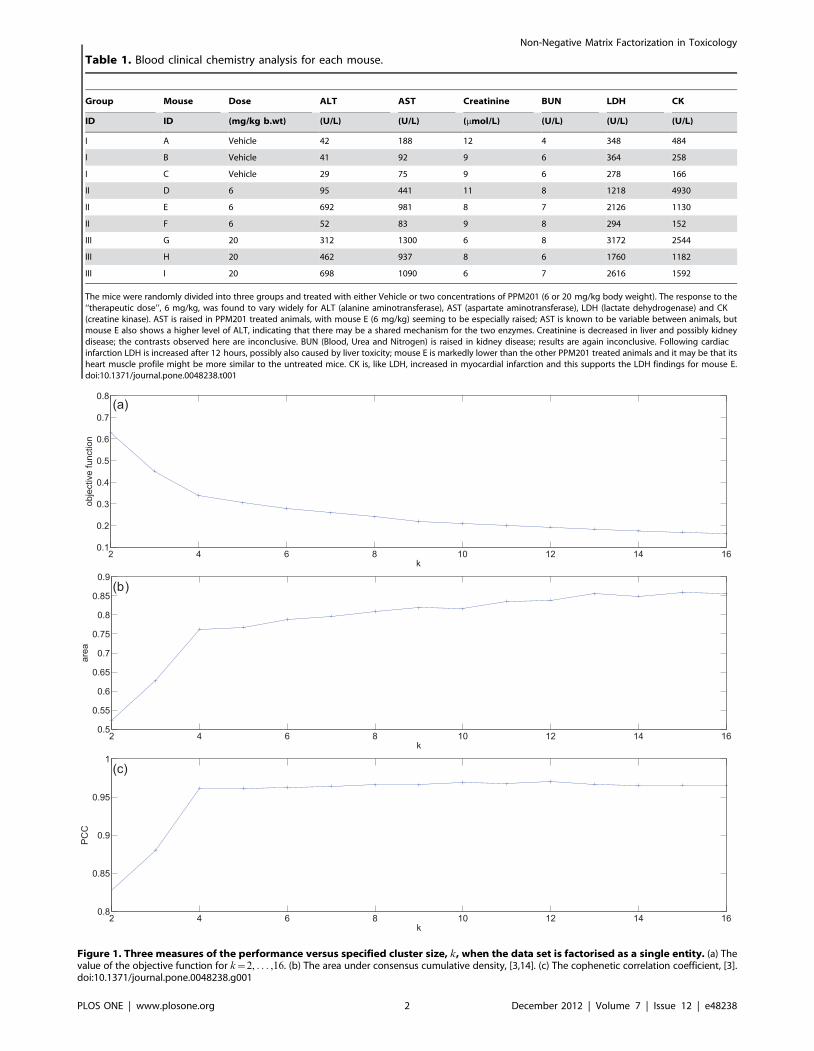
Figure 1. Three measures of the performance versus specified cluster size, k, when the data set is factorised as a single entity. (a) Thevalue of the objective function for k~2, . . . ,16. (b) The area under consensus cumulative density, [3,14]. (c) The cophenetic correlation coefficient, [3].doi:10.1371/journal.pone.0048238.g001
Table 1. Blood clinical chemistry analysis for each mouse.
Group Mouse Dose ALT AST Creatinine BUN LDH CK
ID ID (mg/kg b.wt) (U/L) (U/L) (mmol/L) (U/L) (U/L) (U/L)
I A Vehicle 42 188 12 4 348 484
I B Vehicle 41 92 9 6 364 258
I C Vehicle 29 75 9 6 278 166
II D 6 95 441 11 8 1218 4930
II E 6 692 981 8 7 2126 1130
II F 6 52 83 9 8 294 152
III G 20 312 1300 6 8 3172 2544
III H 20 462 937 8 6 1760 1182
III I 20 698 1090 6 7 2616 1592
The mice were randomly divided into three groups and treated with either Vehicle or two concentrations of PPM201 (6 or 20 mg/kg body weight). The response to the‘‘therapeutic dose’’, 6 mg/kg, was found to vary widely for ALT (alanine aminotransferase), AST (aspartate aminotransferase), LDH (lactate dehydrogenase) and CK(creatine kinase). AST is raised in PPM201 treated animals, with mouse E (6 mg/kg) seeming to be especially raised; AST is known to be variable between animals, butmouse E also shows a higher level of ALT, indicating that there may be a shared mechanism for the two enzymes. Creatinine is decreased in liver and possibly kidneydisease; the contrasts observed here are inconclusive. BUN (Blood, Urea and Nitrogen) is raised in kidney disease; results are again inconclusive. Following cardiacinfarction LDH is increased after 12 hours, possibly also caused by liver toxicity; mouse E is markedly lower than the other PPM201 treated animals and it may be that itsheart muscle profile might be more similar to the untreated mice. CK is, like LDH, increased in myocardial infarction and this supports the LDH findings for mouse E.doi:10.1371/journal.pone.0048238.t001
Non-Negative Matrix Factorization in Toxicology
PLOS ONE | www.plosone.org 2 December 2012 | Volume 7 | Issue 12 | e48238
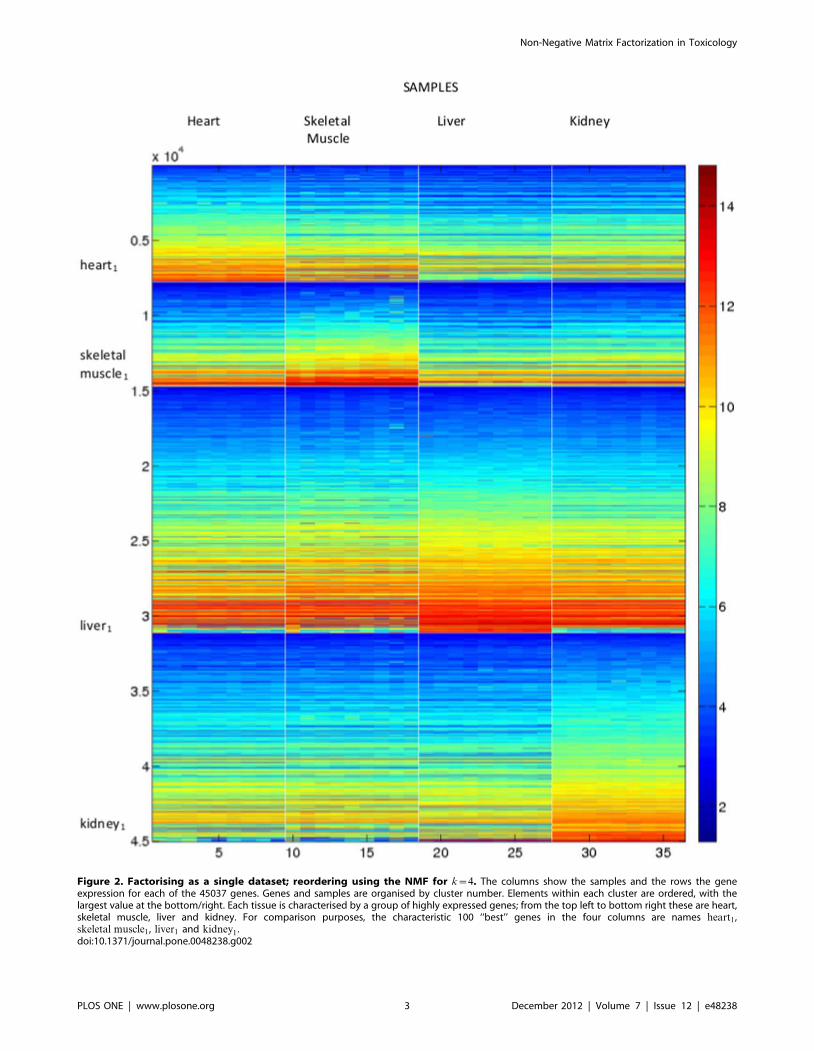
Figure 2. Factorising as a single dataset; reordering using the NMF for k~4. The columns show the samples and the rows the geneexpression for each of the 45037 genes. Genes and samples are organised by cluster number. Elements within each cluster are ordered, with thelargest value at the bottom/right. Each tissue is characterised by a group of highly expressed genes; from the top left to bottom right these are heart,skeletal muscle, liver and kidney. For comparison purposes, the characteristic 100 ‘‘best’’ genes in the four columns are names heart1,skeletal muscle1, liver1 and kidney1 .doi:10.1371/journal.pone.0048238.g002
Non-Negative Matrix Factorization in Toxicology
PLOS ONE | www.plosone.org 3 December 2012 | Volume 7 | Issue 12 | e48238

work of Badea [9,10], who considered an extension of NMF that
deals with two data matrices. Simultaneous NMF is used in [9]
to study pancreatic cancer microarray data alongside extra
information concerning transcription regulatory factors. In [10]
microarray datasets for pancreatic ductal adenocarcinoma and
sporadic colon adenocarcinoma are sumiltaneously factorized in
order to discover expression patterns common to both data sets.
This simultaneous NMF approach readily extends to the case of
an arbitrary number of data matrices and here, for what we
believe to be the first time, we implement and evaluate the
method on more than two. We also consider various practical
issues that must be tackled in order to produce a useful
computational tool. To minimize the number of algorithmic
parameters, make the results straightforward to interpret, and
exploit the natural sparsity in the algorithm [9, section 3],
we focus on hard clustering. The interesting issue of
allowing clusters to overlap in this context is therefore left as
future work.
Biological BackgroundWe analyse gene expression data describing the molecular
changes in four tissue types due to different dosages of an
experimental pan-peroxisome proliferator-activated receptor (pan-
PPAR) agonist PPM-201, provided by Plexxikon. PPARs have
attracted great interest as potential therapeutic targets for diabetes
[11], but major concerns have arisen due to clinically observed
side-effects [12]. Hence, there are compelling reasons for
toxicological studies at the gene expression level.
The material is organised as follows. In Section we describe the
simultaneous NMF algorithm and outline our approach for using
the output to order and cluster a dataset. Section describes the
mouse microarray data, and the NMF results that arise when we
treat it as a single dataset are given in Section . This is followed in
Section by the analysis of the data split into four datasets
corresponding to the known tissue types; liver, kidney, heart and
skeletal muscle. In Section we compare the gene clusters from
Sections and , and Section discusses the results. Conclusions are
given in Section .
Methods
AlgorithmsGiven d non-negative data matrices A(i) of size m(i)|n for
i~1, . . . ,d, our aim is to simultaneously factorize all matrices so
that
A(i)&W (i)H
with the additional constraints that W (i) is a non-negative matrix
of size m(i)|k for i~1, . . . ,d , and H is a non-negative matrix of
size k|n. Generalising naturally from the d~2 case in [9], we
seek to minimise the objective function
f (A(i),W (i),H)~Xd
i~1
b(i)EA(i){W (i)HE2 ð1Þ
where b(i)~ EA(1)EEA(i)E. Here E:E denotes the Frobenius norm. As in
[9] the b coefficients are designed to give equal weight to the
different error terms. Based on the multiplicative update rules
developed in [13], an iterative algorithm that attempts to solve the
optimisation problem can be derived using a gradient descent
method dz1 times. This gives us the following sequence of
approximations for j~1,2, . . ., given initial choices W (i)½0� and
H ½0�,
W (i)½jz1�~W (i)jzg½j�W (i) � A(i)H ½j�T{W (i)½j�H ½j�H ½j�T
� �
H ½jz1�~H ½j�zg½j�H �
Xd
i~1
b(i) W (i)½j�TA(i){W (i)½j�TW (i)½j�H ½j�� � !
Table 2. Ordering of the tissue samples after singlefactorization of rank 4 of the entire dataset.
Cluster Tissue type Mouse Dosage
1 Heart D 6 mg/kg
1 Heart B Vehicle
1 Heart C Vehicle
1 Heart I 20 mg/kg
1 Heart H 20 mg/kg
1 Heart A Vehicle
1 Heart G 20 mg/kg
1 Heart E 6 mg/kg
1 Heart F 6 mg/kg
2 Skeletal Muscle H 20 mg/kg
2 Skeletal Muscle D 6 mg/kg
2 Skeletal Muscle I 20 mg/kg
2 Skeletal Muscle G 20 mg/kg
2 Skeletal Muscle F 6 mg/kg
2 Skeletal Muscle E 6 mg/kg
2 Skeletal Muscle C Vehicle
2 Skeletal Muscle A Vehicle
2 Skeletal Muscle B Vehicle
3 Liver I 20 mg/kg
3 Liver H 20 mg/kg
3 Liver G 20 mg/kg
3 Liver E 6 mg/kg
3 Liver A Vehicle
3 Liver F 6 mg/kg
3 Liver D 6 mg/kg
3 Liver C Vehicle
3 Liver B Vehicle
4 Kidney G 20 mg/kg
4 Kidney I 20 mg/kg
4 Kidney H 20 mg/kg
4 Kidney E 6 mg/kg
4 Kidney A Vehicle
4 Kidney C Vehicle
4 Kidney F 6 mg/kg
4 Kidney B Vehicle
4 Kidney D 6 mg/kg
doi:10.1371/journal.pone.0048238.t002
Non-Negative Matrix Factorization in Toxicology
PLOS ONE | www.plosone.org 4 December 2012 | Volume 7 | Issue 12 | e48238
for some small positive matrices g½j�W (i), and g
½j�H , with � representing
element-wise multiplication. The iteration may be motivated
through the intuition that when g½j�W (i) and g
½j�H are sufficiently small
and positive each of these equations should reduce the objective
function. This allows us to set
g½j�W (i)~
W (i)½j�
W (i)½j�H ½j�H ½j�Tand g
½j�H~
H ½j�Pdi~1
b(i)W (i)½j�TW (i)½j�H ½j�,
again with the division being performed element-wise. Hence the
overall iteration has the form
W (i)½jz1�~W (i)½j� � A(i)H ½j�T
W (i)½j�H ½j�H ½j�T
H ½jz1�~H ½j� �
Pdi~1
b(i)W (i)½j�TA(i)
Pdi~1
b(i)W (i)½j�TW (i)½j�H ½j�:
The values in gW (i) and gH are non-negative due to the
constraints on the matrices, however they are not necessarily
small. The iteration decreases the objective function (1), so this
leads to a locally optimum solution, but we cannot guarantee
convergence to a global optimum. In particular, different initial
conditions can lead to different factorizations of different
quality.
Having iterated up to some stopping criterion and produced the
factorizations, we use them to bi-cluster the data. Each sample is
assigned to the cluster for which it has the largest value in the gene
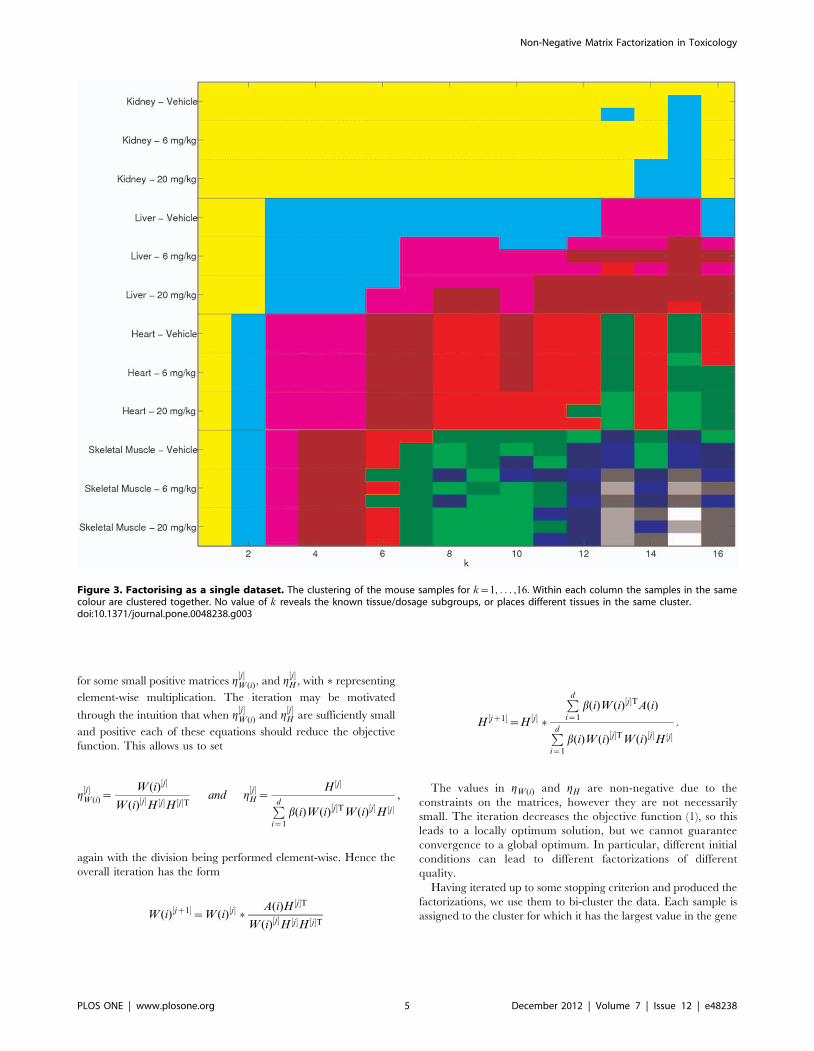
Figure 3. Factorising as a single dataset. The clustering of the mouse samples for k~1, . . . ,16. Within each column the samples in the samecolour are clustered together. No value of k reveals the known tissue/dosage subgroups, or places different tissues in the same cluster.doi:10.1371/journal.pone.0048238.g003
Non-Negative Matrix Factorization in Toxicology
PLOS ONE | www.plosone.org 5 December 2012 | Volume 7 | Issue 12 | e48238

cluster and vice versa. In reordering the data for easy visualisation
we organise the rows and columns by cluster number (assigned
arbitrarily) and sort the elements within each cluster from the
appropriate sample/gene set, with the largest value at the bottom/
right of that cluster. Given that the second factor is common to all
the factorizations, it produces a matching ordering of the columns
of the data.
Because the result depends on the choice of initial condition,
and because the choice of k is not automatic, further information
is needed in order to specify a practical algorithm. To deal with
the lack of uniqueness, we try several initial conditions and pick a
realisation that minimises the objective function (1). We then
continue until further runs do not significantly alter the results.
The objective function value is also one of the criteria we use in
order to decide which rank/clustering is the most ‘‘appropriate’’
for the data. By regarding the objective function as a function of k,
we identify values of k where the decay in the objective function
begins to diminish. In addition we also form a consensus matrix as
in [3,14] for the clustering of the objects. This is the average of the
connectivity matrices C where for each initialisation Ci,j~1 if
objects i and j are clustered together and 0 otherwise. So the
consensus matrix contains values between 0 and 1 with the (i,j)thelement being the likelihood that objects i and j cluster together.
The cumulative density of these values is constructed, by summing
the appropriate probabilities, and the area under this curve is the
second measure we look at when considering choices for k. The
third measure is the Pearson correlation of the cophenetic
distances, as explained in [3].
Mouse dataWe apply these techniques to mouse gene expression data
quantifying changes in four different tissue types following
administration of different dosages (vehicle, therapeutic and toxic)
of an experimental pan-PPAR agonist. The study design and
clinical chemistry results are summarised in Table 1. ALT and
AST are known markers in rodents for liver toxicity [15] and from
this criterion mouse E may be showing a toxic response to
Figure 4. Three measures of the performance versus specified cluster size, k, when the four tissue types are factorised separately.(a) The value of the objective function for k~2, . . . ,10. (b) The area under consensus cumulative density function for k~2, . . . ,10, [3,14]. (c) Thecophenetic correlation coefficient, [3].doi:10.1371/journal.pone.0048238.g004
Non-Negative Matrix Factorization in Toxicology
PLOS ONE | www.plosone.org 6 December 2012 | Volume 7 | Issue 12 | e48238

PPM201, despite it being administered at a supposedly therapeutic
dose level. This conditions our expectation of the gene-expression
pattern for mouse E and suggests that it may be similar to the toxic
level group III for liver.
Nine wild type mice (strain: C57BL/6J) were randomly divided
into three groups; - Group-I, II and III. PPM-201 in the vehicle
base was administered daily for 14 days at 6 mg/kg body weight
dose rate to each mouse in Group-II and at 20 mg/kg body weight
dose rate to each mouse in Group-III while the mice in Group-I
received only the vehicle base. On 15th day, the mice were
sacrificed to harvest blood, heart, skeletal muscle, liver and kidney
tissues for clinical chemistry, microarray and histopathology
Figure 5. Factorisation of the four separate tissue types using simultaneous NMF with k~3. Top left, kidney; top right, liver; lower left,heart; lower right, skeletal muscle. The four tissue types are treated as separate sources of information across a common set of mice. Genes aretherefore ordered differently in each of the four tissues, but the mice ordering is global. The resulting mouse ordering and mouse clusters aredetailed in Table 3.doi:10.1371/journal.pone.0048238.g005
Non-Negative Matrix Factorization in Toxicology
PLOS ONE | www.plosone.org 7 December 2012 | Volume 7 | Issue 12 | e48238

analysis. In the clinical chemistry analysis, alanine aminotransfer-
ase (ALT, U/L), aspartate aminotransferase (AST, U/L), creat-
inine kinase (CK, U/L), blood urea nitrogen (BUN, mmol/L),
creatinine (mmol/L) and lactate dehydrogenase (LDH, U/L) were
measured from the blood of each mouse. Two sections of liver, two
sections of kidney, one or two sections of skeletal muscle, and one
section of heart were prepared from each mouse, stained with
hematoxylin and eosin (H&E), and examined by a veterinary
pathologist. Total RNA was isolated from murine tissues using
Qiazol-based homogenization and subsequent column-based
purification (Qiagen) with on-column DNAse-treatment. DNAse-
free RNA was assessed for quality using Agilent Bioanalyser
electrophoresis and acceptance criteria of RNA Integrity Number
(RIN) greater than seven. 50 ng of total RNA was subsequently
utilized as input to cDNA-based amplification and biotin-labelling
using single-primer isothermal amplification according to the
manufacturer’s instructions (Ovation System, NuGEN Technolo-
gies). Unlabelled and biotin-labelled cDNA was qualitatively
assessed by Agilent Bioanalyser electrophoresis to ensure identical
size distributions of all samples pre- and post-fragmentation.
Fragmented, biotin-labelled cDNA were hybridized to MOE430
2.0 GeneChip arrays (Affymetrix) with subsequent scanning and
feature extraction according to the manufacturer’s instructions.
The dataset has been approved by the GEO curators and
assigned the accession number GSE31561.
Ethics StatementThe in vivo procedures undertaken during the course of this
study (Ref: CXR0631) were subject to the provisions of the United
Kingdom Animals (Scientific Procedures) Act 1986. The study was
approved by the CXR Biosciences Local Ethics Committee and
complied with all applicable sections of the Act and the associated
Codes of Practice for the Housing and Care of Animals used in
Scientific Procedures and the Humane Killing of Animals under
Schedule 1 to the Act, issued under section of the Act.
Figure 6. Factorisation of the four separate tissue types simultaneously. The clustering of the mice for k~1, . . . ,9; colour indicates clusternumber. One ‘‘misclassification’’ is found for several values of k. This involves the mouse showing a toxic response to the lower (6 mg/kg) dose ofPPAR agonist, as discussed in section .doi:10.1371/journal.pone.0048238.g006
Table 3. Ordering of the tissue samples after a four-wayfactorization of rank 3.
Cluster Mouse Dosage
1 E 6 mg/kg
1 G 20 mg/kg
1 I 20 mg/kg
1 H 20 mg/kg
2 F 6 mg/kg
2 D 6 mg/kg
3 B Vehicle
3 A Vehicle
3 C Vehicle
The mouse clusters when split by tissue type and reordered using the 4-waysimultaneous factorization for k~3.doi:10.1371/journal.pone.0048238.t003
Non-Negative Matrix Factorization in Toxicology
PLOS ONE | www.plosone.org 8 December 2012 | Volume 7 | Issue 12 | e48238

Results
Single datasetFirst, the samples are treated as a single dataset, with thirty six
samples and 45037 genes, hence the data matrix A is 45037|36.
This corresponds to the case where d~1 in Section . The
factorizations were performed twenty times for each
k~2,3, . . . ,16, with a consensus matrix formed from the
clustering of the samples. All gene clusters associated with this
analysis are labelled with a subscript 1, e.g., heart1.
Figure 1(a) shows the minimum size of the objective function
that we observed for each value of k. We see that this value
decreases monotonically, with a slower rate starting at around
k~4. Figure 1(b) shows the area under the cumulative density
curves for the same values of k. This subfigure clearly points to
k~4, as does subfigure (c) showing the cophenetic correlation.
Based on Figure 1, we conclude that when the data is factorized
as a single entity, k~4 clusters is the most appropriate choice.
Reordering the dataset using the ordering for k~4 in the manner
described in Section gives the images shown in Figure 2. This
figure shows the samples in the columns with cluster one at the
top. To aid visualisation, the sample clusters are split by white
lines, as are the gene clusters. This reordered data matrix shows a
distinctive ‘‘ramp’’ effect in the blocks on the diagonal, placing
genes that are most influential in identifying each tissue type to the
bottom of the block. This figure also shows some of the differences
in expression behaviour between the tissue types, particularly for
the most influential genes.
Because we know the origin of the samples, we can confirm that
the algorithm has put the heart samples in cluster one, the skeletal
muscle samples in cluster two, the liver samples in cluster three,
and the kidney samples in cluster four. The exact ordering of the
samples is shown in Table 2. This table also shows the mouse
identification information for each sample, and we see that the
mice are not ordered in the same way within each cluster. It is the
liver and skeletal muscle samples that most closely respect the
dosage levels within the clusters. Both these clusters only have one
sample mis-ordered.
Given that the factorization has been performed for
k~2, . . . ,16 we know what the clustering would be from all these
rank factorizations. This information is displayed in Figure 3. Here
the rows representing the samples are ordered in tissue then
dosage subgroups. For each rank k, samples with the same colour
are assigned to the same cluster. As we have seen before, for k~4the samples are split into tissue types. The figure shows that this
split persists at k~5 with an empty cluster forming. In fact, for this
range of k there are at most twelve clusters of samples. We also see
from this figure that for no value of k are the twelve tissue/dosage
subgroups found.
Multiple datasetsThe test in Section indicates that the basic NMF factorization
approach can deliver biologically meaningful results—separating
the twelve samples by tissue type. But the failure to order correctly
within tissue type according to dosage motivates the use of the
multiple dataset generalization introduced in Section , where the
four tissue types are treated as separate sources of information
across a common set of mice. Intuitively, we would expect to add
value to the data analysis by building known biology into the
algorithm in this way. In this section, we therefore factorize the
four new datasets simultaneously. This is similar to the test in
Section in the sense that it produces a single ordering for the mice,
but it has the potential to add extra information by providing four
different, tissue-level, gene orderings. We thus have d~4 matrices
Table 4. Gene cluster comparison for indivdual tissues in the single matrix, ‘‘tissue1,’’ with the four separate tissue matrices‘‘tissue4.’’
H1 SM1 L1 K1
Cluster No. Probability No. Probability No. Probability No. Probability
Heart1 Clust.1 22 2.2188e-38 0 0.8005 0 0.8005 0 0.8005
Clust.2 1 0.1785 2 0.0195 49 5.444e-108 0 0.8005
Clust.3 11 4.3469e-16 7 2.8360e-09 1 0.1785 5 3.0037e-06
total 34 5.4969e-67 9 1.4338e-12 50 6.309e-111 5 3.0037e-06
S:Muscle1 Clust.1 4 7.3075e-05 15 1.1260e-12 8 6.8371e-11 0 0.8005
Clust.2 0 0.8005 0 0.8005 0 0.8005 0 0.8005
Clust.3 4 7.3075e-05 14 1.0243e-21 0 0.8005 0 0.8005
total 8 6.8371e-11 29 1.3672e-54 8 6.8371e-11 0 0.8005
Liver1 Clust.1 1 0.1785 0 0.8005 13 8.4974e-11 1 0.1785
Clust.2 0 0.8005 0 0.8005 0 0.8005 0 0.8005
Clust.3 1 0.1785 2 0.0195 16 1.1336e-25 2 0.0195
total 2 0.0195 2 0.0195 29 1.3672e-54 3 0.0014
Kidney1 Clust.1 0 0.8005 0 0.8005 1 0.1785 0 0.8005
Clust.2 2 0.0195 1 0.1785 1 0.1785 0 0.8005
Clust.3 0 0.8005 0 0.8005 2 0.0195 18 8.9507e-30
total 2 0.0195 1 0.1785 4 7.3075e-05 18 8.9507e-30
H1, SM1, L1 and K1 are the gene clusters most characteristic for the heart, skeletal muscle, liver and kidney, respectively, in the single (combined) data set, as in Figure 2.Clust.1, 2, or 3 denotes the 100 genes most securely placed within the clusters of the diferently ordered genes in the 4-way factorization shown in Figure 5. The order ofthe clusters is 1–3, from the top of the figire, for each tissue. We refer to these clusters as ‘‘heart4cluster1,’’ etc. The overlap of the heart1 from the one-way factorizationto heart4 is referred to as heart1 heart4 cluster 1.doi:10.1371/journal.pone.0048238.t004
Non-Negative Matrix Factorization in Toxicology
PLOS ONE | www.plosone.org 9 December 2012 | Volume 7 | Issue 12 | e48238

of size 45037|9. We again performed 20 factorizations, this time
for k~2, . . . ,10 and these have been used to generate a consensus
for clustering the mice.
The objective function and the consensus measurements are
shown in Figure 4. The objective function in subfigure (a) does not
show much decrease in convergence rate until we get to nine
clusters. This is the point where each mouse is put into a cluster on
its own. The area under the cumulative density curve in Figure 4(b)
suggests using either rank k~3, or k~5 factorizations for the
clustering. The correlation coefficients shown in subfigure (c) give
the same two values as peaks, as well as k~8, though the k~3peak is the highest.
Given these measurements we consider the four-way simulta-
neous factorization for k~3 in Figure 5. The reordered datasets
are shown separately with the kidney dataset in the top left, the
liver dataset in the top right, the heart dataset in the bottom left
and the skeletal muscle in the bottom right. The mouse ordering
and mouse clusters that arise are shown in Table 3. The four
subfigures in Figure 5 also illustrate that the gene clusters are
different for each dataset. The three clusters for each tissue in this
4-way factorization are subsequently refered to in the form
‘‘tissue4, cluster 1,2 or 3. ’’ Table 3 shows that the simultaneous
NMF approach has recovered the known mouse treatments except
for one misplacement. Figure 6 shows the clustering for the four-
way simultaneous factorizations for k~1, . . . ,9. This indicates
that this mouse does not cluster with all those of the same dosage
for any rank of factorization greater than two, instead it associates
with the higher more toxic dosage. This is borne out by the known
blood chemistry, as summarised in Table 1; the mouse that is mis-
Figure 7. Enrichment of canonical pathways in the four tissue specific gene clusters. The top one hundred most influential probe-sets inthe four tissue specific gene clusters obtained in the first factorization were subjected to signalling and metabolic pathways analysis in the IPAsoftware. This graph shows the comparison of canonical pathways enriched in the four tissue specific gene clusters, heart1 , muscle1 , kidney1 andliver1 . The coloured bars show the significance of the enrichment for a particular pathway in the cluster computed by Fisher’s exact test.doi:10.1371/journal.pone.0048238.g007
Non-Negative Matrix Factorization in Toxicology
PLOS ONE | www.plosone.org 10 December 2012 | Volume 7 | Issue 12 | e48238

classified exhibits a toxic response and is therefore classified with
the mice that received the higher dose.
Comparing Gene clustersOur aim now is to test the results from the novel multi-way
NMF algorithm used in Section in order to see whether they (a)
show consistency and (b) add value to the results in Section from
standard NMF. We know that the four simultaneously factorized
datasets correspond to the four clusters of samples that were
discovered in an unsupervised manner from the single factoriza-
tion of the full dataset. It could therefore be conjectured that the
most influential genes in the first factorization will appear as
influential genes in the four-way simultaneous factorization for
that dataset, but less so for the other datasets.
Our comparisons involve four reference sets. For illustration, we
chose an arbitrary threshold of one hundred; that is, we consider
the top one hundred most influential genes from the four clusters
in the first factorization shown in Figure 2. For easy reference
these sets are referred to using the known tissue type. This means
that the genes from cluster one are the heart1 genes, those from
cluster two are the muscle1 genes, those from cluster three are the
liver1 genes and those from cluster four are the kidney1 genes.
The 4-way factorization shown in Figure 5 identifies differently
ordered gene clusters for each tissue, which we will refer to as
‘‘kidney4, cluster 1,2 or 3, etc. ’’ Table 4 shows the total number
of co-incident genes between the top 100 lists arising from the one-
way and four-way factorisations. The table also shows the
probability of the two lists having that number of genes in
common if the second list were randomly selected; hence these
values come from the hypergeometric distribution. We see that the
important genes for each tissue type appear significantly highly in
the clusters from that tissue’s data type. In addition, all the tissue
type genes also appear significantly within the reordering of the
heart dataset. This link is reciprocated, with the heart genes
appearing significantly frequently within the skeletal muscle
dataset. Surprisingly, the greatest overlap arose between liver1
and heart4 cluster 2. One of these genes, Apoliprotein A1, is being
considered as a marker for cardiac toxicity [16].
We would like to demonstrate the utility of the factorization
method by using the gene clusters obtained in our analysis to
understand tissue specific effects of the experimental drug, PPM-
201. Of course, we are not claiming that this is an exhaustive
analysis of the effects of PPM-201. We analysed the gene clusters
Figure 8. Enrichment of toxicity functions in the four tissue specific gene clusters. The top one hundred most influential probe-sets in thefour tissue specific gene clusters obtained in the first factorization were subjected to IPA-Tox analysis in the IPA software. This graph shows thecomparison of toxicity functions enriched in the four tissue specific gene clusters. The coloured bars show the significance of the enrichment for aparticular toxicity functions in the cluster computed by Fisher’s exact test.doi:10.1371/journal.pone.0048238.g008
Non-Negative Matrix Factorization in Toxicology
PLOS ONE | www.plosone.org 11 December 2012 | Volume 7 | Issue 12 | e48238

for pathways enrichment and gene ontology enrichment using
DAVID [17] and Ingenuity Pathways Analysis (IPA) [18] tools.
Table 5 shows the comparison of KEGG pathways enriched in the
four tissue specific top one hundred most influential probe-sets
obtained in the first factorization. Pathways enriched in these
clusters differ according to the tissue types and can be considered
as the pathways that are most perturbed by PPM-201. For
example, arrhythmogenic right ventricular cardiomyopathy, hy-
pertrophic cardiomyopathy and dilated cardiomyopathy are
enriched in heart, whereas starch and sucrose metabolism, drug
metabolism and PPAR signalling pathway are enriched in liver.
Similarly, Figure 7 shows the enrichment of canonical pathways in
the four tissue specific clusters analysed using IPA. It also shows
the tissue specific enrichment of pathways—calcium signalling,
integrin linked kinase (ILK) signalling and cardiac hypertrophy
signalling are enriched in heart1 and muscle1 clusters, whereas
fatty acid metabolism and farnesoid X receptor (FXR)/retinoid X
receptor (RXR) activation are enriched in the liver1 cluster.
Table 5. Enrichment of KEGG pathways in the four tissue specific gene clusters.
Kegg Pathways Heart Muscle Kidney Liver
1 mmu05412: Arrhythmogenic right ventricular cardiomyopathy � %
2 mmu04020: Calcium signalling pathway � �3 mmu04260: Cardiac muscle contraction � �4 mmu05414: Dilated cardiomyopathy � �5 mmu05410: Hypertrophic cardiomyopathy (HCM) � �6 mmu04530: Tight junction % %
7 mmu00590: Arachidonic acid metabolism %
8 mmu00983: Drug metabolism �9 mmu04610: Complement and coagulation cascades �10 mmu00980: Metabolism of xenobiotics by cytochrome P450 �11 mmu03320: PPAR signalling pathway �12 mmu00830: Retinol metabolism �13 mmu00040: Pentose and glucuronate interconversions %
14 mmu00591: Linoleic acid metabolism %
15 mmu00053: Ascorbate and aldarate metabolism %
16 mmu00860: Porphyrin and chlorophyll metabolism %
17 mmu00500: Starch and sucrose metabolism %
18 mmu00150: Androgen and estrogen metabolism %
19 mmu00140: Steroid hormone biosynthesis %
The top one hundred most influential probesets in the four tissue specific gene clusters were analysed using DAVID functional annotation tool. This table shows thecomparison of KEGG pathways enriched in the four tissue specific gene clusters. The � icon indicates a p-value v0:001 and the % a 0:001vp-valuev0:05 showing thesignificance of the enrichment.doi:10.1371/journal.pone.0048238.t005
Table 6. Enrichment of KEGG pathways in the common genes between the clusters found by the two ways of factorization.
Kegg Pathways Heart1 Heart1 Muscle1 Liver1 Liver1 Liver1 Liver1
Heart4 Muscle4 Muscle4 Liver4 Liver4 Heart4 Muscle4
clust. 1 clust. 3 clust. 1 clust. 1 clust. 3 clust. 2 clust. 1
1 mmu04020: Calcium signalling pathway �2 mmu04260: Cardiac muscle contraction � %
3 mmu04610: Complement and coagulation cascades �4 mmu05414: Dilated cardiomyopathy � %
5 mmu00983: Drug metabolism %
6 mmu05410: Hypertrophic cardiomyopathy (HCM) � %
7 mmu03320: PPAR signalling pathway % � �8 mmu04530: Tight junction % �
The probesets common to clusters formed by the 4-way simultaneous factorization and the top one hundred most influential probesets in the four tissue specificclusters were analysed for enrichment of KEGG pathways using DAVID functional annotation tool. Fishers’ exact test p-values for pathway enrichment in the clusters areshown graphically in this table. The � icon indicates a p-value v0:001 and the % a 0:001vp-valuev0:05.doi:10.1371/journal.pone.0048238.t006
Non-Negative Matrix Factorization in Toxicology
PLOS ONE | www.plosone.org 12 December 2012 | Volume 7 | Issue 12 | e48238

Table 7. Muscle genes present in the calcium signalling pathway.
Sr. Probeset ID Gene Symbol Entrez Gene ID Entrez Gene Name
1 1427735 a at ACTA1 11459 Actin, alpha 1, skeletal muscle
2 1419312 at ATP2A1 11937 ATPase, Ca++ transporting, cardiac muscle, fast twitch 1
3 1422598 at CASQ1 12372 Calsequestrin 1 (fast-twitch, skeletal muscle)
4 1427520 a at MYH1 17879 Myosin, heavy chain 1, skeletal muscle, adult
5 1425153 at MYH2 17882 Myosin, heavy chain 2, skeletal muscle, adult
6 1458368 at MYH4 17884 Myosin, heavy chain 4, skeletal muscle
7 1452651 a at MYL1 17901 Myosin, light chain 1, alkali; skeletal, fast
8 1457347 at RYR1 20190 Ryanodine receptor 1 (skeletal)
9 1440962 at SLC8A3 110893 Solute carrier family 8, member 3
10 1417464 at TNNC2 21925 Troponin C type 2 (fast)
11 1416889 at TNNI2 21953 Troponin I type 2 (skeletal, fast)
12 1450118 a at TNNT3 21957 Troponin T type 3 (skeletal, fast)
13 1419739 at TPM2 22004 Tropomyosin 2 (beta)
14 1426144 x at TRDN 76757 Triadin
Table shows the probe-sets enriched for calcium signalling among the top 100 probe-sets from the muscle1 gene cluster.doi:10.1371/journal.pone.0048238.t007
Table 8. Heart genes present in the calcium signalling pathway.
Sr. Probeset ID Gene Symbol Entrez Gene ID Entrez Gene Name
1 1415927 at ACTC1 11464 Actin, alpha, cardiac muscle 1
2 1416551 at ATP2A2 11938 ATPase, Ca++ transporting, cardiac muscle, slow twitch 2
3 1422529 s at CASQ2 12373 Calsequestrin 2 (cardiac muscle)
4 1448827 s at MYH6 17888 Myosin, heavy chain 6, cardiac muscle, alpha
5 1448394 at MYL2 17906 Myosin, light chain 2, regulatory, cardiac, slow
1427769 x at MYL3 17897 Myosin, light chain 3, alkali; ventricular, skeletal, slow
7 1421126 at RYR2 20191 Ryanodine receptor 2 (cardiac)
8 1418370 at TNNC1 21924 Troponin C type 1 (slow)
9 1422536 at TNNI3 21954 Troponin I type 3 (cardiac)
10 1440424 at TNNT2 21956 Troponin T type 2 (cardiac)
11 1423049 a at TPM1 22003 Tropomyosin 1 (alpha)
12 1451940 x at TRDN 76757 Triadin
Table shows the probe-sets enriched for calcium signalling among the top 100 probe-sets from the heart1 gene cluster.doi:10.1371/journal.pone.0048238.t008
Table 9. Liver genes present in the calcium signalling pathway.
Sr. Probeset ID Gene Symbol Entrez Gene ID Entrez Gene Name
1 1449817 at ABCB11 27413 ATP-binding cassette, sub-family B (MDR/TAP), member 11
2 1419393 at ABCG5 27409 ATP-binding cassette, sub-family G (WHITE), member 5
3 1419232 a at APOA1 11806 Apolipoprotein A-I
4 1418278 at APOC3 11814 Apolipoprotein C-III
5 1449309 at CYP8B1 13124 Cytochrome P450, family 8, subfamily B, polypeptide 1
6 1418190 at PON1 18979 Paraoxonase 1
7 1450261 a at SLC10A1 20493 Solute carrier family 10, member 1
8 1449112 at SLC27A5 26459 Solute carrier family 27, member 5
9 1449394 at SLCO1B3 28253 Solute carrier organic anion transporter family, member 1B3
10 1424934 at UGT2B4 71773 UDP glucuronosyltransferase 2 family, polypeptide B4
Table shows the probe-sets enriched for calcium signalling among the top 100 probe-sets from the liver1 gene cluster.doi:10.1371/journal.pone.0048238.t009
Non-Negative Matrix Factorization in Toxicology
PLOS ONE | www.plosone.org 13 December 2012 | Volume 7 | Issue 12 | e48238
Analysis of the same sets of genes for enrichment of toxicity
functions in the IPA shows, in Figure 8, cardiac hypertrophy in
heart1 genes, increased level of creatinine and hydronephrosis in
kidney1 genes, and increased levels of lactate dehydrogenase
(LDH) and steatosis in liver1 genes.
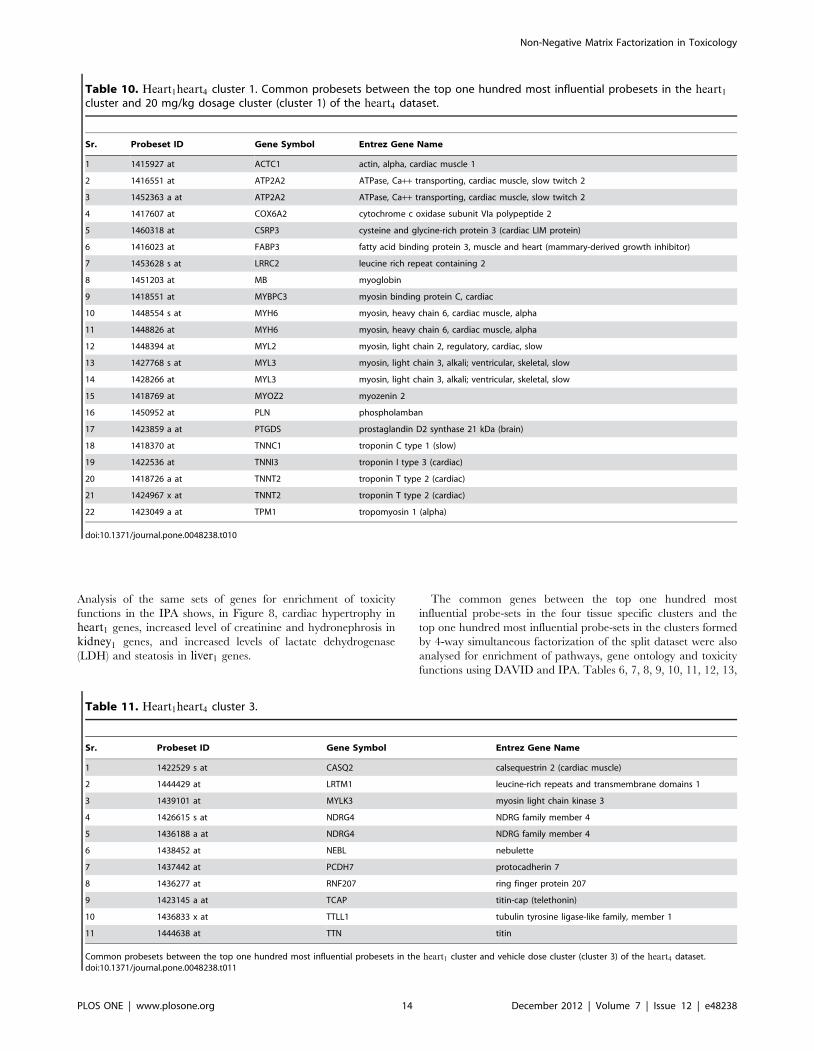
The common genes between the top one hundred most
influential probe-sets in the four tissue specific clusters and the
top one hundred most influential probe-sets in the clusters formed
by 4-way simultaneous factorization of the split dataset were also
analysed for enrichment of pathways, gene ontology and toxicity
functions using DAVID and IPA. Tables 6, 7, 8, 9, 10, 11, 12, 13,
Table 10. Heart1heart4 cluster 1. Common probesets between the top one hundred most influential probesets in the heart1
cluster and 20 mg/kg dosage cluster (cluster 1) of the heart4 dataset.
Sr. Probeset ID Gene Symbol Entrez Gene Name
1 1415927 at ACTC1 actin, alpha, cardiac muscle 1
2 1416551 at ATP2A2 ATPase, Ca++ transporting, cardiac muscle, slow twitch 2
3 1452363 a at ATP2A2 ATPase, Ca++ transporting, cardiac muscle, slow twitch 2
4 1417607 at COX6A2 cytochrome c oxidase subunit VIa polypeptide 2
5 1460318 at CSRP3 cysteine and glycine-rich protein 3 (cardiac LIM protein)
6 1416023 at FABP3 fatty acid binding protein 3, muscle and heart (mammary-derived growth inhibitor)
7 1453628 s at LRRC2 leucine rich repeat containing 2
8 1451203 at MB myoglobin
9 1418551 at MYBPC3 myosin binding protein C, cardiac
10 1448554 s at MYH6 myosin, heavy chain 6, cardiac muscle, alpha
11 1448826 at MYH6 myosin, heavy chain 6, cardiac muscle, alpha
12 1448394 at MYL2 myosin, light chain 2, regulatory, cardiac, slow
13 1427768 s at MYL3 myosin, light chain 3, alkali; ventricular, skeletal, slow
14 1428266 at MYL3 myosin, light chain 3, alkali; ventricular, skeletal, slow
15 1418769 at MYOZ2 myozenin 2
16 1450952 at PLN phospholamban
17 1423859 a at PTGDS prostaglandin D2 synthase 21 kDa (brain)
18 1418370 at TNNC1 troponin C type 1 (slow)
19 1422536 at TNNI3 troponin I type 3 (cardiac)
20 1418726 a at TNNT2 troponin T type 2 (cardiac)
21 1424967 x at TNNT2 troponin T type 2 (cardiac)
22 1423049 a at TPM1 tropomyosin 1 (alpha)
doi:10.1371/journal.pone.0048238.t010
Table 11. Heart1heart4 cluster 3.
Sr. Probeset ID Gene Symbol Entrez Gene Name
1 1422529 s at CASQ2 calsequestrin 2 (cardiac muscle)
2 1444429 at LRTM1 leucine-rich repeats and transmembrane domains 1
3 1439101 at MYLK3 myosin light chain kinase 3
4 1426615 s at NDRG4 NDRG family member 4
5 1436188 a at NDRG4 NDRG family member 4
6 1438452 at NEBL nebulette
7 1437442 at PCDH7 protocadherin 7
8 1436277 at RNF207 ring finger protein 207
9 1423145 a at TCAP titin-cap (telethonin)
10 1436833 x at TTLL1 tubulin tyrosine ligase-like family, member 1
11 1444638 at TTN titin
Common probesets between the top one hundred most influential probesets in the heart1 cluster and vehicle dose cluster (cluster 3) of the heart4 dataset.doi:10.1371/journal.pone.0048238.t011
Non-Negative Matrix Factorization in Toxicology
PLOS ONE | www.plosone.org 14 December 2012 | Volume 7 | Issue 12 | e48238

14, 15, 16, 17 summarise the results of this analysis, which are
discussed further in the next section.
Discussion
The factorization and reordering of the dataset as a whole set
(Figure 2 and Table 2) successfully clustered samples from the
same tissue and further investigation showed that it simultaneously
identified genes with a known relevance to those tissues. It was
therefore reasonable to study the genes that were responsible for
this differentiation. In the one-way clustering, the top 100 probe-
sets from each of the four tissue specific clusters show remarkable
coherence for tissue specific pathways. The calcium signalling
pathway is highly enriched in both heart1 and muscle1 clusters;
these genes are linked to muscle contraction function. Muscle
contraction is the prime function of cardiac and skeletal muscles. A
deeper look at the probe-sets (Tables 7 and 8) from the heart and
skeletal muscle clusters shows a successful identification of
differences in the tissue types for this pathway; see Figure 9.
MYH1, MYH2, MYH4 and MYL1 of the myosin family, which
are specific to skeletal muscle, are found in the muscle1 cluster
while cardiac muscle specific myosin family members MYH6,
MYL2 and MYL3 are found in the heart1 cluster [19]. This
pattern is also true for troponin, calsequestrin, ryanodine and actin
Table 12. Muscle1muscle4 cluster 1.
Sr. Probeset ID Gene Symbol Entrez Gene Name
1 1427735 a at ACTA1 actin, alpha 1, skeletal muscle
2 1418677 at ACTN3 actinin, alpha 3
3 1419312 at ATP2A1 ATPase, Ca++ transporting, cardiac muscle, fast twitch 1
4 1417614 at CKM creatine kinase, muscle
5 1438059 at CTXN3 (includes EG:629147) cortexin 3
6 1455736 at MYBPC2 myosin binding protein C, fast type
7 1427868 x at MYH1 myosin, heavy chain 1, skeletal muscle, adult
8 1427026 at MYH4 myosin, heavy chain 4, skeletal muscle
9 1448371 at MYLPF myosin light chain, phosphorylatable, fast skeletal muscle
10 1418155 at MYOT myotilin
11 1427306 at RYR1 ryanodine receptor 1 (skeletal)
12 1417464 at TNNC2 troponin C type 2 (fast)
13 1416889 at TNNI2 troponin I type 2 (skeletal, fast)
14 1450118 a at TNNT3 troponin T type 3 (skeletal, fast)
15 1426142 a at TRDN triadin
Common probesets between the top one hundred most influential probesets in the muscle1 cluster and 20 mg/kg dosage cluster (cluster 1) of the muscle4 dataset.doi:10.1371/journal.pone.0048238.t012
Table 13. Muscle1muscle4 cluster 3.
Sr. Probeset ID Gene Symbol Entrez Gene Name
1 1453657 at 2310065F04RIK RIKEN cDNA 2310065F04 gene
2 1434722 at AMPD1 adenosine monophosphate deaminase 1
3 1460256 at CA3 carbonic anhydrase III, muscle specific
4 1422598 at CASQ1 calsequestrin 1 (fast-twitch, skeletal muscle)
5 1439332 at DDIT4L DNA-damage-inducible transcript 4-like
6 1427400 at LBX1 ladybird homeobox 1
7 1419487 at MYBPH myosin binding protein H
8 1458368 at MYH4 myosin, heavy chain 4, skeletal muscle
9 1441111 at MYLK4 myosin light chain kinase family, member 4
10 1418373 at PGAM2 phosphoglycerate mutase 2 (muscle)
11 1444480 at PRKAG3 protein kinase, AMP-activated, gamma 3 non-catalytic subunit
12 1417653 at PVALB parvalbumin
13 1422644 at SH3BGR SH3 domain binding glutamic acid-rich protein
14 1449206 at SYPL2 synaptophysin-like 2
Common probesets between the top one hundred most influential probesets in the muscle1 cluster and vehicle dose cluster (cluster 3) of the muscle4 dataset.doi:10.1371/journal.pone.0048238.t013
Non-Negative Matrix Factorization in Toxicology
PLOS ONE | www.plosone.org 15 December 2012 | Volume 7 | Issue 12 | e48238
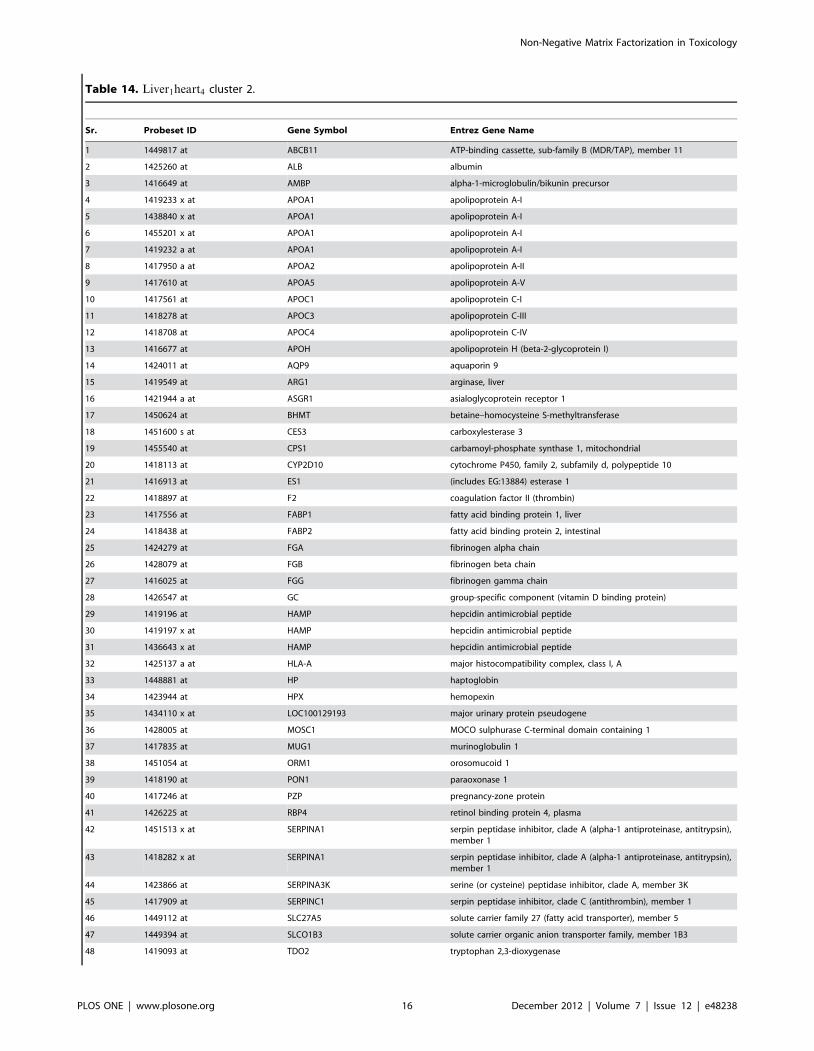
Table 14. Liver1heart4 cluster 2.
Sr. Probeset ID Gene Symbol Entrez Gene Name
1 1449817 at ABCB11 ATP-binding cassette, sub-family B (MDR/TAP), member 11
2 1425260 at ALB albumin
3 1416649 at AMBP alpha-1-microglobulin/bikunin precursor
4 1419233 x at APOA1 apolipoprotein A-I
5 1438840 x at APOA1 apolipoprotein A-I
6 1455201 x at APOA1 apolipoprotein A-I
7 1419232 a at APOA1 apolipoprotein A-I
8 1417950 a at APOA2 apolipoprotein A-II
9 1417610 at APOA5 apolipoprotein A-V
10 1417561 at APOC1 apolipoprotein C-I
11 1418278 at APOC3 apolipoprotein C-III
12 1418708 at APOC4 apolipoprotein C-IV
13 1416677 at APOH apolipoprotein H (beta-2-glycoprotein I)
14 1424011 at AQP9 aquaporin 9
15 1419549 at ARG1 arginase, liver
16 1421944 a at ASGR1 asialoglycoprotein receptor 1
17 1450624 at BHMT betaine–homocysteine S-methyltransferase
18 1451600 s at CES3 carboxylesterase 3
19 1455540 at CPS1 carbamoyl-phosphate synthase 1, mitochondrial
20 1418113 at CYP2D10 cytochrome P450, family 2, subfamily d, polypeptide 10
21 1416913 at ES1 (includes EG:13884) esterase 1
22 1418897 at F2 coagulation factor II (thrombin)
23 1417556 at FABP1 fatty acid binding protein 1, liver
24 1418438 at FABP2 fatty acid binding protein 2, intestinal
25 1424279 at FGA fibrinogen alpha chain
26 1428079 at FGB fibrinogen beta chain
27 1416025 at FGG fibrinogen gamma chain
28 1426547 at GC group-specific component (vitamin D binding protein)
29 1419196 at HAMP hepcidin antimicrobial peptide
30 1419197 x at HAMP hepcidin antimicrobial peptide
31 1436643 x at HAMP hepcidin antimicrobial peptide
32 1425137 a at HLA-A major histocompatibility complex, class I, A
33 1448881 at HP haptoglobin
34 1423944 at HPX hemopexin
35 1434110 x at LOC100129193 major urinary protein pseudogene
36 1428005 at MOSC1 MOCO sulphurase C-terminal domain containing 1
37 1417835 at MUG1 murinoglobulin 1
38 1451054 at ORM1 orosomucoid 1
39 1418190 at PON1 paraoxonase 1
40 1417246 at PZP pregnancy-zone protein
41 1426225 at RBP4 retinol binding protein 4, plasma
42 1451513 x at SERPINA1 serpin peptidase inhibitor, clade A (alpha-1 antiproteinase, antitrypsin),member 1
43 1418282 x at SERPINA1 serpin peptidase inhibitor, clade A (alpha-1 antiproteinase, antitrypsin),member 1
44 1423866 at SERPINA3K serine (or cysteine) peptidase inhibitor, clade A, member 3K
45 1417909 at SERPINC1 serpin peptidase inhibitor, clade C (antithrombin), member 1
46 1449112 at SLC27A5 solute carrier family 27 (fatty acid transporter), member 5
47 1449394 at SLCO1B3 solute carrier organic anion transporter family, member 1B3
48 1419093 at TDO2 tryptophan 2,3-dioxygenase
Non-Negative Matrix Factorization in Toxicology
PLOS ONE | www.plosone.org 16 December 2012 | Volume 7 | Issue 12 | e48238
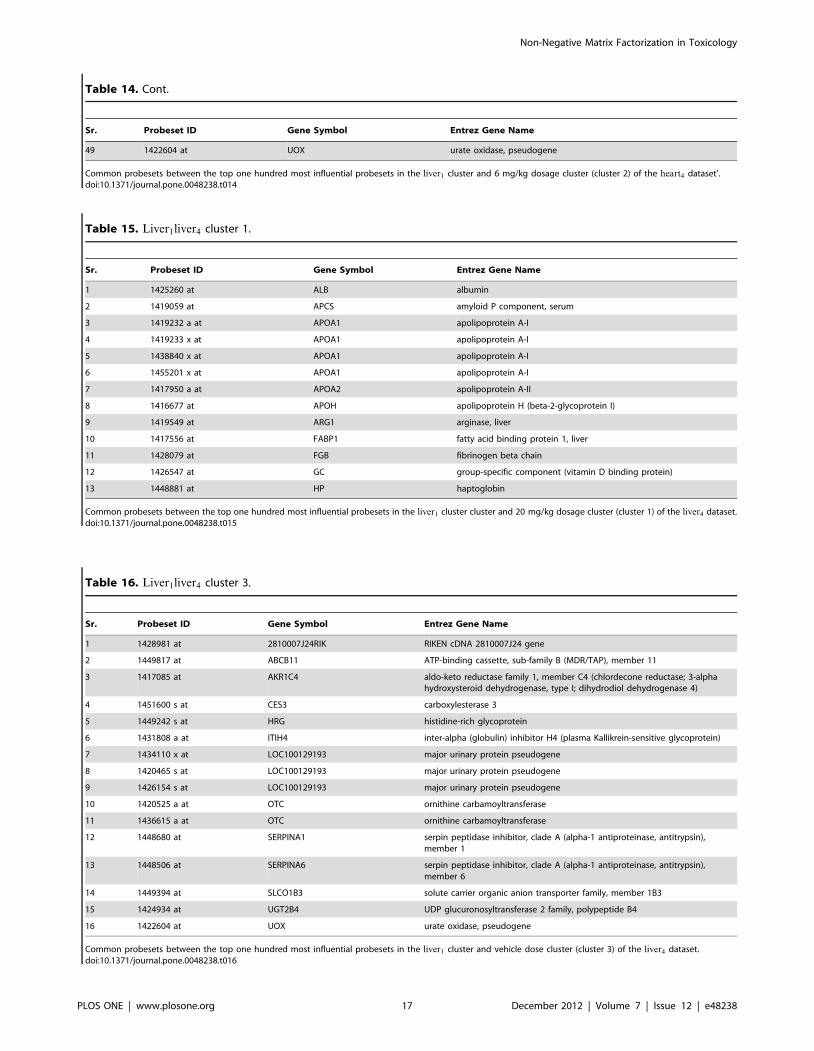
Table 14. Cont.
Sr. Probeset ID Gene Symbol Entrez Gene Name
49 1422604 at UOX urate oxidase, pseudogene
Common probesets between the top one hundred most influential probesets in the liver1 cluster and 6 mg/kg dosage cluster (cluster 2) of the heart4 dataset’.doi:10.1371/journal.pone.0048238.t014
Table 15. Liver1liver4 cluster 1.
Sr. Probeset ID Gene Symbol Entrez Gene Name
1 1425260 at ALB albumin
2 1419059 at APCS amyloid P component, serum
3 1419232 a at APOA1 apolipoprotein A-I
4 1419233 x at APOA1 apolipoprotein A-I
5 1438840 x at APOA1 apolipoprotein A-I
6 1455201 x at APOA1 apolipoprotein A-I
7 1417950 a at APOA2 apolipoprotein A-II
8 1416677 at APOH apolipoprotein H (beta-2-glycoprotein I)
9 1419549 at ARG1 arginase, liver
10 1417556 at FABP1 fatty acid binding protein 1, liver
11 1428079 at FGB fibrinogen beta chain
12 1426547 at GC group-specific component (vitamin D binding protein)
13 1448881 at HP haptoglobin
Common probesets between the top one hundred most influential probesets in the liver1 cluster cluster and 20 mg/kg dosage cluster (cluster 1) of the liver4 dataset.doi:10.1371/journal.pone.0048238.t015
Table 16. Liver1liver4 cluster 3.
Sr. Probeset ID Gene Symbol Entrez Gene Name
1 1428981 at 2810007J24RIK RIKEN cDNA 2810007J24 gene
2 1449817 at ABCB11 ATP-binding cassette, sub-family B (MDR/TAP), member 11
3 1417085 at AKR1C4 aldo-keto reductase family 1, member C4 (chlordecone reductase; 3-alphahydroxysteroid dehydrogenase, type I; dihydrodiol dehydrogenase 4)
4 1451600 s at CES3 carboxylesterase 3
5 1449242 s at HRG histidine-rich glycoprotein
6 1431808 a at ITIH4 inter-alpha (globulin) inhibitor H4 (plasma Kallikrein-sensitive glycoprotein)
7 1434110 x at LOC100129193 major urinary protein pseudogene
8 1420465 s at LOC100129193 major urinary protein pseudogene
9 1426154 s at LOC100129193 major urinary protein pseudogene
10 1420525 a at OTC ornithine carbamoyltransferase
11 1436615 a at OTC ornithine carbamoyltransferase
12 1448680 at SERPINA1 serpin peptidase inhibitor, clade A (alpha-1 antiproteinase, antitrypsin),member 1
13 1448506 at SERPINA6 serpin peptidase inhibitor, clade A (alpha-1 antiproteinase, antitrypsin),member 6
14 1449394 at SLCO1B3 solute carrier organic anion transporter family, member 1B3
15 1424934 at UGT2B4 UDP glucuronosyltransferase 2 family, polypeptide B4
16 1422604 at UOX urate oxidase, pseudogene
Common probesets between the top one hundred most influential probesets in the liver1 cluster and vehicle dose cluster (cluster 3) of the liver4 dataset.doi:10.1371/journal.pone.0048238.t016
Non-Negative Matrix Factorization in Toxicology
PLOS ONE | www.plosone.org 17 December 2012 | Volume 7 | Issue 12 | e48238

family members [20–25] (Tables 7 and 8). FXR/RXR activation
pathway genes are significantly enriched in liver1 cluster (Figure 7)
with most of the enriched genes present in the bile acid synthesis
and regulation (Figure 10) pathway, which is one of the core
functions of liver [26–28]. FXR/RXR activation is also found in
the kidney1 cluster, albeit with moderate significance; FBP1 and
HNF4A are the two genes present in this pathway and they may
be involved in gluconeogenesis in kidney [29].
Splitting the dataset into four on the basis of tissue types and
simultaneous non-negative factorization of them gave us the added
reassurance of clustering the samples according to the dosage
groups (Figure 5 and Table 3). The clustering of one mouse
(Mouse E) from the lower dosage group (Group-II) with the higher
dosage group (Group-III) can be explained by the higher PPM201
drug sensitivity of that mouse, indicated by the elevated levels of
the toxocology markers ALT, AST, LDH and CK, compared with
the rest of its group (Table 1). Comparisons of top probe-sets in
tissue specific clusters with dosage specific clusters also show very
high overlap of tissue specific genes in the four tissue types.
Heart1heart4 cluster1 has 22 probe-sets that are common between
the top 100 probe-sets of heart1 cluster and 20 mg/kg dosage
cluster of heart4 dataset, and are highly enriched for cardiac
muscle contraction and hypertrophic cardiomyopathy pathways
(Table 6). ACTC1, ATP2A2, MYH6, MYL2, MYL3, TNNC1,
TNNI3, TNNT2 and TPM1 are the genes enriched for these two
pathways and shared between these two clusters. However,
Heart1heart4 cluster 3, with 11 probe-sets in common between
the top 100 probe-sets of heart1 cluster and vehicle dose cluster of
heart4 dataset, does not show enrichment for cardiac muscle
contraction and hypertrophic cardiomyopathy pathways. From
this we may assume that perturbation of cardiac muscle
contraction and hypertrophic cardiomyopathy pathways by
20 mg/kg dosage may indicate toxic responses. We also see a
similar pattern in skeletal muscle. Between the top 100 probe-sets
Table 17. Kidney1kidney4 cluster 3.
Sr. Probeset ID Gene Symbol Entrez Gene Name
1 1456190 a at ACSM2A acyl-CoA synthetase medium-chain family member 2A
2 1427223 a at ACSM2A acyl-CoA synthetase medium-chain family member 2A
3 1425207 at BC026439 cDNA sequence BC026439
4 1424713 at CALML4 calmodulin-like 4
5 1424592 a at DNASE1 deoxyribonuclease I
6 1448485 at GGT1 gamma-glutamyltransferase 1
7 1460233 at GUCA2B guanylate cyclase activator 2B (uroguanylin)
8 1415969 s at KAP kidney androgen regulated protein
9 1415968 a at KAP kidney androgen regulated protein
10 1435094 at KCNJ16 potassium inwardly-rectifying channel, subfamily J, member 16
11 1450719 at MEP1A meprin A, alpha (PABA peptide hydrolase)
12 1418923 at SLC17A3 solute carrier family 17 (sodium phosphate), member 3
13 1417072 at SLC22A6 solute carrier family 22 (organic anion transporter), member 6
14 1423279 at SLC34A1 solute carrier family 34 (sodium phosphate), member 1
15 1425606 at SLC5A8 solute carrier family 5 (iodide transporter), member 8
16 1449301 at SLC7A13 solute carrier family 7, (cationic amino acid transporter, y+ system) member 13
17 1435064 a at TMEM27 transmembrane protein 27
18 1423397 at UGT2B17 UDP glucuronosyltransferase 2 family, polypeptide B17
Common probesets between the top one hundred most influential probesets in the kidney1 cluster and vehicle dose cluster (cluster 3) of the kidney4 dataset.doi:10.1371/journal.pone.0048238.t017
Figure 9. Heart and muscle genes enriched in calciumsignalling – muscle contraction pathway. IPA analysis of the top100 probe-sets from heart and muscle gene clusters (Figure 7) showedthe enrichment of calcium signalling pathway. In this figure, we havehighlighted the genes present in this pathway in orange. Though thispathway is generalised for skeletal muscle contraction and cardiacmuscle contraction, they differ in the members of the same gene family.The heart and muscle genes present in this pathway are given inTables 7 and 8. Pathway diagram was drawn using Path Designerfunction of IPA [18].doi:10.1371/journal.pone.0048238.g009
Non-Negative Matrix Factorization in Toxicology
PLOS ONE | www.plosone.org 18 December 2012 | Volume 7 | Issue 12 | e48238

of muscle1 cluster and 20 mg/kg dosage cluster of muscle4, and
between the top 100 probe-sets of muscle1 and vehicle dose cluster
of muscle4, 15 and 14 probe-sets were in common and are named
as muscle1muscle4 cluster 1 and muscle1muscle4 cluster 3,
respectively. The calcium signalling–skeletal muscle contraction
pathway is enriched in muscle1muscle4 cluster 1 with the presence
of ACTA1, ATP2A1, MYH1, MYH4, RYR1, TNNC2, TNNI2,
TNNT3 and TRDN genes, whereas muscle1muscle4 cluster 3
does not show any significant enrichment for signalling or
metabolic pathways.
Interestingly, 49 probe-sets in the liver1heart4 cluster 2 are
common between the top 100 probe-sets of liver1 cluster cluster
and 6 mg/kg dosage cluster of liver4 and highly enriched for acute
phase response signalling, prothrombin activation and FXR/RXR
activation pathways with the presence of ALB, ABCB11, AMBP,
APOA1, APOA2, APOC3, APOH, F2, FGA, FGB, FGG,
HAMP, HP, HPX, ORM1, PON1, RBP4, SERPINA1, SER-
PINC1, SLC27A5 and SLCO1B3 genes (Figure 11). This suggests
alterations in lipid metabolism in liver along with tissue injury in
heart induced by PPM-201 at 6 mg/kg dosage [30–33], which
becomes more plausible when we look at the genes in liver1liver4
cluster 1 that are common between the top liver4 genes and
20 mg/kg dosage cluster of liver4 dataset. Enrichment of toxicity
functions in liver1heart4 cluster 2 using IPA shows increased level
of LDH as one of the toxicity functions (Figure 12) which has been
validated with the increased level of LDH in the clinical chemistry
results.
Conclusions
We have demonstrated that multi-way simultaneous nonnega-
tive matrix factorization can be usefully applied to the case of
multiple datasets—here, for what we believe to be the first time,
more than two large scale matrices were treated. The results were
shown to be consistent with, and to add value to, standard
nonnegative matrix factorization of the whole dataset.
In summarizing our biological findings, we first note that the
roles of the three different isoforms of PPARs - PPAR-a, PPAR-b(also known as PPAR-d) and PPAR-c in metabolism and their
difference in expression in different tissues and different species are
well known [34–36]. In mouse, PPAR-a is highly expressed in liver
and to a lesser degree in kidney, heart and skeletal muscle; PPAR-
b is expressed in many tissues but peaks in kidney, heart and
intestine whereas PPAR-c is mostly expressed in adipose tissue
Figure 10. Liver genes enriched in FXR/RXR activation pathway IPA analysis of the top 100 probe-sets from the liver1 cluster(Figure 7) showed the enrichment of FXR/RXR activation pathway. The genes present in this pathway are highlighted in orange. The livergenes present in the pathway are given in Table 9. Pathway diagram was drawn using Path Designer function of IPA [18].doi:10.1371/journal.pone.0048238.g010
Non-Negative Matrix Factorization in Toxicology
PLOS ONE | www.plosone.org 19 December 2012 | Volume 7 | Issue 12 | e48238

Figure 11. Enrichment of canonical pathways in the liver heart gene cluster no. 2. This gene cluster has 49 common probe-sets betweenthe top one hundred most influential probe-sets in the liver gene cluster and top one hundred probe-sets in cluster number 2 (6 mg/kg dose rate) ofthe heart dataset reordered by 4-way simultaneous factorization. Canonical pathways enrichment for these 49 probe-sets analysed using the IPAsoftware is shown in this figure. The length of the bars shows the Fisher’s exact test p-value for enrichment for a particular pathway in the cluster.doi:10.1371/journal.pone.0048238.g011
Figure 12. Enrichment of toxicity functions in liver1 heart4 cluster 2. This gene cluster has 49 common probe-sets between the top onehundred most influential probe-sets in liver1 heart4 cluster 2 (6 mg/kg dose rate). Toxicity functions enrichment for these 49 probe-sets analysed usingthe IPA software is shown in this figure. The length of the bars shows the Fisher’s exact test p-value for enrichment for a particular pathway in the cluster.doi:10.1371/journal.pone.0048238.g012
Non-Negative Matrix Factorization in Toxicology
PLOS ONE | www.plosone.org 20 December 2012 | Volume 7 | Issue 12 | e48238

[34,37]. Pan-PPAR agonists activate two or all of the pan-PPAR
isoforms and differ in their pharmacological actions. Factorisation
of the dataset after splitting it on the tissue basis appears to be
beneficial in identifying tissue specific and dosage effects of the
experimental pan-PPAR agonist PPM-201 in this study. This
approach could be useful in understanding molecular mechanisms
and identifying potential tissue specific toxicological effects before
they are apparent in histopathology studies. In this study,
histopathology examination of heart did not show any defect
though our method of gene expression analysis could identify
enrichment of acute phase response signalling genes in heart that
may point towards building up of toxic responses in heart. Given
the fact that many PPAR agonist drugs have been shown to cause
cardiac toxicity on prolonged usage and FDA’s requirement of one
year toxicity study for PPAR agonist drugs, our results show
promising early detection of toxicity in the drug discovery process.
Overall, our aim here is to establish a proof of principle for the
approach of simultaneously analysing multiple, related large
datasets. We therefore focused on a dataset where clear-cut
validation is possible. However, we note that the technique is very
general, and therefore opens up many new opportunities in data-
driven computational biology. In particular, it can be applied to
heterogeneous sources of data; for example, generated by different
laboratories or experimental methodologies. We are currently
pursuing this approach in the study of colon cancer.
Acknowledgments
The computational work reported here made extensive use of the High
Performance Computer Facilities of the Faculty of Engineering and
Institute of Complex Systems at the University of Strathclyde. The authors
also acknowledge Plexxikon for use of the compound.
Author Contributions
Conceived and designed the experiments: CML MAVM DRH CRW GM
JKV DJH DC. Performed the experiments: CML MAVM DRH CRW
GM JKV DJH DC. Analyzed the data: CML MAVM JKV DJH DC.
Contributed reagents/materials/analysis tools: CML MAVM DRH CRW
GM JKV DJH DC. Wrote the paper: CML MAVM JKV DJH DC.
References
1. Lee DD, Seung HS (1999) Learning the parts of objects by non-negative matrix
factorization. Nature 401: 788–791.
2. Carmona-Saez P, Pascual-Marqui R, Tirado F, Carazo J, Pascual-Montano A(2006) Biclustering of gene expression data by non-smooth non-negative matrix
factorization. BMC Bioinformatics 7: 78.3. Brunet JP, Tamayo P, Golub TR, Mesirov JP (2004) Metagenes and molecular
pattern discovery using matrix factorisation. Proc Nat Acad Sci 101: 4164–4169.4. Fogel P, Young SS, Hawkins DM, Ledirac N (2007) Inferential, robust non-
negative matrix factorization analysis of microarray data. Bioinformatics 23: 44–
49.5. Kim H, Park H (2007) Sparse non-negative matrix factorizations via alternating
non-negativityconstrained least squares for microarray data analysis. Bioinfor-matics 23: 1495–1502.
6. Pascual-Montano AD, Carmona-Saez P, Chagoyen M, Tirado F, Carazo JM, et
al. (2006) bioNMF: a versatile tool for non-negative matrix factorization inbiology. BMC Bioinformatics 7: 366.
7. Gao Y, Church G (2005) Improving molecular cancer class discovery throughsparse non-negative matrix factorization. Bioinformatics 21: 3970–3975.
8. Devarajan K (2008) Nonnegative matrix factorization: An analytical andinterpretive tool in computational biology. PLoS Comput Biol 4: e1000029.
9. Badea L (2007) Combining gene expression and transcription factor regulation
data using simultaneous nonnegative matrix factorization. In: Proc. BIOCOMP-2007. pp. 127–131.
10. Badea L (2008) Extracting gene expression profiles common to colon andpancreatic adenocarcinoma using simultaneous nonnegative matrix factoriza-
tion. In: Proc. Pacific Symposium on Biocomputing PSB-2008. pp. 267–278.
11. Artis DR, Lin JJ, Zhang C,WangW,Mehra U, et al. (2009) Scaffold-baseddiscovery of indeglitazar, a ppar pan-active anti -diabetic agent. Proceedings of
the National Academy of Sciences 106: 262–267.12. Jones D (2010) Potential remains for PPAR-targeted drugs. Nature Reviews
Drug Discovery 9: 668–669.
13. Lee DD, Seung HS (2001) Algorithms for non-negative matrix factorization.Adv Neural Info Proc Syst 13: 556–562.
14. Monit S, Tamayo P, Mesirov J, Golub T (2003) Consensus clustering: aresampling-basedmethod for class discovery and visualization of gene expression
microarray data. Machine Learning 52: 91–118.15. Hall R (2001) Principles of clinical pathology for toxicology studies. In Principles
and methods of toxicology. Taylor and Francis, Philadelphia, 4th edition.
16. Florvall G, Basu S, Larsson A (2006) Apolipoprotein A1 is a stronger prognosticmarker than are HDL and LDL cholesterol for cardiovascular disease and
mortality in elderly men. The Journals of Gerontology Series A, BiologicalSciences and Medical Sciences 61: 1262–1266.
17. Huang DW, Sherman BT, Lempicki RA (2009) Systematic and integrative
analysis of large gene lists using DAVID bioinformatics resources. Nature Protoc4: 44–57.
18. Redwood City CISI (2011). Ingenuity: Ingenuity pathways analysis; version 8.8.19. Weiss A, McDonough D, Wertman B, Acakpo-Satchivi L, Montgomery K, et al.
(1999) Organization of human and mouse skeletal myosin heavy chain geneclusters is highly conserved. Proc Natl Acad Sci USA 96: 2958–63.
20. Zhang L, Kelley J, Schmeisser G, Kobayashi YM, Jones LR (1997) Complex
formation between junctin, triadin, calsequestrin, and the ryanodine receptor.
proteins of the cardiac junctional sarcoplasmic reticulum membrane. J Biol
Chem : 23389–97.
21. Jin J, Zhang Z, Bautista J (2008) Isoform diversity, regulation, and functional
adaptation of troponin and calponin. Crit Rev Eukaryot Gene Expr 18: 93–124.
22. Parmacek M, Bengur A, Vora A, Leiden J (1990) The structure and regulation of
expression of the murine fast skeletal troponin c gene. identification of a
developmentally regulated, muscle-specific transcriptional enhancer. J Biol
Chem 265: 15970–6.
23. Farah C, Reinach F (1995) The troponin complex and regulation of muscle
contraction. FASEB J 9: 755–67.
24. Perry S (2003) What is the role of tropomyosin in the regulation of muscle
contraction? J Muscle Res Cell Motil 24: 593–6.
25. Kobayashi T, Solaro R (2005) Calcium, thin filaments, and the integrative
biology of cardiac contractility. Annu Rev Physiol 67: 39–67.
26. Matsukuma K, Bennett M, Huang J, Wang L, Gil G, et al. (2006) Coordinated
control of bile acids and lipogenesis through fxr-dependent regulation of fatty
acid synthase. J Lipid Res 47: 2754–61.
27. Scotti E, Gilardi F, Godio C, Gers E, Krneta J, et al. (2007) Bile acids and their
signaling pathways: eclectic regulators of diverse cellular functions. Cell Mol Life
Sci 64: 2477–91.
28. Gadaleta R, van Mil S, Oldenburg B, Siersema P, Klomp L, et al. (2010) Bile
acids and their nuclear receptor fxr: Relevance for hepatobiliary and
gastrointestinal disease. Biochim Biophys Acta 1801: 683–92.
29. Rhee J, Inoue Y, Yoon J, Puigserver P, Fan M, et al. (2003) Regulation of
hepatic fasting response by ppargamma coactivator - 1alpha (pgc-1):
Requirement for hepatocyte nuclear factor 4alpha in gluconeogenesis. Proc
Natl Acad Sci USA 100: 4012–7.
30. Gervois P, Vu-Dac N, Kleemann R, Kockx M, Dubois G, et al. (2001) Negative
regulation of human fibrinogen gene expression by peroxisome proliferator-
activated receptor alpha agonists via inhibition of CCAAT box/enhancer-
binding protein beta. J Biol Chem 276: 33471–7.
31. Oldgren J, Wallentin L, Grip L, R L, Nørgaard BL, et al. (2003) Myocardial
damage, inflammation and thrombin inhibition in unstable coronary artery
disease. EurHeart J 24: 86–93.
32. Baumann H, Gauldie J (1994) The acute phase response. Immunol Today 15:
74–80.
33. T M (2010) Nuclear receptors in the regulation of lipid metabolism. Curr Cardio
Risk Rep 4: 142–149.
34. Kliewer SA, Forman BM, Blumberg B, Ong ES, Borgmeyer U, et al. (1994)
Differential expression and activation of a family of murine peroxisome
proliferator-activated receptors. Proc Natl Acad Sci, U S A 91: 7355–9.
35. Dreyer C, Krey G, Keller H, Givel F, Helftenbein G, et al. (1992) Control of the
peroxisomal beta-oxidation pathway by a novel family of nuclear hormone
receptors. Cell 68: 879–87.
36. Guo Y, Jolly R, Halstead B, Baker T, Stutz J, et al. (2007) Underlying
mechanisms of pharmacology and toxicity of a novel ppar agonist revealed using
rodent and canine hepatocytes. Toxicol Sci 96: 294–309.
37. Kersten S, Desvergne B, Wahli W (2000) Roles of PPARs in health and disease.
Nature 405: 421–4.
Non-Negative Matrix Factorization in Toxicology
PLOS ONE | www.plosone.org 21 December 2012 | Volume 7 | Issue 12 | e48238