
Lee & Associates 4Q2015 Manhattan Office Report
12
LEE NYC MANHATTAN TREND TRACKER 4Q2015 THE OFFICE MARKET REPORT
-
Upload
joel-herskowitz -
Category
Documents
-
view
281 -
download
0
Transcript of Lee & Associates 4Q2015 Manhattan Office Report
LEE NYCMANHATTAN TREND TRACKER4Q2015
THE OFFICE MARKET REPORT
HUDSONRIVER
EASTRIVER
PLAZAPLAZADISTRICTDISTRICTPLAZAPLAZAPLAZAPLAZAPLAZAPLAZAPLAZAPLAZAPLAZAPLAZAPLAZAPLAZAPLAZAPLAZA
DISTRICTDISTRICTDISTRICTDISTRICTDISTRICTDISTRICTDISTRICTDISTRICTDISTRICTDISTRICTDISTRICTDISTRICTDISTRICTDISTRICT
MIDTOWN WESTMIDTOWN WESTMIDTOWN WESTMIDTOWN WESTMIDTOWN WESTMIDTOWN WESTMIDTOWN WESTMIDTOWN WESTMIDTOWN WESTMIDTOWN WESTMIDTOWN WESTMIDTOWN WESTMIDTOWN WESTMIDTOWN WESTMIDTOWN WESTMIDTOWN WEST
MIDTOWN EASTMIDTOWN EASTMIDTOWN EASTMIDTOWN EASTMIDTOWN EASTMIDTOWN EASTMIDTOWN EASTMIDTOWN EASTMIDTOWN EASTMIDTOWN EASTMIDTOWN EASTMIDTOWN EASTMIDTOWN EASTMIDTOWN EASTMIDTOWN EASTMIDTOWN EASTMIDTOWN EASTMIDTOWN EASTMIDTOWN EAST
GRAND CENTRALGRAND CENTRALGRAND CENTRALGRAND CENTRALGRAND CENTRALGRAND CENTRALGRAND CENTRALGRAND CENTRALGRAND CENTRALGRAND CENTRALGRAND CENTRALGRAND CENTRALGRAND CENTRALGRAND CENTRALGRAND CENTRALGRAND CENTRALGRAND CENTRALGRAND CENTRALGRAND CENTRALGRAND CENTRALGRAND CENTRALGRAND CENTRALGRAND CENTRALGRAND CENTRALGRAND CENTRALGRAND CENTRALGRAND CENTRALGRAND CENTRALGRAND CENTRALGRAND CENTRALGRAND CENTRALGRAND CENTRALGRAND CENTRALGRAND CENTRAL
TIMES SQUARETIMES SQUARETIMES SQUARETIMES SQUARETIMES SQUARETIMES SQUARETIMES SQUARETIMES SQUARETIMES SQUARETIMES SQUARETIMES SQUARETIMES SQUARETIMES SQUARETIMES SQUARETIMES SQUARETIMES SQUARETIMES SQUARETIMES SQUARETIMES SQUARE
CITY HALLCITY HALLCITY HALL| INSURANCE DISTRICT| INSURANCE DISTRICT| INSURANCE DISTRICT| INSURANCE DISTRICT
CITY HALLCITY HALLCITY HALLCITY HALLCITY HALLCITY HALLCITY HALLCITY HALLCITY HALLCITY HALLCITY HALLCITY HALLCITY HALLCITY HALLCITY HALLCITY HALLCITY HALLCITY HALLCITY HALLCITY HALLCITY HALLCITY HALLCITY HALLCITY HALLCITY HALLCITY HALLCITY HALLCITY HALLCITY HALLCITY HALL| INSURANCE DISTRICT| INSURANCE DISTRICT| INSURANCE DISTRICT| INSURANCE DISTRICT| INSURANCE DISTRICT| INSURANCE DISTRICT| INSURANCE DISTRICT| INSURANCE DISTRICT| INSURANCE DISTRICT| INSURANCE DISTRICT| INSURANCE DISTRICT| INSURANCE DISTRICT| INSURANCE DISTRICT| INSURANCE DISTRICT| INSURANCE DISTRICT| INSURANCE DISTRICT| INSURANCE DISTRICT| INSURANCE DISTRICT| INSURANCE DISTRICT| INSURANCE DISTRICT| INSURANCE DISTRICT| INSURANCE DISTRICT| INSURANCE DISTRICT| INSURANCE DISTRICT| INSURANCE DISTRICT| INSURANCE DISTRICT| INSURANCE DISTRICT| INSURANCE DISTRICT| INSURANCE DISTRICT| INSURANCE DISTRICT| INSURANCE DISTRICT| INSURANCE DISTRICT| INSURANCE DISTRICT| INSURANCE DISTRICT| INSURANCE DISTRICT| INSURANCE DISTRICT| INSURANCE DISTRICT| INSURANCE DISTRICT| INSURANCE DISTRICT| INSURANCE DISTRICT| INSURANCE DISTRICT| INSURANCE DISTRICT| INSURANCE DISTRICT| INSURANCE DISTRICT| INSURANCE DISTRICT| INSURANCE DISTRICT| INSURANCE DISTRICT| INSURANCE DISTRICT| INSURANCE DISTRICT| INSURANCE DISTRICT| INSURANCE DISTRICT
WORLDWORLDWORLDTRADETRADECENTERCENTER
WORLDWORLDWORLDWORLDWORLDWORLDWORLDWORLDWORLDWORLDWORLDWORLDWORLDTRADETRADETRADETRADETRADETRADETRADETRADETRADETRADECENTERCENTERCENTERCENTERCENTERCENTERCENTERCENTERCENTERCENTER
FINANCIALDISTRICTDISTRICTDISTRICT
FINANCIALFINANCIALFINANCIALFINANCIALFINANCIALFINANCIALFINANCIALFINANCIALFINANCIALFINANCIALFINANCIALFINANCIALFINANCIALFINANCIALFINANCIALFINANCIALFINANCIALFINANCIALFINANCIALFINANCIALFINANCIALFINANCIALFINANCIALFINANCIALFINANCIALFINANCIALFINANCIALFINANCIALFINANCIALFINANCIALFINANCIALFINANCIALFINANCIALFINANCIALFINANCIALFINANCIALDISTRICTDISTRICTDISTRICTDISTRICTDISTRICTDISTRICTDISTRICTDISTRICTDISTRICTDISTRICTDISTRICTDISTRICTDISTRICTDISTRICTDISTRICTDISTRICTDISTRICTDISTRICTDISTRICTDISTRICTDISTRICTDISTRICTDISTRICTDISTRICTDISTRICTDISTRICTDISTRICTDISTRICTDISTRICTDISTRICTDISTRICTDISTRICTDISTRICTDISTRICTDISTRICTDISTRICTDISTRICT
ROCKEFELLERROCKEFELLERCENTERCENTER
ROCKEFELLERROCKEFELLERROCKEFELLERROCKEFELLERROCKEFELLERROCKEFELLERROCKEFELLERROCKEFELLERROCKEFELLERROCKEFELLERROCKEFELLERCENTERCENTERCENTERCENTERCENTERCENTERCENTERCENTERCENTERCENTERCENTER
PENN STATION | GARMENT DISTRICTPENN STATION | GARMENT DISTRICTPENN STATION | GARMENT DISTRICTPENN STATION | GARMENT DISTRICTPENN STATION | GARMENT DISTRICTPENN STATION | GARMENT DISTRICTPENN STATION | GARMENT DISTRICTPENN STATION | GARMENT DISTRICTPENN STATION | GARMENT DISTRICTPENN STATION | GARMENT DISTRICTPENN STATION | GARMENT DISTRICTPENN STATION | GARMENT DISTRICTPENN STATION | GARMENT DISTRICTPENN STATION | GARMENT DISTRICTPENN STATION | GARMENT DISTRICTPENN STATION | GARMENT DISTRICTPENN STATION | GARMENT DISTRICTPENN STATION | GARMENT DISTRICTPENN STATION | GARMENT DISTRICTPENN STATION | GARMENT DISTRICTPENN STATION | GARMENT DISTRICTPENN STATION | GARMENT DISTRICTPENN STATION | GARMENT DISTRICTPENN STATION | GARMENT DISTRICTPENN STATION | GARMENT DISTRICTPENN STATION | GARMENT DISTRICTPENN STATION | GARMENT DISTRICTPENN STATION | GARMENT DISTRICTPENN STATION | GARMENT DISTRICTPENN STATION | GARMENT DISTRICTPENN STATION | GARMENT DISTRICTPENN STATION | GARMENT DISTRICTPENN STATION | GARMENT DISTRICTPENN STATION | GARMENT DISTRICTPENN STATION | GARMENT DISTRICTPENN STATION | GARMENT DISTRICT
CHELSEACHELSEACHELSEACHELSEACHELSEACHELSEACHELSEACHELSEACHELSEACHELSEACHELSEACHELSEACHELSEA
MURRAY HILLMURRAY HILLMURRAY HILLMURRAY HILLMURRAY HILLMURRAY HILLMURRAY HILLMURRAY HILLMURRAY HILLMURRAY HILLMURRAY HILLMURRAY HILLMURRAY HILLMURRAY HILLMURRAY HILLMURRAY HILLMURRAY HILLMURRAY HILLMURRAY HILLMURRAY HILLMURRAY HILLMURRAY HILLMURRAY HILLMURRAY HILLMURRAY HILL
GRAMERCY | FLATIRONGRAMERCY | FLATIRONGRAMERCY | FLATIRONGRAMERCY | FLATIRONGRAMERCY | FLATIRONGRAMERCY | FLATIRONGRAMERCY | FLATIRONGRAMERCY | FLATIRONGRAMERCY | FLATIRONGRAMERCY | FLATIRONGRAMERCY | FLATIRONGRAMERCY | FLATIRONGRAMERCY | FLATIRONGRAMERCY | FLATIRONGRAMERCY | FLATIRONGRAMERCY | FLATIRONGRAMERCY | FLATIRONGRAMERCY | FLATIRONGRAMERCY | FLATIRONGRAMERCY | FLATIRONGRAMERCY | FLATIRONGRAMERCY | FLATIRONGRAMERCY | FLATIRONGRAMERCY | FLATIRONGRAMERCY | FLATIRONGRAMERCY | FLATIRONGRAMERCY | FLATIRONGRAMERCY | FLATIRONGRAMERCY | FLATIRON
SOHO | NOHOSOHO | NOHOSOHO | NOHOSOHO | NOHOSOHO | NOHOSOHO | NOHOSOHO | NOHOSOHO | NOHOSOHO | NOHOSOHO | NOHOSOHO | NOHOSOHO | NOHOSOHO | NOHOSOHO | NOHOSOHO | NOHOSOHO | NOHOSOHO | NOHOSOHO | NOHOSOHO | NOHOSOHO | NOHOSOHO | NOHOSOHO | NOHOSOHO | NOHOSOHO | NOHOSOHO | NOHOSOHO | NOHOSOHO | NOHOSOHO | NOHOSOHO | NOHOSOHO | NOHOSOHO | NOHOSOHO | NOHOSOHO | NOHO
HUDSON SQ.HUDSON SQ.| TRIBECA| TRIBECA| TRIBECA
HUDSON SQ.HUDSON SQ.HUDSON SQ.HUDSON SQ.HUDSON SQ.HUDSON SQ.HUDSON SQ.HUDSON SQ.HUDSON SQ.HUDSON SQ.HUDSON SQ.HUDSON SQ.HUDSON SQ.HUDSON SQ.HUDSON SQ.HUDSON SQ.HUDSON SQ.HUDSON SQ.HUDSON SQ.HUDSON SQ.HUDSON SQ.HUDSON SQ.HUDSON SQ.HUDSON SQ.HUDSON SQ.HUDSON SQ.HUDSON SQ.HUDSON SQ.HUDSON SQ.HUDSON SQ.HUDSON SQ.HUDSON SQ.HUDSON SQ.HUDSON SQ.HUDSON SQ.HUDSON SQ.HUDSON SQ.HUDSON SQ.HUDSON SQ.HUDSON SQ.| TRIBECA| TRIBECA| TRIBECA| TRIBECA| TRIBECA| TRIBECA| TRIBECA| TRIBECA| TRIBECA| TRIBECA| TRIBECA| TRIBECA| TRIBECA| TRIBECA| TRIBECA| TRIBECA| TRIBECA| TRIBECA| TRIBECA| TRIBECA| TRIBECA| TRIBECA| TRIBECA| TRIBECA| TRIBECA| TRIBECA| TRIBECA| TRIBECA| TRIBECA| TRIBECA| TRIBECA| TRIBECA| TRIBECA| TRIBECA| TRIBECA| TRIBECA| TRIBECA| TRIBECA| TRIBECA| TRIBECA| TRIBECA
FDR
DRI
VEFD
R D
RIVE
WES
T SI
DE
HIG
HW
AYW
EST
SID
E H
IGH
WAY
12TH
AVE
12TH
AVE
111TH
AVE
1TH
AVE
WES
T ST
WES
T ST
FDR
DRI
VEFD
R D
RIVE
AVEN
UE O
F TH
E A
MER
ICA
S
AVEN
UE O
F TH
E A
MER
ICA
S
AVEN
UE O
F TH
E A
MER
ICA
S
AVEN
UE O
F TH
E A
MER
ICA
S
AVEN
UE O
F TH
E A
MER
ICA
S
AVEN
UE O
F TH
E A
MER
ICA
S
AVEN
UE O
F TH
E A
MER
ICA
S
AVEN
UE O
F TH
E A
MER
ICA
S
AVEN
UE O
F TH
E A
MER
ICA
S
AVEN
UE O
F TH
E A
MER
ICA
S
AVEN
UE O
F TH
E A
MER
ICA
S
AVEN
UE O
F TH
E A
MER
ICA
S
AVEN
UE O
F TH
E A
MER
ICA
S
AVEN
UE O
F TH
E A
MER
ICA
S
AVEN
UE O
F TH
E A
MER
ICA
S
AVEN
UE O
F TH
E A
MER
ICA
S
AVEN
UE O
F TH
E A
MER
ICA
S
AVEN
UE O
F TH
E A
MER
ICA
S
AVEN
UE O
F TH
E A
MER
ICA
S
AVEN
UE O
F TH
E A
MER
ICA
S
AVEN
UE O
F TH
E A
MER
ICA
S
AVEN
UE O
F TH
E A
MER
ICA
S
AVEN
UE O
F TH
E A
MER
ICA
S
AVEN
UE O
F TH
E A
MER
ICA
S
AVEN
UE O
F TH
E A
MER
ICA
S
AVEN
UE O
F TH
E A
MER
ICA
S
AVEN
UE O
F TH
E A
MER
ICA
S
AVEN
UE O
F TH
E A
MER
ICA
S
AVEN
UE O
F TH
E A
MER
ICA
SAV
ENUE
OF
THE
AM
ERIC
AS
AVEN
UE O
F TH
E A
MER
ICA
SAV
ENUE
OF
THE
AM
ERIC
AS
AVEN
UE O
F TH
E A
MER
ICA
SAV
ENUE
OF
THE
AM
ERIC
AS
AVEN
UE O
F TH
E A
MER
ICA
SAV
ENUE
OF
THE
AM
ERIC
AS
AVEN
UE O
F TH
E A
MER
ICA
SAV
ENUE
OF
THE
AM
ERIC
AS
AVEN
UE O
F TH
E A
MER
ICA
SAV
ENUE
OF
THE
AM
ERIC
AS
AVEN
UE O
F TH
E A
MER
ICA
SAV
ENUE
OF
THE
AM
ERIC
AS
AVEN
UE O
F TH
E A
MER
ICA
SAV
ENUE
OF
THE
AM
ERIC
AS
AVEN
UE O
F TH
E A
MER
ICA
SAV
ENUE
OF
THE
AM
ERIC
AS
AVEN
UE O
F TH
E A
MER
ICA
SAV
ENUE
OF
THE
AM
ERIC
AS
AVEN
UE O
F TH
E A
MER
ICA
SAV
ENUE
OF
THE
AM
ERIC
AS
AVEN
UE O
F TH
E A
MER
ICA
S
8TH
AVE
8TH
AVE
8TH
AVE
8TH
AVE
BRO
ADW
AY
BRO
ADW
AY
BRO
ADW
AY
BRO
ADW
AY
BRO
ADW
AY
BRO
ADW
AYBR
OA
DWAY
BRO
ADW
AYBR
OA
DWAY
BRO
ADW
AY
BRO
ADW
AYBR
OAD
WAY
BRO
ADW
AYBR
OAD
WAY
BRO
ADW
AYBR
OAD
WAY
BRO
ADW
AYBR
OA
DWAY
BRO
ADW
AYBR
OA
DWAY
BRO
ADW
AY
BRO
ADW
AYBR
OA
DWAY
BRO
ADW
AYBR
OA
DWAY
BRO
ADW
AY
HUDS
ON
ST
HUDS
ON
ST
HUDS
ON
ST
HUDS
ON
ST
HUDS
ON
ST
HUDS
ON
ST
HUDS
ON
ST
VARI
CK S
TVA
RICK
ST
VARI
CK S
TVA
RICK
ST
VARI
CK S
TVA
RICK
ST
BRO
ADW
AYBR
OA
DWAY
BRO
ADW
AYBR
OA
DWAY
BRO
ADW
AY
W B
ROA
DWAY
W B
ROA
DWAY
W B
ROA
DWAY
W B
ROA
DWAY
W B
ROA
DWAY
BRO
ADW
AYBR
OA
DWAY
BRO
ADW
AYBR
OA
DWAY
BRO
ADW
AYBR
OA
DWAY
BRO
ADW
AYBR
OA
DWAY
BRO
ADW
AYBR
OA
DWAY
BRO
ADW
AYBR
OA
DWAY
BRO
ADW
AYTRIN
ITY P
LTR
INITY
PL
TRIN
ITY P
LTR
INITY
PL
WILL
IAM
ST
WILL
IAM
ST
WILL
IAM
ST
WILL
IAM
ST
WILL
IAM
ST
GO
LD S
TG
OLD
ST
GO
LD S
TG
OLD
ST W
ATER
ST
WAT
ER S
TW
ATER
ST
WAT
ER S
TW
ATER
ST
WAT
ER S
T
8TH
AVE
8TH
AVE
8TH
AVE
8TH
AVE
110TH
AVE
0TH
AVE
0TH
AVE
0TH
AVE
1110TH
AVE
0TH
AVE
0TH
AVE
0TH
AVE
0TH
AVE
CEN
TRA
L PA
RK W
EST
CEN
TRA
L PA
RK W
EST
CEN
TRA
L PA
RK W
EST
CEN
TRA
L PA
RK W
EST
CEN
TRA
L PA
RK W
EST
CEN
TRA
L PA
RK W
EST
CEN
TRA
L PA
RK W
EST
CEN
TRA
L PA
RK W
EST
CEN
TRA
L PA
RK W
EST
CEN
TRA
L PA
RK W
EST
CEN
TRA
L PA
RK W
EST
CEN
TRA
L PA
RK W
EST
CEN
TRA
L PA
RK W
EST
CEN
TRA
L PA
RK W
EST
CEN
TRA
L PA
RK W
EST
CENTRAL PARK SOUTHCENTRAL PARK SOUTHCENTRAL PARK SOUTHCENTRAL PARK SOUTHCENTRAL PARK SOUTHCENTRAL PARK SOUTHCENTRAL PARK SOUTHCENTRAL PARK SOUTHCENTRAL PARK SOUTHCENTRAL PARK SOUTHCENTRAL PARK SOUTHCENTRAL PARK SOUTHCENTRAL PARK SOUTH
AVEN
UE O
F TH
E A
MER
ICA
SAV
ENUE
OF
THE
AM
ERIC
AS
AVEN
UE O
F TH
E A
MER
ICA
SAV
ENUE
OF
THE
AM
ERIC
AS
AVEN
UE O
F TH
E A
MER
ICA
SAV
ENUE
OF
THE
AM
ERIC
AS
AVEN
UE O
F TH
E A
MER
ICA
SAV
ENUE
OF
THE
AM
ERIC
AS
AVEN
UE O
F TH
E A
MER
ICA
SAV
ENUE
OF
THE
AM
ERIC
AS
AVEN
UE O
F TH
E A
MER
ICA
SAV
ENUE
OF
THE
AM
ERIC
AS
AVEN
UE O
F TH
E A
MER
ICA
SAV
ENUE
OF
THE
AM
ERIC
AS
AVEN
UE O
F TH
E A
MER
ICA
SAV
ENUE
OF
THE
AM
ERIC
AS
AVEN
UE O
F TH
E A
MER
ICA
SAV
ENUE
OF
THE
AM
ERIC
AS
AVEN
UE O
F TH
E A
MER
ICA
SAV
ENUE
OF
THE
AM
ERIC
AS
AVEN
UE O
F TH
E A
MER
ICA
SAV
ENUE
OF
THE
AM
ERIC
AS
5TH
AVE
5TH
AVE
5TH
AVE
5TH
AVE
5TH
AVE
1ST
AVE
1ST
AVE
1ST
AVE
1ST
AVE
1ST
AVE
1ST
AVE
1ST
AVE
1ST
AVE
1ST
AVE
1ST
AVE
1ST
AVE
1ST
AVE
1ST
AVE
1ST
AVE
1ST
AVE
1ST
AVE
1ST
AVE
AVE
AAV
E A
AVE
AAV
E A
ALL
EN S
TA
LLEN
ST
ALL
EN S
TA
LLEN
ST
ALL
EN S
T
BOW
ERY
BOW
ERY
BOW
ERY
BOW
ERY
DELANCEY STDELANCEY ST
DELANCEY STDELANCEY STDELANCEY STDELANCEY STDELANCEY STDELANCEY ST
E HOUSTON STE HOUSTON STE HOUSTON STE HOUSTON STE HOUSTON STE HOUSTON ST
W HOUSTON STW HOUSTON STW HOUSTON STW HOUSTON STW HOUSTON STW HOUSTON STW HOUSTON ST
W HOUSTON ST
W HOUSTON ST
W HOUSTON ST
W HOUSTON ST
W HOUSTON ST
W HOUSTON ST
GANESEVOORT ST
GANESEVOORT ST
GANESEVOORT ST
GANESEVOORT ST
GANESEVOORT ST
GANESEVOORT ST
GANESEVOORT ST
W 4TH STW 4TH STW 4TH STW 4TH ST E 4TH STE 4TH STE 4TH ST
CHAMBERS STCHAMBERS STCHAMBERS STCHAMBERS STCHAMBERS STCHAMBERS STCHAMBERS STCHAMBERS STCHAMBERS STCHAMBERS STCHAMBERS STCHAMBERS STCHAMBERS ST
VESEY STVESEY STVESEY STVESEY STVESEY STVESEY STVESEY STVESEY ST
PARK PLPARK PLPARK PL
WORTH STWORTH STWORTH STWORTH STWORTH ST
FRANKLIN ST
FRANKLIN ST
FRANKLIN ST
FRANKLIN ST
FRANKLIN ST
WALL STWALL STWALL STWALL ST
BATTERYBATTERYBATTERYBATTERYBATTERYBATTERY
PLPL
BEAVER ST
BEAVER ST
BEAVER ST
BEAVER ST
BEAVER ST
CANAL STCANAL STCANAL STCANAL STCANAL STCANAL STCANAL ST
CANAL ST
CANAL ST
CANAL ST
CANAL ST
CANAL ST
CANAL ST
CANAL ST
CANAL ST
CANAL ST
CANAL ST
CANAL ST
PARK
ROW
PARK
ROW
PARK
ROW
PARK
ROW
PARK
ROW
PARK
ROW
PARK
ROW
PARK
ROW
CEN
TRE
STCE
NTR
E ST
CEN
TRE
STCE
NTR
E ST
5TH
AVE
5TH
AVE
5TH
AVE
5TH
AVE
5TH
AVE
LEXI
NG
TON
AVE
LEXI
NG
TON
AVE
LEXI
NG
TON
AVE
LEXI
NG
TON
AVE
LEXI
NG
TON
AVE
LEXI
NG
TON
AVE
LEXI
NG
TON
AVE
LEXI
NG
TON
AVE
LEXI
NG
TON
AVE
LEXI
NG
TON
AVE
LEXI
NG
TON
AVE
LEXI
NG
TON
AVE
5TH
AVE
5TH
AVE
5TH
AVE
5TH
AVE
5TH
AVE
W 14TH STW 14TH STW 14TH STW 14TH STW 14TH ST
W 23RD STW 23RD STW 23RD ST E 23RD STE 23RD STE 23RD STE 23RD ST
W 34TH STW 34TH STW 34TH ST E 34TH STE 34TH STE 34TH ST
W 42ND STW 42ND STW 42ND ST E 42ND STE 42ND STE 42ND STE 42ND STE 42ND ST
W 47TH STW 47TH STW 47TH ST E 47TH STE 47TH STE 47TH STE 47TH STE 47TH STE 47TH STE 47TH ST
W 57TH STW 57TH STW 57TH ST E 57TH STE 57TH STE 57TH ST
E 14TH STE 14TH STE 14TH STE 14TH STE 14TH STE 14TH STE 14TH STE 14TH ST
CEN
TRA
L PA
RK W
EST
CEN
TRA
L PA
RK W
EST
CEN
TRA
L PA
RK W
EST
CEN
TRA
L PA
RK W
ESTW 65TH STW 65TH STW 65TH STW 65TH STW 65TH STW 65TH STW 65TH ST E 65TH STE 65TH STE 65TH STE 65TH STE 65TH ST
LEE NYCMANHATTAN TREND TRACKER4Q2015
MANHATTAN TREND TRACKER 4TH QUARTER 20152
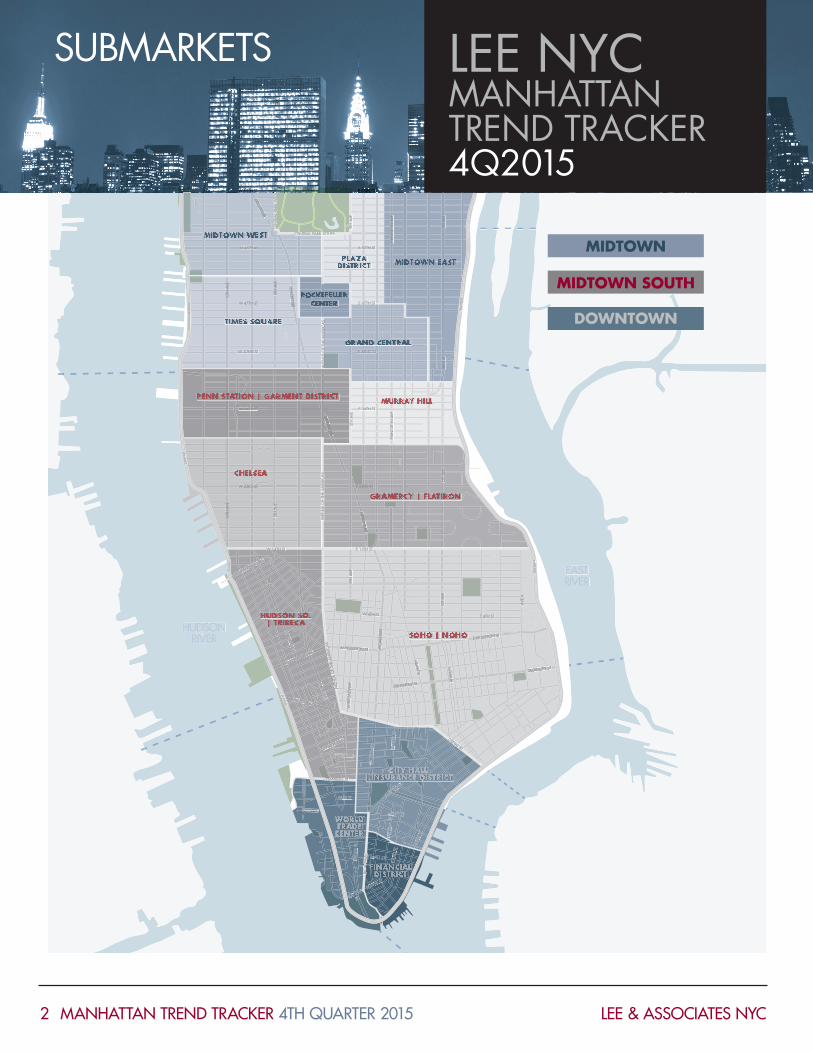
SUBMARKETS
MIDTOWN
MIDTOWN SOUTH
DOWNTOWN
LEE & ASSOCIATES NYC

MANHATTAN TREND TRACKER 4TH QUARTER 20153 LEE & ASSOCIATES NYC
MARKET SUMMARY LEE NYCMANHATTAN TREND TRACKER4Q2015
Market Inventory(MSF)
AvailableTotal(SF)
TotalVacancy
Rate(%)
TotalAvailability
Rate(%)
TotalNet
Absorption(SF)
UnderConstruction
(SF)
DirectAskingRent
($PSF)
Sublease AskingRent
($PSF)
Overall AskingRent
($PSF)Midtown 224 25,736,211 7.8% 11.5% -13,749 757,717 $82.68 $64.10 $80.14
Grand Central 71 10,616,412 9.5% 14.9% 91,625 - $74.03 $61.01 $72.70 Midtown East 25 1,721,964 3.9% 6.8% 98,683 - $72.33 $57.75 $70.24 Midtown West 20 1,525,485 5.2% 7.5% 37,957 87,717 $74.73 $50.31 $71.82 Plaza District 39 4,239,128 8.0% 10.8% (160,077) 670,000 $114.43 $74.32 $110.04 Rockefeller Plaza 30 2,345,828 4.9% 7.8% 342,476 - $82.52 $47.79 $75.30 Times Square 38 5,287,394 10.9% 13.9% (424,413) - $74.36 $73.90 $74.25
Midtown South 150 12,600,613 5.8% 8.4% 227,362 8,719,609 $69.23 $53.81 $66.14 Chelsea 18 1,084,397 4.0% 6.0% 81,570 128,367 $58.77 $60.45 $59.11 Gramercy | Flatiron 30 2,162,677 5.1% 7.2% 108,721 - $75.31 $59.17 $72.47 Hudson Square | Tribeca 22 2,560,972 8.2% 11.7% 331,021 120,413 $73.87 $59.54 $72.33 Murray Hill 13 1,098,129 5.5% 8.6% (156,269) - $64.68 $50.20 $60.86 Penn Station-Garment 54 4,984,752 6.3% 9.3% (95,185) 8,398,829 $67.10 $49.55 $62.92 SoHo | NoHo 13 709,686 4.0% 5.7% (42,496) 72,000 $72.58 $66.75 $71.72
Downtown 104 12,073,248 10.0% 11.5% 1,195,903 2,861,402 $61.60 $46.49 $59.75 City Hall | Insurance Dist. 27 1,413,937 4.5% 5.2% (110,900) - $51.91 $40.33 $50.85 Financial District 43 5,416,158 10.3% 12.6% 423,583 - $55.54 $44.06 $53.47 World Trade Center 34 5,243,153 13.9% 15.2% 883,220 2,861,402 $68.56 $55.41 $67.75
Manhattan 478 50,410,072 7.7% 10.6% 1,409,516 12,338,728 $74.49 $57.34 $71.94
2015 | 4Q Manhattan Office
Commenced with report, 1Q 2015, Lee & Associates utilizes new metric methods from its prior reporting methods. Lee & Associates Office Metrics are based on office buildings with a minimum rentable building area of 100,000 square feet, with the exception in the submarket of Soho/Noho, which uses metrics based on office buildings with a minimum rentable building area of 50,000 square feet. Lee & Associates Office Metrics comprise data representing existing office buildings for Classes A, B and C. Since new metric methods have been applied, the correlation of data for this report (and all reports since 1Q 2015) will have no bearing over the reports previously published by Lee & Associates (prior to 1Q 2015).
1. Under Construction only includes buildings with expected deliveries, with a primary office use and over 50,000 square feet. Buildings under construction that include office as a secondary or tertiary use are excluded. All proposed new construction buildings were excluded.2. All rent figures are based on market and submarket weighted averages. Overall Asking Rents take Direct and Sublease rents into account.
Lee & Associates NYC accepts no liability or responsibility for the accuracy or completeness of the information contained herein and no reliance should beplaced on the information contained in this document.
Market Inventory(MSF)
AvailableTotal(SF)
TotalVacancy
Rate(%)
TotalAvailability
Rate(%)
TotalNet
Absorption(SF)
UnderConstruction
(SF)
DirectAskingRent
($PSF)
Sublease AskingRent
($PSF)
Overall AskingRent
($PSF)Midtown 224 25,736,211 7.8% 11.5% -13,749 764,124 $82.68 $64.10 $80.14
Grand Central 71 10,616,412 9.5% 14.9% 91,625 - $74.03 $61.01 $72.70 Midtown East 25 1,721,964 3.9% 6.8% 98,683 - $72.33 $57.75 $70.24 Midtown West 20 1,525,485 5.2% 7.5% 37,957 94,124 $74.73 $50.31 $71.82 Plaza District 39 4,239,128 8.0% 10.8% (160,077) 670,000 $114.43 $74.32 $110.04 Rockefeller Plaza 30 2,345,828 4.9% 7.8% 342,476 - $82.52 $47.79 $75.30 Times Square 38 5,287,394 10.9% 13.9% (424,413) - $74.36 $73.90 $74.25
Midtown South 150 12,600,613 5.8% 8.4% 227,362 8,719,609 $69.23 $53.81 $66.14 Chelsea 18 1,084,397 4.0% 6.0% 81,570 128,367 $58.77 $60.45 $59.11 Gramercy | Flatiron 30 2,162,677 5.1% 7.2% 108,721 - $75.31 $59.17 $72.47 Hudson Square | Tribeca 22 2,560,972 8.2% 11.7% 331,021 120,413 $73.87 $59.54 $72.33 Murray Hill 13 1,098,129 5.5% 8.6% (156,269) - $64.68 $50.20 $60.86 Penn Station-Garment 54 4,984,752 6.3% 9.3% (95,185) 8,398,829 $67.10 $49.55 $62.92 SoHo | NoHo 13 709,686 4.0% 5.7% (42,496) 72,000 $72.58 $66.75 $71.72
Downtown 104 12,073,248 10.0% 11.5% 1,195,903 2,861,402 $61.60 $46.49 $59.75 City Hall | Insurance Dist. 27 1,413,937 4.5% 5.2% (110,900) - $51.91 $40.33 $50.85 Financial District 43 5,416,158 10.3% 12.6% 423,583 - $55.54 $44.06 $53.47 World Trade Center 34 5,243,153 13.9% 15.2% 883,220 2,861,402 $68.56 $55.41 $67.75
Manhattan 478 50,410,072 7.7% 10.6% 1,409,516 12,345,135 $74.49 $57.34 $71.94
2015 | 4Q Manhattan Office
Commenced with report, 1Q 2015, Lee & Associates utilizes new metric methods from its prior reporting methods. Lee & Associates Office Metrics are based on office buildings with a minimum rentable building area of 100,000 square feet, with the exception in the submarket of Soho/Noho, which uses metrics based on office buildings with a minimum rentable building area of 50,000 square feet. Lee & Associates Office Metrics comprise data representing existing office buildings for Classes A, B and C. Since new metric methods have been applied, the correlation of data for this report (and all reports since 1Q 2015) will have no bearing over the reports previously published by Lee & Associates (prior to 1Q 2015).
1. Under Construction only includes buildings with expected deliveries, with a primary office use and over 50,000 square feet. Buildings under construction that include office as a secondary or tertiary use are excluded. All proposed new construction buildings were excluded.2. All rent figures are based on market and submarket weighted averages. Overall Asking Rents take Direct and Sublease rents into account.
Lee & Associates NYC accepts no liability or responsibility for the accuracy or completeness of the information contained herein and no reliance should beplaced on the information contained in this document.

The Midtown market turned the quarter with a consecutive negative net absorption (-13,749), mostly stimulated by the
Times Square submarket. Nevertheless, year-end net absorption was close to positive million-square-feet. Availability increased in four of the six submarkets, pushing Midtown’s availability rate upwards by 50 basis points (11.5%). Sublease activity was cut to half of what it was two quarters ago (49.8% decrease) and direct rents increased by $0.74.
Grand Central would have remained strong if not for an increase in available offi ce space, which escalated by almost 8% since last quarter (13.8% to 14.9%). In spite of the market’s 60% absorption decrease since 2015Q3, it managed to output a positive net absorption (91,625). Sublease vacancy dropped for the fourth consecutive quarter (0.7%), while retaining the annual availability average of 1.3%, escalating sublease rents by $2.08 quarter-to-quarter. NOTABLE DEALS: Indeed.com doubled its company footprint by leasing 81,225 square feet at the Hippodrome building (1120 Avenue of the Americas), relocating from 125 West 55th Street. Reported rent for the deal was in the high $60s. Law fi rm Golenbock Eisman Assor Bell & Peskoe LLP took 38,050 square feet for ten years at 711 Third Avenue, with a reported rent in the low $60s. Both major deals were below market asking rents. Coming in above market, NY-based hedge fund Fir Tree, Inc., took 31,126 square feet for ten years at SL Green’s Tower 46 (55 West 46th Street), with a reported rent in the mid-$90s.
Midtown East (aka Plaza District East) gained 80 basis points in its availability rate (6.8%), while decreasing by 40 basis points in its vacancy rate. The submarket turned a negative net absorption from last quarter to a positive this quarter, even with a rise in available supply. Direct rents increased $0.60 and sublet rents decreased by $2.35 with an increase of 30 basis points in sublet availability. Leasing activity rose 21.5% since last quarter. Interestingly, the combined square footage leased this quarter and in Q3 (666,710 SF) is approximately 100,000 square feet less than what it was in Q2. NOTABLE DEALS: Aksia Research & Management expanded 17,627 square feet at Boston Properties’ 599 Lexington Avenue, with a reported rent in the low $90s.
Midtown West vacancy decreased for the third consecutive quarter to end the year at 5.2%. Availability remained at 7.5%. Leasing activity drastically increased by 75% since last quarter, forcing a positive net absorption for the second consecutive quarter. Since Q1, direct asking rents are up $3.03. NOTABLE DEALS: Architecture fi rm Gensler signed close to 120,000 square feet at
1700 Broadway on a 12-year deal. Reported rents for the mega-deal were in the low $50s. Non-profi t NY Stem Cell Foundation took 41,200 square feet at the Movie Labs Building (619 West 54th Street), where landlord Taconic Investment Partners was asking in the low-to-mid-$40s. Cook+Fox Architects leased and designed its new space at 250 West 57th Street, for 20,000 square feet on a 16-year term. Reported rents for the architecture fi rm are in the low $60s.
Plaza District performance either underperformed or remained steady, depending on which analyst deciphers the submarket. The trophy tower submarket saw a 40 basis point vacancy decrease while adding 70 basis points to its availability rate. Although direct rents remained as they did in Q3 (only a $0.28 increase), overall asking rents rose by $2.43 to $110.04. The submarket’s solid past two quarter performances was tarnished by a negative net absorption of 160,077 square feet, in spite of a 29% leasing activity increase. NOTABLE DEALS: WeWork Companies subleased over 100,000 square feet at the Colgate-Palmolive Building (300 Park Avenue) for seven years, where the sublease asking rent was in the low $60s. Paramount Group paid an all-cash deal for remaining equity of 36% at 31 West 52nd Street. The investor paid $230,000,000 for the stake. The asset’s value was at $1.06 billion.
Rockefeller Plaza vacancy was down for the sixth consecutive quarter, by 1.1 percentage points since last quarter. Availability increased by 30 basis points. Net absorption also remained positive for six consecutive quarters, with the submarket seeing its largest positive net absorption since 2013Q1. NOTABLE DEALS: Financial and investment advisory fi rm Oaktree Capital Management renewed and expanded its footprint at the Credit Agricole Building (1301 Avenue of the Americas) to 54,240 square feet, on a ten-year deal. Reported rents were in the mid-to-high $80s.
Times Square continued to have the biggest impact on Midtown rates (not necessarily rents). The submarket has the highest vacancy and availability in Midtown. Net absorption has remained negative for fi ve consecutive quarters with a combined negative net absorption of 2,033,636 square feet. Vacancy increased by 1.2 percentage points, while availability decreased by 80 basis points. Times Square is the only Midtown submarket where direct rents have decreased by $0.74. NOTABLE DEALS: The Media Arts Building (311 West 43rd Street) was purchased for $107 million by William Macklowe Company and Principal Financial Group. Additionally, Paramount Group completed its $1 billion refi nancing of 1633 Broadway.
LEE NYCMANHATTAN TREND TRACKER4Q2015
MIDTOWN
MANHATTAN TREND TRACKER 4TH QUARTER 20154 LEE & ASSOCIATES NYC

MIDTOWN
MANHATTAN TREND TRACKER 4TH QUARTER 20155
MIDTOWN LEE NYCMANHATTAN TREND TRACKER4Q2015
LEE & ASSOCIATES NYC
7.3%
11.0%
0.0%
2.0%
4.0%
6.0%
8.0%
10.0%
12.0%
14.0%
16.0%
1Q2006
3Q2006
1Q2007
3Q2007
1Q2008
3Q2008
1Q2009
3Q2009
1Q2010
3Q2010
1Q2011
3Q2011
1Q2012
3Q2012
1Q2013
3Q2013
1Q2014
3Q2014
1Q2015
3Q2015
Midtown Vacancy and Availability
Vacancy Availability 10Y Vacancy Avg. 10Y Availability Avg.
4,264,255
- 1,000,000 2,000,000 3,000,000 4,000,000 5,000,000 6,000,000 7,000,000 8,000,000
1Q2006
3Q2006
1Q2007
3Q2007
1Q2008
3Q2008
1Q2009
3Q2009
1Q2010
3Q2010
1Q2011
3Q2011
1Q2012
3Q2012
1Q2013
3Q2013
1Q2014
3Q2014
1Q2015
3Q2015
Midtown Leasing Activity
SF Leased 10Y Avg.
(2,500,000)(2,000,000)(1,500,000)(1,000,000)
(500,000)0
500,0001,000,0001,500,0002,000,0002,500,0003,000,000
1Q2006
3Q2006
1Q2007
3Q2007
1Q2008
3Q2008
1Q2009
3Q2009
1Q2010
3Q2010
1Q2011
3Q2011
1Q2012
3Q2012
1Q2013
3Q2013
1Q2014
3Q2014
1Q2015
3Q2015
Midtown Net Absorption

MIDTOWN SOUTH
MANHATTAN TREND TRACKER 4TH QUARTER 20156
M idtown South continues to strengthen, proving to be the most popular of Manhattan’s three main offi ce markets.
Availability in the market constrained by 3.4% (availability rate is down to 8.4% from 8.7% since last quarter) and it experienced its seventh consecutive quarter of positive net absorption, even though leasing activity decreased for the sixth consecutive quarter. Rents continue to gradually increase, albeit rather slowly, with overall rents increasing by $0.50.
Chelsea still has one of the lowest vacancy rates with one of the tightest supplies of available offi ce space. Availability shrunk by 60 basis points, with an uptick of 30 basis points in the vacancy rate. Rents in the submarket have seen upswing movements. Quarter-to-quarter, direct asking rents are up by $1.72, sublease rents $3.84, and overall rents have increased by $2.14. Chelsea’s sublet market accounts for less than 1% of inventory. NOTABLE DEALS: Sporting goods manufacturer Peloton Interactive leased 40,727 square feet at 125 West 25th Street. Reported rents were in the low $70s.
Gramercy and Flatiron took the mantle as the top Midtown South submarket. With the highest direct rents in the market (at $75.31), this submarket continues to take advantage of its offi ce inventory stock, catering to TAMI tenants. Vacancy and availability have both declined since last quarter, with vacancy shedding by 60 basis points and availability by 90 basis points. NOTABLE DEALS: Digital advertising fi rm Criteo expanded to 60,000 square feet at TF Cornerstone’s Bryce Building (387 Park Avenue South). Asking rents were in the low $80s. Architectural fi rm Perkins Eastman signed a 77,000 square foot renewal at Winter Organization’s 115 Fifth Avenue. IMG Worldwide leased an additional 18,045 square feet at 304 Park Avenue, bringing its footprint at the SL Green Realty building to 112,623 square feet.
Hudson Square and Tribeca closed out the year with a major reduction in vacancy, a 150 basis point drop. The submarket turned over a positive net absorption of 331,021, compared to last quarter’s negative net absorption of 375,235. Volatility was heavily felt in the sublet market. Sublease vacancy dropped by 80 basis points, pushing sublease rents up by $7.83 to $59.54 per square foot. Leasing activity continued to drop since Q1 and will likely remain stagnant or reduce further. NOTABLE DEALS: Norges
Bank took an interest stake of 44% in a portfolio comprising 11 offi ce properties located in the submarket. The Norway fund invested $1.56 billion into the offi ce properties numbered on Varick Street (75 and 225) and Hudson Street (200, 205, 345, 350 and 435); including 10 Hudson Square, 100 & 155 Avenue of the Americas and 12-16 Vestry Street.
Murray Hill led Midtown South with the highest negative net absorption this quarter, at 156,269 square feet. The submarket did not follow the quarter’s spread of vacancy drops in Manhattan, instead seeing a vacancy increase of 1.2 percentage points. Additionally, its availability rate increased by 30 basis points. NOTABLE DEALS: Furniture design company Bernhardt Design signed a ten-year lease at 136 Madison Avenue for 20,332 square feet. Across the street at 135 Madison Avenue, co-working startup Blender Workspace signed a 10.5-year lease for 14,430 square feet. The asking rent was $58-per-square-foot.
The Penn Station-Garment submarket remained consistent with its Q3 performance, with subtle changes in vacancy (up 20 basis points) and availability (down 10 basis points). Direct asking rents increase by half a dollar. This quarter was the fi rst time the submarket’s leasing activity was below the 1,000,000-square-feet threshold it held for so long, since 2009Q2. NOTABLE DEALS: Excell will be relocating from 295 Fifth Avenue to 3 Herald Square (1333 Broadway), taking 29,566 square feet. Apparel manufacturing fi rm Alfred Dunner subleased close to 60,000 square feet at the same building.
The SoHo and NoHo submarkets saw a cooling down period at the close of 2015. Vacancy increased by 30 basis points, remaining the lowest in Manhattan (tied with Chelsea). Availability decreased drastically, by 240 basis points. SoHo/NoHo provides evidence of the volatility of leasing activity in the southern portion of Midtown South. The submarket’s sublease rents increased by $9.65. Nevertheless, overall asking rents were balanced out with a $2.78 decrease in direct asking rents, pushing overall asking rents up only $0.67 from last quarter. NOTABLE DEALS: WeWork Companies leased 75,000 square feet at 524 Broadway, continuing its never-ceasing expansion.
LEE NYCMANHATTAN TREND TRACKER4Q2015
LEE & ASSOCIATES NYC

MIDTOWN SOUTH
MANHATTAN TREND TRACKER 4TH QUARTER 20157
LEE NYCMANHATTAN TREND TRACKER4Q2015
LEE & ASSOCIATES NYC
6.2%
9.7%
0.0%
2.0%
4.0%
6.0%
8.0%
10.0%
12.0%
14.0%
1Q2006
3Q2006
1Q2007
3Q2007
1Q2008
3Q2008
1Q2009
3Q2009
1Q2010
3Q2010
1Q2011
3Q2011
1Q2012
3Q2012
1Q2013
3Q2013
1Q2014
3Q2014
1Q2015
3Q2015
Midtown South Vacancy and Availability
Vacancy Availability 10Y Vacancy Avg. 10Y Availability Avg.
3,038,503
-
1,000,000
2,000,000
3,000,000
4,000,000
5,000,000
6,000,000
7,000,000
8,000,000
1Q2006
3Q2006
1Q2007
3Q2007
1Q2008
3Q2008
1Q2009
3Q2009
1Q2010
3Q2010
1Q2011
3Q2011
1Q2012
3Q2012
1Q2013
3Q2013
1Q2014
3Q2014
1Q2015
3Q2015
Midtown South Leasing Activity
SF Leased 10Y Avg.
(1,200,000)(1,000,000)
(800,000)(600,000)(400,000)(200,000)
0200,000400,000600,000800,000
1,000,000
1Q2006
3Q2006
1Q2007
3Q2007
1Q2008
3Q2008
1Q2009
3Q2009
1Q2010
3Q2010
1Q2011
3Q2011
1Q2012
3Q2012
1Q2013
3Q2013
1Q2014
3Q2014
1Q2015
3Q2015
Midtown South Net Absorption
Net Absorption

DOWNTOWN
MANHATTAN TREND TRACKER 4TH QUARTER 20158
The Downtown market continues to perform strongly, thanks to its attraction of new tenants from Midtown, where
direct asking rents are, on average, 25.5% higher. For instance, relocating west of Broadway in the World Trade Center and World Financial Center submarkets provides tenants with similar Class-A offi ce inventory as does Midtown. However, direct asking rents between this Downtown submarket and Midtown’s most affordable submarket of Midtown East, provide an average discount of 5%. The discount is greater between other, more expensive, Midtown submarkets. Downtown experienced a drop in vacancy by 100 basis points and a drop in availability by 60 basis points. The market saw another quarter of positive net absorption over a million square feet (Q2 & Q4), even though it ended the year with less than a million square feet in leasing activity (988,408 square feet). Rents are gradually going up each quarter, despite the high rents at the World Trade Center and World Financial Center towers. We forecast that Downtown overall asking rents will breach the $70-per-square-foot mark next quarter.
Rents in the City Hall and Insurance District submarkets have increased across the board, with direct asking rents up by $1.40; sublet rents up $0.69; and overall asking rents up by $1.17. The submarket’s vacancy and availability also performed better this quarter, with a vacancy drop of just 10 basis points but an availability drop of 90 basis points. Unfortunately, the submarket has a negative net absorption for two consecutive quarters. NOTABLE DEALS: RSA Mortgage Brokerage leased 17,582 square feet at 123 William Street, which was asking rents in the high $40s.
The Financial District had a stable and improving performance to close out the year. Rents are gradually edging upwards, all within less than a dollar. The submarket’s vacancy and availability is down by 60 basis points, with three consecutive
quarters of positive net absorption, combining for a total of 1,332,403 square feet. This balances out the end-of-year to a positive net absorption of 191,432 square feet, since Q1 saw an abundance of space due to the delivery of One World Trade Center. NOTABLE DEALS: The Teachers Retirement System of the City of New York expanded and renewed its footprint at 55 Water Street, to 191,138 square feet.
The World Trade Center and World Financial Center submarket had one of the better and stronger performances in Manhattan this quarter. Across the board, the submarket got stronger, hence the rise in rents. Direct asking rents are up this quarter from last by $0.69, sublet rents increased by $4.46, and overall asking rents are up by $1.11. Vacancy in the submarket is still high compared to other submarkets in the city, although it did drop 250 basis points. If not for Q3, the submarket would have seen a decline in vacancy for six consecutive quarters. Availability dropped only 40 basis points, but decreased for the third consecutive quarter. The quarter had a positive net absorption of 883,220 square feet. Despite all this, leasing activity is down by 13% since Q3. NOTABLE DEALS: Time Inc. magazine commenced the move of its magazines to Brookfi eld Place (225 Liberty Place), as one of many tenants making their way from Midtown to the submarket and Downtown overall. Cambridge University Press leased 39,771 square feet at One Liberty Plaza, relocating from 32 Avenue of the Americas. Sterling Equities signed on at 4 World Trade Center for 83,546 square feet, which had asking rents in the low $70s. Advertising and marketing fi rm xAd leased 42,668 square feet at One World Trade Center, with asking rents in the high $60s. Namely, Inc. expanded its footprint at 195 Broadway to a total of 83,964 square feet. The expansion’s lease had a reported rent of the mid-$50s. Construction of 3 World Trade Center is slated for completion in January 2018.
LEE NYCMANHATTAN TREND TRACKER4Q2015
LEE & ASSOCIATES NYC

DOWNTOWN
MANHATTAN TREND TRACKER 4TH QUARTER 20159
LEE NYCMANHATTAN TREND TRACKER4Q2015
LEE & ASSOCIATES NYC
9.1%
12.2%
0.0%2.0%4.0%6.0%8.0%
10.0%12.0%14.0%16.0%18.0%
1Q2006
3Q2006
1Q2007
3Q2007
1Q2008
3Q2008
1Q2009
3Q2009
1Q2010
3Q2010
1Q2011
3Q2011
1Q2012
3Q2012
1Q2013
3Q2013
1Q2014
3Q2014
1Q2015
3Q2015
Downtown Vacancy and Availability
Vacancy Availability 10Y Vacancy Avg. 10Y Availability Avg.
1,512,307
- 500,000
1,000,000 1,500,000 2,000,000 2,500,000 3,000,000 3,500,000 4,000,000
1Q2006
3Q2006
1Q2007
3Q2007
1Q2008
3Q2008
1Q2009
3Q2009
1Q2010
3Q2010
1Q2011
3Q2011
1Q2012
3Q2012
1Q2013
3Q2013
1Q2014
3Q2014
1Q2015
3Q2015
Downtown Leasing Activity
SF Leased 10Y Avg.
(3,000,000)
(2,000,000)
(1,000,000)
0
1,000,000
2,000,000
3,000,000
4,000,000
1Q2006
3Q2006
1Q2007
3Q2007
1Q2008
3Q2008
1Q2009
3Q2009
1Q2010
3Q2010
1Q2011
3Q2011
1Q2012
3Q2012
1Q2013
3Q2013
1Q2014
3Q2014
1Q2015
3Q2015
Downtown Net Absorption
MANHATTAN TREND TRACKER 4TH QUARTER 201510 LEE & ASSOCIATES NYC
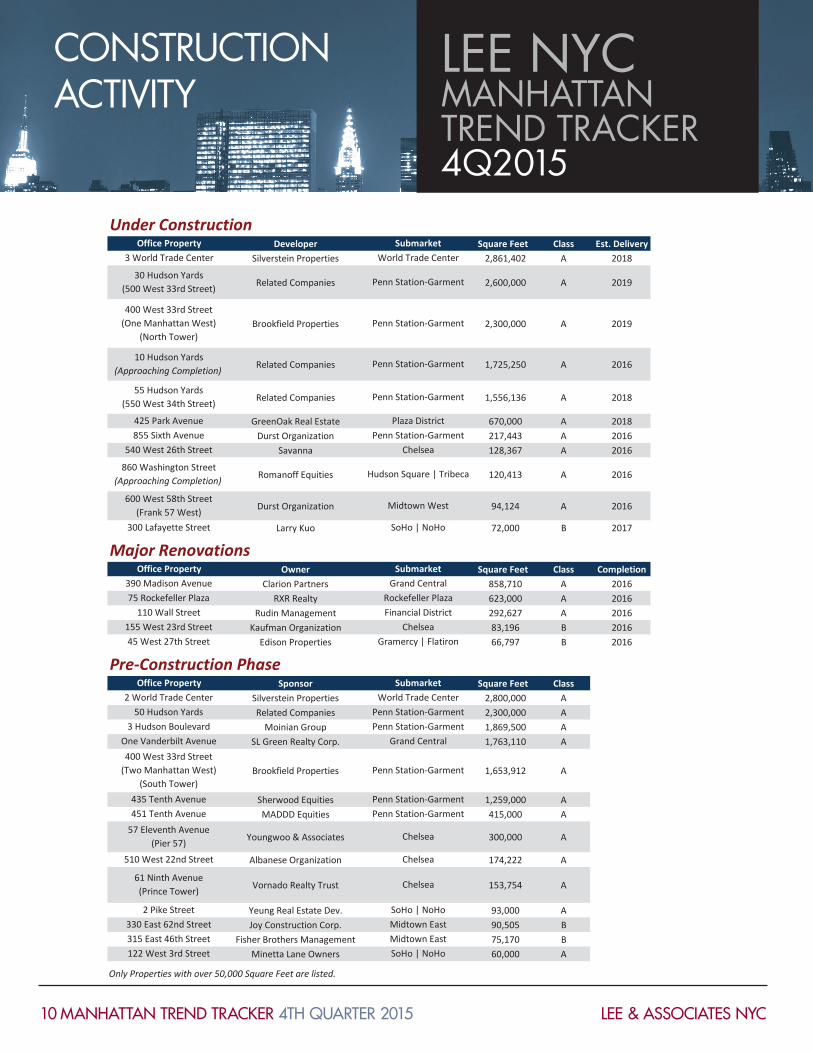
CONSTRUCTION ACTIVITY
LEE NYCMANHATTAN TREND TRACKER4Q2015
Under ConstructionDeveloper Square Feet Class Est. Delivery
Silverstein Properties 2,861,402 A 2018
Related Companies 2,600,000 A 2019
Brookfield Properties 2,300,000 A 2019
Related Companies 1,725,250 A 2016
Related Companies 1,556,136 A 2018
GreenOak Real Estate 670,000 A 2018Durst Organization 217,443 A 2016
Savanna 128,367 A 2016
Romanoff Equities 120,413 A 2016
Durst Organization 94,124 A 2016
Larry Kuo 72,000 B 2017
Major RenovationsOwner Square Feet Class Completion
Clarion Partners 858,710 A 2016RXR Realty 623,000 A 2016
Rudin Management 292,627 A 2016Kaufman Organization 83,196 B 2016
Edison Properties 66,797 B 2016
Pre-Construction PhaseSponsor Square Feet Class
Silverstein Properties 2,800,000 ARelated Companies 2,300,000 A
Moinian Group 1,869,500 ASL Green Realty Corp. 1,763,110 A
Brookfield Properties 1,653,912 A
Sherwood Equities 1,259,000 AMADDD Equities 415,000 A
Youngwoo & Associates 300,000 A
Albanese Organization 174,222 A
Vornado Realty Trust 153,754 A
Yeung Real Estate Dev. 93,000 AJoy Construction Corp. 90,505 B
Fisher Brothers Management 75,170 BMinetta Lane Owners 60,000 A
Only Properties with over 50,000 Square Feet are listed.
155 West 23rd Street Chelsea
540 West 26th Street Chelsea
600 West 58th Street(Frank 57 West)
Midtown West
300 Lafayette Street SoHo | NoHo
315 East 46th Street Midtown East
45 West 27th Street Gramercy | Flatiron
2 World Trade Center World Trade Center50 Hudson Yards Penn Station-Garment
Office Property Submarket
400 West 33rd Street(Two Manhattan West)
(South Tower)Penn Station-Garment
855 Sixth Avenue Penn Station-Garment
860 Washington Street(Approaching Completion)
Hudson Square | Tribeca
Office Property Submarket3 World Trade Center World Trade Center
10 Hudson Yards(Approaching Completion)
Penn Station-Garment
30 Hudson Yards(500 West 33rd Street)
Penn Station-Garment
400 West 33rd Street(One Manhattan West)
(North Tower)Penn Station-Garment
425 Park Avenue Plaza District
Office Property Submarket390 Madison Avenue Grand Central75 Rockefeller Plaza Rockefeller Plaza
3 Hudson Boulevard Penn Station-GarmentOne Vanderbilt Avenue Grand Central
435 Tenth Avenue Penn Station-Garment451 Tenth Avenue Penn Station-Garment
57 Eleventh Avenue(Pier 57)
Chelsea
2 Pike Street SoHo | NoHo
122 West 3rd Street SoHo | NoHo
55 Hudson Yards(550 West 34th Street)
Penn Station-Garment
110 Wall Street Financial District
510 West 22nd Street Chelsea
61 Ninth Avenue(Prince Tower)
Chelsea
330 East 62nd Street Midtown East
MANHATTAN TREND TRACKER 4TH QUARTER 201511 LEE & ASSOCIATES NYC
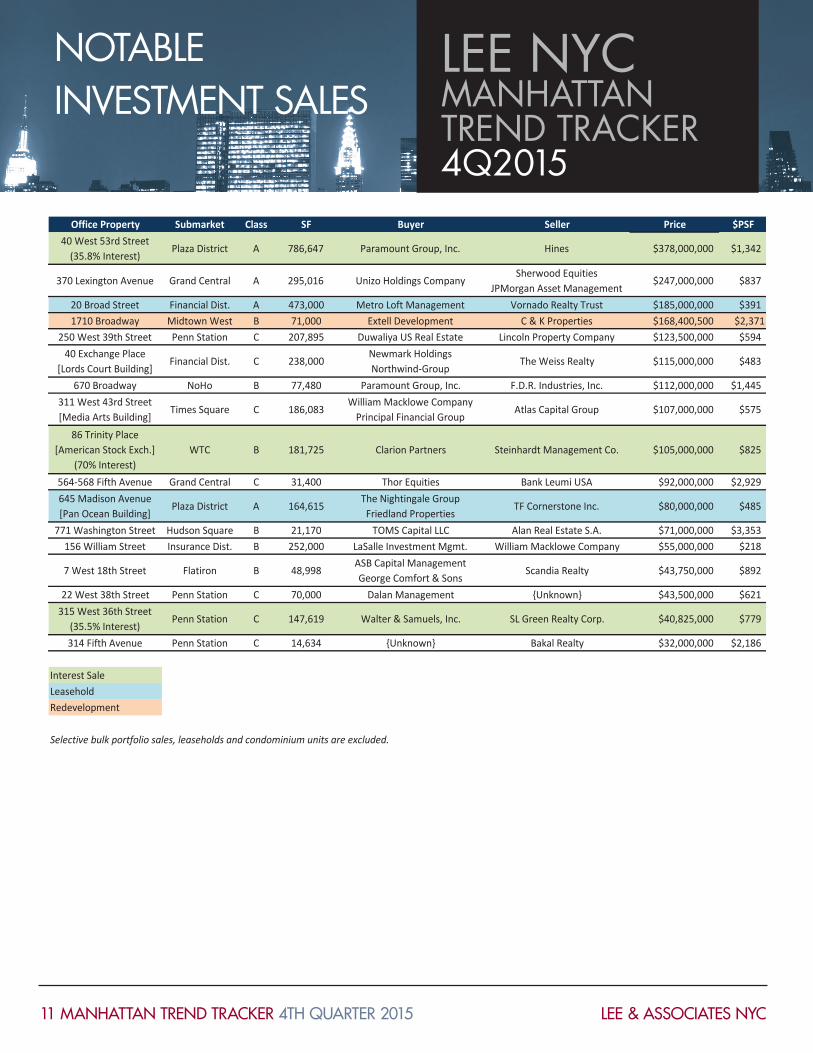
Office Property Submarket Class SF Buyer Seller Price $PSF40 West 53rd Street
(35.8% Interest)Plaza District A 786,647 Paramount Group, Inc. Hines $378,000,000 $1,342
370 Lexington Avenue Grand Central A 295,016 Unizo Holdings CompanySherwood Equities
JPMorgan Asset Management$247,000,000 $837
20 Broad Street Financial Dist. A 473,000 Metro Loft Management Vornado Realty Trust $185,000,000 $3911710 Broadway Midtown West B 71,000 Extell Development C & K Properties $168,400,500 $2,371
250 West 39th Street Penn Station C 207,895 Duwaliya US Real Estate Lincoln Property Company $123,500,000 $59440 Exchange Place
[Lords Court Building]Financial Dist. C 238,000
Newmark HoldingsNorthwind-Group
The Weiss Realty $115,000,000 $483
670 Broadway NoHo B 77,480 Paramount Group, Inc. F.D.R. Industries, Inc. $112,000,000 $1,445311 West 43rd Street[Media Arts Building]
Times Square C 186,083William Macklowe Company
Principal Financial GroupAtlas Capital Group $107,000,000 $575
86 Trinity Place[American Stock Exch.]
(70% Interest)WTC B 181,725 Clarion Partners Steinhardt Management Co. $105,000,000 $825
564-568 Fifth Avenue Grand Central C 31,400 Thor Equities Bank Leumi USA $92,000,000 $2,929645 Madison Avenue[Pan Ocean Building]
Plaza District A 164,615The Nightingale Group
Friedland PropertiesTF Cornerstone Inc. $80,000,000 $485
771 Washington Street Hudson Square B 21,170 TOMS Capital LLC Alan Real Estate S.A. $71,000,000 $3,353156 William Street Insurance Dist. B 252,000 LaSalle Investment Mgmt. William Macklowe Company $55,000,000 $218
7 West 18th Street Flatiron B 48,998ASB Capital ManagementGeorge Comfort & Sons
Scandia Realty $43,750,000 $892
22 West 38th Street Penn Station C 70,000 Dalan Management {Unknown} $43,500,000 $621315 West 36th Street
(35.5% Interest)Penn Station C 147,619 Walter & Samuels, Inc. SL Green Realty Corp. $40,825,000 $779
314 Fifth Avenue Penn Station C 14,634 {Unknown} Bakal Realty $32,000,000 $2,186
Interest SaleLeaseholdRedevelopment
Selective bulk portfolio sales, leaseholds and condominium units are excluded.
NOTABLE INVESTMENT SALES
LEE NYCMANHATTAN TREND TRACKER4Q2015

Lee & Associates NYC600 Madison Avenue, Third Floor
New York, NY 10022 | 212.776.1200www.leeassociatesnyc.com
James WachtPresident
Peter BrausManaging Principal
Henry AbramovResearch Director
With offi ces
across the nation, the
Lee & Associates® group
of independently owned
and operated companies
is the largest provider of
regional commercial real estate
services in the United States and
the fourth-largest full-service
commercial real estate
organization overall.