
Lecture outline Clustering aggregation – Reference: A. Gionis, H. Mannila, P. Tsaparas: Clustering...
31
Lecture outline • Clustering aggregation – Reference: A. Gionis, H. Mannila, P. Tsaparas: Clustering aggregation, ICDE 2004 • Co-clustering (or bi-clustering) • References: – A. Anagnostopoulos, A. Dasgupta and R. Kumar: Approximation Algorithms for co-clustering, PODS 2008. – K. Puolamaki. S. Hanhijarvi and G. Garriga: An approximation ratio for biclustering, Information Processing Letters 2008.
-
date post
19-Dec-2015 -
Category
Documents
-
view
225 -
download
1
Transcript of Lecture outline Clustering aggregation – Reference: A. Gionis, H. Mannila, P. Tsaparas: Clustering...
Lecture outline
• Clustering aggregation – Reference: A. Gionis, H. Mannila, P. Tsaparas: Clustering
aggregation, ICDE 2004
• Co-clustering (or bi-clustering)• References:
– A. Anagnostopoulos, A. Dasgupta and R. Kumar: Approximation Algorithms for co-clustering, PODS 2008.
– K. Puolamaki. S. Hanhijarvi and G. Garriga: An approximation ratio for biclustering, Information Processing Letters 2008.

Clustering aggregation
• Many different clusterings for the same dataset!
– Different objective functions– Different algorithms– Different number of clusters
• Which clustering is the best?– Aggregation: we do not need to decide, but rather find a reconciliation
between different outputs

The clustering-aggregation problem
• Input– n objects X = {x1,x2,…,xn}– m clusterings of the objects C1,…,Cm
• partition: a collection of disjoint sets that cover X• Output– a single partition C, that is as close as possible to all
input partitions• How do we measure closeness of clusterings?– disagreement distance

Disagreement distance• For object x and clustering C, C(x) is the index
of set in the partition that contains x
• For two partitions C and P, and objects x,y in X define
• if IP,Q(x,y) = 1 we say that x,y create a disagreement between partitions P and Q
•
U C P
x1 1 1
x2 1 2
x3 2 1
x4 3 3
x5 3 4
D(P,Q) = 4
otherwise0
P(y) P(x) AND C(y) C(x) if
OR
P(y) P(x) and C(y) C(x) if 1
y)(x,I PC,
y)(x,
QP, y)(x,I Q)D(P,

Metric property for disagreement distance
• For clustering C: D(C,C) = 0• D(C,C’)≥0 for every pair of clusterings C, C’ • D(C,C’) = D(C’,C)• Triangle inequality?• It is sufficient to show that for each pair of points x,y
єX: Ix,y(C1,C3)≤ Ix,y(C1,C2) + Ix,y(C2,C3)
• Ix,y takes values 0/1; triangle inequality can only be violated when
–Ix,y(C1,C3)=1 and Ix,y(C1,C2) = 0 and Ix,y(C2,C3)=0– Is this possible?

Clustering aggregation• Given partitions C1,…,Cm find C such that
is minimized
m
1ii )CD(C, D(C)
U C1 C2 C3 C
x1 1 1 1 1
x2 1 2 2 2
x3 2 1 1 1
x4 2 2 2 2
x5 3 3 3 3
x6 3 4 3 3
the aggregation cost

Why clustering aggregation?
• Clustering categorical data
• The two problems are equivalent
U City Profession Nationality
x1 New York Doctor U.S.
x2 New York Teacher Canada
x3 Boston Doctor U.S.
x4 Boston Teacher Canada
x5 Los Angeles Lawer Mexican
x6 Los Angeles Actor Mexican

Why clustering aggregation?
• Identify the correct number of clusters– the optimization function does not require an
explicit number of clusters
• Detect outliers– outliers are defined as points for which there is no
consensus

Why clustering aggregation?
• Improve the robustness of clustering algorithms– different algorithms have different weaknesses.– combining them can produce a better result.

Why clustering aggregation?
• Privacy preserving clustering– different companies have data for the same users.
They can compute an aggregate clustering without sharing the actual data.

Complexity of Clustering Aggregation
• The clustering aggregation problem is NP-hard– the median partition problem [Barthelemy and LeClerc 1995].
• Look for heuristics and approximate solutions.
ALG(I) ≤ c OPT(I)

A simple 2-approximation algorithm
• The disagreement distance D(C,P) is a metric
• The algorithm BEST: Select among the input clusterings the clustering C* that minimizes D(C*).– a 2-approximate solution. Why?

A 3-approximation algorithm
• The BALLS algorithm: – Select a point x and look at the set of points B
within distance ½ of x– If the average distance of x to B is less than ¼ then
create the cluster BU{p}– Otherwise, create a singleton cluster {p}– Repeat until all points are exhausted
• Theorem: The BALLS algorithm has worst-case approximation factor 3
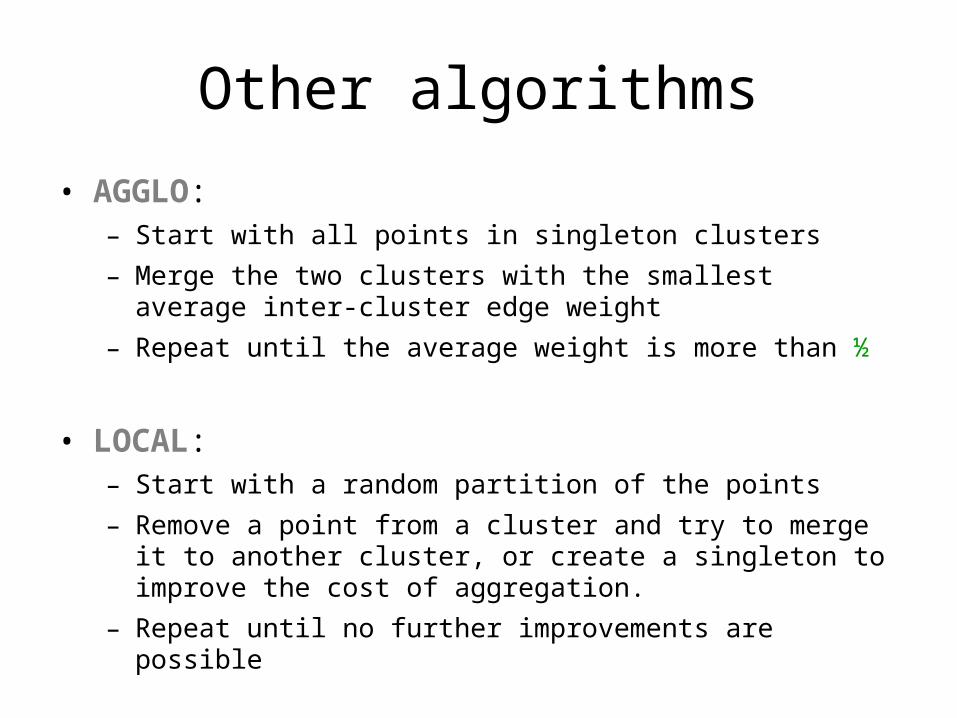
Other algorithms
• AGGLO: – Start with all points in singleton clusters– Merge the two clusters with the smallest average inter-cluster edge
weight– Repeat until the average weight is more than ½
• LOCAL: – Start with a random partition of the points – Remove a point from a cluster and try to merge it to another cluster,
or create a singleton to improve the cost of aggregation. – Repeat until no further improvements are possible

Clustering Robustness

Lecture outline
• Clustering aggregation – Reference: A. Gionis, H. Mannila, P. Tsaparas: Clustering
aggregation, ICDE 2004
• Co-clustering (or bi-clustering)• References:
– A. Anagnostopoulos, A. Dasgupta and R. Kumar: Approximation Algorithms for co-clustering, PODS 2008.
– K. Puolamaki. S. Hanhijarvi and G. Garriga: An approximation ratio for biclustering, Information Processing Letters 2008.

A
Clustering
3 0 6 8 9 7
2 3 4 12 8 10
1 2 3 10 9 8
0 8 4 8 7 9
2 4 3 11 9 10
16 10 13 6 7 5
10 8 9 2 3 7
• m points in Rn
• Group them to k clusters• Represent them by a matrix ARm×n
– A point corresponds to a row of A• Cluster: Partition the rows to k groups
m
nRn

Co-Clustering
3 0 6 8 9 7
2 3 4 12 8 10
1 2 3 10 9 8
0 8 4 8 9 7
2 4 3 11 9 10
16 10 13 6 7 5
10 8 9 2 3 7
A
• Co-Clustering: Cluster rows and columns of A simultaneously:
k = 2
ℓ = 2Co-cluster

Motivation: Sponsored Search
Main revenue for search engines
• Advertisers bid on keywords• A user makes a query• Show ads of advertisers that are relevant and have high bids• User clicks or not an ad
Ads

Motivation: Sponsored Search
• For every(advertiser, keyword) pairwe have:
– Bid amount– Impressions– # clicks
• Mine information at query time – Maximize # clicks / revenue

Ski boots
Co-Clusters in Sponsored Search
Advertiser
Keyw
ords
Vancouver
Air France
Skis.com
Bids of skis.com for “ski boots”
Markets = co-clusters
All these keywords are relevantto a set of advertisers

Co-Clustering in Sponsored Search
Applications:
• Keyword suggestion– Recommend to advertisers other relevant keywords
• Broad matching / market expansion– Include more advertisers to a query
• Isolate submarkets– Important for economists– Apply different advertising approaches
• Build taxonomies of advertisers / keywords

A
Clustering of the rows
3 0 6 8 9 7
2 3 4 12 8 10
1 2 3 10 9 8
0 8 4 8 7 9
2 4 3 11 9 10
16 10 13 6 7 5
10 8 9 2 3 7
• m points in Rn
• Group them to k clusters• Represent them by a matrix ARm×n
– A point corresponds to a row of A• Clustering: Partitioning of the rows into k groups
m
nRn

Clustering of the columns
3 0 6 8 9 7
2 3 4 12 8 10
1 2 3 10 9 8
0 8 4 8 7 9
2 4 3 11 9 10
16 10 13 6 7 5
10 8 9 2 3 7
3 3 3 9 9 9
3 3 3 9 9 9
3 3 3 9 9 9
3 3 3 9 9 9
3 3 3 9 9 9
11 11 11 5 5 5
11 11 11 5 5 5
A R
• n points in Rm
• Group them to k clusters• Represent them by a matrix ARm×n
– A point corresponds to a column of A• Clustering: Partitioning of the columns into k
groups
Rn
m
n

R MA
Cost of clustering3 0 6 8 9 7
2 3 4 12
8 10
1 2 3 10
9 8
0 8 4 8 7 9
2 4 3 11 9 10
16 10 13 6 7 5
10 8 9 2 3 7
1.6 3.4
4 9.8 8.4
8.8
1.6 3.4
4 9.8 8.4
8.8
1.6 3.4
4 9.8 8.4
8.8
1.6 3.4
4 9.8 8.4
8.8
1.6 3.4
4 9.8 8.4
8.8
13 9 11 4 5 6
13 9 11 4 5 6
AI
Original data points A Data representation A’
• In A’ every point in A (row or column) is replaced by the corresponding representative (row or column)
• The quality of the clustering is measured by computing distances between the data in the cells of A and A’.
• k-means clustering: cost = ∑i=1…n ∑j=1…m (A(i,j)-A’(i,j))2
• k-median clustering: cost = ∑i=1…n ∑j=1…m |A(i,j)-A’(i,j)|
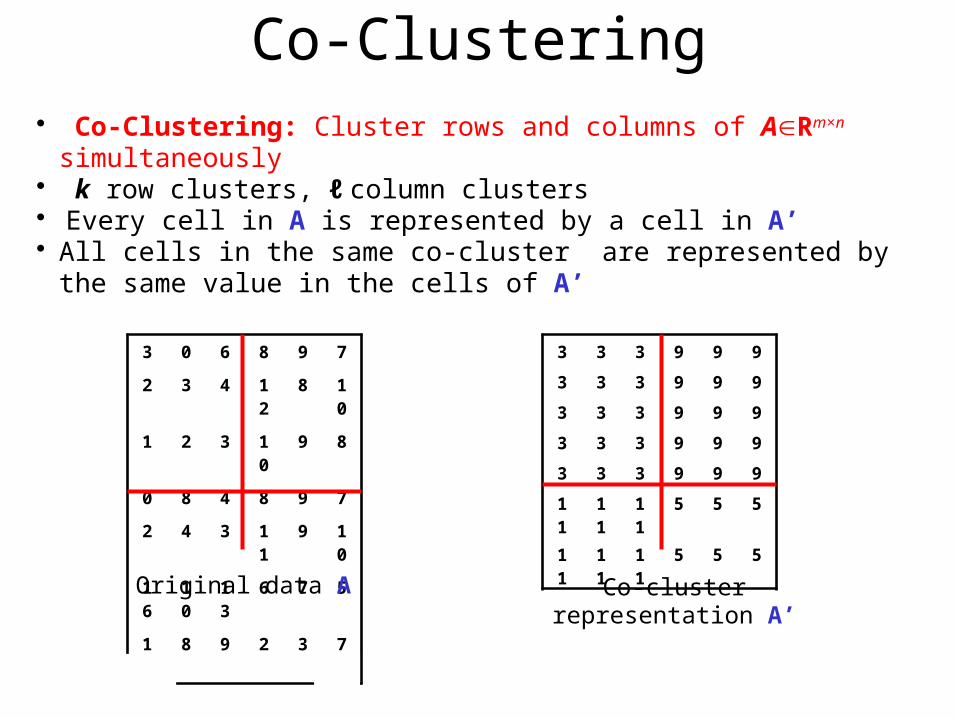
Co-Clustering
3 0 6 8 9 7
2 3 4 12 8 10
1 2 3 10 9 8
0 8 4 8 9 7
2 4 3 11 9 10
16 10 13 6 7 5
10 8 9 2 3 7
A MR R M C
• Co-Clustering: Cluster rows and columns of ARm×n simultaneously• k row clusters, ℓ column clusters• Every cell in A is represented by a cell in A’• All cells in the same co-cluster are represented by the same value in the cells of A’
3 3 3 9 9 9
3 3 3 9 9 9
3 3 3 9 9 9
3 3 3 9 9 9
3 3 3 9 9 9
11 11 11 5 5 5
11 11 11 5 5 5
C
Original data A Co-cluster representation A’

Co-Clustering Objective Function3 0 6 8 9 7
2 3 4 12 8 10
1 2 3 10 9 8
0 8 4 8 7 9
2 4 3 11 9 10
16 10 13 6 7 5
10 8 9 2 3 7
A R M C
3 3 3 9 9 9
3 3 3 9 9 9
3 3 3 9 9 9
3 3 3 9 9 9
3 3 3 9 9 9
11 11 11 5 5 5
11 11 11 5 5 5
• In A’ every point in A (row or column) is replaced by the corresponding representative (row or column)
• The quality of the clustering is measured by computing distances between the data in the cells of A and A’.
• k-means Co-clustering: cost = ∑i=1…n ∑j=1…m (A(i,j)-A’(i,j))2
• k-median Co-clustering: cost = ∑i=1…n ∑j=1…m |A(i,j)-A’(i,j)|
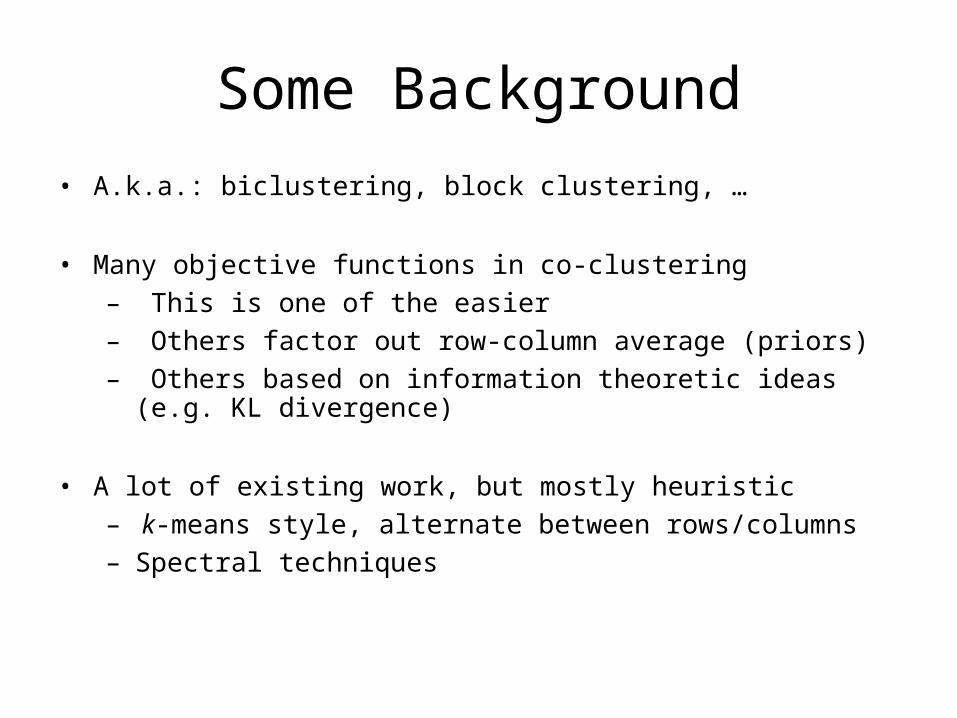
Some Background• A.k.a.: biclustering, block clustering, …
• Many objective functions in co-clustering– This is one of the easier– Others factor out row-column average (priors)– Others based on information theoretic ideas (e.g. KL divergence)
• A lot of existing work, but mostly heuristic– k-means style, alternate between rows/columns– Spectral techniques
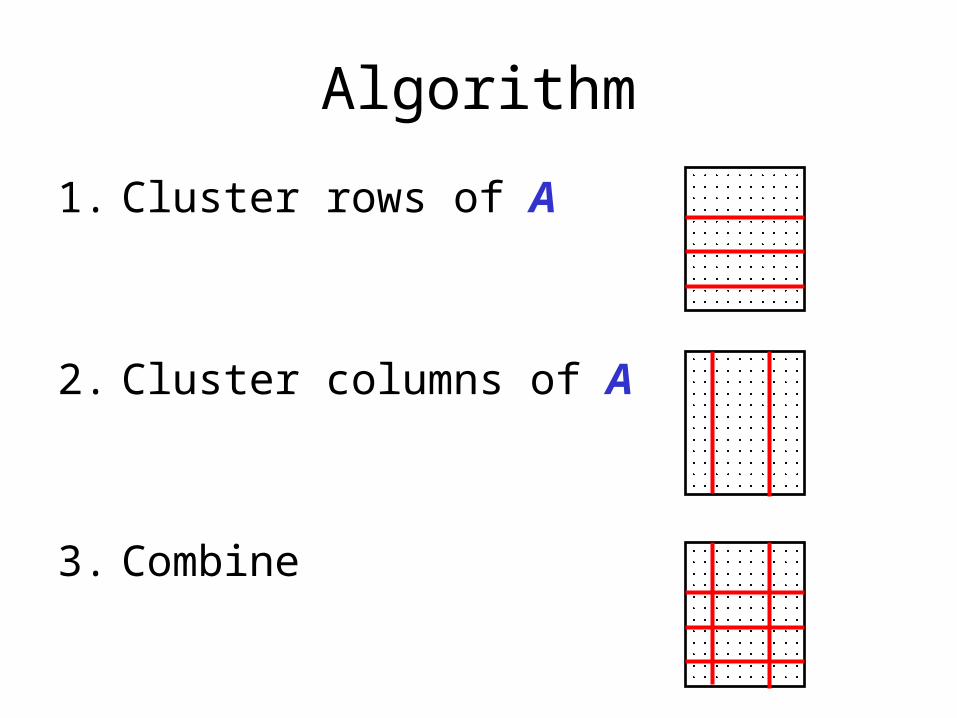
Algorithm
1. Cluster rows of A
2. Cluster columns of A
3. Combine

Properties of the algorithm
Theorem 1. Algorithm with optimal row/column clusterings is 3-approximation to co-clustering optimum.
Theorem 2. For L2 distance function, the algorithm with optimal row/column clusterings is a 2-approximation.

Algorithm--details
• Clustering of the n rows of A assigns every row to a cluster with cluster name {1,…,k}– R(i)= ri with 1≤ ri ≤k
• Clustering of the m columns of A assigns every column to a cluster with cluster name {1,…,ℓ}– C(j)=cj with 1≤ cj ≤ℓ
• A’(i,j) = {ri,cj}• (i,j) is in the same co-cluster as (i’,j’) if
A’(i,j)=A’(i’,j’)


![Document Clustering Using Semantic Cliques Aggregation · The clustering discovers the latent themes to organize, summarize, and disambiguate a large collection of web documents [10]](https://static.fdocuments.net/doc/165x107/5fdc1c6690209e396d4ff1b3/document-clustering-using-semantic-cliques-aggregation-the-clustering-discovers.jpg)

