Lecture Materials RETAIL BANKING Jack Hubbard Materials RETAIL BANKING Jack Hubbard Chairman and...
25
Lecture Materials RETAIL BANKING Jack Hubbard Chairman and Chief Sales Officer St. Meyer & Hubbard Elgin, Illinois [email protected] 847-717-4328 August 2, 2016
Transcript of Lecture Materials RETAIL BANKING Jack Hubbard Materials RETAIL BANKING Jack Hubbard Chairman and...

Lecture Materials
RETAIL BANKING
Jack Hubbard Chairman and Chief Sales Officer
St. Meyer & Hubbard Elgin, Illinois
[email protected] 847-717-4328
August 2, 2016


1
1 © 2016 St. Meyer & Hubbard, Inc.
Maximizing Relationship Development through Sales and Service Leadership
Jack Hubbard Chairman and Chief Sales Officer
[email protected] 847-717-4328
2 © 2016 St. Meyer & Hubbard, Inc.
5 Cs of Trust-Based Leadership 1. C________________________________
2. C________________________________
3. C________________________________
4. C________________________________
5. C________________________________

2
3 © 2016 St. Meyer & Hubbard, Inc.
4 © 2016 St. Meyer & Hubbard, Inc.
Sales Culture Versus Relationship Culture SalesCulture Rela,onshipCulture
CustomerService ConsistentCustomerExperience Consulta6ve TrustandValue-Based Involvement(optin) Commitment(allin) NumbersandTickMarks Quality StraightJacket FlexibleConsistency CampaignaEercampaign Sustainability QuickResults UrgentPa,ence Cross-Selling Cross-Solving BusyBank TargetedandFocused ScoreboardStaring ScoreboardGlancing Marke6ng,Opera6ons,ITControl Partner TrainingEvents LearningOrganiza,on YourWay(myprocess) OurWay(ClientExperienceProcess) ManageNumbers LeadPeople
3
5 © 2016 St. Meyer & Hubbard, Inc.
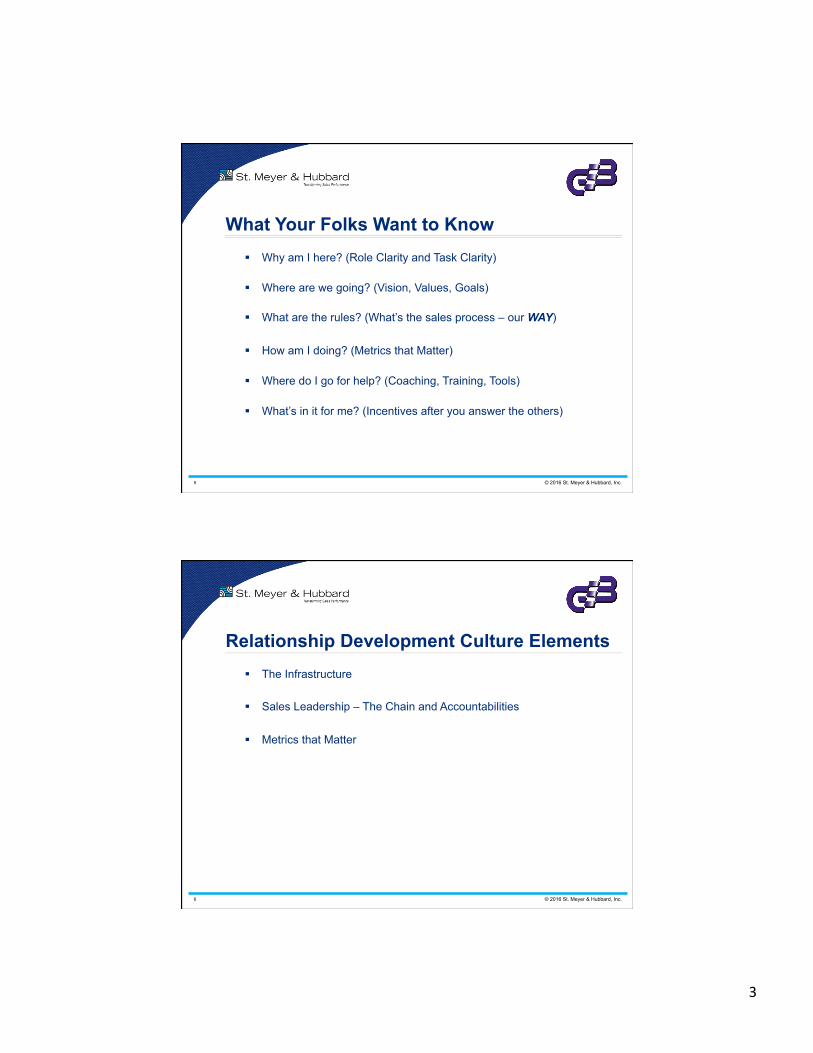
What Your Folks Want to Know § Why am I here? (Role Clarity and Task Clarity)
§ Where are we going? (Vision, Values, Goals)
§ What are the rules? (What’s the sales process – our WAY)
§ How am I doing? (Metrics that Matter)
§ Where do I go for help? (Coaching, Training, Tools)
§ What’s in it for me? (Incentives after you answer the others)
6 © 2016 St. Meyer & Hubbard, Inc.
Relationship Development Culture Elements § The Infrastructure § Sales Leadership – The Chain and Accountabilities
§ Metrics that Matter

4
7 © 2016 St. Meyer & Hubbard, Inc.
The Infrastructure
§ Hire right
§ Pay right
§ Live the sales process
§ Make technology sales enabling
8 © 2016 St. Meyer & Hubbard, Inc.
Right People, Right Seats § Less than 15% of “superstar” salespeople succeed as sales
managers
§ Only 19% of effective “hunters” or new business developers are effective at “maintaining” long-term customers.
§ Less than 15% of “farmers” are comfortable “hunting”
§ Nearly 65% of salespeople who “fail” could have succeeded in the “right” type of sales function for their skills
§ People who hire must ask better questions

5
9 © 2016 St. Meyer & Hubbard, Inc.
Sourcing, Assessing, OnBoarding § What strategies are in place to source top candidates? § Sales managers sourcing candidates? (War Board) § What behaviors do top performer’s exhibit and how do candidates
mirror those? § What behavioral interview questions are asked? § What role plays are done during the interview process? § What sales testing is in place? § Where are your Sales Managers coming from? § What retention strategies are in place to keep top performers? § What sales related skills and competencies are expected and are
they built into job descriptions from the top down? § How are new employees Onboarded when they join the bank?
10 © 2016 St. Meyer & Hubbard, Inc.
One Bank’s Acquisition Questions § How much of your current business has come through your
direct sales efforts versus the amount you inherited from other portfolios?
§ How do you source and prospect ?
§ How do you secure telephone appointments with prospects?
§ How and when do you bring in partners?
§ How do you find new referral sources and how do you keep mind share with your COIs?

6
11 © 2016 St. Meyer & Hubbard, Inc.
One Bank’s Retention Questions § Talk about portfolio retention rates.
§ Give me an example of how you specifically add value to
clients in your portfolio.
§ What words would your clients use to describe their relationship with you?
§ How do your stay current with Share of Heart events?
§ How likely is it that you know the COIs and trusted advisors of your top 10 clients?
12 © 2016 St. Meyer & Hubbard, Inc.
One Bank’s Intangibles Questions
§ Describe your pre-call planning process.
§ A prospect has suggested they will become your client if you lower your price. What do you say and do?
§ Describe how you use CRM.
§ Describe your post-call follow-up.
§ Discuss how you use LinkedIn as a value and connecting tool.

7
13 © 2016 St. Meyer & Hubbard, Inc.
Pay for Performance
§ Some Keys to Success • Make it easy to understand
• Let me see how I’m doing
• Tweak don’t change
• Pay often
• Manager overrides improve coaching
• Avoid the Flea Test
14 © 2016 St. Meyer & Hubbard, Inc.
The Relationship Development Process Level 1 – Random Process
• Anti-process where bankers do their own thing their own way Level 2 – Informal Process
• Expectation to use the process but no monitoring or measurement Level 3 – Formal Process
• Bank regularly enforces the use of a defined process. Periodic reviews of the process done to see how effective it is and changes made based on the analysis
Level 4 – Dynamic Process
• Bank dynamically monitors and provides continuous feedback on use of its formal process. The process is proactively modified when key changes in market conditions are detected

8
15 © 2016 St. Meyer & Hubbard, Inc.
2016 Sales Process Adoption
16 © 2016 St. Meyer & Hubbard, Inc.
Level of Sales Process Employed
© 2016 CSO Insights

9
17 © 2016 St. Meyer & Hubbard, Inc.
Level of Sales Process Employed
© 2016 CSO Insights
18 © 2016 St. Meyer & Hubbard, Inc.
Simple Business Banking Process

10
19 © 2016 St. Meyer & Hubbard, Inc.
A Retail Process
Face-to-FaceNeedsAssessmentProcess
On-BoardingProcess
#TellerReferrals
Walk-InOpportunity
TellerWalk-Over OutboundCallingProcess
Total#NewAccountsOpened
Future/NoOpportunity
Lead
14DayAppointment
Total#NewF:FSalesConversa,ons Walk-InOpportunity TellerWalk-OverReferral AppointmentKept
SalesConversionRa,o Win/LossRa6o Cross-SellRa6o 90DayReten6onRate
Appointment
NoContact Future/NoOpportunity
NetNewAccounts Consumer/BusinessLoansConsumer/BusinessDepositsOtherFeeIncome
D Total#ClosedAccounts
A
D
C
B
20 © 2016 St. Meyer & Hubbard, Inc.
Routines and the Leadership Chain Sustains It

11
21 © 2016 St. Meyer & Hubbard, Inc.
Get To Go Meetings/Group Coaching § Huddle: 15 Minute pre/de brief
§ Pipeline: 45 Minute strategic view of activities and team results
§ Skill Builder: 45 Minute meeting for specific skill
22 © 2016 St. Meyer & Hubbard, Inc.
The Huddle
§ Identify overall gap to goal § Recognize individual successes (outcomes and activities) § Identify improvement opportunities § Strategize improvement action plans § Determine specific outcome and activity goals for the coming
week
15-Minute Branch Check Up to:

12
23 © 2016 St. Meyer & Hubbard, Inc.
Use At The Huddle – Retail Scorecard
24 © 2016 St. Meyer & Hubbard, Inc.
Pipeline Meeting Windshield not Rearview § Meeting Introduction/Review of Success Tip
§ The Week in Review:
• Team outcomes – gap to goal • Team activities – gap to goal • Review of wins and learns • Discussion of best practice
§ Sales Conversation Strategies:
• Hot Prospect Lottery • Book Review – Learning to Life • Sales Practice in Action • Partner Visit
§ Preview of the Coming Week
§ Success Tip of the Week – Linked Group and three connections

13
25 © 2016 St. Meyer & Hubbard, Inc.
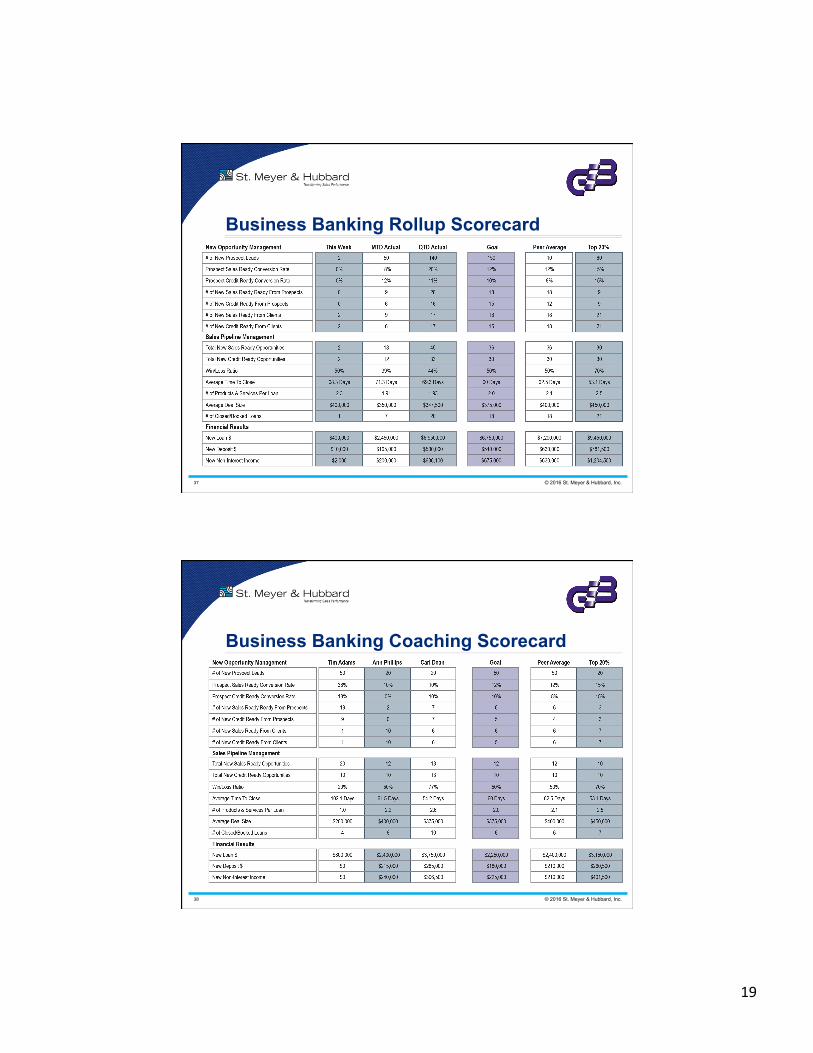
Business Banking Rollup Scorecard
26 © 2016 St. Meyer & Hubbard, Inc.
Skill Builder Success Factors § Set agenda ahead – they appreciate and plan § Isolate the topic – link it to strategic objectives not tick marks § Prepare one minute of prep to one minute of talk § Glance at the scoreboard § Set a positive tone – use icebreaker exercise § Facilitate not pontificate

14
27 © 2016 St. Meyer & Hubbard, Inc.
Skill Builder Success Factors § Skill drills let you see it – nobody likes it – So? § Be inclusive § Prepare your partners § Videos enhance but they are not a “babysitter” § Give an assignment § Distribute evaluation § Follow-up – connect to other routines
28 © 2016 St. Meyer & Hubbard, Inc.
Team Meeting Questions. Ask Yourself… § How does this meeting connect to our strategic, revenue, and
customer experience objectives? § What is everyone’s role in the meeting? § What do I need to prepare to make the meeting successful? § How will participants prepare effectively? § How does time invested in attending this meeting compare to other
ways we could use our time? § When partners attend the meeting, how am I working with them to get
them best prepared for an effective interaction with my people? § What follow-up will I expect my people to do as a result of this
meeting? § How will I link this meeting to my other coaching responsibilities? § How can I continue to make this a “get to” versus a “have to?” § What would I lose and the team not get if we did not have this
meeting?

15
29 © 2016 St. Meyer & Hubbard, Inc.
The Check-In Process
I N F O R M A T I O N
Q U E S T I O N S
EVPRetail
President
TheBoardofDirectors
EVPCommercial
EVPMortgage
EVPTrust
BranchManager
HeadTeller Personal
Banker
Teller
Rela,onshipManager
Originator TrustOfficer
Rela,onshipManager
Rela,onshipManager
Originator
Originator
TrustOfficer
TrustOfficer
30 © 2016 St. Meyer & Hubbard, Inc.
Check-In Guidelines § Schedule in advance and make schedule consistent
§ In person (first), on the phone (second) – never via e-mail
§ Prepare in advance
§ Keep to 15-20 minutes
§ Balance the conversation (You talk 20% - they 80%)
§ Discuss activities, behaviors, and outcomes (use the scorecard)
§ Link to all other sales management routines - ”During our last
coaching session”
§ Take good notes and create brief action plan
§ Focus on the future, touch on the past
16
31 © 2016 St. Meyer & Hubbard, Inc.
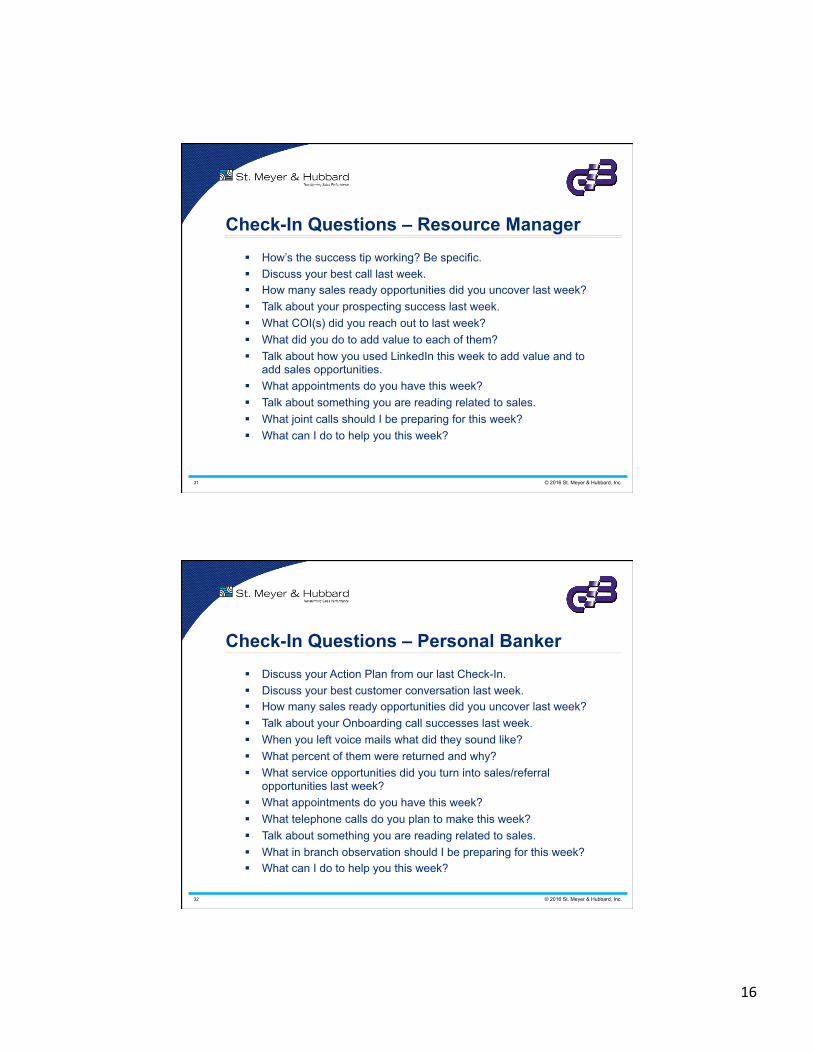
Check-In Questions – Resource Manager § How’s the success tip working? Be specific. § Discuss your best call last week. § How many sales ready opportunities did you uncover last week? § Talk about your prospecting success last week. § What COI(s) did you reach out to last week? § What did you do to add value to each of them? § Talk about how you used LinkedIn this week to add value and to
add sales opportunities. § What appointments do you have this week? § Talk about something you are reading related to sales. § What joint calls should I be preparing for this week? § What can I do to help you this week?
32 © 2016 St. Meyer & Hubbard, Inc.
Check-In Questions – Personal Banker § Discuss your Action Plan from our last Check-In. § Discuss your best customer conversation last week. § How many sales ready opportunities did you uncover last week? § Talk about your Onboarding call successes last week. § When you left voice mails what did they sound like? § What percent of them were returned and why? § What service opportunities did you turn into sales/referral
opportunities last week? § What appointments do you have this week? § What telephone calls do you plan to make this week? § Talk about something you are reading related to sales. § What in branch observation should I be preparing for this week? § What can I do to help you this week?

17
33 © 2016 St. Meyer & Hubbard, Inc.
A Simple Coaching Process § Isolate
§ Discriminate
§ Observe
§ Communicate (Ask then Tell)
§ Simple Action Plan
§ Connect back to other routines
34 © 2016 St. Meyer & Hubbard, Inc.
A=BxC- D
RetailSalesMetricsThatMatter
#F:FMeetings
NetNewAccounts
SalesConversionRatio
ClosedAccounts
(Win/Loss)x(Cross-Sell)x(90DayRetentionRate)o BranchSalesVelocityo TotalNewAccountsOpened/Day/FTEo TotalNewAccountsOpened
Walk-In|Walk-Over|Appointments
o #ofWalk-Overs/Weeko #ofF:FMeetings/Day/FTEo #ofService-RelatedConversations/Dayo Service/SalesConversionRatio
Retail Metrics that Matter
18
35 © 2016 St. Meyer & Hubbard, Inc.
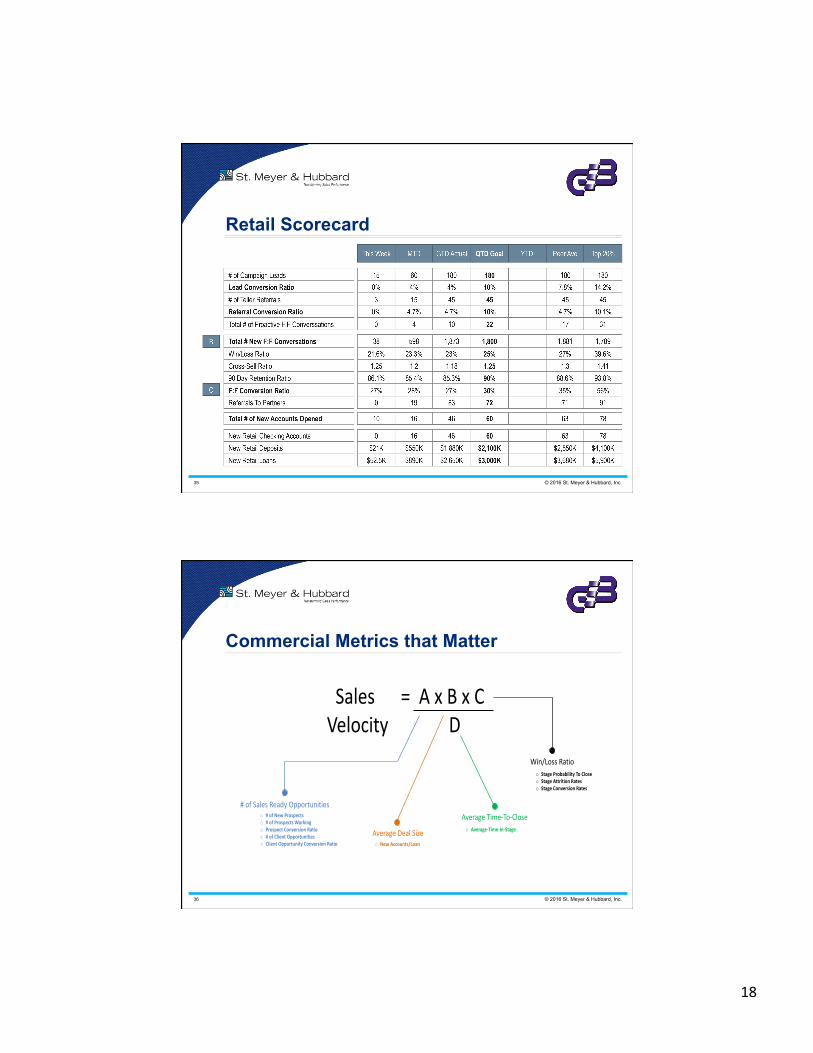
Retail Scorecard
36 © 2016 St. Meyer & Hubbard, Inc.
Sales=AxBxCVelocityD
CommercialSalesMetricsThatMatter
AverageDealSize
#ofSalesReadyOpportunitiesAverageTime-To-Close
Win/LossRatio
o Average-Time-In-Stage
o StageProbabilityToCloseo StageAttritionRateso StageConversionRates
o NewAccounts/Loan
o #ofNewProspectso #ofProspectsWorkingo ProspectConversionRatioo #ofClientOpportunitieso ClientOpportunityConversionRatio
Commercial Metrics that Matter
19
37 © 2016 St. Meyer & Hubbard, Inc.
Business Banking Rollup Scorecard
38 © 2016 St. Meyer & Hubbard, Inc.
Business Banking Coaching Scorecard

20
39 © 2016 St. Meyer & Hubbard, Inc.
Some Questions to Take to the Bank § How dynamic is our Customer Experience Process?
§ How do we link the process to our routines? § How connected are the sales management routines?
§ What are the metrics that really matter for my organization?
§ Do we want a Sales Culture or a Relationship Development Culture?
§ Do we have the Urgent Patience to make it work?

# of Campaign Leads 15
New Retail Checking AccountsNew Retail DepositsNew Retail Loans
Referrals To Partners
90 Day Retention RatioCross-Sell RatioWin/Loss Ratio
Total # of Proactive F:F Conversations
# of Teller ReferralsLead Conversion Ratio
F:F Conversion Ratio
Total # New F:F Conversations
0
86.1%1.25
21.6%
27%
38
19
85.4%1.2
23.3%
28%
598
91
93.8%1.41
39.6%
56%
1,789
71
88.6%1.3
27%
35%
1,881
72
90%1.2525%
30%
1,800
83
0 16 78636046$21K $550K $4,100K$2,550K$2,100K$1,880K
$52.5K $890K $5,900K$3,680K$3,000K$2,650K
10 16 78636046
85.3%1.1823%
27%
1,873
104.7%
454%180
Total # of New Accounts Opened
Referral Conversion Ratio0
30%
0%
60
4
154%
4.7%
180
22
4510%
10%
180
17
457.8%
4.7%
180
31
4514.2%
10.1%
This Week MTD Top 20%Peer AveYTDQTD GoalGTD Actual
B
C

# of New Credit Ready From Prospects
# of Closed/Booked Loans
Average Deal Size
# of Products & Services Per Loan
Average Time To Close
Win/Loss Ratio
Total New Credit Ready Opportunities
Total New Sales Ready Opportunities
New Loan $
New Deposit $
New Non-Interest Income
# of New Credit Ready From Clients
# of New Sales Ready From Clients
# of New Sales Ready From Prospects
Prospect Credit Ready Conversion Rate
Prospect Sales Ready Conversion Rate
# of New Prospect Leads
0
2
2
0
0%
0%
2
6
6
9
9
12%
18%
50
16
17
17
28
11%
20%
140
New Opportunity Management This Week MTD Actual QTD Actual Goal Peer Average Top 20%
Sales Pipeline Management
Financial Results
2.3
1
$400,000
68.3 Days
50%
2
2
1.91
7
$350,000
71.3 Days
39%
12
18
1.93
20
$347,500
69.3 Days
44%
33
45
$2,000
$10,000
$400,000
$200,000
$165,000
$2,450,000
$636,100
$500,000
$6,950,000
15
15
18
18
10%
12%
150
2.0
18
$375,000
60 Days
50%
30
36
$675,000
$540,000
$6,750,000
12
18
18
18
8%
12%
10
2.1
18
$400,000
62.5 Days
50%
30
36
$630,000
$630,000
$7,200,000
9
21
21
9
15%
15%
60
2.5
21
$450,000
53.1 Days
70%
30
30
$1,204,500
$781,500
$9,450,000

# of New Credit Ready From Prospects
# of New Credit Ready From Clients
# of New Sales Ready From Clients
# of New Sales Ready From Prospects
Prospect Credit Ready Conversion Rate
Prospect Sales Ready Conversion Rate
# of New Prospect Leads
New Opportunity Management
7
6
6
7
10%
10%
20
Carl Dean
2.6
10
$375,000
54.2 Days
77%
13
13
$396,500
$285,000
$3,750,000
0
10
10
2
0%
10%
20
Ann Phillips
2.2
6
$400,000
61.5 Days
50%
10
12
$240,000
$215,000
$2,400,000
9
1
1
19
18%
38%
50
Tim Adams
1.0
4
$200,000
102.1 Days
20%
10
20
$0
$0
$800,000
# of Closed/Booked Loans
Average Deal Size
# of Products & Services Per Loan
Average Time To Close
Win/Loss Ratio
Total New Credit Ready Opportunities
Total New Sales Ready Opportunities
Sales Pipeline Management
New Loan $
New Deposit $
New Non-Interest Income
Financial Results
3
7
7
3
15%
15%
20
Top 20%
2.5
7
$450,000
53.1 Days
70%
10
10
$401,500
$260,500
$3,150,000
4
6
6
6
8%
12%
50
Peer Average
2.1
6
$400,000
62.5 Days
50%
10
12
$210,000
$210,000
$2,400,000
5
5
6
6
10%
12%
50
Goal
2.0
6
$375,000
60 Days
50%
10
12
$225,000
$180,000
$2,250,000