Lecture ch03
29
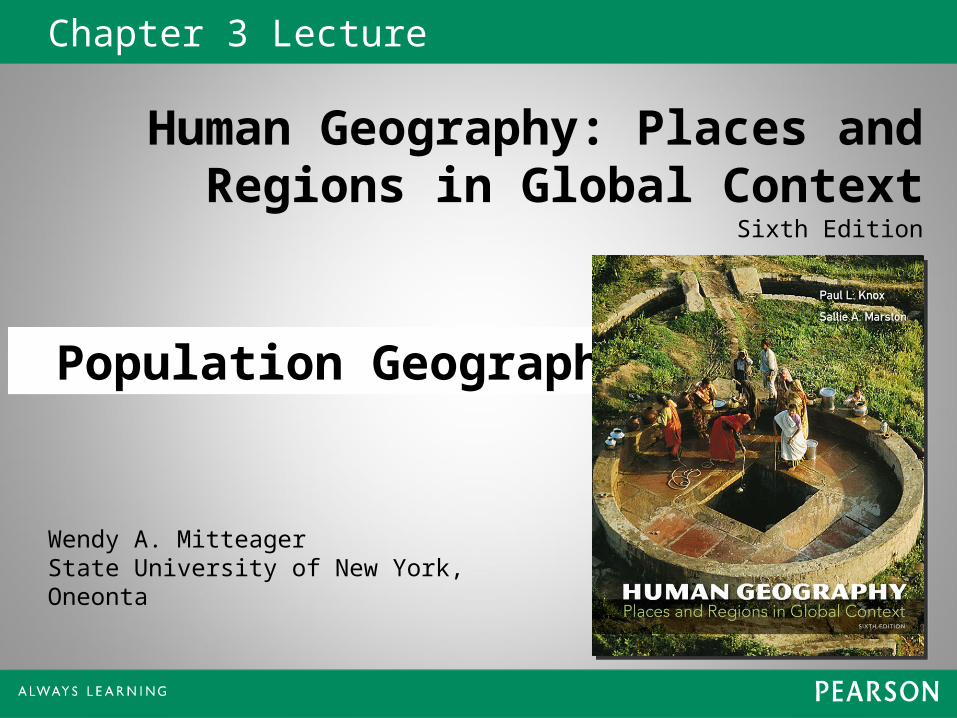
Wendy A. Mitteager State University of New York, Oneonta Chapter 3 Lecture Human Geography: Places and Regions in Global Context Sixth Edition Population Geography
-
Upload
susan-white -
Category
Education
-
view
78 -
download
0
Transcript of Lecture ch03
Wendy A. MitteagerState University of New York, Oneonta
Chapter 3 Lecture
Human Geography: Places and Regions in Global Context
Sixth Edition
Population Geography
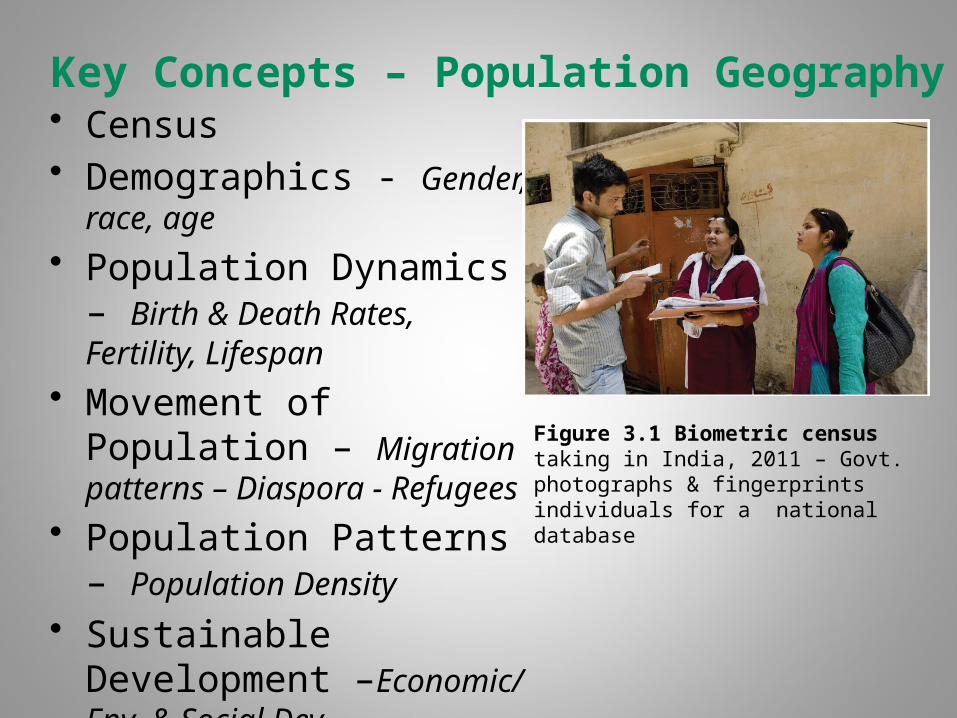
Key Concepts – Population Geography• Census• Demographics - Gender,
race, age
• Population Dynamics – Birth & Death Rates, Fertility, Lifespan
• Movement of Population – Migration patterns – Diaspora - Refugees
• Population Patterns – Population Density
• Sustainable Development –Economic/ Env. & Social Dev.
Figure 3.1 Biometric census taking in India, 2011 – Govt. photographs & fingerprints individuals for a national database
© 2013 Pearson Education, Inc.
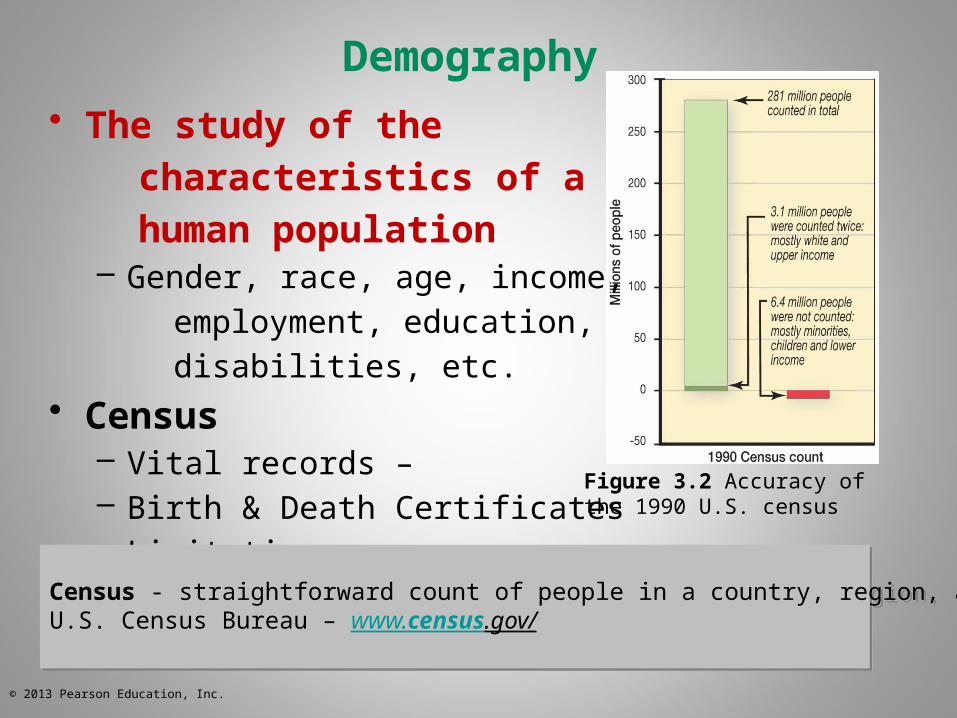
Demography
• The study of the
characteristics of a
human population– Gender, race, age, income,
employment, education,
disabilities, etc.
• Census– Vital records – – Birth & Death Certificates– Limitations
Figure 3.2 Accuracy of the 1990 U.S. census
Census - straightforward count of people in a country, region, area, etc.U.S. Census Bureau – www.census.gov/ Census - straightforward count of people in a country, region, area, etc.U.S. Census Bureau – www.census.gov/
© 2013 Pearson Education, Inc.
World Population Distribution & Density
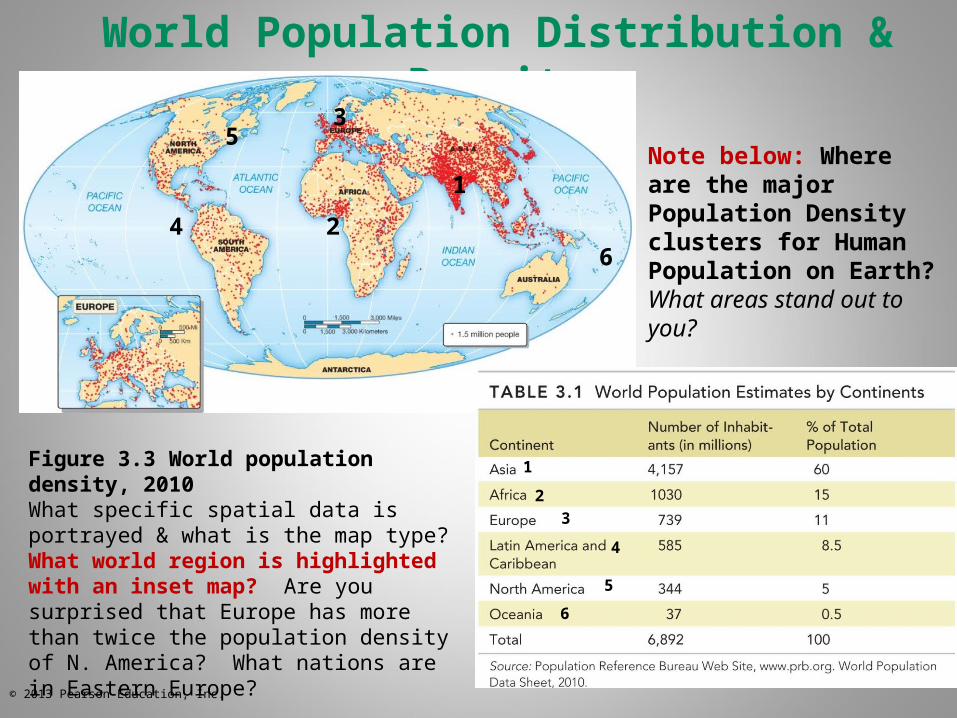
Figure 3.3 World population density, 2010What specific spatial data is portrayed & what is the map type?What world region is highlighted with an inset map? Are you surprised that Europe has more than twice the population density of N. America? What nations are in Eastern Europe?
Note below: Where are the major Population Density clusters for Human Population on Earth?What areas stand out to you?
1
2
3
4
5
6
1
2
4
3
5
6
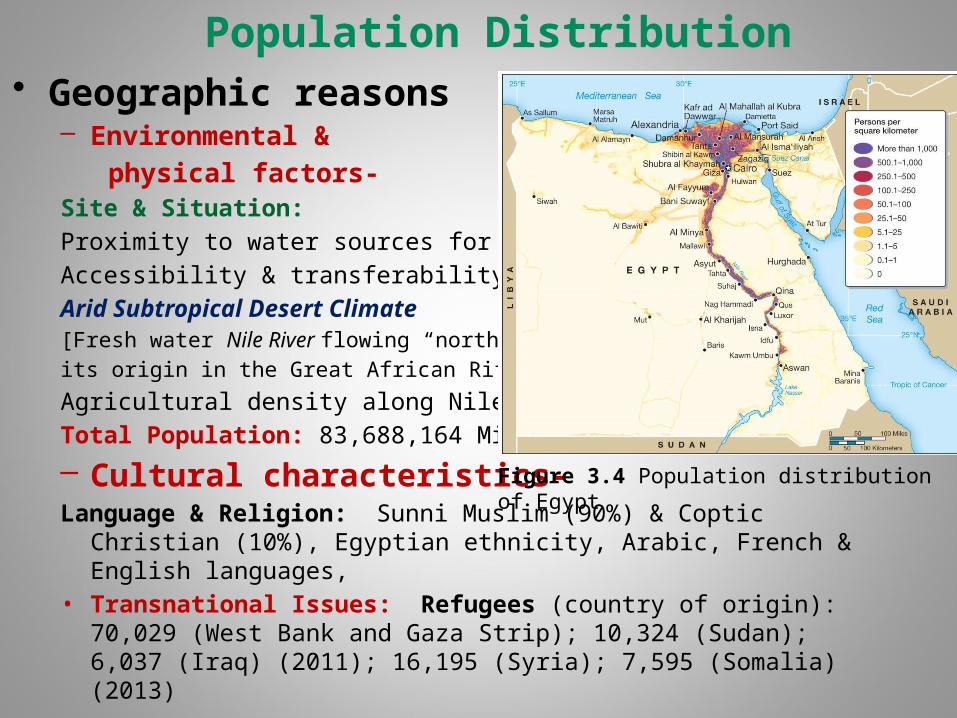
Population Distribution• Geographic reasons
– Environmental &
physical factors-Site & Situation:
Proximity to water sources for transport
Accessibility & transferability of goods
Arid Subtropical Desert Climate [Fresh water Nile River flowing “north” from
its origin in the Great African Rift Valley]
Agricultural density along Nile River
Total Population: 83,688,164 Million
– Cultural characteristics-Language & Religion: Sunni Muslim (90%) & Coptic Christian (10%),
Egyptian ethnicity, Arabic, French & English languages, • Transnational Issues: Refugees (country of origin): 70,029 (West
Bank and Gaza Strip); 10,324 (Sudan); 6,037 (Iraq) (2011); 16,195 (Syria); 7,595 (Somalia) (2013)
Figure 3.4 Population distribution of Egypt
© 2013 Pearson Education, Inc.
[Insert Figure 3.A]
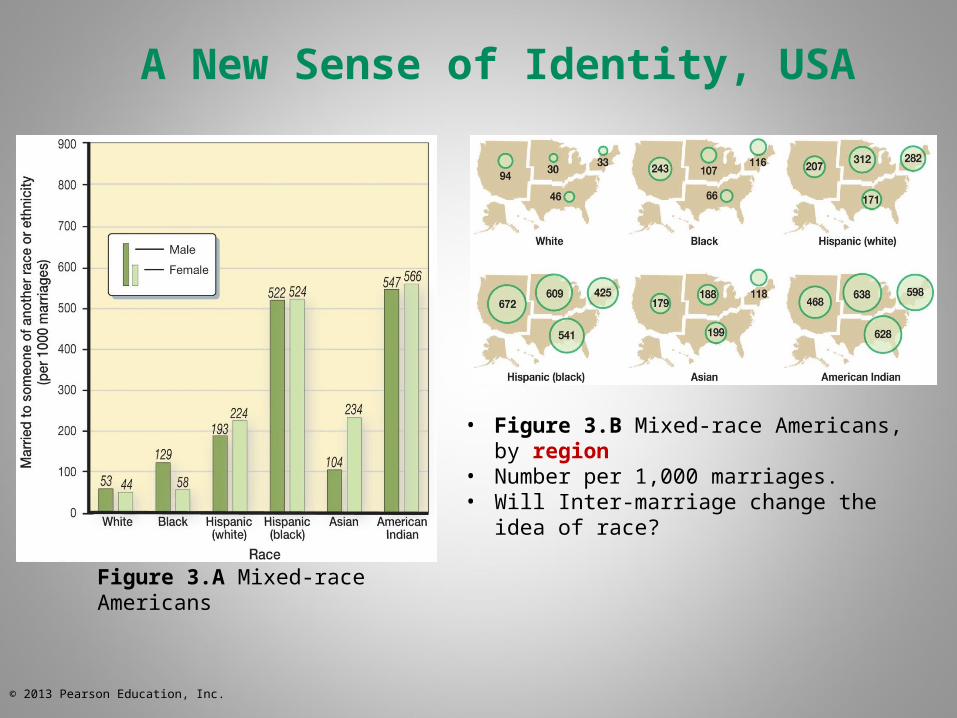
A New Sense of Identity, USA
Figure 3.A Mixed-race Americans
• Figure 3.B Mixed-race Americans, by region• Number per 1,000 marriages.• Will Inter-marriage change the idea of race?
© 2013 Pearson Education, Inc.
Population Density and Composition
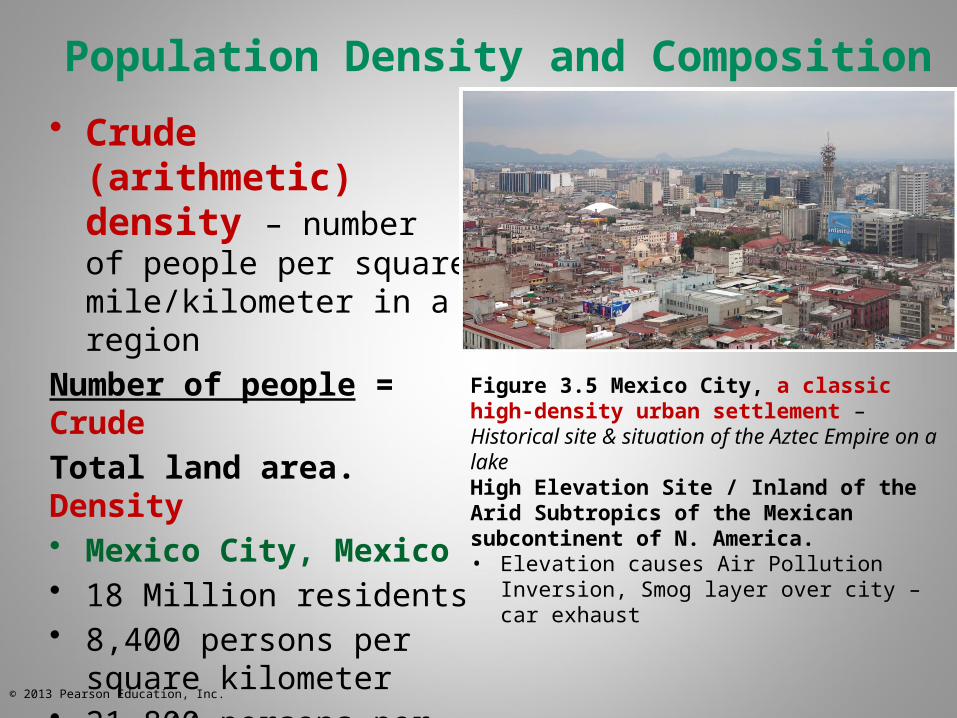
• Crude (arithmetic) density – number of people per square mile/kilometer in a region
Number of people = Crude
Total land area. Density• Mexico City, Mexico• 18 Million residents • 8,400 persons per square
kilometer• 21,800 persons per square
mile
Figure 3.5 Mexico City, a classic high-density urban settlement – Historical site & situation of the Aztec Empire on a lakeHigh Elevation Site / Inland of the Arid Subtropics of the Mexican subcontinent of N. America.• Elevation causes Air Pollution Inversion, Smog
layer over city – car exhaust
Nutritional & Subsistence Agricultural Population Density
• Nutritional density – Ratio between total population & amount of land under cultivation per unit of land.
• Agricultural density - Ratio between people earning their living from working the land – per unit of farmable land in a specific area.
© 2013 Pearson Education, Inc.
© 2013 Pearson Education, Inc.
Health Care Density
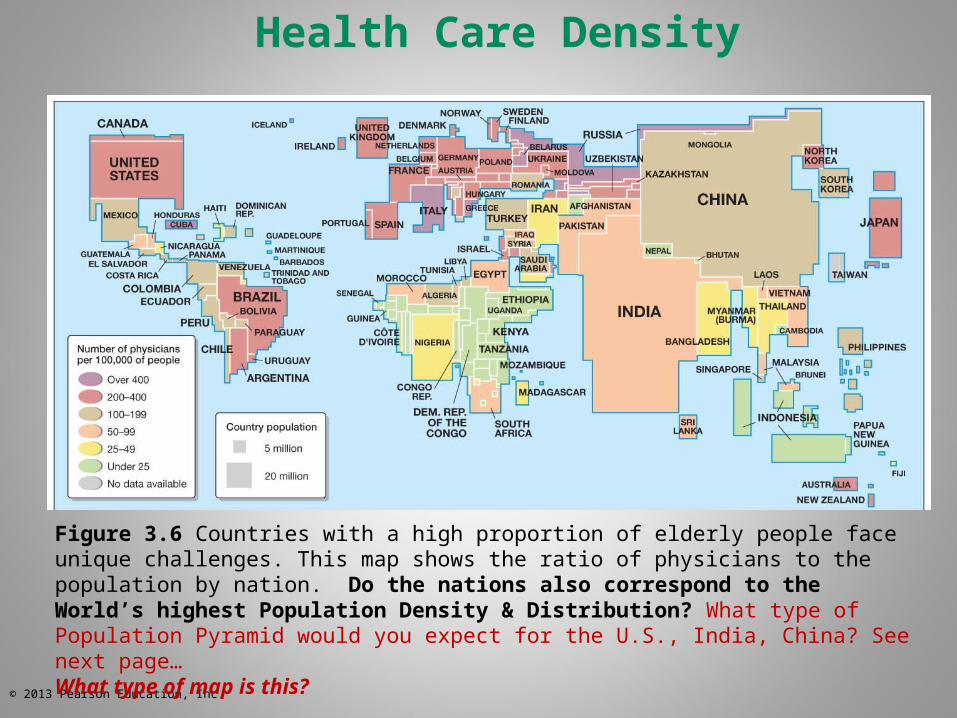
Figure 3.6 Countries with a high proportion of elderly people face unique challenges. This map shows the ratio of physicians to the population by nation. Do the nations also correspond to the World’s highest Population Density & Distribution? What type of Population Pyramid would you expect for the U.S., India, China? See next page… What type of map is this?
© 2013 Pearson Education, Inc.
Age-Sex Pyramids
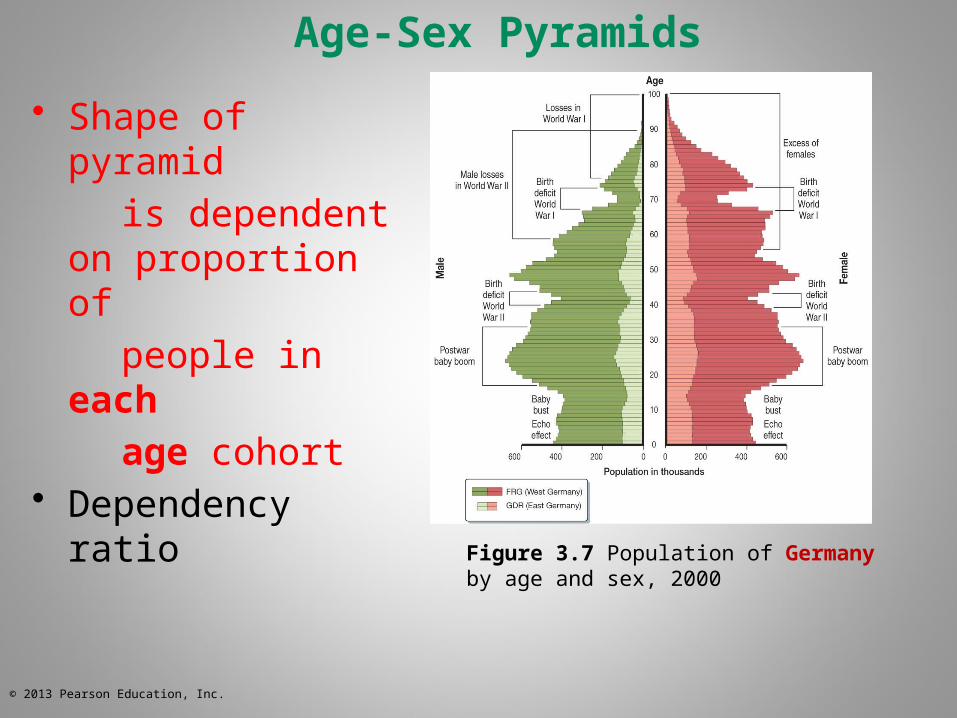
• Shape of pyramid
is dependent on proportion of
people in each
age cohort• Dependency ratio
Figure 3.7 Population of Germany by age and sex, 2000
© 2013 Pearson Education, Inc.
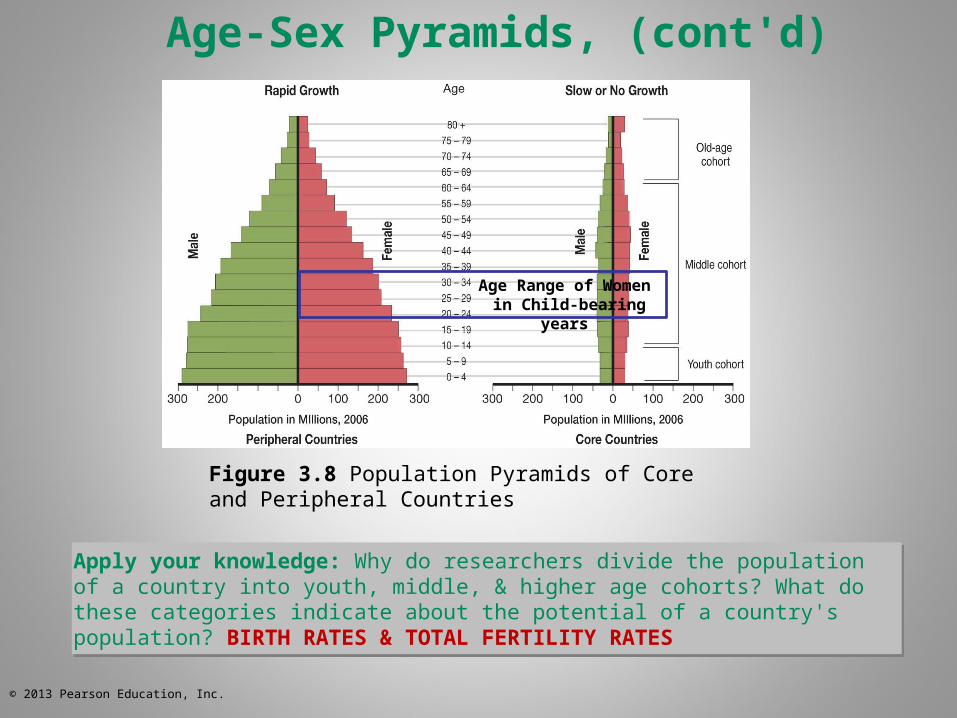
Figure 3.8 Population Pyramids of Core and Peripheral Countries
Age-Sex Pyramids, (cont'd)
Apply your knowledge: Why do researchers divide the population of a country into youth, middle, & higher age cohorts? What do these categories indicate about the potential of a country's population? BIRTH RATES & TOTAL FERTILITY RATES
Age Range of Women in Child-bearing years
© 2013 Pearson Education, Inc.
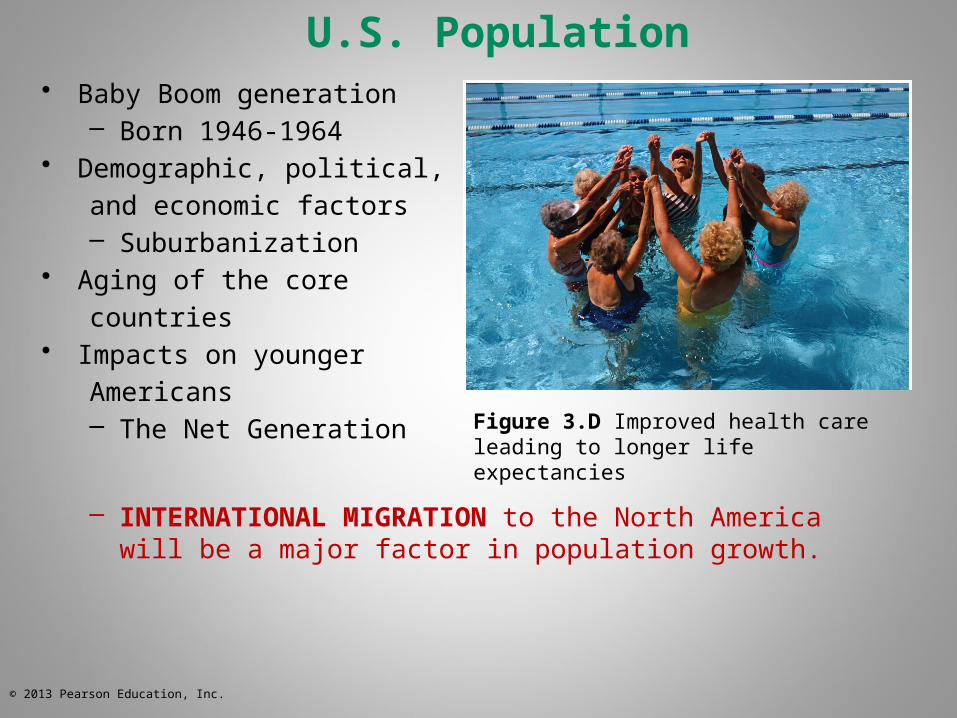
U.S. Population• Baby Boom generation
– Born 1946-1964• Demographic, political,
and economic factors– Suburbanization
• Aging of the core
countries• Impacts on younger
Americans– The Net Generation
– INTERNATIONAL MIGRATION to the North America will be a major factor in population growth.
Figure 3.D Improved health care leading to longer life expectancies
© 2013 Pearson Education, Inc.
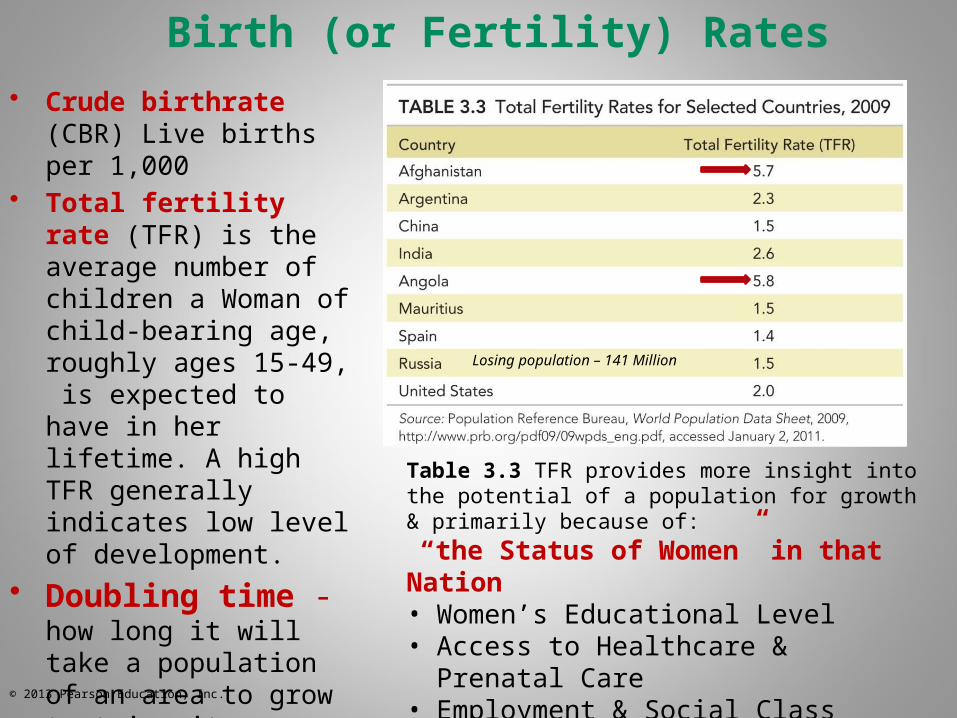
Birth (or Fertility) Rates
• Crude birthrate (CBR) Live births per 1,000
• Total fertility rate (TFR) is the average number of children a Woman of child-bearing age, roughly ages 15-49, is expected to have in her lifetime. A high TFR generally indicates low level of development.
• Doubling time - how long it will take a population of an area to grow to twice its current size. Ex. Kenya’s rate of increase is 3.18% and will double in 22 years.
Table 3.3 TFR provides more insight into the potential of a population for growth & primarily because of:
“the Status of Women” in that Nation• Women’s Educational Level• Access to Healthcare & Prenatal Care• Employment & Social Class
Losing population – 141 Million
© 2013 Pearson Education, Inc.
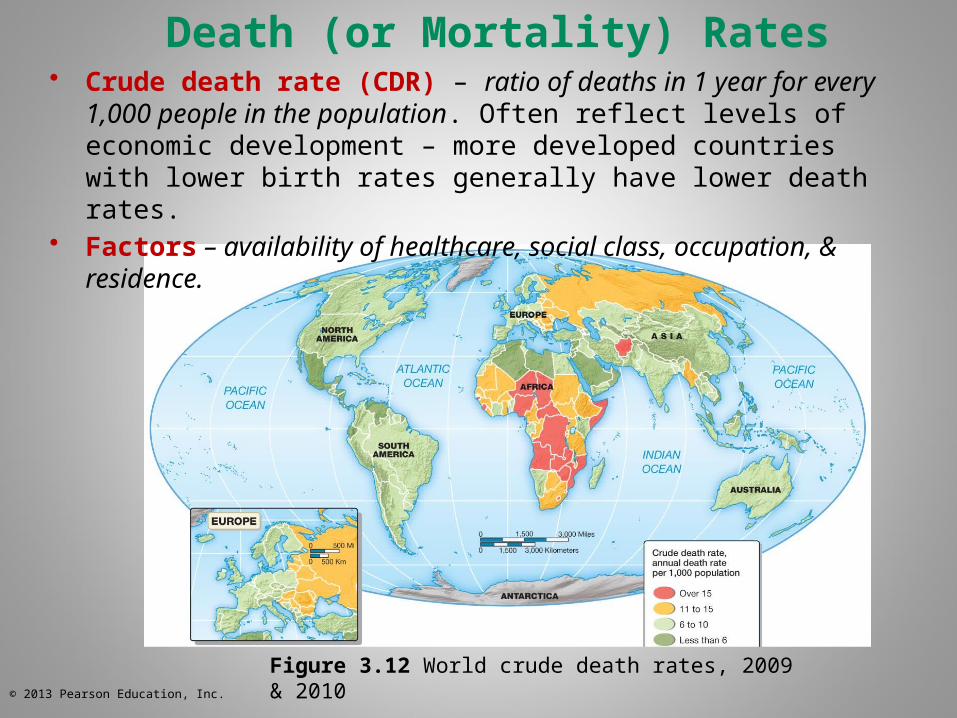
Death (or Mortality) Rates• Crude death rate (CDR) – ratio of deaths in 1 year for every 1,000
people in the population. Often reflect levels of economic development – more developed countries with lower birth rates generally have lower death rates.
• Factors – availability of healthcare, social class, occupation, & residence.
Figure 3.12 World crude death rates, 2009 & 2010
© 2013 Pearson Education, Inc.
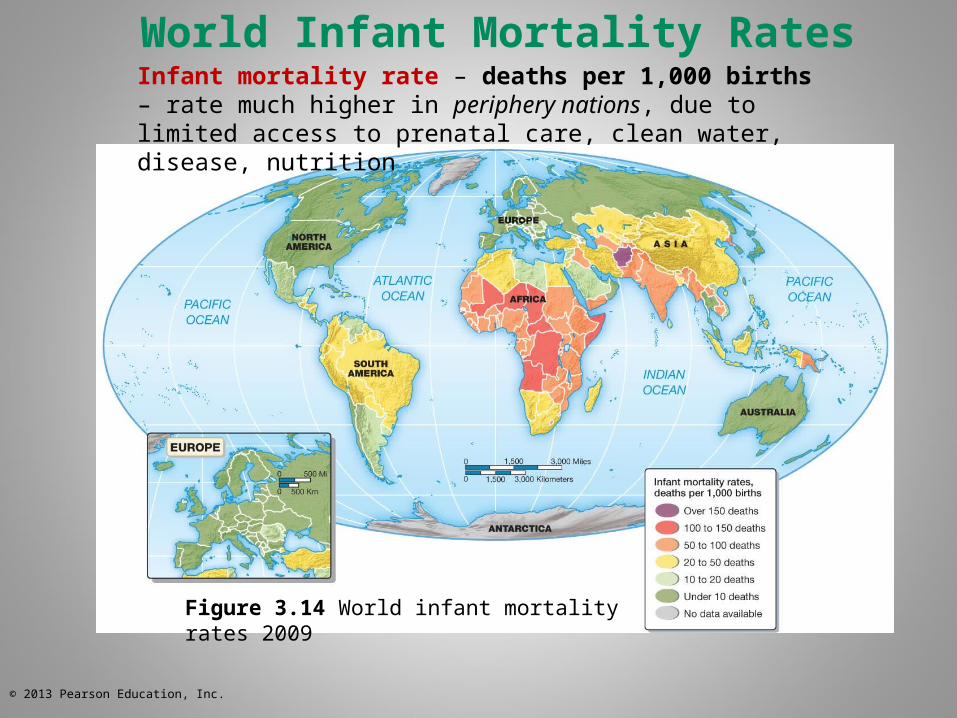
World Infant Mortality Rates
Figure 3.14 World infant mortality rates 2009
Infant mortality rate – deaths per 1,000 births – rate much higher in periphery nations, due to limited access to prenatal care, clean water, disease, nutrition
© 2013 Pearson Education, Inc.
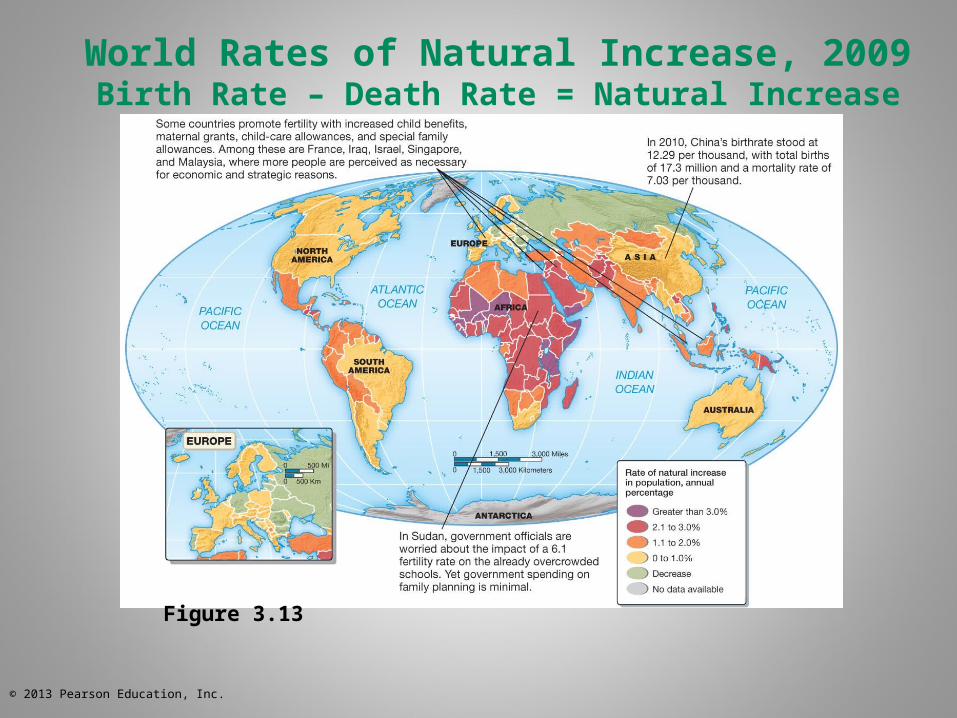
Figure 3.13
World Rates of Natural Increase, 2009Birth Rate – Death Rate = Natural Increase
© 2013 Pearson Education, Inc.
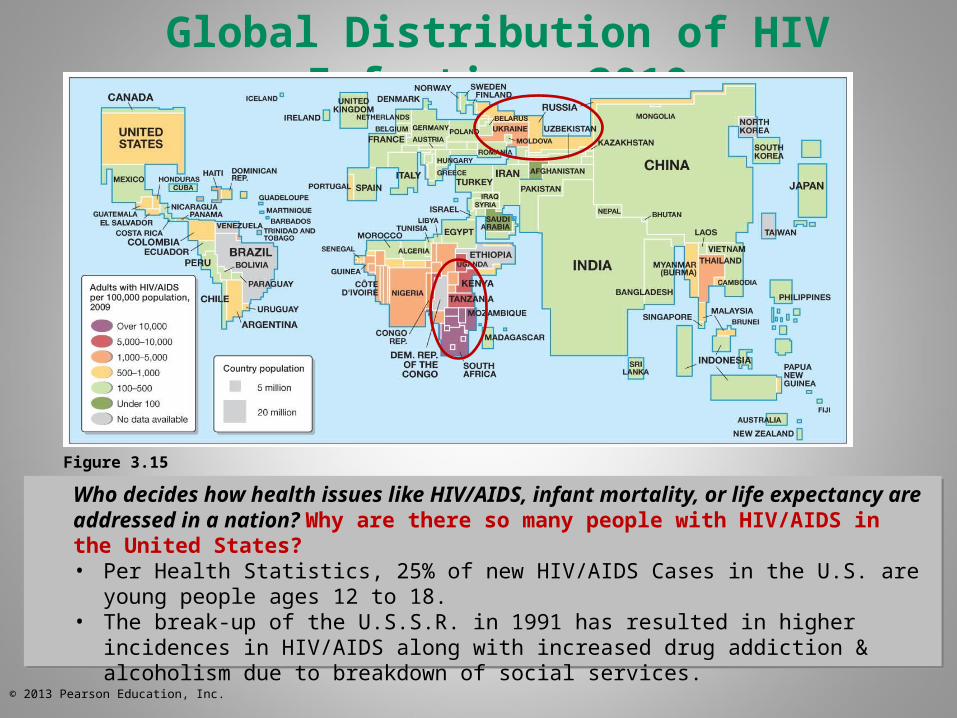
Figure 3.15
Global Distribution of HIV Infection, 2010
Who decides how health issues like HIV/AIDS, infant mortality, or life expectancy are addressed in a nation? Why are there so many people with HIV/AIDS in the United States? • Per Health Statistics, 25% of new HIV/AIDS Cases in the U.S. are young people ages
12 to 18.• The break-up of the U.S.S.R. in 1991 has resulted in higher incidences in HIV/AIDS
along with increased drug addiction & alcoholism due to breakdown of social services.
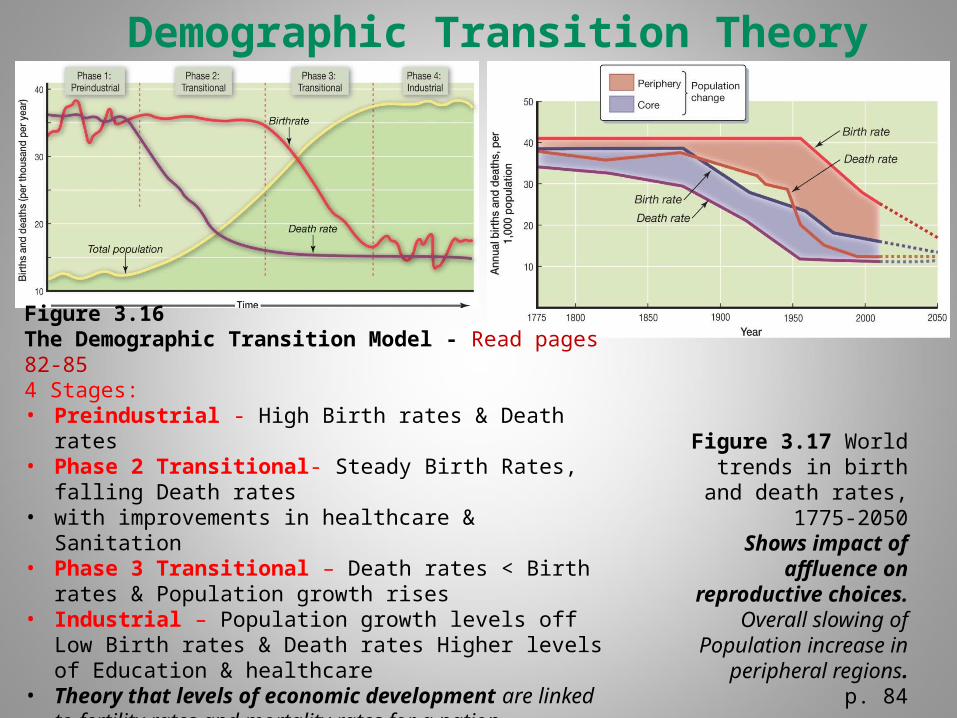
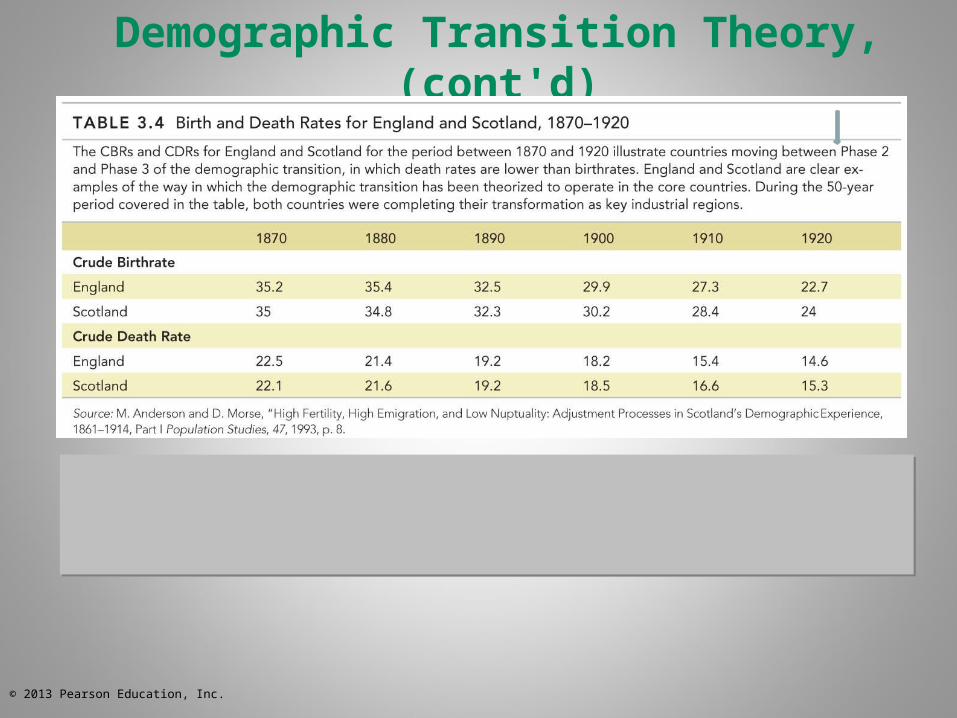
Demographic Transition Theory
Figure 3.16 The Demographic Transition Model - Read pages 82-854 Stages:• Preindustrial - High Birth rates & Death rates • Phase 2 Transitional- Steady Birth Rates, falling Death
rates• with improvements in healthcare & Sanitation• Phase 3 Transitional – Death rates < Birth rates &
Population growth rises• Industrial – Population growth levels off Low Birth rates
& Death rates Higher levels of Education & healthcare• Theory that levels of economic development are linked
to fertility rates and mortality rates for a nation. • Industrialization & technology transform quality of life
leading to lower birth and death rates = more stable population level
Figure 3.17 World trends in birth and
death rates, 1775-2050Shows impact of
affluence on reproductive choices.
Overall slowing of Population increase in
peripheral regions.p. 84
© 2013 Pearson Education, Inc.
Demographic Transition Theory, (cont'd)
© 2013 Pearson Education, Inc.
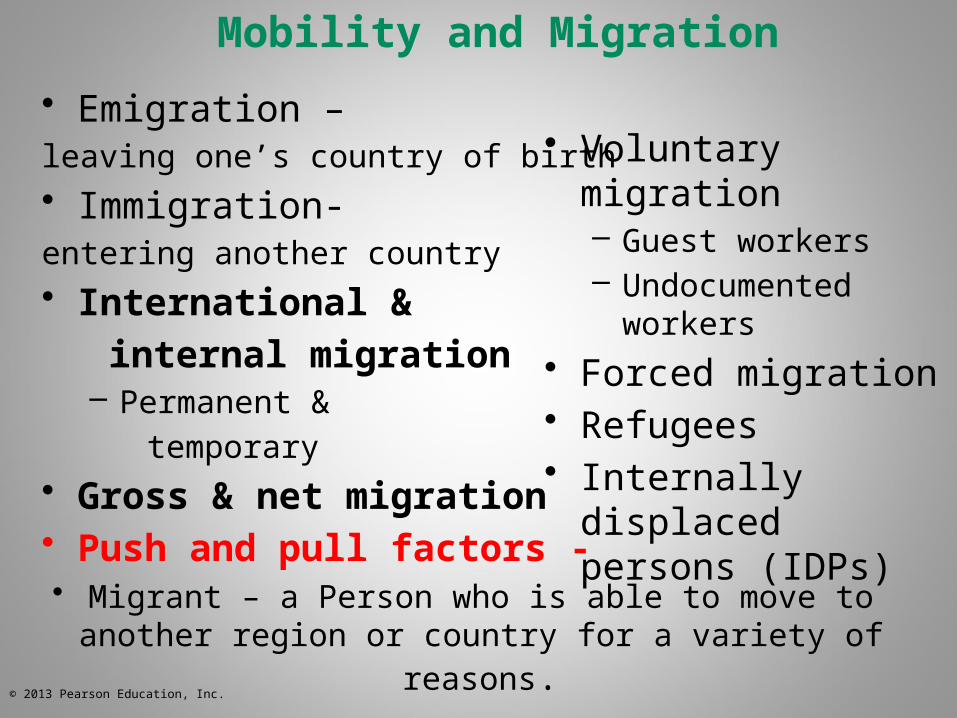
• Voluntary migration– Guest workers– Undocumented
workers
• Forced migration• Refugees• Internally displaced
persons (IDPs)
Mobility and Migration
• Emigration – leaving one’s country of birth
• Immigration-entering another country
• International &
internal migration– Permanent &
temporary
• Gross & net migration• Push and pull factors -
• Migrant – a Person who is able to move to another region or country for a variety of reasons.
© 2013 Pearson Education, Inc.
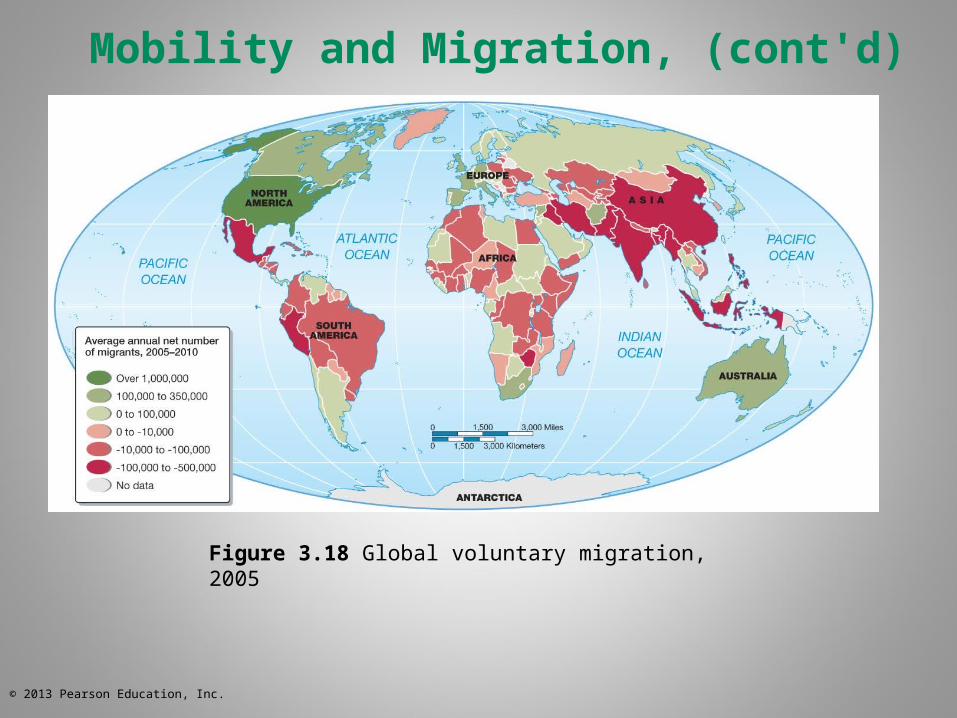
Mobility and Migration, (cont'd)
Figure 3.18 Global voluntary migration, 2005
© 2013 Pearson Education, Inc.
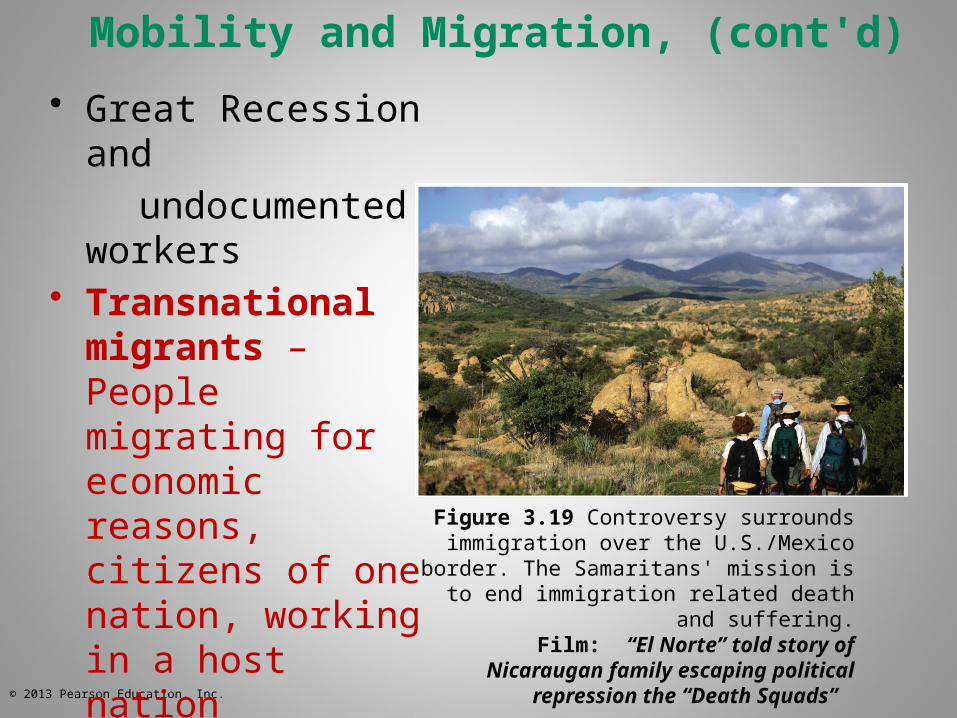
Mobility and Migration, (cont'd)
• Great Recession and
undocumented workers
• Transnational migrants – People migrating for economic reasons, citizens of one nation, working in a host nation
• Eco-migration
Figure 3.19 Controversy surrounds immigration over the U.S./Mexico border. The
Samaritans' mission is to end immigration related death and suffering.
Film: “El Norte” told story of Nicaraugan family escaping political repression the
“Death Squads”
© 2013 Pearson Education, Inc.
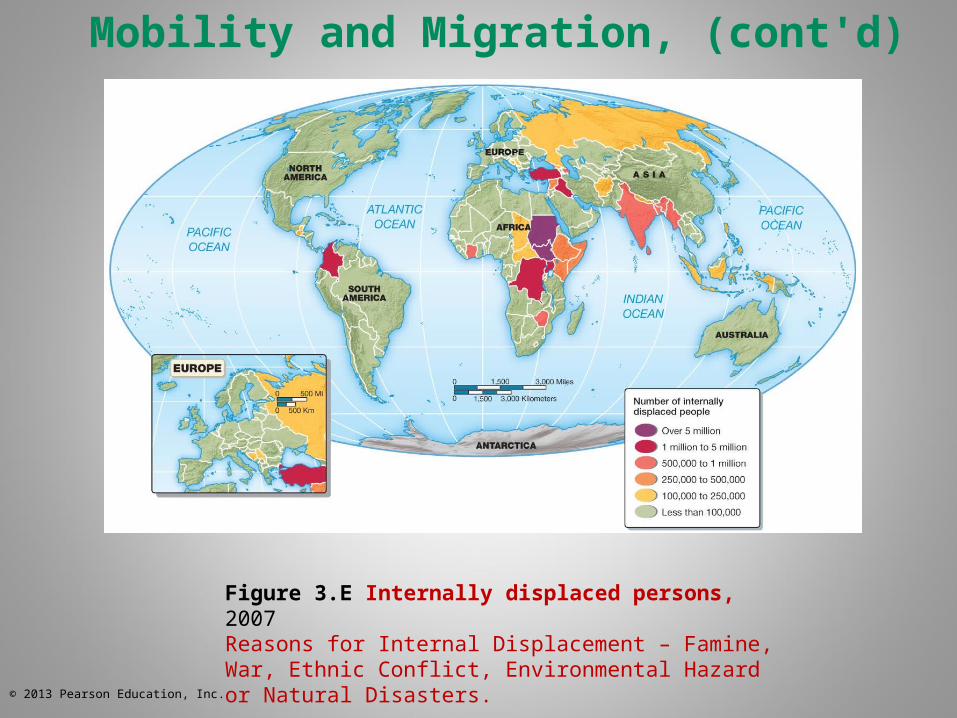
Figure 3.E Internally displaced persons, 2007Reasons for Internal Displacement – Famine, War, Ethnic Conflict, Environmental Hazard or Natural Disasters.
Mobility and Migration, (cont'd)
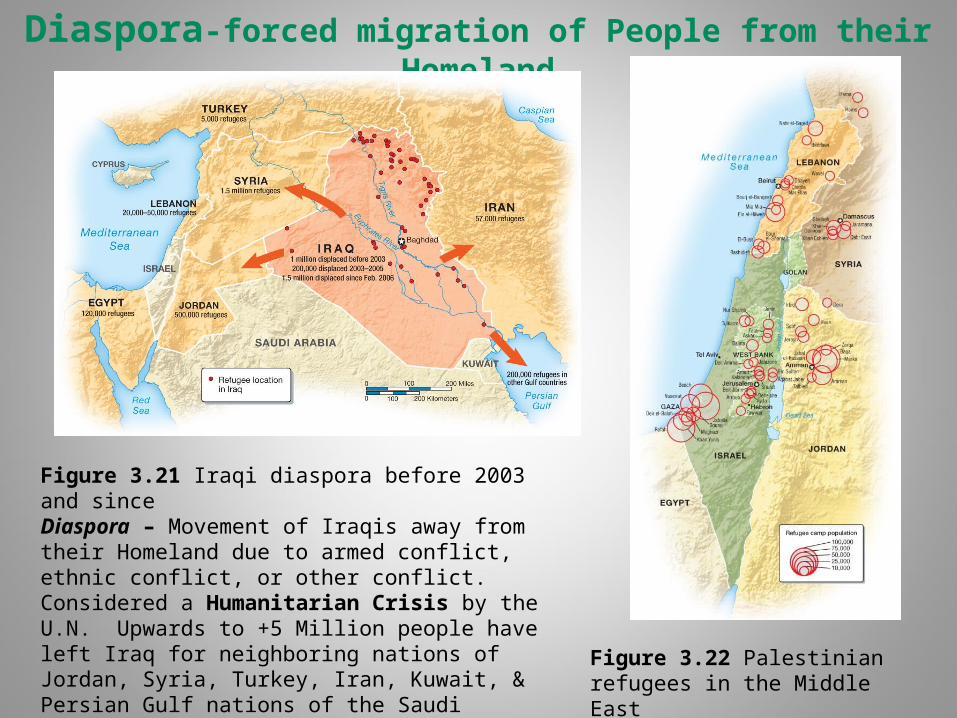
Diaspora-forced migration of People from their Homeland
Figure 3.21 Iraqi diaspora before 2003 and sinceDiaspora – Movement of Iraqis away from their Homeland due to armed conflict, ethnic conflict, or other conflict. Considered a Humanitarian Crisis by the U.N. Upwards to +5 Million people have left Iraq for neighboring nations of Jordan, Syria, Turkey, Iran, Kuwait, & Persian Gulf nations of the Saudi Arabian Peninsula as Refugees since the start of the 2003 Invasion & ensuing Iraqi insurgency.
Figure 3.22 Palestinian refugees in the Middle East
© 2013 Pearson Education, Inc.
Mobility and Migration, (cont'd)
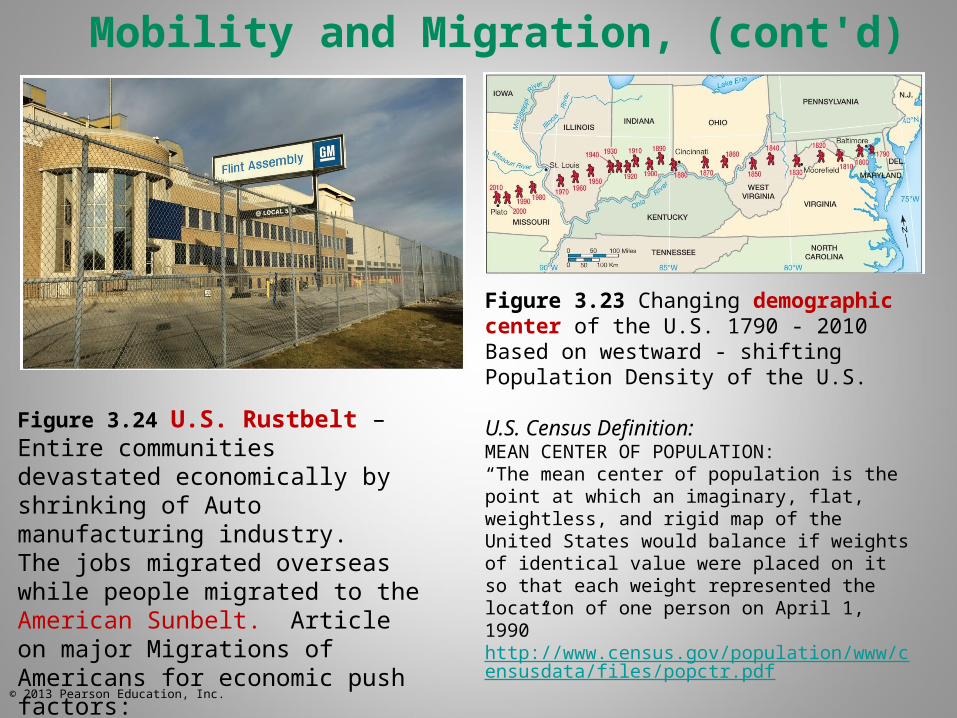
Figure 3.23 Changing demographic center of the U.S. 1790 - 2010Based on westward - shifting Population Density of the U.S.
U.S. Census Definition: MEAN CENTER OF POPULATION:“The mean center of population is the point at which an imaginary, flat, weightless, and rigid map of the United States would balance if weights of identical value were placed on it so that each weight represented the location of one person on April 1, 1990” http://www.census.gov/population/www/censusdata/files/popctr.pdf
Figure 3.24 U.S. Rustbelt – Entire communities devastated economically by shrinking of Auto manufacturing industry.The jobs migrated overseas while people migrated to the American Sunbelt. Article on major Migrations of Americans for economic push factors:http://www.inmotionaame.org/migrations/topic.cfm?migration=11&topic=4
© 2013 Pearson Education, Inc.
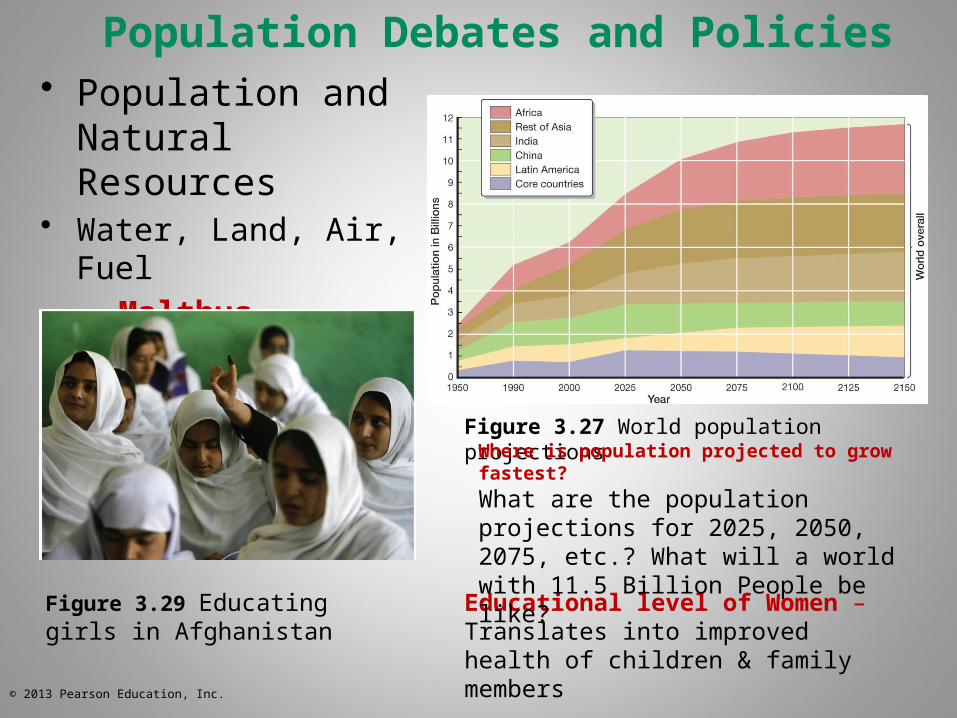
Population Debates and Policies• Population and
Natural Resources• Water, Land, Air, Fuel
– Malthus– Neo-Malthusians
• Population policy
Figure 3.29 Educating girls in Afghanistan
Figure 3.27 World population projections
Educational level of Women – Translates into improved health of children & family members
Where is population projected to grow fastest?
What are the population projections for 2025, 2050, 2075, etc.? What will a world with 11.5 Billion People be like?
© 2013 Pearson Education, Inc.
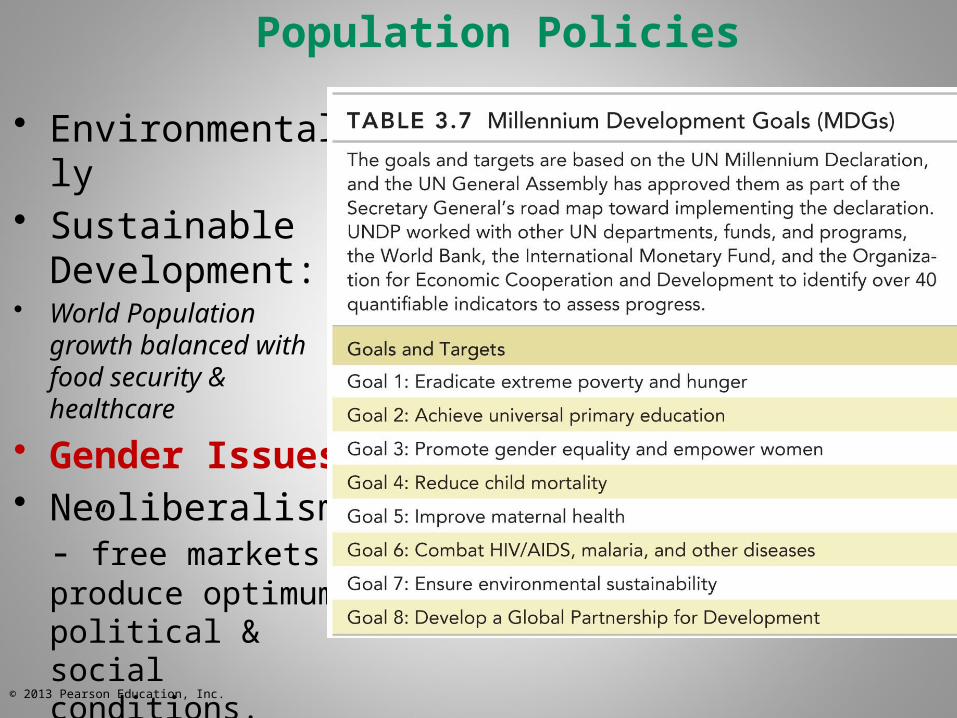
Population Policies
• Environmentally• Sustainable
Development:• World Population growth
balanced with food security & healthcare
• Gender Issues• Neoliberalism-”fre
e markets” produce optimum political & social conditions.
© 2013 Pearson Education, Inc.
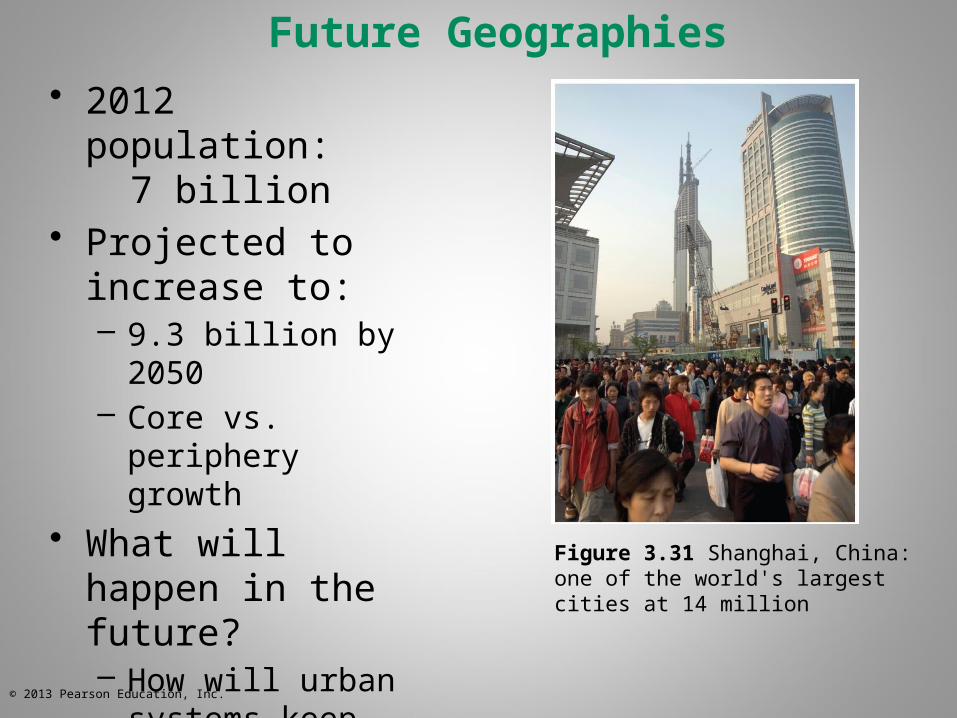
Future Geographies
• 2012 population: 7 billion
• Projected to increase to:– 9.3 billion by 2050– Core vs. periphery
growth
• What will happen in the future?– How will urban
systems keep up? Figure 3.31 Shanghai, China: one of the world's largest cities at 14 million

© 2013 Pearson Education, Inc.
End of Chapter 3


![ch03 lecture(Carbon)[1]](https://static.fdocuments.net/doc/165x107/577dae171a28ab223f8ffd71/ch03-lecturecarbon1.jpg)