
LECTURE 7 NETWORK MANAGEMENT AND DEBUGGING · 2016-03-30 · LECTURE 7 NETWORK MANAGEMENT AND...
85
LECTURE 7 NETWORK MANAGEMENT AND DEBUGGING SYSTEM ADMINISTRATION MTAT.08.021 1 Prepared By: Amnir Hadachi and Artjom Lind University of Tartu, Institute of Computer Science [email protected] / [email protected]
Transcript of LECTURE 7 NETWORK MANAGEMENT AND DEBUGGING · 2016-03-30 · LECTURE 7 NETWORK MANAGEMENT AND...

LECTURE 7 NETWORK MANAGEMENT
AND DEBUGGING
SYSTEM ADMINISTRATION MTAT.08.021
1
Prepared By: Amnir Hadachi and Artjom Lind
University of Tartu, Institute of Computer Science [email protected] / [email protected]

OUTLINE
LECTURE 7: NETWORK MGT AND DEBUGGING
1.Intro
2.Network Troubleshooting
3.Ping
4.SmokePing
5.Trace route
6.Network statistics
7.Inspection of live interface activity
8.Packet sniffers
9.Network management protocols
10.Network mapper
2

INTRO1.
3

INTRO
LECTURE 7: NETWORK MGT AND DEBUGGING
• Network management tasks:
✴ Fault detection for networks, gateways, and critical servers
✴ Schemes for notifying an administrator of problems
✴ General network monitoring, to balance load and plan expansion
✴ Documentation and visualization of the network
✴ Administration of network devices from a central site
QUOTE:
Networks has tendency to increase the number of interdependencies among machine; therefore, they tend to magnify problems.
4

INTRO
LECTURE 7: NETWORK MGT AND DEBUGGING
0
40
80
120
160
AUTOMATION
Network Size
Management Procedures
ILLUSTRATION OF NETWORK GROWTH VS MGT PROCEDURES AUTOMATION
5

INTRO
LECTURE 7: NETWORK MGT AND DEBUGGING
• Network:
• Subnets + Routers / switches
• Automating mgt tasks:
• shell scripting
• network mgt stationsource: http://www.eventhelix.com/RealtimeMantra/Networking/ip_routing.htm#.VvjkA2MQhIY
Time to consider
6

NETWORK TROUBLESHOOTING
2.
7

NETWORK TROUBLESHOOTING
LECTURE 7: NETWORK MGT AND DEBUGGING
• Many tools are available for debugging
• Debugging:
• Low-level (e.g. TCP/IP layer)
• high-level (e.g. DNS, NFS, and HTTP)
• This section progress:
GENERAL TROUBLESHOOTING
STRATEGY
ESSENTIAL TOOLS
ping trace route
netstat nmap
tcpdump …
8

NETWORK TROUBLESHOOTING
LECTURE 7: NETWORK MGT AND DEBUGGING
• Before action, principle to consider:
✴ Make one change at a time
✴ Document the situation as it was before you got involved.
✴ Document any changes you add since the moment of your involvement.
✴ You should be aware that problems might be transient; thus, begin by capturing relevant information using tools such as “sar" or “nmon".
✴ Always start at one end of a system and work your way trough the system’s critical components until you reach the problem.
✴ Communicate regularly with your colleague. (team work spirit)
✴ Use the network layers to negotiate the problem. (top to bottom or vice versa)
9

NETWORK TROUBLESHOOTING
LECTURE 7: NETWORK MGT AND DEBUGGING
• when you are working your way trough the network layer ask yourself question such as:
• Do you have physical connectivity and a link light?
• Is your interface configured properly?
• Do your ARP tables show other hosts?
• Is there a firewall on your local machine?
• Is there a firewall anywhere between you and the destination?
• If firewalls are involved, do they pass ICMP ping packets and responses?
• Can you ping the localhost address (127.0.0.1)?
• Can you ping other local hosts by IP address?
• Is DNS working properly?1
• Can you ping other local hosts by hostname?
• Can you ping hosts on another network?
• Do high-level services such as web and SSH servers work?
• Did you really check the firewalls?
10

PING3.
PING!!!
11

PING
LECTURE 7: NETWORK MGT AND DEBUGGING
• What is a ping in networking?
• What is a ping test?
Ping is a networking utility program to test if a particular host is reachable.
Ping test is the process of calculating how long it takes for a packet to reach the server and to be sent back.
12

PING
LECTURE 7: NETWORK MGT AND DEBUGGING
• Command COMMAND: $ ping <address>
OUTPUT: AHs-Mac-mini:~ AH$ ping www.ut.eePING www.ut.ee (193.40.5.73): 56 data bytes64 bytes from 193.40.5.73: icmp_seq=0 ttl=61 time=1.173 ms64 bytes from 193.40.5.73: icmp_seq=1 ttl=61 time=1.112 ms^C--- www.ut.ee ping statistics ---2 packets transmitted, 2 packets received, 0.0% packet lossround-trip min/avg/max/stddev = 1.112/1.143/1.173/0.031 ms
TTL ?
ICMP ?
packets ?
time ?
13

PING
LECTURE 7: NETWORK MGT AND DEBUGGING
• What is ICMP ?
• ICMP packet structure:
DEFINITION:
ICMP or Internet Control Message Protocol is one of the main internet protocols used by the network devices to report errors and service availability info.
Ethernet Frame
IP Packet
ICMP Packet
ICMP Data
Variable
ICMP Header 8 bytes
IP Header
20 bytes
MAC Header
14 bytes
14

PING
LECTURE 7: NETWORK MGT AND DEBUGGING
• How does it work?
Servers are you alive ?ICMP ECHO_REQUEST
User yes I am ICMP ECHO_RESPONSE
15

PING
LECTURE 7: NETWORK MGT AND DEBUGGING
• What ping can tell you?
• Ping uses a unique sequence of each transmitted packets and reports on each one if it was received or not. Therefore, you can conclude if the packets has been dropped or not, or rendered.
• The fact that the ping uses timestamp you can compute how long the exchange of the packets took. (Round Trip Time, RTT)
• Ping also report if the router is declining the target host unreachable.
16

PING
LECTURE 7: NETWORK MGT AND DEBUGGING
• Ping commands:EXAMPLE 1: TIME INTERVAL MANIPULATION
COMMAND: $ ping -i <interval_time_digit> <address>
OUTPUT: AHs-Mac-mini:~ AH$ ping -i 5 www.ut.eePING www.ut.ee (193.40.5.73): 56 data bytes64 bytes from 193.40.5.73: icmp_seq=0 ttl=61 time=0.998 ms64 bytes from 193.40.5.73: icmp_seq=1 ttl=61 time=0.801 ms64 bytes from 193.40.5.73: icmp_seq=2 ttl=61 time=1.196 ms64 bytes from 193.40.5.73: icmp_seq=3 ttl=61 time=0.867 ms^C^C--- www.ut.ee ping statistics ---4 packets transmitted, 4 packets received, 0.0% packet lossround-trip min/avg/max/stddev = 0.801/0.966/1.196/0.151 ms
17

PING
LECTURE 7: NETWORK MGT AND DEBUGGING
• Ping commands:EXAMPLE 2: CHECKING LOCAL INTERFACE IF IT IS UP RUNNING
COMMAND: $ ping 0
OUTPUT: AHs-Mac-mini:~ AH$ ping localhostPING localhost (127.0.0.1): 56 data bytes64 bytes from 127.0.0.1: icmp_seq=0 ttl=64 time=0.045 ms64 bytes from 127.0.0.1: icmp_seq=1 ttl=64 time=0.168 ms64 bytes from 127.0.0.1: icmp_seq=2 ttl=64 time=0.085 ms64 bytes from 127.0.0.1: icmp_seq=3 ttl=64 time=0.058 ms^C--- localhost ping statistics ---4 packets transmitted, 4 packets received, 0.0% packet lossround-trip min/avg/max/stddev = 0.045/0.089/0.168/0.048 ms
$ ping localhost
18
PING
LECTURE 7: NETWORK MGT AND DEBUGGING
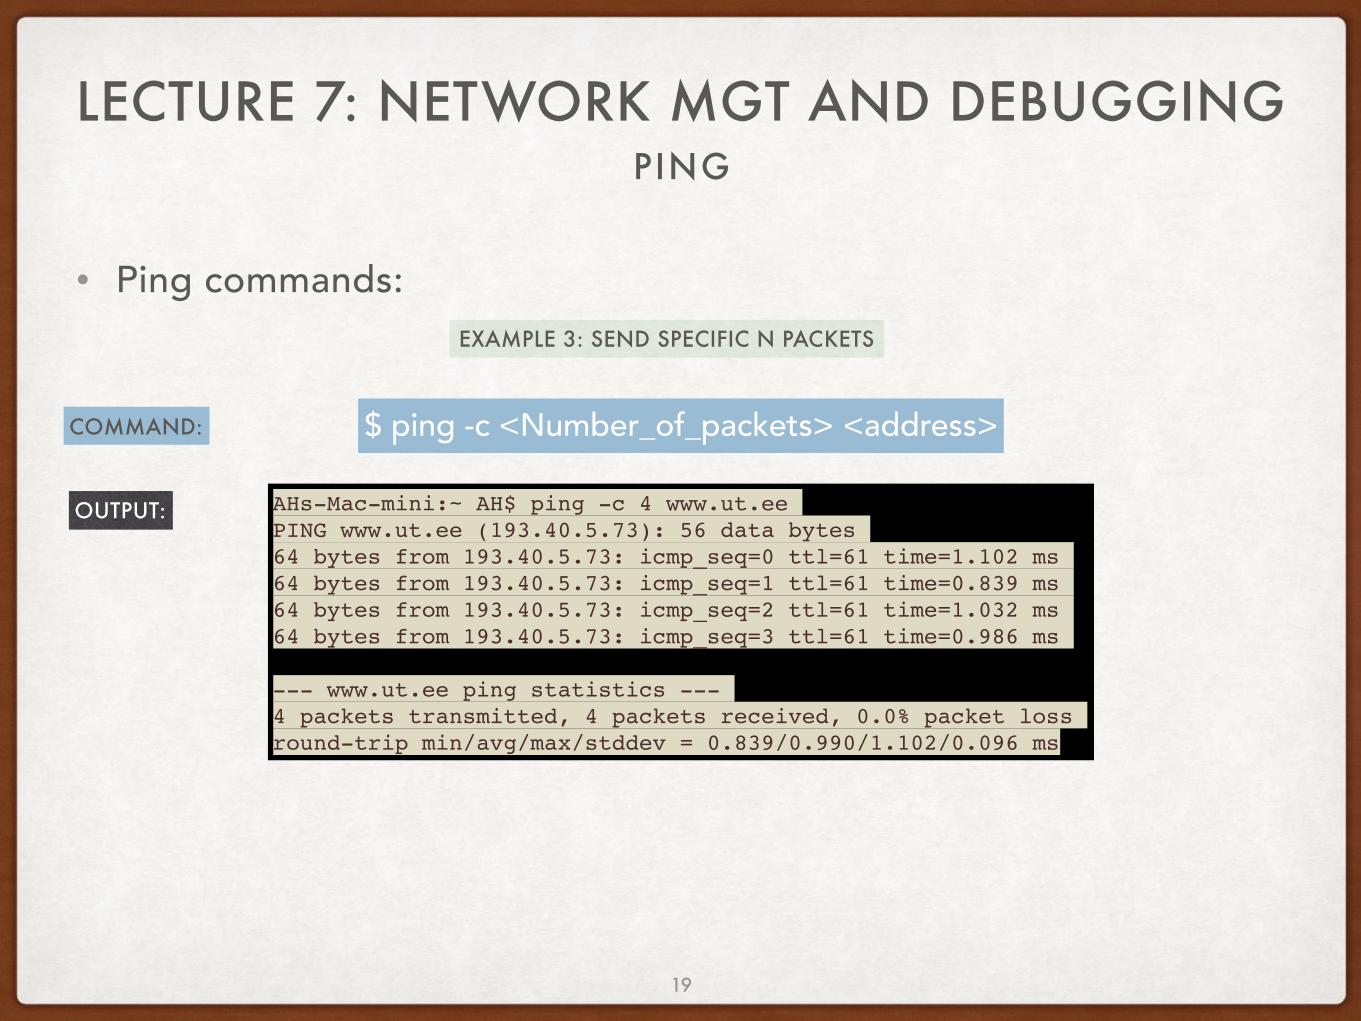
• Ping commands:EXAMPLE 3: SEND SPECIFIC N PACKETS
COMMAND: $ ping -c <Number_of_packets> <address>
OUTPUT: AHs-Mac-mini:~ AH$ ping -c 4 www.ut.eePING www.ut.ee (193.40.5.73): 56 data bytes64 bytes from 193.40.5.73: icmp_seq=0 ttl=61 time=1.102 ms64 bytes from 193.40.5.73: icmp_seq=1 ttl=61 time=0.839 ms64 bytes from 193.40.5.73: icmp_seq=2 ttl=61 time=1.032 ms64 bytes from 193.40.5.73: icmp_seq=3 ttl=61 time=0.986 ms
--- www.ut.ee ping statistics ---4 packets transmitted, 4 packets received, 0.0% packet lossround-trip min/avg/max/stddev = 0.839/0.990/1.102/0.096 ms
19

PING
LECTURE 7: NETWORK MGT AND DEBUGGING
• Ping commands:EXAMPLE 4: FLOOD THE NETWORK
COMMAND: $ ping -f <address>
OUTPUT: AHs-Mac-mini:~ AH$ sudo ping -f localhostPassword:PING localhost (127.0.0.1): 56 data bytes..Request timeout for icmp_seq 250.Request timeout for icmp_seq 251……….Request timeout for icmp_seq 1748^C--- localhost ping statistics ---1750 packets transmitted, 750 packets received, 57.1% packet lossround-trip min/avg/max/stddev = 0.013/0.026/0.137/0.009 ms
20

PING
LECTURE 7: NETWORK MGT AND DEBUGGING
• Ping commands:EXAMPLE 5: FIND OUT IP ADDRESS
COMMAND: $ ping -c 1 <address>
OUTPUT: AHs-Mac-mini:~ AH$ ping -c 1 www.ut.eePING www.ut.ee (193.40.5.73): 56 data bytes64 bytes from 193.40.5.73: icmp_seq=0 ttl=61 time=1.064 ms
--- www.ut.ee ping statistics ---1 packets transmitted, 1 packets received, 0.0% packet lossround-trip min/avg/max/stddev = 1.064/1.064/1.064/0.000 ms
21

PING
LECTURE 7: NETWORK MGT AND DEBUGGING
• Ping commands:EXAMPLE 6: PRINT ONLY PING COMMAND REPORT STAT
COMMAND: $ ping -c 5 -q <address>
OUTPUT: AHs-Mac-mini:~ AH$ ping -c 5 -q www.ut.eePING www.ut.ee (193.40.5.73): 56 data bytes
--- www.ut.ee ping statistics ---5 packets transmitted, 5 packets received, 0.0% packet lossround-trip min/avg/max/stddev = 0.905/1.030/1.362/0.169 ms
22

PING
LECTURE 7: NETWORK MGT AND DEBUGGING
• Ping commands:EXAMPLE 7: TIMEOUT
COMMAND: $ ping -t 7 <address>
OUTPUT: AHs-Mac-mini:~ AH$ ping -t 7 localhostPING localhost (127.0.0.1): 56 data bytes64 bytes from 127.0.0.1: icmp_seq=0 ttl=64 time=0.063 ms64 bytes from 127.0.0.1: icmp_seq=1 ttl=64 time=0.072 ms64 bytes from 127.0.0.1: icmp_seq=2 ttl=64 time=0.134 ms64 bytes from 127.0.0.1: icmp_seq=3 ttl=64 time=0.068 ms64 bytes from 127.0.0.1: icmp_seq=4 ttl=64 time=0.161 ms64 bytes from 127.0.0.1: icmp_seq=5 ttl=64 time=0.082 ms64 bytes from 127.0.0.1: icmp_seq=6 ttl=64 time=0.083 ms
--- localhost ping statistics ---7 packets transmitted, 7 packets received, 0.0% packet lossround-trip min/avg/max/stddev = 0.063/0.095/0.161/0.035 ms
23

PING
LECTURE 7: NETWORK MGT AND DEBUGGING
• Ping commands:
• What does it mean ?
EXAMPLE: SIMPLE PING WITH NO ANSWER
COMMAND: $ ping <address>
OUTPUT: AHs-Mac-mini:~ AH$ ping 192.168.88.243PING 192.168.88.243 (192.168.88.243): 56 data bytesRequest timeout for icmp_seq 0Request timeout for icmp_seq 1Request timeout for icmp_seq 2Request timeout for icmp_seq 3Request timeout for icmp_seq 4^C--- 192.168.88.243 ping statistics ---6 packets transmitted, 0 packets received, 100.0% packet loss
24
PING
LECTURE 7: NETWORK MGT AND DEBUGGING
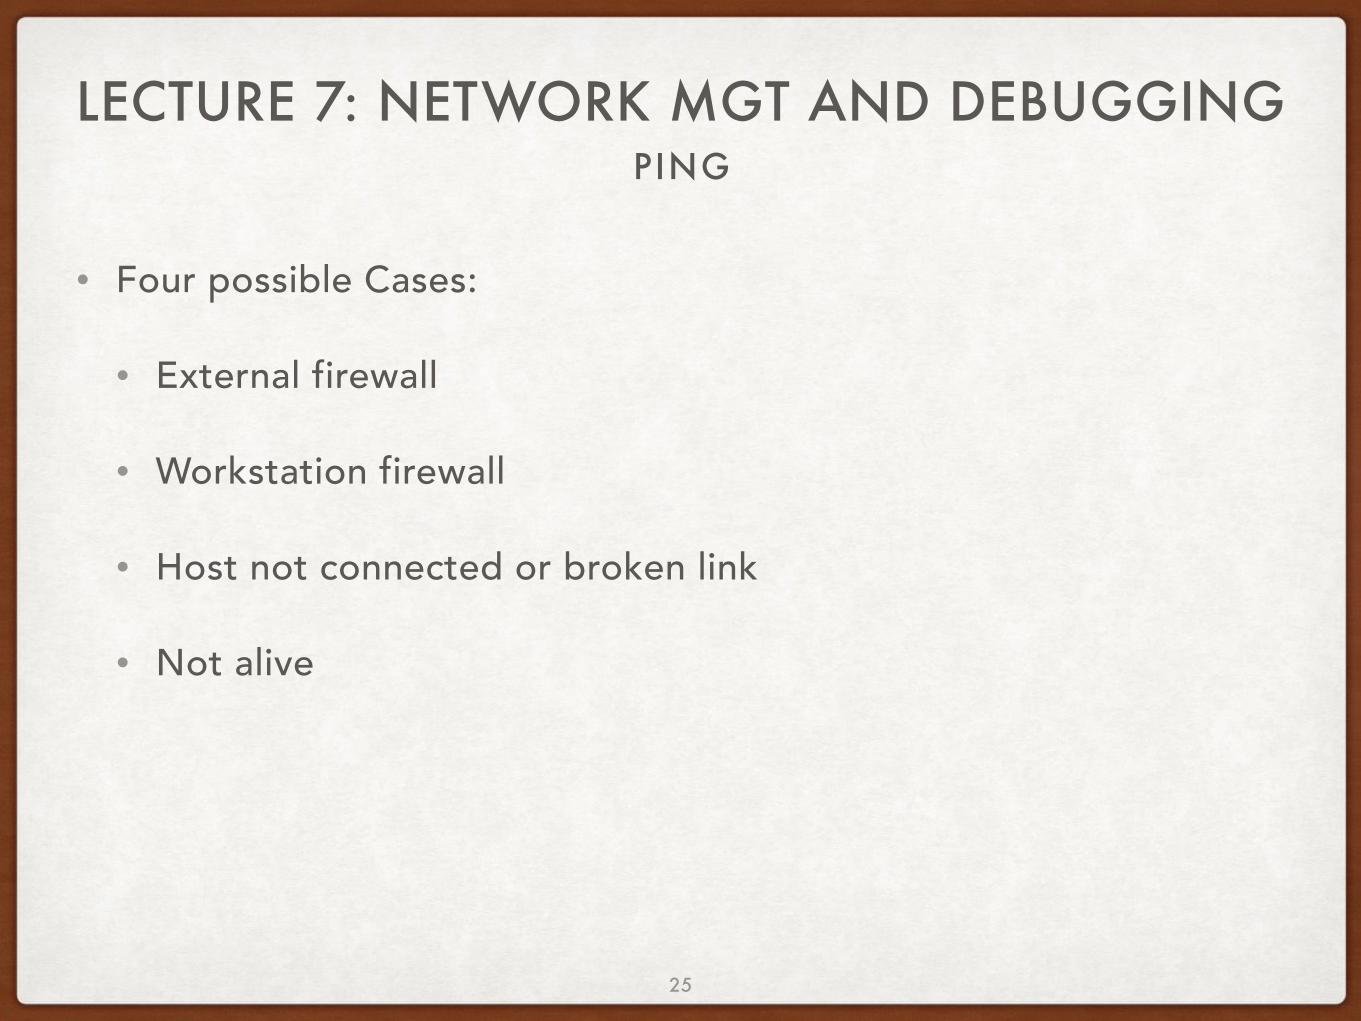
• Four possible Cases:
• External firewall
• Workstation firewall
• Host not connected or broken link
• Not alive
25

PING
LECTURE 7: NETWORK MGT AND DEBUGGING
• If A can ping B, does mean that the opposite it true?
TruePing
?
26

SMOKEPING
4.
27

SMOKEPING
LECTURE 7: NETWORK MGT AND DEBUGGING
• SmokePing is a open source program that keep track of your network latency (Gathering ping statistics over time).
• Contributors to latency are:
• Propagation
• Transmission
• Router and other processing
• Other computers or storage delays
28

SMOKEPING
LECTURE 7: NETWORK MGT AND DEBUGGING
• Example:
• Demo: http://oss.oetiker.ch/smokeping-demo/?target=World.Europe.Estonia
29

TRACEROUTE
5.
Trace IP packets
30

TRACEROUTE
LECTURE 7: NETWORK MGT AND DEBUGGING
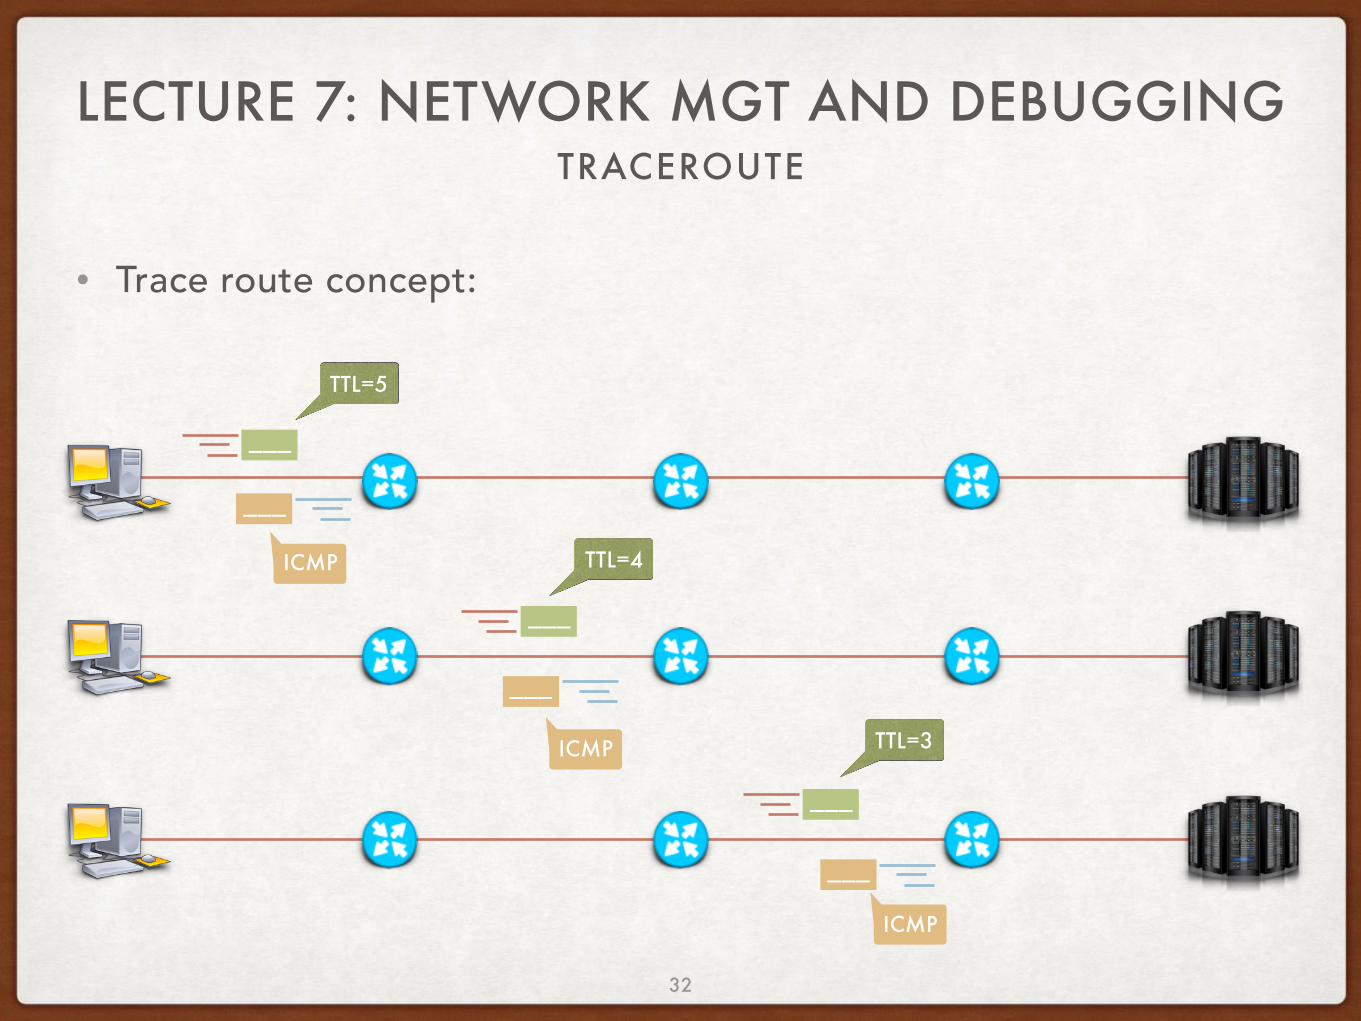
• Traceroute:
• All Modern operating system comes with tracroute version; the difference can be resumed to the syntax of the commands.
DEFINITION:
traceroute is the sequence of gateways through which an IP packet travels to reach its destination.
31
TRACEROUTE
LECTURE 7: NETWORK MGT AND DEBUGGING
• Trace route concept:
———
TTL=5
———
———
TTL=4
TTL=3
———
———
———
ICMP
ICMP
ICMP
32

TRACEROUTE
LECTURE 7: NETWORK MGT AND DEBUGGING
• Trcaeroute commands:EXAMPLE 1: RUN TRACE ROUTE
COMMAND: $ traceroute <address>
OUTPUT: MBP-of-HA:~ amnir$ traceroute ds.cs.ut.eetraceroute to dionysos.at.mt.ut.ee (193.40.36.82), 64 hops max, 52 byte packets 1 dsldevice (192.168.1.254) 47.049 ms 95.413 ms 99.363 ms 2 3-160-191-90.dyn.estpak.ee (90.191.160.3) 32.998 ms 37.149 ms 49.278 ms 3 * * * 4 * * * 5 * * * 6 kjj-sr9-lag-2.ee.estpak.ee (213.168.1.19) 7.635 ms * * 7 eenet.demarc.estpak.ee (195.250.170.70) 6.910 ms 8.003 ms 7.667 ms 8 trt-fe.bb.eenet.ee (193.40.133.6) 11.576 ms 11.047 ms 15.118 ms 9 sein.ut.ee (193.40.12.10) 11.001 ms 10.631 ms 19.406 ms10 ak-gw.ut.ee (193.40.12.1) 11.272 ms 11.680 ms 11.033 ms11 dionysos.at.mt.ut.ee (193.40.36.82) 15.180 ms !Z 12.568 ms !Z 11.425 ms !Z
33

TRACEROUTE
LECTURE 7: NETWORK MGT AND DEBUGGING
• Trcaeroute commands:EXAMPLE 2: DISABLING IP ADDRESS AND HOST NAME MAPPING
COMMAND: $ traceroute -n <address>
OUTPUT: MBP-of-HA:~ amnir$ traceroute -n ds.cs.ut.eetraceroute to dionysos.at.mt.ut.ee (193.40.36.82), 64 hops max, 52 byte packets 1 192.168.1.254 88.451 ms 102.922 ms 96.980 ms 2 90.191.160.3 16.697 ms 2.659 ms 5.672 ms 3 * * * 4 * * * 5 * * * 6 * 213.168.1.19 7.392 ms 11.743 ms 7 195.250.170.70 8.265 ms 7.068 ms 7.612 ms 8 193.40.133.6 11.353 ms 10.974 ms 10.942 ms 9 193.40.12.10 10.868 ms 10.781 ms 10.772 ms10 193.40.12.1 14.155 ms 10.884 ms 10.542 ms11 193.40.36.82 11.422 ms !Z 12.633 ms !Z 11.446 ms !Z
34

TRACEROUTE
LECTURE 7: NETWORK MGT AND DEBUGGING
• Example of online traceroute
• http://www.ip2location.com/free/traceroute
35

NETWORK STATISTICS
6.
36

NETWORK STATISTICS
LECTURE 7: NETWORK MGT AND DEBUGGING
• The most common use of netstat:
✤ Inspecting interface configuration information
✤ Monitoring the status of network connections
✤ Identifying and listening to network services
✤ Examining the routing table
✤ Viewing operational statistics for various network protocols
INFO:
netstat collect rich information about the state of your networking activity, including interface statistics, routing information, and connection tables.
37

NETWORK STATISTICS
LECTURE 7: NETWORK MGT AND DEBUGGING
✤ Inspecting interface configuration information
COMMAND: $ netstat -i
OUTPUT: AHs-Mac-mini:~ AH$ netstat -iName Mtu Network Address Ipkts Ierrs Opkts Oerrs Colllo0 16384 <Link#1> 1061 0 1061 0 0lo0 16384 localhost ::1 1061 - 1061 - -lo0 16384 127 localhost 1061 - 1061 - -lo0 16384 localhost fe80:1::1 1061 - 1061 - -gif0* 1280 <Link#2> 0 0 0 0 0stf0* 1280 <Link#3> 0 0 0 0 0en0 1500 <Link#4> 3c:07:54:75:e5:5d 20227 1 6384 0 0en0 1500 ahs-mac-min fe80:4::3e07:54ff 20227 - 6384 - -en0 1500 192.168.88 192.168.88.242 20227 - 6384 - -en1 1500 <Link#5> 70:73:cb:c0:76:e3 0 0 0 0 0en2 1500 <Link#6> b2:00:1b:6c:d3:01 0 0 0 0 0fw0 4078 <Link#7> 3c:07:54:ff:fe:b6:cd:30 0 0 0 0 0p2p0* 2304 <Link#8> 02:73:cb:c0:76:e3 0 0 0 0 0bridg 1500 <Link#9> 3e:07:54:57:03:00 0 0 1 0 0
38

NETWORK STATISTICS
LECTURE 7: NETWORK MGT AND DEBUGGING
✤ Inspecting interface configuration informationOUTPUT: AHs-Mac-mini:~ AH$ netstat -i
Name Mtu Network Address Ipkts Ierrs Opkts Oerrs Colllo0 16384 <Link#1> 1061 0 1061 0 0
Name Description
Name Interface name.
Mtu Maximum transmission unit. The maximum size of packets in bytes that are transmitted using the interface.
Ipkts Total number of packets received.
Ierrs Total number of input errors. For example, malformed packets, checksum errors, or insufficient buffer space in the device driver.
Opkts Total number of packets transmitted.
Oerrs Total number of output errors. For example, a fault in the local host connection or adapter output queue overrun.
Coll Number of packet collisions detected.39

NETWORK STATISTICS
LECTURE 7: NETWORK MGT AND DEBUGGING
✤ Inspecting interface configuration information
• Tuning guide:
Situation How to react
if Ierrs > 0.01 x Ipkts Then run the netstat -m command to check for a lack of memory.
if Oerrs > 0.01 x OpktsThen increase the send queue size (xmt_que_size) for that interface. The size of the xmt_que_size could be checked with the following command:# lsattr -El adapter
if Coll / Opkts > 0.1Then there is a high network utilization, and a reorganization or partitioning may be necessary. Use the netstat -v or entstat command to determine the collision rate. 40

NETWORK STATISTICS
LECTURE 7: NETWORK MGT AND DEBUGGING
✤ Inspecting interface configuration information
• For the same purpose with more details you can use:COMMAND: $ ifconfig -a
OUTPUT:AHs-Mac-mini:~ AH$ ifconfig -alo0: flags=8049<UP,LOOPBACK,RUNNING,MULTICAST> mtu 16384
options=3<RXCSUM,TXCSUM>inet6 ::1 prefixlen 128 inet 127.0.0.1 netmask 0xff000000 inet6 fe80::1%lo0 prefixlen 64 scopeid 0x1 nd6 options=1<PERFORMNUD
en0: flags=8863<UP,BROADCAST,SMART,RUNNING,SIMPLEX,MULTICAST> mtu 1500options=10b<RXCSUM,TXCSUM,VLAN_HWTAGGING,AV>ether 3c:07:54:75:e5:5d inet6 fe80::3e07:54ff:fe75:e55d%en0 prefixlen 64 scopeid 0x4 inet 192.168.88.242 netmask 0xffffff00 broadcast 192.168.88.255nd6 options=1<PERFORMNUD>media: autoselect (100baseTX <full-duplex>)status: active
fw0: flags=8863<UP,BROADCAST,SMART,RUNNING,SIMPLEX,MULTICAST> mtu 4078lladdr 3c:07:54:ff:fe:b6:cd:30 nd6 options=1<PERFORMNUD>media: autoselect <full-duplex>status: inactive 41
NETWORK STATISTICS
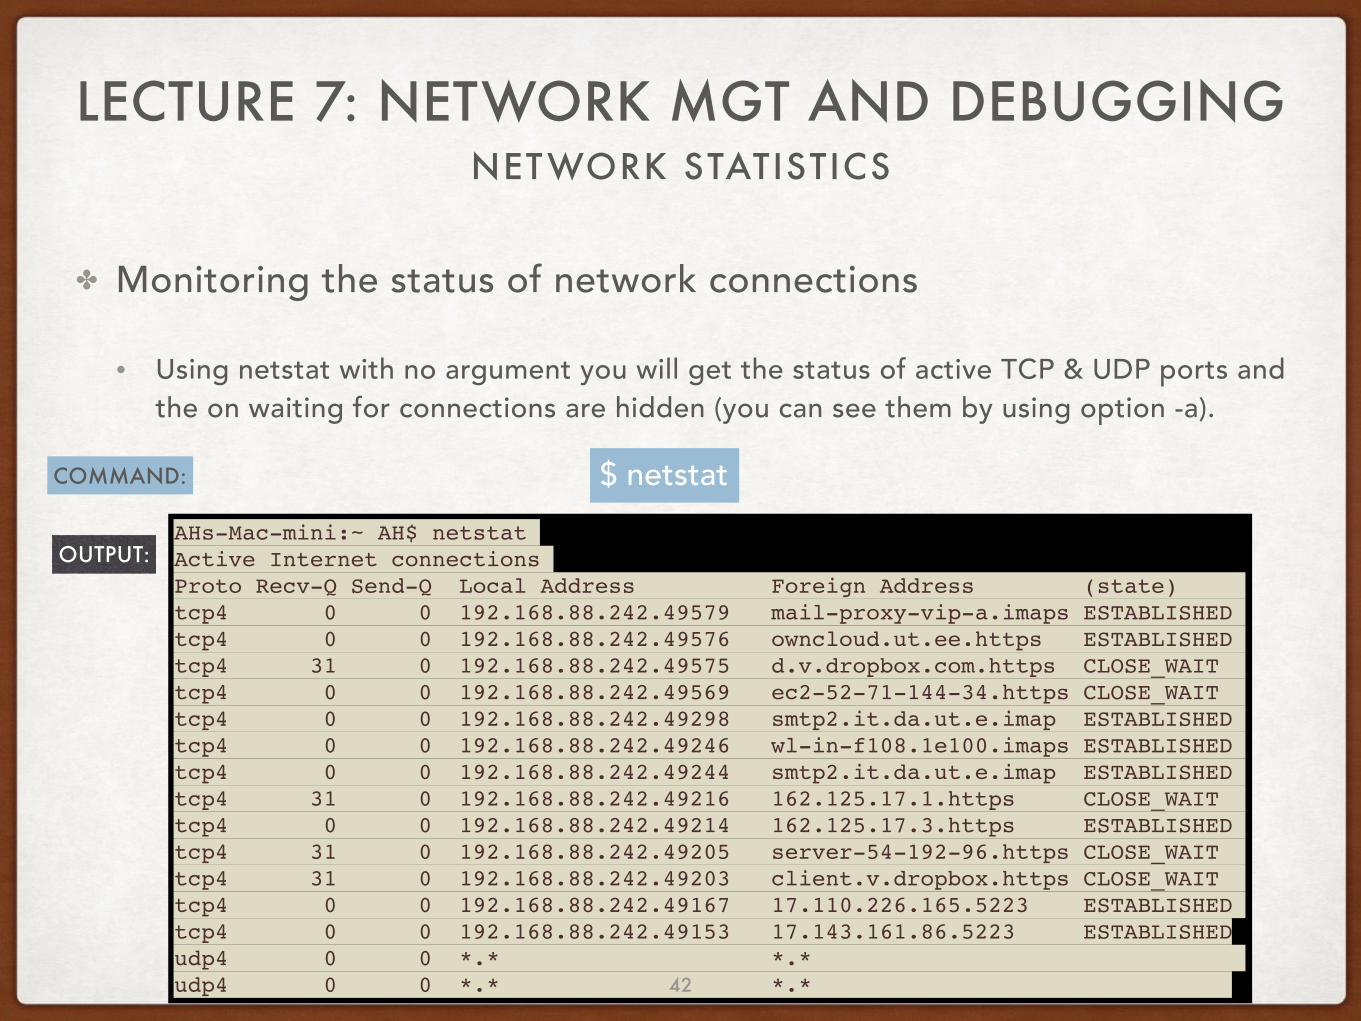
LECTURE 7: NETWORK MGT AND DEBUGGING
✤ Monitoring the status of network connections
• Using netstat with no argument you will get the status of active TCP & UDP ports and the on waiting for connections are hidden (you can see them by using option -a).
COMMAND: $ netstat
OUTPUT:AHs-Mac-mini:~ AH$ netstatActive Internet connectionsProto Recv-Q Send-Q Local Address Foreign Address (state) tcp4 0 0 192.168.88.242.49579 mail-proxy-vip-a.imaps ESTABLISHEDtcp4 0 0 192.168.88.242.49576 owncloud.ut.ee.https ESTABLISHEDtcp4 31 0 192.168.88.242.49575 d.v.dropbox.com.https CLOSE_WAIT tcp4 0 0 192.168.88.242.49569 ec2-52-71-144-34.https CLOSE_WAIT tcp4 0 0 192.168.88.242.49298 smtp2.it.da.ut.e.imap ESTABLISHEDtcp4 0 0 192.168.88.242.49246 wl-in-f108.1e100.imaps ESTABLISHEDtcp4 0 0 192.168.88.242.49244 smtp2.it.da.ut.e.imap ESTABLISHEDtcp4 31 0 192.168.88.242.49216 162.125.17.1.https CLOSE_WAIT tcp4 0 0 192.168.88.242.49214 162.125.17.3.https ESTABLISHEDtcp4 31 0 192.168.88.242.49205 server-54-192-96.https CLOSE_WAIT tcp4 31 0 192.168.88.242.49203 client.v.dropbox.https CLOSE_WAIT tcp4 0 0 192.168.88.242.49167 17.110.226.165.5223 ESTABLISHEDtcp4 0 0 192.168.88.242.49153 17.143.161.86.5223 ESTABLISHEDudp4 0 0 *.* *.* udp4 0 0 *.* *.* 42

NETWORK STATISTICS
LECTURE 7: NETWORK MGT AND DEBUGGING
✤ Monitoring the status of network connections
• Can help to:
• debugging high-level problems, it let you verify that server are set up correctly and facilitate the diagnostic of certain miscommunication.
$ netstat -a
EXAMPLE:
let’s suppose we have a connection that stays in the status “syn_sent” which is a process that tries to contact a non_existing or inaccessible network server.
At this stage if you have a lot case like this. it means that your host cannot handle the number of connections or the problem is due to an inadequate kernel running limitations or malicious flooding.
43

NETWORK STATISTICS
LECTURE 7: NETWORK MGT AND DEBUGGING
✤ Identifying and listening to network services
• What processes on this machine are listening on the network for incoming connections?
$ netstat -a
Allows to see all the active TCP & UDP
ports
On busy machine, some line can be lost because of the
noise of established
TCP connections
44

NETWORK STATISTICS
LECTURE 7: NETWORK MGT AND DEBUGGING
✤ Identifying and listening to network services
• What processes on this machine are listening on the network for incoming connections?
$ netstat -lp To see only the listening ports
To identify the specific process
associated with each listening
port
-l
-p
45

NETWORK STATISTICS
LECTURE 7: NETWORK MGT AND DEBUGGING
✤ Identifying and listening to network servicesCOMMAND: $ netstat -lp
OUTPUT:
user@yosemite:~$ sudo netstat -lp[sudo] password for user: Active Internet connections (only servers)Proto Recv-Q Send-Q Local Address Foreign Address State PID/Program nametcp 0 0 localhost:smtp *:* LISTEN 1094/exim4 tcp 0 0 *:microsoft-ds *:* LISTEN 1149/smbd tcp 0 0 *:netbios-ssn *:* LISTEN 1149/smbd tcp 0 0 localhost:5900 *:* LISTEN 10979/x11vnc tcp 0 0 localhost:5037 *:* LISTEN 3801/adb tcp 0 0 *:ssh *:* LISTEN 711/sshd tcp6 0 0 localhost:smtp [::]:* LISTEN 1094/exim4 tcp6 0 0 [::]:microsoft-ds [::]:* LISTEN 1149/smbd tcp6 0 0 [::]:netbios-ssn [::]:* LISTEN 1149/smbd tcp6 0 0 [::]:5900 [::]:* LISTEN 10979/x11vnc tcp6 0 0 [::]:http [::]:* LISTEN 3434/apache2 tcp6 0 0 [::]:ssh [::]:* LISTEN 711/sshd
46

NETWORK STATISTICS
LECTURE 7: NETWORK MGT AND DEBUGGING
✤ Examining the routing table
COMMAND: $ netstat -r
OUTPUT:AHs-Mac-mini:~ AH$ netstat -rRouting tables
Internet:Destination Gateway Flags Refs Use Netif Expiredefault router UGSc 67 0 en0127 localhost UCS 0 0 lo0localhost localhost UH 3 8483 lo0169.254 link#4 UCS 0 0 en0192.168.88 link#4 UCS 3 0 en0192.168.88.1/32 link#4 UCS 1 0 en0router 4c:5e:c:c6:75:7b UHLWIir 68 786 en0 1171192.168.88.242/32 link#4 UCS 1 0 en0192.168.88.242 3c:7:54:75:e5:5d UHLWI 0 6 lo0192.168.88.243 0:27:10:36:2c:d4 UHLWI 0 10 en0 619192.168.88.253 28:92:4a:ca:e3:d7 UHLWIi 1 211 en0 1118192.168.88.255 ff:ff:ff:ff:ff:ff UHLWbI 0 5 en0224.0.0 link#4 UmCS 1 0 en0Internet6:Destination Gateway Flags Netif Expirelocalhost localhost UHL lo0fe80::%lo0 localhost UcI lo047

NETWORK STATISTICS
LECTURE 7: NETWORK MGT AND DEBUGGING
✤ Examining the routing tableFlag Acronym Meaning
1 RTF_PROTO1 Protocol specific routing flag #1
2 RTF_PROTO2 Protocol specific routing flag #2
3 RTF_PROTO3 Protocol specific routing flag #3
B RTF_BLACKHOLE Just discard pkts (during updates)
b RTF_BROADCAST The route represents a broadcast address
C RTF_CLONING Generate new routes on use
c RTF_PRCLONING Protocol-specified generate new routes on use
D RTF_DYNAMIC Created dynamically (by redirect)
G RTF_GATEWAY Destination requires forwarding by intermediary
H RTF_HOST Host entry (net otherwise)
48

NETWORK STATISTICS
LECTURE 7: NETWORK MGT AND DEBUGGING
✤ Examining the routing tableFlag Acronym Meaning
L RTF_LLINFO Valid protocol to link address translation
M RTF_MODIFIED Modified dynamically (by redirect)
R RTF_REJECT Host or net unreachable
S RTF_STATIC Manually added
U RTF_UP Route usable
W RTF_WASCLONED Route was generated as a result of cloning
X RTF_XRESOLVE External daemon translates proto to link address
49

NETWORK STATISTICS
LECTURE 7: NETWORK MGT AND DEBUGGING
✤ Viewing operational statistics for various network protocols
COMMAND: $ netstat -s
OUTPUT:user@yosemite:~$ netstat -sIp: 120242889 total packets received 8 with invalid addresses 0 forwarded 0 incoming packets discarded 120204889 incoming packets delivered 120197618 requests sent outIcmp: 134 ICMP messages received 0 input ICMP message failed. ICMP input histogram: echo requests: 134 134 ICMP messages sent 0 ICMP messages failed ICMP output histogram: echo replies: 134IcmpMsg: InType8: 134 OutType0: 134
Tcp: 59996830 active connections openings 45 passive connection openings 59996747 failed connection attempts 3 connection resets received 1 connections established 120454436 segments received 120470904 segments send out 676 segments retransmited 0 bad segments received. 59996753 resets sentUdp: 5016 packets received 0 packets to unknown port received. 0 packet receive errors 7577 packets sent
50

INSPECTION OF LIVE INTERFACE ACTIVITY
7.
51

INSPECTION OF LIVE INTERFACE ACTIVITY
LECTURE 7: NETWORK MGT AND DEBUGGING
• One way to find issues and problem is:
• Check what happing right now in the network
How many packets were sent in the last five minutes on a given interface?
How many bytes?
Are collisions or other errors occurring?
Answering all this questions can be done by monitoring network activity in real time
52
INSPECTION OF LIVE INTERFACE ACTIVITY
LECTURE 7: NETWORK MGT AND DEBUGGING
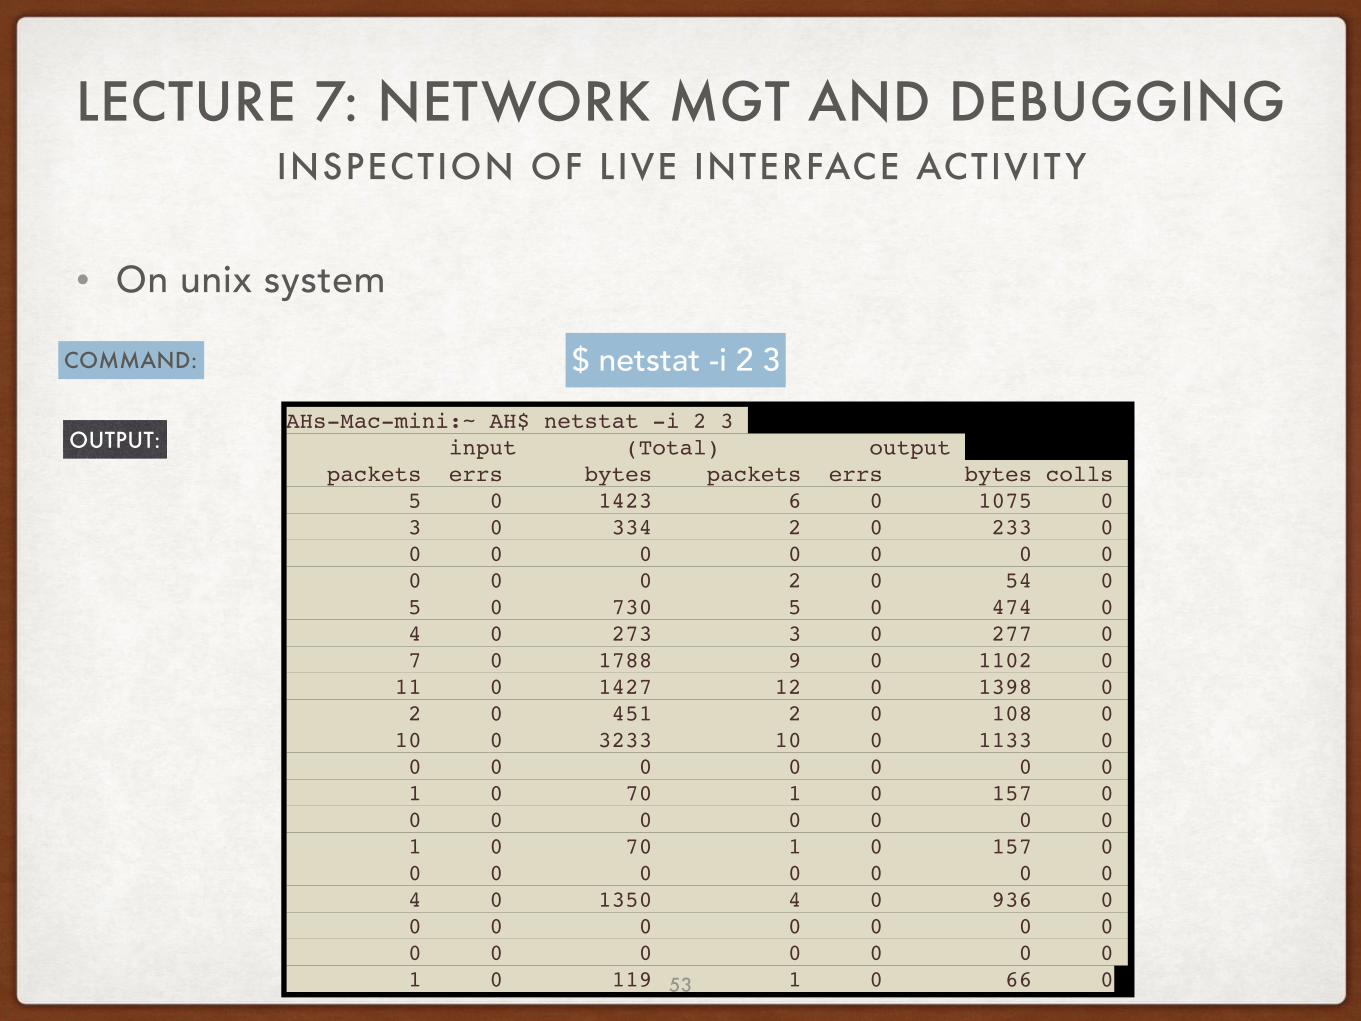
• On unix system
COMMAND: $ netstat -i 2 3
OUTPUT:AHs-Mac-mini:~ AH$ netstat -i 2 3 input (Total) output packets errs bytes packets errs bytes colls 5 0 1423 6 0 1075 0 3 0 334 2 0 233 0 0 0 0 0 0 0 0 0 0 0 2 0 54 0 5 0 730 5 0 474 0 4 0 273 3 0 277 0 7 0 1788 9 0 1102 0 11 0 1427 12 0 1398 0 2 0 451 2 0 108 0 10 0 3233 10 0 1133 0 0 0 0 0 0 0 0 1 0 70 1 0 157 0 0 0 0 0 0 0 0 1 0 70 1 0 157 0 0 0 0 0 0 0 0 4 0 1350 4 0 936 0 0 0 0 0 0 0 0 0 0 0 0 0 0 0 1 0 119 1 0 66 053

INSPECTION OF LIVE INTERFACE ACTIVITY
LECTURE 7: NETWORK MGT AND DEBUGGING
• On unix system
COMMAND: $ ifconfig
OUTPUT:user@yosemite:~$ sudo ifconfigeth0 Link encap:Ethernet HWaddr 28:92:4a:ca:e3:d7 inet addr:192.168.88.253 Bcast:192.168.88.255 Mask:255.255.255.0 inet6 addr: fe80::2a92:4aff:feca:e3d7/64 Scope:Link UP BROADCAST RUNNING MULTICAST MTU:1500 Metric:1 RX packets:352796 errors:0 dropped:0 overruns:0 frame:0 TX packets:245518 errors:0 dropped:0 overruns:0 carrier:0 collisions:0 txqueuelen:1000 RX bytes:272711845 (260.0 MiB) TX bytes:108786716 (103.7 MiB) Interrupt:20 Memory:f7c00000-f7c20000
54

PACKET SNIFFERS
8.
55

PACKET SNIFFERS
LECTURE 7: NETWORK MGT AND DEBUGGING
• In order to sniff the packet we will use tcpdump.INFO:
tcpdump is a network analysis tool for information security professionals. it is a common packet analyser that runs under the command line. it allows the user to display transmission or reception of TCP/IP and other packets information.
COMMAND: $ tcpdump
OUTPUT:
AHs-Mac-mini:~ AH$ sudo tcpdumpPassword:tcpdump: data link type PKTAPtcpdump: verbose output suppressed, use -v or -vv for full protocol decodelistening on pktap, link-type PKTAP (Packet Tap), capture size 262144 bytes12:39:02.460882 IP 192.168.88.242.49640 > 64.4.23.153.40031: Flags [P.], seq 623251251:623251253, ack 1910760679, win 4096, options [nop,nop,TS val 513482270 ecr 736405035], length 212:39:02.610762 IP 192.168.88.242.64172 > router.domain: 15405+ PTR? 153.23.4.64.in-addr.arpa. (42)12:39:02.649374 IP 64.4.23.153.40031 > 192.168.88.242.49640: Flags [.], ack 2, win 83, options [nop,nop,TS val 736407115 ecr 513482270], length 012:39:02.650495 IP router.domain > 192.168.88.242.64172: 15405 NXDomain 0/0/0 (42)12:39:03.089931 IP 192.168.88.242.50442 > 199.16.156.21.https: Flags [P.], seq56

PACKET SNIFFERS
LECTURE 7: NETWORK MGT AND DEBUGGING
• Tcpdump optionsOption Description
-i any Listen on all interfaces just to see if you’re seeing any traffic.
-i eth0 Listen on the eth0 interface
-D Show the list of available interfaces
-n Don’t resolve hostnames or port names.
-nn Be less verbose (more quiet) with your output.
-q Show the packet’s contents in both hex and ASCII.
-X Same as -X, but also shows the ethernet header.
-v, -vv, -vvv
Increase the amount of packet information you get back.57

PACKET SNIFFERS
LECTURE 7: NETWORK MGT AND DEBUGGING
• Tcpdump optionsOption Description
-c Only get x number of packets and then stop.
-icmp Only get ICMP packets.
-s Define the snaplength (size) of the capture in bytes.
-S Print absolute sequence numbers.
-e Get the ethernet header as well.
-q Show less protocol information.
-E Decrypt IPSEC traffic by providing an encryption key.
-S0 to get everything, unless you are intentionally capturing less.58
PACKET SNIFFERS
LECTURE 7: NETWORK MGT AND DEBUGGING
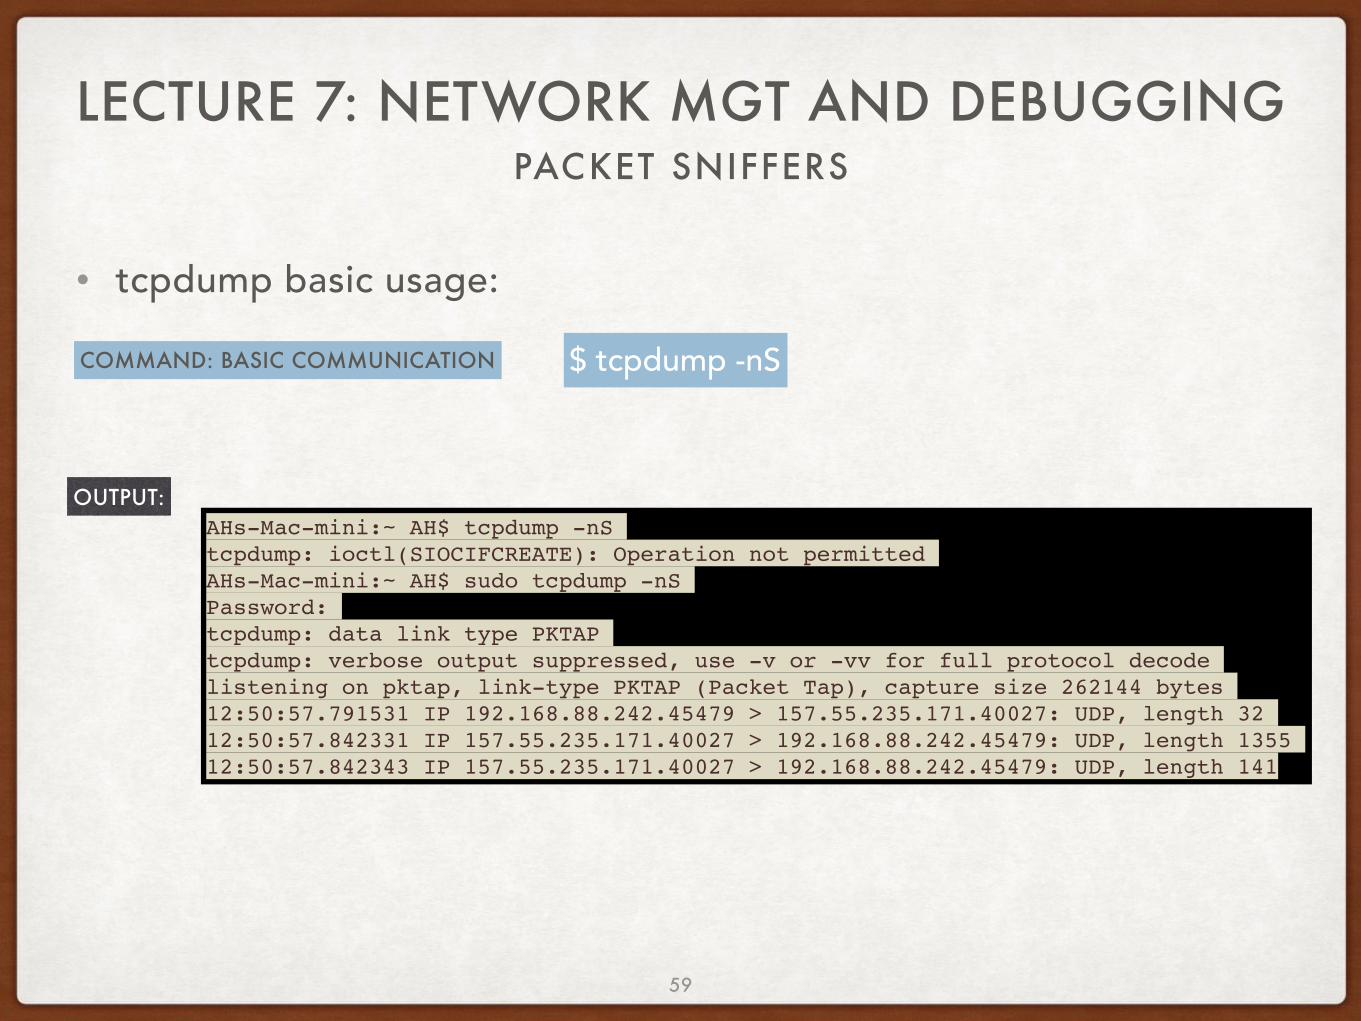
• tcpdump basic usage:
COMMAND: BASIC COMMUNICATION $ tcpdump -nS
OUTPUT:AHs-Mac-mini:~ AH$ tcpdump -nStcpdump: ioctl(SIOCIFCREATE): Operation not permittedAHs-Mac-mini:~ AH$ sudo tcpdump -nSPassword:tcpdump: data link type PKTAPtcpdump: verbose output suppressed, use -v or -vv for full protocol decodelistening on pktap, link-type PKTAP (Packet Tap), capture size 262144 bytes12:50:57.791531 IP 192.168.88.242.45479 > 157.55.235.171.40027: UDP, length 3212:50:57.842331 IP 157.55.235.171.40027 > 192.168.88.242.45479: UDP, length 135512:50:57.842343 IP 157.55.235.171.40027 > 192.168.88.242.45479: UDP, length 141
59
PACKET SNIFFERS
LECTURE 7: NETWORK MGT AND DEBUGGING
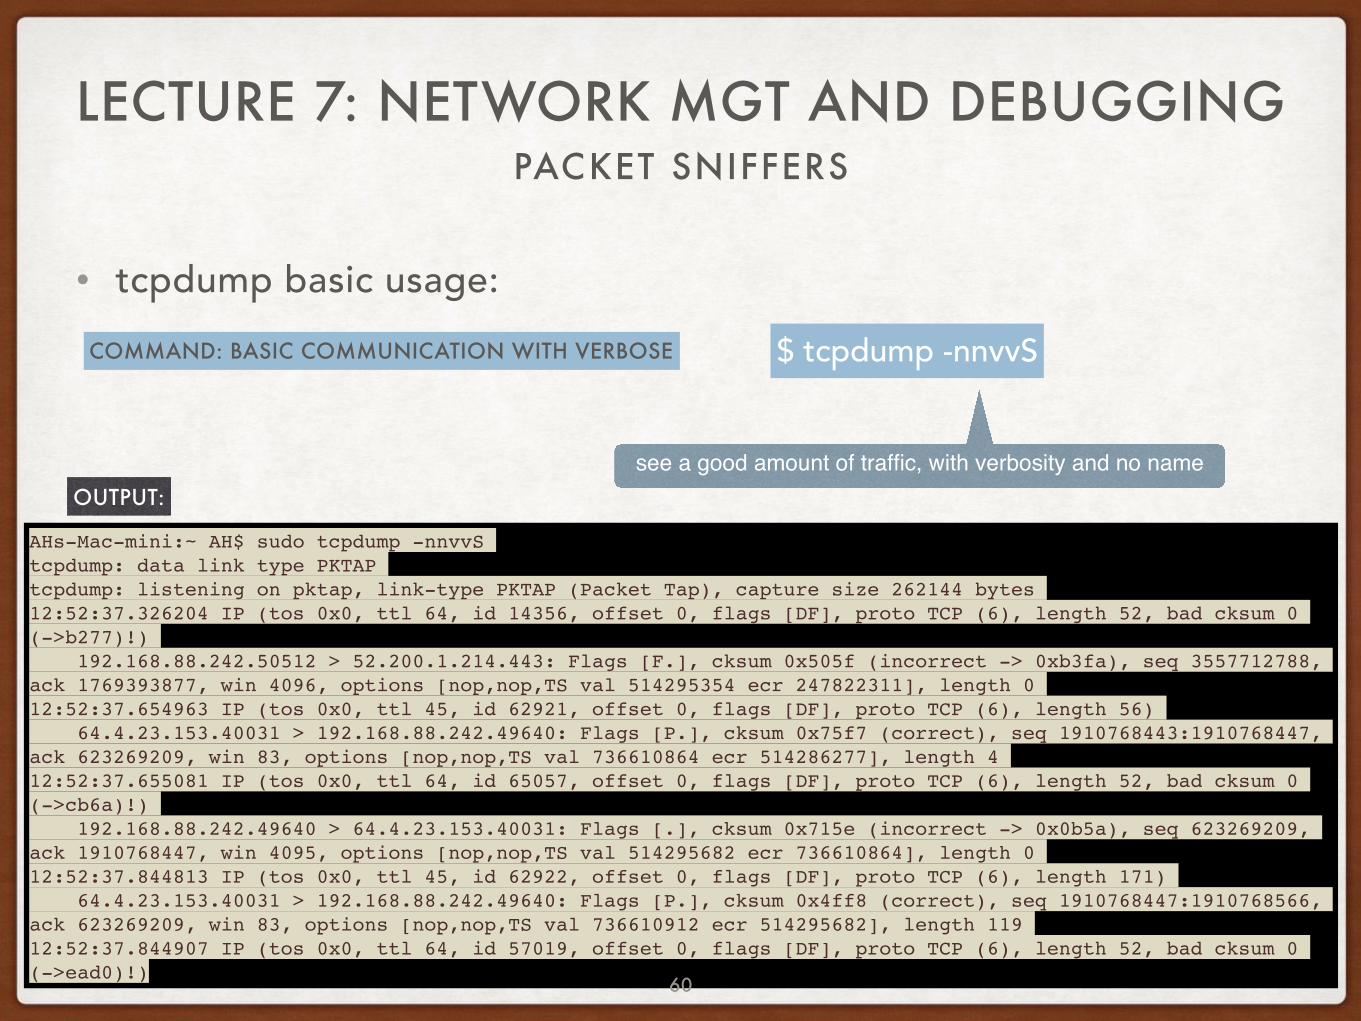
• tcpdump basic usage:COMMAND: BASIC COMMUNICATION WITH VERBOSE $ tcpdump -nnvvS
OUTPUT:
AHs-Mac-mini:~ AH$ sudo tcpdump -nnvvStcpdump: data link type PKTAPtcpdump: listening on pktap, link-type PKTAP (Packet Tap), capture size 262144 bytes12:52:37.326204 IP (tos 0x0, ttl 64, id 14356, offset 0, flags [DF], proto TCP (6), length 52, bad cksum 0 (->b277)!) 192.168.88.242.50512 > 52.200.1.214.443: Flags [F.], cksum 0x505f (incorrect -> 0xb3fa), seq 3557712788, ack 1769393877, win 4096, options [nop,nop,TS val 514295354 ecr 247822311], length 012:52:37.654963 IP (tos 0x0, ttl 45, id 62921, offset 0, flags [DF], proto TCP (6), length 56) 64.4.23.153.40031 > 192.168.88.242.49640: Flags [P.], cksum 0x75f7 (correct), seq 1910768443:1910768447, ack 623269209, win 83, options [nop,nop,TS val 736610864 ecr 514286277], length 412:52:37.655081 IP (tos 0x0, ttl 64, id 65057, offset 0, flags [DF], proto TCP (6), length 52, bad cksum 0 (->cb6a)!) 192.168.88.242.49640 > 64.4.23.153.40031: Flags [.], cksum 0x715e (incorrect -> 0x0b5a), seq 623269209, ack 1910768447, win 4095, options [nop,nop,TS val 514295682 ecr 736610864], length 012:52:37.844813 IP (tos 0x0, ttl 45, id 62922, offset 0, flags [DF], proto TCP (6), length 171) 64.4.23.153.40031 > 192.168.88.242.49640: Flags [P.], cksum 0x4ff8 (correct), seq 1910768447:1910768566, ack 623269209, win 83, options [nop,nop,TS val 736610912 ecr 514295682], length 11912:52:37.844907 IP (tos 0x0, ttl 64, id 57019, offset 0, flags [DF], proto TCP (6), length 52, bad cksum 0 (->ead0)!)
see a good amount of traffic, with verbosity and no name
60

PACKET SNIFFERS
LECTURE 7: NETWORK MGT AND DEBUGGING
• tcpdump basic usage:COMMAND: DEEPER LOOK AT THE TRAFFIC $ tcpdump -nnvvXS
OUTPUT:
AHs-Mac-mini:~ AH$ sudo tcpdump -nnvvXStcpdump: data link type PKTAPtcpdump: listening on pktap, link-type PKTAP (Packet Tap), capture size 262144 bytes12:54:02.786735 IP (tos 0x0, ttl 64, id 38862, offset 0, flags [DF], proto TCP (6), length 606, bad cksum 0 (->180a)!) 192.168.88.242.49641 > 64.4.47.35.443: Flags [P.], cksum 0x8b12 (incorrect -> 0x3af5), seq 4212525989:4212526543, ack 2260119008, win 65535, options [nop,nop,TS val 514380638 ecr 1922013469], length 554
0x0000: 4c5e 0cc6 757b 3c07 5475 e55d 0800 4500 L^..u{<.Tu.]..E.0x0010: 025e 97ce 4000 4006 0000 c0a8 58f2 4004 .^..@[email protected][email protected]: 2f23 c1e9 01bb fb16 0ba5 86b6 ade0 8018 /#..............0x0030: ffff 8b12 0000 0101 080a 1ea8 d35e 728f .............^r.0x0040: 991d 1703 0100 202e 2c41 961a d088 cb27 ........,A.....'0x0050: ab90 1288 ca1f 2576 4492 0744 d715 8596 ......%vD..D....0x0060: 0e3b 4d2b 4ba3 9917 0301 0200 0fe7 84d7 .;M+K...........0x0070: f575 96c2 c74f 6a6b 8d3c cd1b 8bdc 6392 .u...Ojk.<....c.0x0080: 095b f933 582e 92c0 4bb8 cd44 1989 6afb .[.3X...K..D..j.0x0090: 6c31 c9a1 a099 f1a5 640d 266e 2092 8a58 l1......d.&n...X0x00a0: 7235 e3bf 96d7 0f4b 3fa0 6b10 9b61 6e7e r5.....K?.k..an~0x00b0: c85b 52c5 69ec 6653 5554 a4ce 8c49 2679 .[R.i.fSUT...I&y0x00c0: cb25 eac4 25df 1329 0d8c 75f1 04be fce3 .%..%..)..u.....0x00d0: 94f1 9755 156d 5a73 bb0a 1ae8 938b 4a44 ...U.mZs......JD
adds -X for payload but doesn’t grab any more of the
61
PACKET SNIFFERS
LECTURE 7: NETWORK MGT AND DEBUGGING
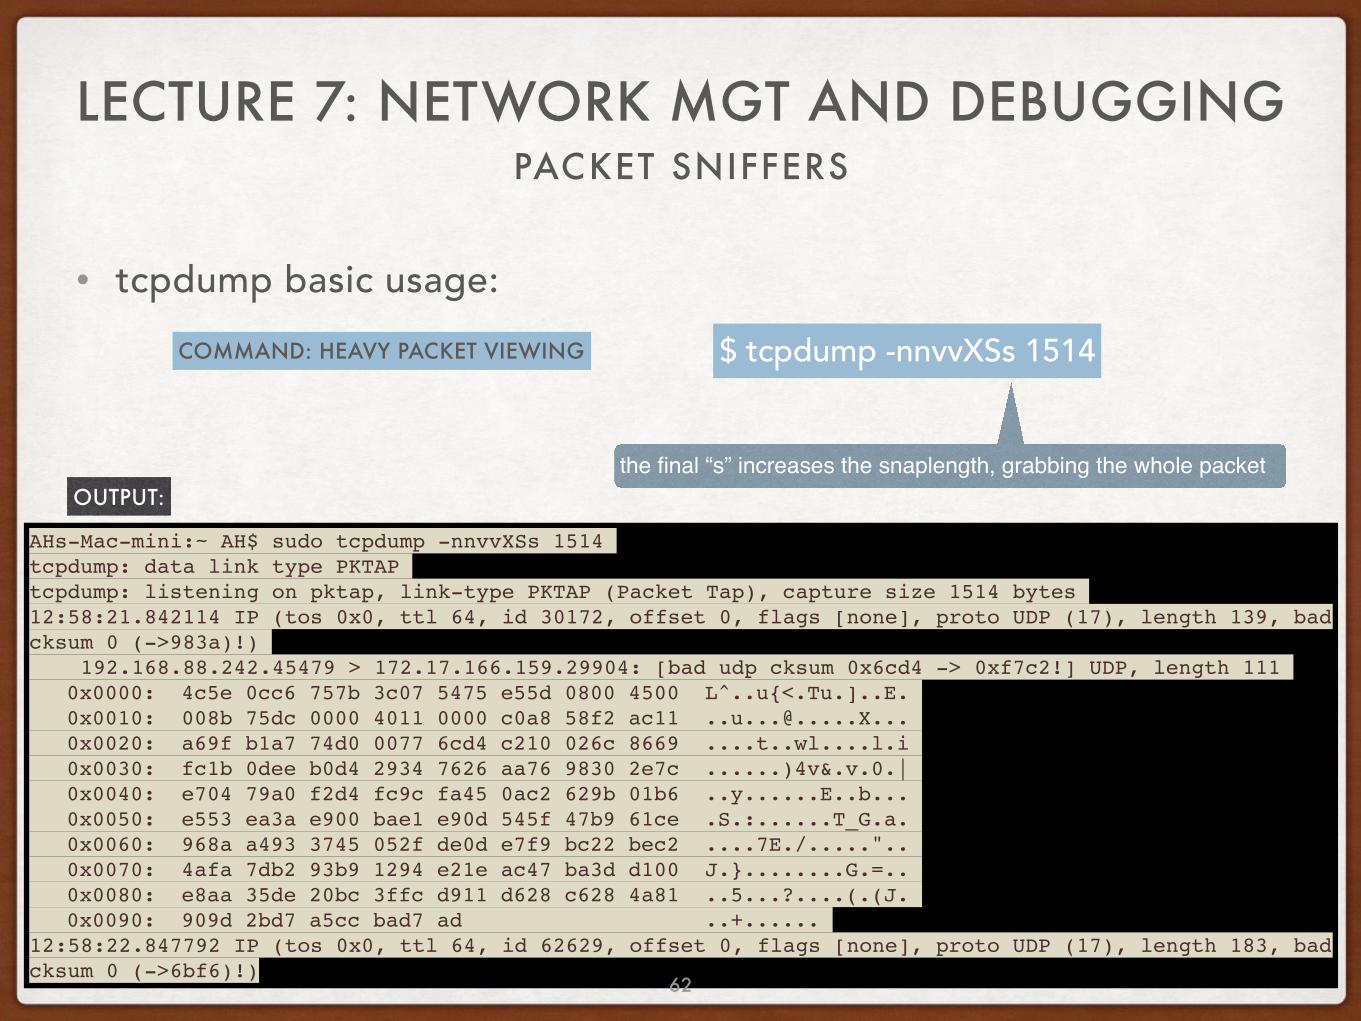
• tcpdump basic usage:COMMAND: HEAVY PACKET VIEWING $ tcpdump -nnvvXSs 1514
OUTPUT:
AHs-Mac-mini:~ AH$ sudo tcpdump -nnvvXSs 1514tcpdump: data link type PKTAPtcpdump: listening on pktap, link-type PKTAP (Packet Tap), capture size 1514 bytes12:58:21.842114 IP (tos 0x0, ttl 64, id 30172, offset 0, flags [none], proto UDP (17), length 139, bad cksum 0 (->983a)!) 192.168.88.242.45479 > 172.17.166.159.29904: [bad udp cksum 0x6cd4 -> 0xf7c2!] UDP, length 111
0x0000: 4c5e 0cc6 757b 3c07 5475 e55d 0800 4500 L^..u{<.Tu.]..E.0x0010: 008b 75dc 0000 4011 0000 c0a8 58f2 ac11 [email protected]: a69f b1a7 74d0 0077 6cd4 c210 026c 8669 ....t..wl....l.i0x0030: fc1b 0dee b0d4 2934 7626 aa76 9830 2e7c ......)4v&.v.0.|0x0040: e704 79a0 f2d4 fc9c fa45 0ac2 629b 01b6 ..y......E..b...0x0050: e553 ea3a e900 bae1 e90d 545f 47b9 61ce .S.:......T_G.a.0x0060: 968a a493 3745 052f de0d e7f9 bc22 bec2 ....7E./....."..0x0070: 4afa 7db2 93b9 1294 e21e ac47 ba3d d100 J.}........G.=..0x0080: e8aa 35de 20bc 3ffc d911 d628 c628 4a81 ..5...?....(.(J.0x0090: 909d 2bd7 a5cc bad7 ad ..+......
12:58:22.847792 IP (tos 0x0, ttl 64, id 62629, offset 0, flags [none], proto UDP (17), length 183, bad cksum 0 (->6bf6)!)
the final “s” increases the snaplength, grabbing the whole packet
62

PACKET SNIFFERS
LECTURE 7: NETWORK MGT AND DEBUGGING
• tcpdump basic usage:COMMAND: ICMP PACKET $ tcpdump -nnvvXSs 0 -c2 icmp
OUTPUT:
AHs-Mac-mini:~ AH$ sudo tcpdump -nnvXSs 0 -c2 icmptcpdump: data link type PKTAPtcpdump: listening on pktap, link-type PKTAP (Packet Tap), capture size 262144 bytes13:03:17.420085 IP (tos 0x0, ttl 64, id 27691, offset 0, flags [none], proto ICMP (1), length 56, bad cksum 0 (->dc55)!) 192.168.88.242 > 192.168.88.1: ICMP 192.168.88.242 udp port 64500 unreachable, length 36
IP (tos 0x0, ttl 64, id 23495, offset 0, flags [none], proto UDP (17), length 393) 192.168.88.1.53 > 192.168.88.242.64500: [|domain]
0x0000: 4c5e 0cc6 757b 3c07 5475 e55d 0800 4500 L^..u{<.Tu.]..E.0x0010: 0038 6c2b 0000 4001 0000 c0a8 58f2 c0a8 [email protected]: 5801 0303 ff5d 0000 0000 4500 0189 5bc7 X....]....E...[.0x0030: 0000 4011 eb58 c0a8 5801 c0a8 58f2 0035 [email protected]: fbf4 0175 0000 ...u..
capturing two icmp packets
63

PACKET SNIFFERS
LECTURE 7: NETWORK MGT AND DEBUGGING
• Another tool for packet sniffing is wireshark:
• for more details check the link:
• https://www.wireshark.org/download/docs/user-guide-a4.pdf
64
NETWORK MANAGEMENT PROTOCOLS
9.
65

NETWORK MANAGEMENT PROTOCOLS
LECTURE 7: NETWORK MGT AND DEBUGGING
• What is network management?
• Network management protocols standardise a way of probing a device to discover its configuration, health, and network connections.
• The most common protocol used with TCP/IP is Simple Network Management Protocol (SNMP)
Structure of Management Information: SMI Management Information Base: MIB SNMP Protocol Operations and Transport Mappings Security and Administration
66
NETWORK MANAGEMENT PROTOCOLS
LECTURE 7: NETWORK MGT AND DEBUGGING
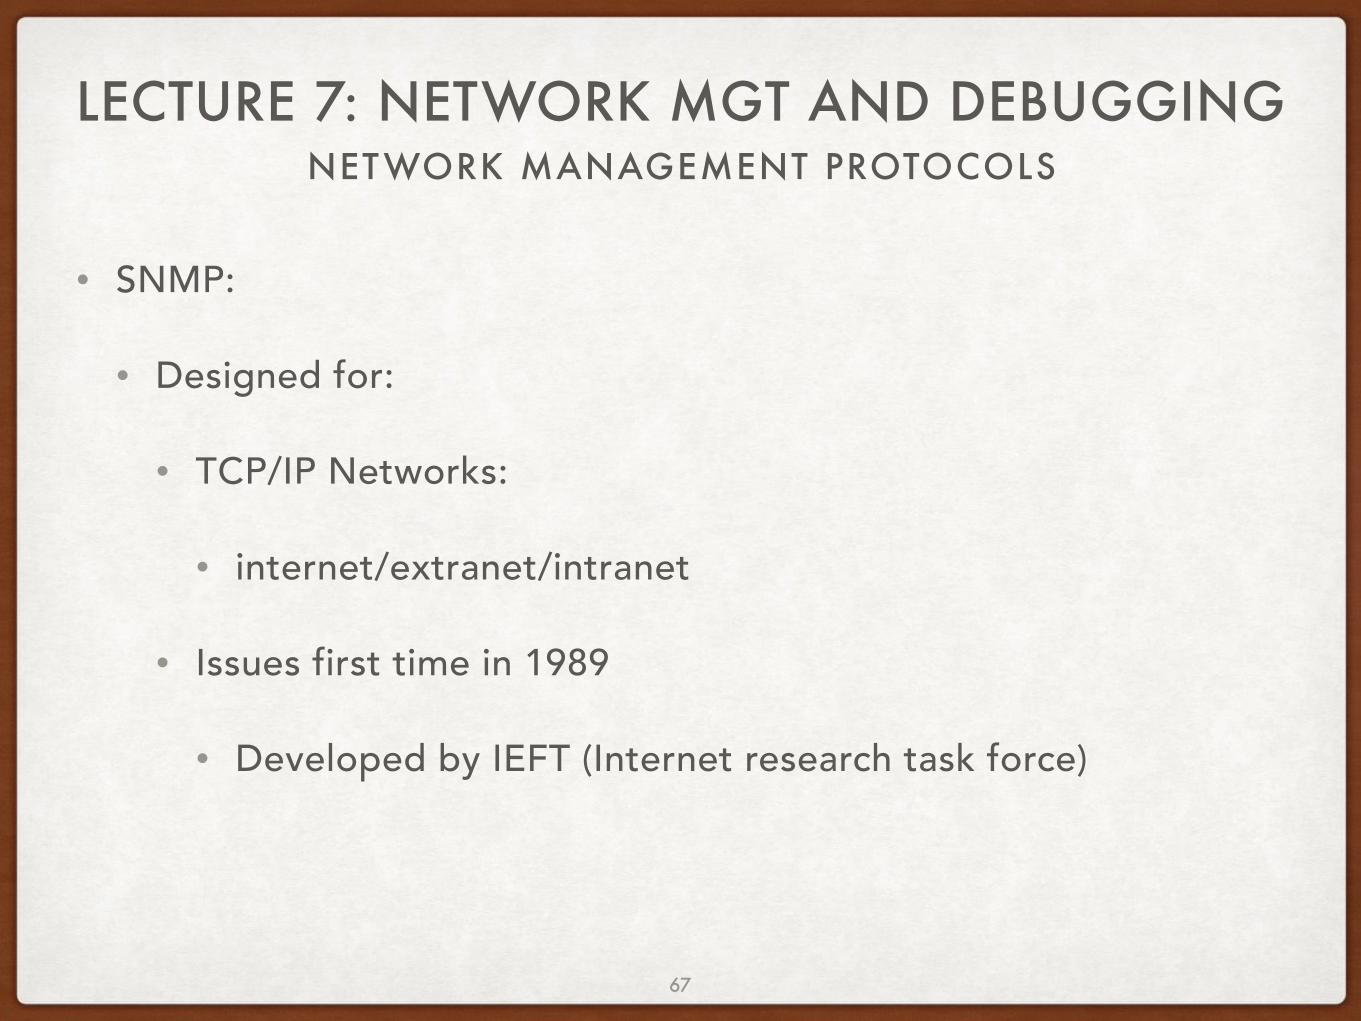
• SNMP:
• Designed for:
• TCP/IP Networks:
• internet/extranet/intranet
• Issues first time in 1989
• Developed by IEFT (Internet research task force)
67

NETWORK MANAGEMENT PROTOCOLS
LECTURE 7: NETWORK MGT AND DEBUGGING
• SNMP components:
• SNMP Manager
• SNMP Agent
• Management Information Base- MIB
68

NETWORK MANAGEMENT PROTOCOLS
LECTURE 7: NETWORK MGT AND DEBUGGING
• SNMP Components
SNMP MANAGEMENT
STATION
HOSTPRINTER
ROUTER
BRIDGE
LAN
Managed Node
Managed Node
Managed Node
Managed Node
AGENT
AGENT
AGENT
AGENT
ManagementProcess
69

NETWORK MANAGEMENT PROTOCOLS
LECTURE 7: NETWORK MGT AND DEBUGGING
• SNMP Principle:
• An Agent for Every Managed Node
✴ to run SNMP management process
• Variables (Objects)
✴ to describe the state of each device
• Information (Format) Specification
✴ ANS-1: Standard Object Definition Language
✴ SMI: Defines (SNMP) Data Structures
✴ MIB: Data Structure for (Variables) Objects (Uses SMI)
✴ BER: Basic Encoding Rule (transfer syntax)
70
NETWORK MANAGEMENT PROTOCOLS
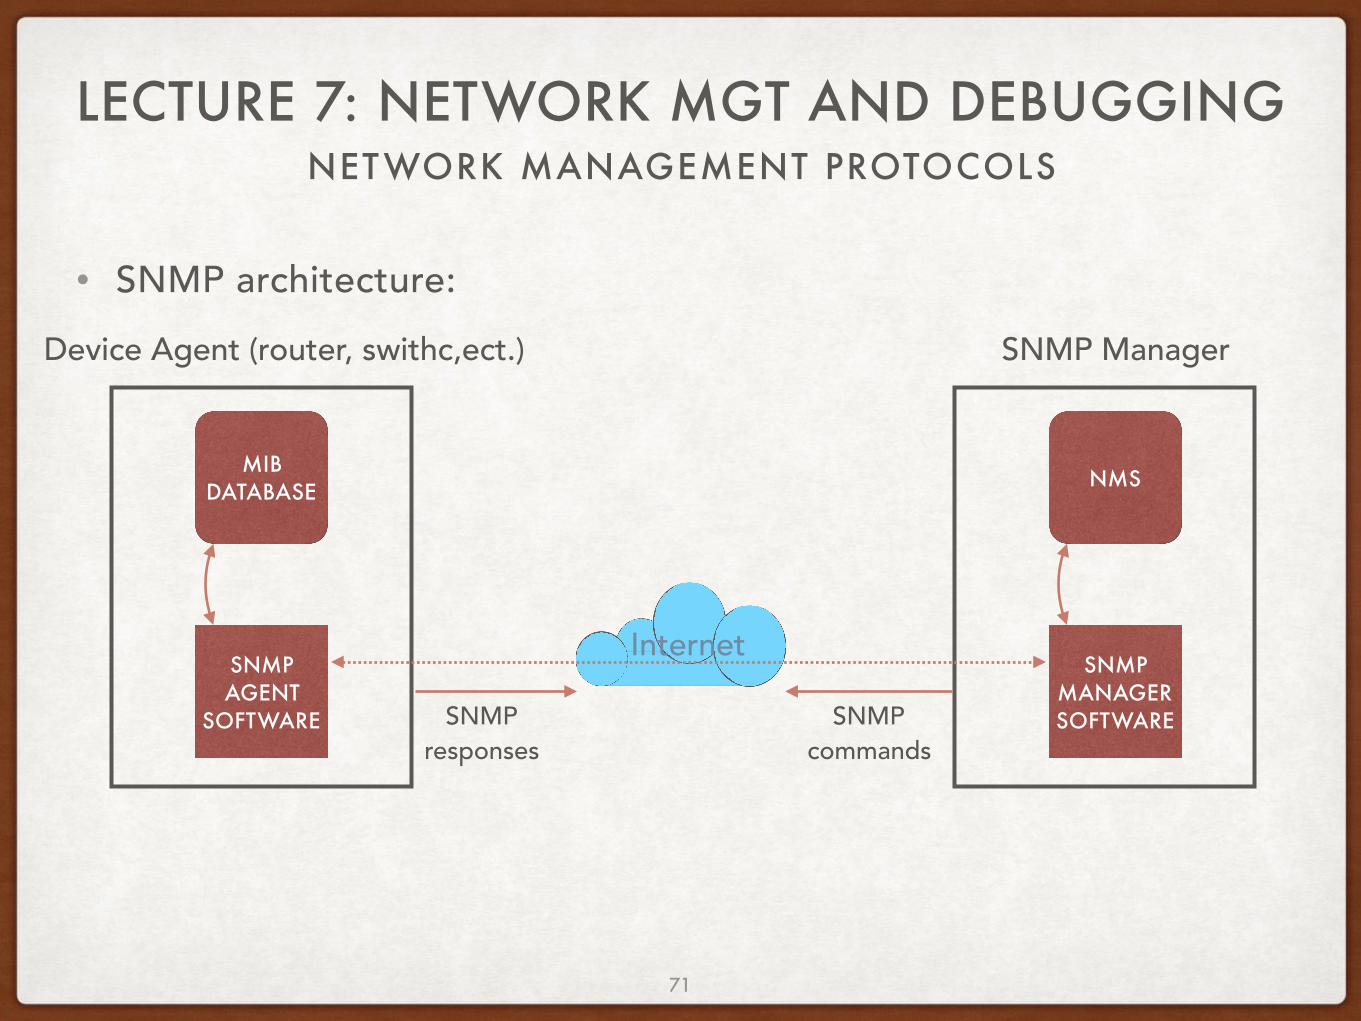
LECTURE 7: NETWORK MGT AND DEBUGGING
• SNMP architecture:
MIB DATABASE
SNMP AGENT
SOFTWARE
NMS
SNMP MANAGER SOFTWARESNMP
commandsSNMP
responses
Device Agent (router, swithc,ect.) SNMP Manager
Internet
71

NETWORK MANAGEMENT PROTOCOLS
LECTURE 7: NETWORK MGT AND DEBUGGING
• For more Example and command options
• https://docs.oracle.com/cd/E19201-01/820-6413-13/SNMP_commands_reference_appendix.html
72

NETWORK MAPPER
10.
73

NETWORK MAPPER
LECTURE 7: NETWORK MGT AND DEBUGGING
• Example of Network mapper:
• nmap
• command usage:
INFO:
nmap is used to explore the networks activity, perform security check, network audit, and discovering open ports on remote machine.
COMMAND: $ nmap <scan type (s)> <options> <target specification>
74

NETWORK MAPPER
LECTURE 7: NETWORK MGT AND DEBUGGING
• nmap commands:COMMAND: SCAN USING HOSTNAME $ nmap ds.cs.ut.ee
OUTPUT:
user@yosemite:~$ nmap ds.cs.ut.ee
Starting Nmap 6.47 ( http://nmap.org ) at 2016-03-29 15:05 EESTNmap scan report for ds.cs.ut.ee (193.40.36.82)Host is up (0.016s latency).rDNS record for 193.40.36.82: dionysos.at.mt.ut.eeNot shown: 993 filtered portsPORT STATE SERVICE22/tcp open ssh80/tcp open http443/tcp open https631/tcp closed ipp3690/tcp open svn8443/tcp closed https-alt9418/tcp open git
Nmap done: 1 IP address (1 host up) scanned in 10.60 seconds75

NETWORK MAPPER
LECTURE 7: NETWORK MGT AND DEBUGGING
• nmap commands:COMMAND: SCAN USING IP $ nmap 172.17.125.92
OUTPUT:
AHs-Mac-mini:~ AH$ sudo tcpdump -nnvXSs 0 -c2 icmpuser@yosemite:~$ nmap 172.17.125.92
Starting Nmap 6.47 ( http://nmap.org ) at 2016-03-29 15:07 EESTNmap scan report for 172.17.125.92Host is up (0.0075s latency).Not shown: 992 closed portsPORT STATE SERVICE21/tcp open ftp22/tcp open ssh23/tcp open telnet53/tcp open domain80/tcp open http2000/tcp open cisco-sccp4242/tcp filtered vrml-multi-use8291/tcp open unknown
Nmap done: 1 IP address (1 host up) scanned in 1.29 seconds76

NETWORK MAPPER
LECTURE 7: NETWORK MGT AND DEBUGGING
• nmap commands:COMMAND: SCAN USING -V FOR MORE DETAILED INFO $ nmap -v ds.cs.ut.ee
OUTPUT:user@yosemite:~$ nmap -v ds.cs.ut.ee
Starting Nmap 6.47 ( http://nmap.org ) at 2016-03-29 15:08 EESTInitiating Ping Scan at 15:08Scanning ds.cs.ut.ee (193.40.36.82) [2 ports]Completed Ping Scan at 15:08, 0.00s elapsed (1 total hosts)Initiating Parallel DNS resolution of 1 host. at 15:08Completed Parallel DNS resolution of 1 host. at 15:08, 0.00s elapsedInitiating Connect Scan at 15:08Scanning ds.cs.ut.ee (193.40.36.82) [1000 ports]Discovered open port 443/tcp on 193.40.36.82Discovered open port 22/tcp on 193.40.36.82Discovered open port 80/tcp on 193.40.36.82Discovered open port 3690/tcp on 193.40.36.82Discovered open port 9418/tcp on 193.40.36.82Connect Scan Timing: About 45.80% done; ETC: 15:09 (0:00:37 remaining)Completed Connect Scan at 15:09, 61.85s elapsed (1000 total ports)Nmap scan report for ds.cs.ut.ee (193.40.36.82)Host is up (0.69s latency).rDNS record for 193.40.36.82: dionysos.at.mt.ut.eeNot shown: 993 filtered portsPORT STATE SERVICE22/tcp open ssh80/tcp open http443/tcp open https631/tcp closed ipp3690/tcp open svn8443/tcp closed https-alt9418/tcp open git
Read data files from: /usr/bin/../share/nmapNmap done: 1 IP address (1 host up) scanned in 61.90 seconds 77

NETWORK MAPPER
LECTURE 7: NETWORK MGT AND DEBUGGING
• nmap commands:COMMAND: MULTIPLE HOSTS $ nmap ut.ee 172.17.125.92 ds.cs.ut.ee
OUTPUT:
user@yosemite:~$ nmap ut.ee 172.17.125.92 ds.cs.ut.ee
Starting Nmap 6.47 ( http://nmap.org ) at 2016-03-29 15:10 EESTNmap scan report for ut.ee (193.40.5.73)Host is up (0.0035s latency).rDNS record for 193.40.5.73: www.ut.eeNot shown: 985 filtered portsPORT STATE SERVICE22/tcp open ssh80/tcp open http443/tcp open https5666/tcp open nrpe6000/tcp closed X11
Nmap scan report for 172.17.125.92Host is up (0.0041s latency).Not shown: 992 closed portsPORT STATE SERVICE21/tcp open ftp22/tcp open ssh23/tcp open telnet53/tcp open domain
Nmap scan report for ds.cs.ut.ee (193.40.36.82)Host is up (0.0016s latency).rDNS record for 193.40.36.82: dionysos.at.mt.ut.eeNot shown: 993 filtered portsPORT STATE SERVICE22/tcp open ssh
78

NETWORK MAPPER
LECTURE 7: NETWORK MGT AND DEBUGGING
• nmap commands:COMMAND: SCAN WHOLE SUBNET $ nmap 172.17.125.*
OUTPUT:
user@yosemite:~$ nmap 172.17.125.*
Starting Nmap 6.47 ( http://nmap.org ) at 2016-03-29 15:12 EESTNmap scan report for 172.17.125.50Host is up (0.0017s latency).Not shown: 999 closed portsPORT STATE SERVICE4242/tcp filtered vrml-multi-use
Nmap scan report for 172.17.125.55Host is up (0.00094s latency).Not shown: 999 closed portsPORT STATE SERVICE4242/tcp filtered vrml-multi-use
Nmap scan report for 172.17.125.56Host is up (0.0010s latency).Not shown: 999 closed portsPORT STATE SERVICE4242/tcp filtered vrml-multi-use
Nmap scan report for 172.17.125.57Host is up (0.0010s latency).Not shown: 999 closed portsPORT STATE SERVICE4242/tcp filtered vrml-multi-use
79

NETWORK MAPPER
LECTURE 7: NETWORK MGT AND DEBUGGING
• nmap commands:COMMAND: SCAN OS INFORMATION AND TRACROUTE $ nmap -A ds.cs.ut.ee
OUTPUT:
user@yosemite:~$ nmap -A ds.cs.ut.ee
Starting Nmap 6.47 ( http://nmap.org ) at 2016-03-29 15:15 EESTNmap scan report for ds.cs.ut.ee (193.40.36.82)Host is up (0.016s latency).rDNS record for 193.40.36.82: dionysos.at.mt.ut.eeNot shown: 993 filtered portsPORT STATE SERVICE VERSION22/tcp open ssh OpenSSH 4.3 (protocol 2.0)| ssh-hostkey: | 1024 ba:4b:f0:d7:9a:13:83:70:04:a6:f8:50:54:22:28:dd (DSA)|_ 2048 67:cd:fe:74:aa:65:c8:90:a1:29:55:64:98:a5:88:36 (RSA)80/tcp open http Apache httpd 2.2.3 ((CentOS))|_http-favicon: Plone CMS|_http-generator: Plone - http://plone.org| http-methods: Potentially risky methods: PUT DELETE TRACE PROPFIND PROPPATCH MKCOL COPY MOVE LOCK UNLOCK|_See http://nmap.org/nsedoc/scripts/http-methods.html| http-robots.txt: 2 disallowed entries |_/*sendto_form$ /*folder_factories$|_http-title: Welcome — Distributed Systems Group site443/tcp open ssl/http Zope httpd 2.10.5-final (python 2.4.3, linux2; ZServer/1.1 Plone/3.0.2)|_http-favicon: Plone CMS|_http-generator: Plone - http://plone.org| http-methods: Potentially risky methods: PUT DELETE TRACE PROPFIND PROPPATCH MKCOL COPY MOVE LOCK UNLOCK|_See http://nmap.org/nsedoc/scripts/http-methods.html| http-robots.txt: 2 disallowed entries |_/*sendto_form$ /*folder_factories$|_http-title: Welcome — Distributed Systems Group site 80

NETWORK MAPPER
LECTURE 7: NETWORK MGT AND DEBUGGING
• nmap commands:COMMAND: ENABLE OS DETECTION WITH NMAP $ nmap -O ds.cs.ut.ee
OUTPUT:
user@yosemite:~$ sudo nmap -O ds.cs.ut.ee[sudo] password for user:
Starting Nmap 6.47 ( http://nmap.org ) at 2016-03-29 15:17 EESTNmap scan report for ds.cs.ut.ee (193.40.36.82)Host is up (0.00094s latency).rDNS record for 193.40.36.82: dionysos.at.mt.ut.eeNot shown: 993 filtered portsPORT STATE SERVICE22/tcp open ssh80/tcp open http443/tcp open https631/tcp closed ipp3690/tcp open svn8443/tcp closed https-alt9418/tcp open gitAggressive OS guesses: Linux 2.6.8 - 2.6.30 (97%), Linux 2.6.26 (97%), Linux 2.6.18 (95%), Linux 2.6.32 (95%), Linux 2.6.26 - 2.6.35 (95%), Linux 2.6.16 - 2.6.21 (94%), Asus RT-AC66U router (Linux 2.6) (94%), Linux 2.6.23 - 2.6.38 (93%), Linux 2.6.9 - 2.6.27 (93%), Linux 2.6.22 (93%)No exact OS matches for host (test conditions non-ideal).
OS detection performed. Please report any incorrect results at http://nmap.org/submit/ .Nmap done: 1 IP address (1 host up) scanned in 34.32 seconds
81

NETWORK MAPPER
LECTURE 7: NETWORK MGT AND DEBUGGING
• nmap commands:COMMAND: SCAN HOST TO DETECT FIREWALL $ nmap -sA ds.cs.ut.ee
OUTPUT:
user@yosemite:~$ sudo nmap -sA ds.cs.ut.ee
Starting Nmap 6.47 ( http://nmap.org ) at 2016-03-29 15:18 EESTNmap scan report for ds.cs.ut.ee (193.40.36.82)Host is up (0.00095s latency).rDNS record for 193.40.36.82: dionysos.at.mt.ut.eeNot shown: 993 filtered portsPORT STATE SERVICE22/tcp unfiltered ssh80/tcp unfiltered http443/tcp unfiltered https631/tcp unfiltered ipp3690/tcp unfiltered svn8443/tcp unfiltered https-alt9418/tcp unfiltered git
Nmap done: 1 IP address (1 host up) scanned in 64.29 seconds
82
NETWORK MAPPER
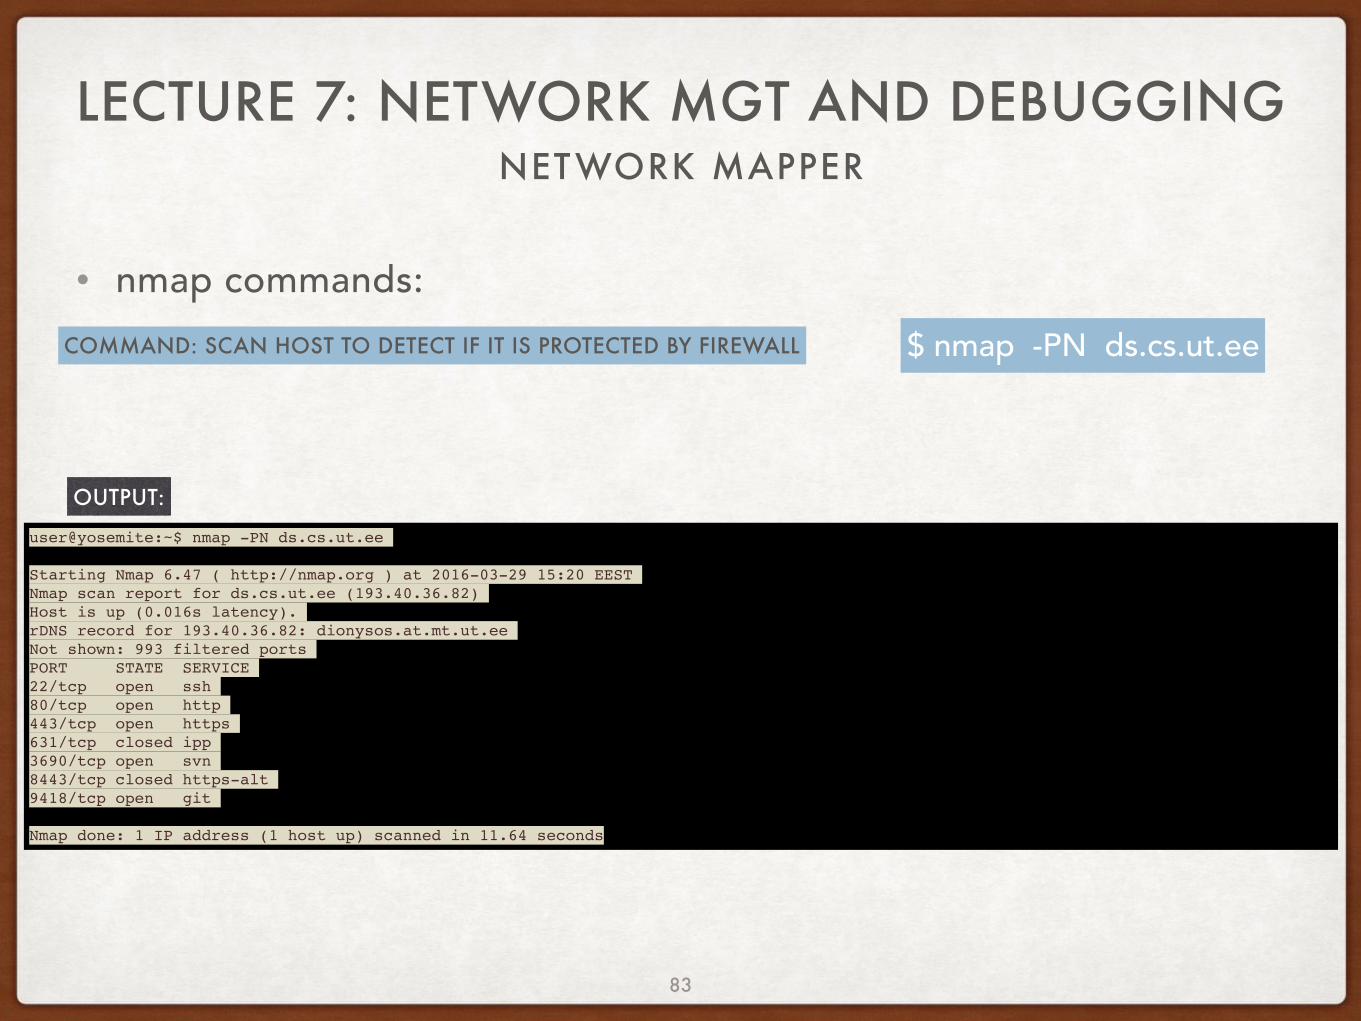
LECTURE 7: NETWORK MGT AND DEBUGGING
• nmap commands:COMMAND: SCAN HOST TO DETECT IF IT IS PROTECTED BY FIREWALL $ nmap -PN ds.cs.ut.ee
OUTPUT:
user@yosemite:~$ nmap -PN ds.cs.ut.ee
Starting Nmap 6.47 ( http://nmap.org ) at 2016-03-29 15:20 EESTNmap scan report for ds.cs.ut.ee (193.40.36.82)Host is up (0.016s latency).rDNS record for 193.40.36.82: dionysos.at.mt.ut.eeNot shown: 993 filtered portsPORT STATE SERVICE22/tcp open ssh80/tcp open http443/tcp open https631/tcp closed ipp3690/tcp open svn8443/tcp closed https-alt9418/tcp open git
Nmap done: 1 IP address (1 host up) scanned in 11.64 seconds
83

NETWORK MAPPER
LECTURE 7: NETWORK MGT AND DEBUGGING
• nmap commands:COMMAND: SCAN FOR LIVE HOST IN A NETWORK $ nmap -sP 172.17.125.*
OUTPUT:
user@yosemite:~$ nmap -sP 172.17.125.*
Starting Nmap 6.47 ( http://nmap.org ) at 2016-03-29 15:21 EESTNmap scan report for 172.17.125.50Host is up (0.0025s latency).Nmap scan report for 172.17.125.55Host is up (0.0024s latency).Nmap scan report for 172.17.125.56Host is up (0.0024s latency).Nmap scan report for 172.17.125.57Host is up (0.0024s latency).Nmap scan report for 172.17.125.59Host is up (0.0026s latency).Nmap scan report for 172.17.125.60Host is up (0.0029s latency).Nmap scan report for 172.17.125.66Host is up (0.0015s latency).Nmap scan report for 172.17.125.73Host is up (0.0032s latency).Nmap scan report for 172.17.125.74Host is up (0.0035s latency).Nmap scan report for 172.17.125.75Host is up (0.0053s latency).Nmap done: 256 IP addresses (20 hosts up) scanned in 16.83 seconds
84

NETWORK MAPPER
LECTURE 7: NETWORK MGT AND DEBUGGING
• nmap commands:COMMAND: SCAN AND PRINT INTERFACES AND ROUTES $ nmap -iflist
OUTPUT:
user@yosemite:~$ nmap -iflist
Starting Nmap 6.47 ( http://nmap.org ) at 2016-03-29 15:22 EEST************************INTERFACES************************DEV (SHORT) IP/MASK TYPE UP MTU MACeth0 (eth0) 192.168.88.253/24 ethernet up 1500 28:92:4A:CA:E3:D7eth0 (eth0) fe80::2a92:4aff:feca:e3d7/64 ethernet up 1500 28:92:4A:CA:E3:D7lo (lo) 127.0.0.1/8 loopback up 65536lo (lo) ::1/128 loopback up 65536
**************************ROUTES**************************DST/MASK DEV METRIC GATEWAY192.168.88.0/24 eth0 00.0.0.0/0 eth0 0 192.168.88.1::1/128 lo 0fe80::2a92:4aff:feca:e3d7/128 lo 0::1/128 lo 256fe80::/64 eth0 256ff00::/8 eth0 256
85


![Debugging with gdb · Debugging Data Race Conditions: Section 12.2 [Data Race Detection], page 171. Debugging OpenMP*: Section 12.4 [OpenMP* Debugging], page 177. Extended recording](https://static.fdocuments.net/doc/165x107/5f0b5c707e708231d4302334/debugging-with-gdb-debugging-data-race-conditions-section-122-data-race-detection.jpg)

