Lecture 5: Cost, Price, and Price for Performance
29
RHK.S96 1 Lecture 5: Cost, Price, and Price for Performance Professor Randy H. Katz Computer Science 252 Spring 1996
Transcript of Lecture 5: Cost, Price, and Price for Performance
RHK.S96 1
Lecture 5: Cost, Price, and Price for Performance
Professor Randy H. KatzComputer Science 252
Spring 1996
RHK.S96 2
Review From Last Time
• Given sales a function of performance relative to competition, tremendous investment in improving product as reported by performance summary
• Good products created when have:– Good benchmarks– Good ways to summarize performance
• If benchmarks/summary inadequate, then choice between improving product for real programs vs. improving product to get more sales;sales almost always wins!
• Execution time is the REAL measure of computer performance!
• What about cost?

RHK.S96 3
Impact of Means on SPECmark89 for IBM 550
Ratio to VAX: Time: Weighted Time:Program Before After Before After Before Aftergcc 30 29 49 51 8.91 9.22espresso 35 34 65 67 7.64 7.86spice 47 47 510 510 5.69 5.69doduc 46 49 41 38 5.81 5.45nasa7 78 144 258 140 3.43 1.86li 34 34 183 183 7.86 7.86eqntott 40 40 28 28 6.68 6.68matrix300 78 730 58 6 3.43 0.37fpppp 90 87 34 35 2.97 3.07tomcatv 33 138 20 19 2.01 1.94Mean 54 72 124 108 54.42 49.99
Geometric Arithmetic Weighted Arith.Ratio 1.33 Ratio 1.16 Ratio 1.09
RHK.S96 4
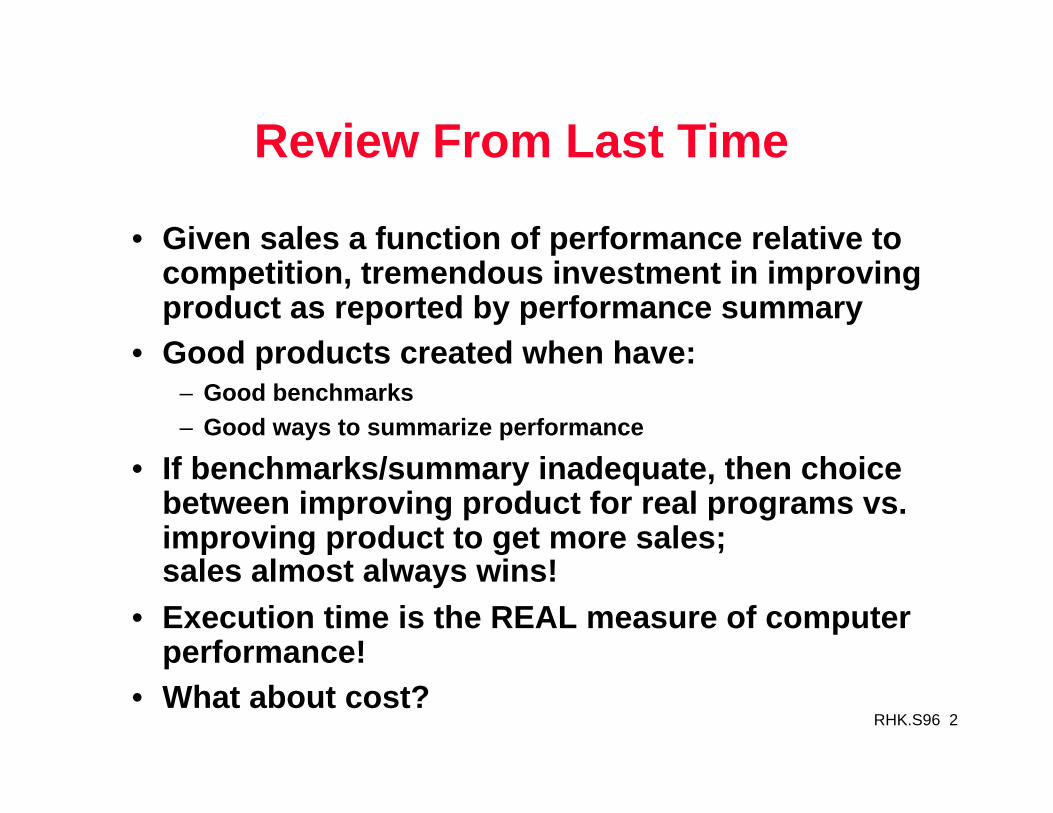
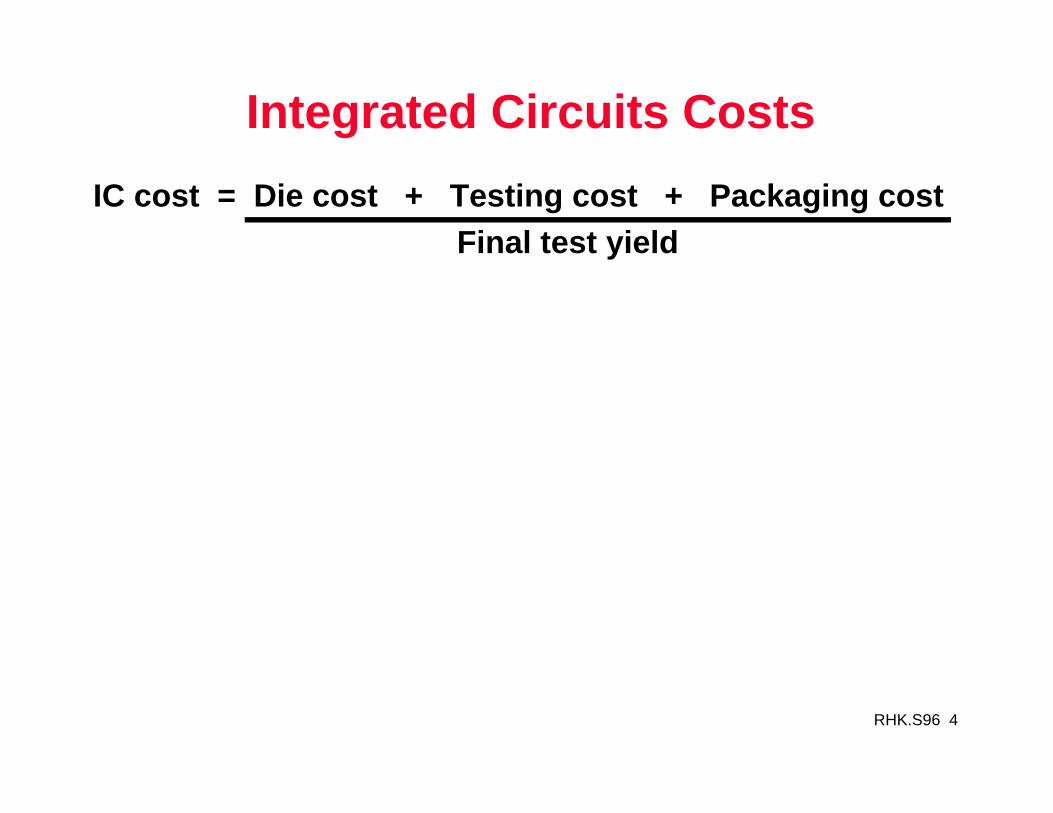
IC cost = Die cost + Testing cost + Packaging cost Final test yield
Integrated Circuits Costs

RHK.S96 5
IC cost = Die cost + Testing cost + Packaging cost Final test yield
Die cost = Wafer cost Dies per Wafer * Die yield
Integrated Circuits Costs

RHK.S96 6
IC cost = Die cost + Testing cost + Packaging cost Final test yieldDie cost = Wafer cost Dies per Wafer * Die yield
Dies per wafer = π * ( Wafer_diam / 2)2 – π * Wafer_diamDie Area √ 2 * Die Area
– Test dies
Integrated Circuits Costs
RHK.S96 7
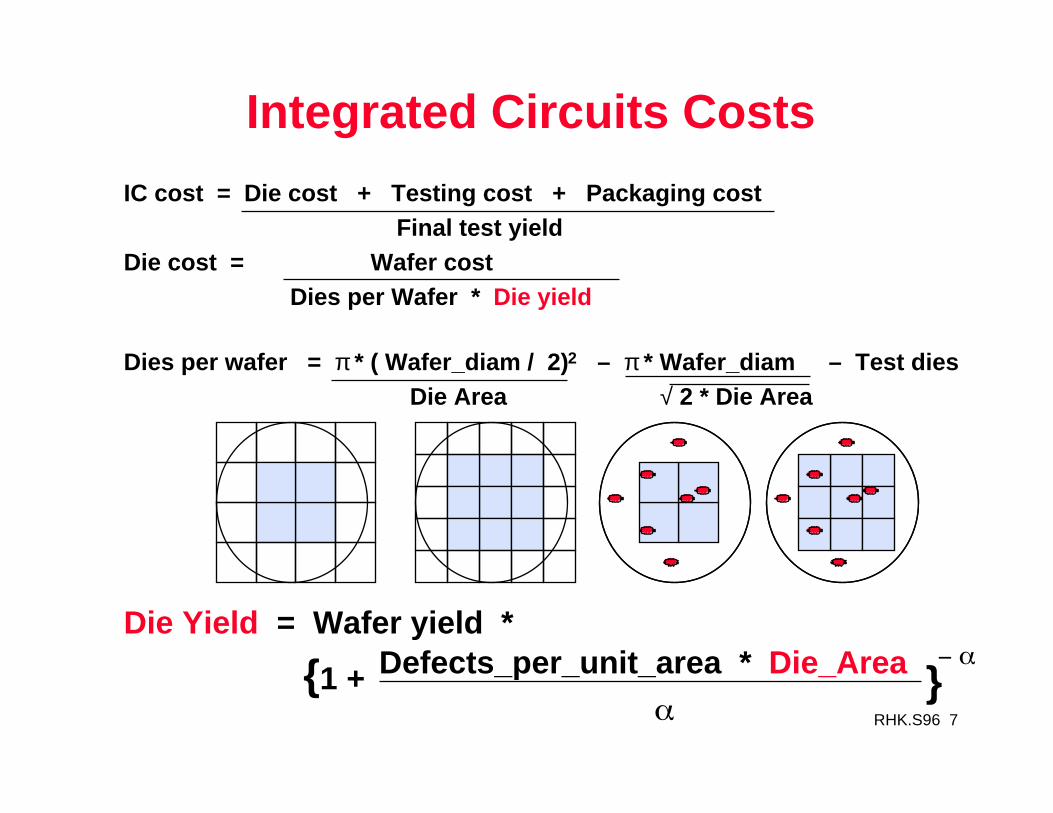
IC cost = Die cost + Testing cost + Packaging cost Final test yieldDie cost = Wafer cost Dies per Wafer * Die yield
Dies per wafer = π * ( Wafer_diam / 2)2 – π * Wafer_diam – Test dies Die Area √ 2 * Die Area
Die Yield = Wafer yield *
Integrated Circuits Costs
Defects_per_unit_area * Die_Area
{1 + }
RHK.S96 8
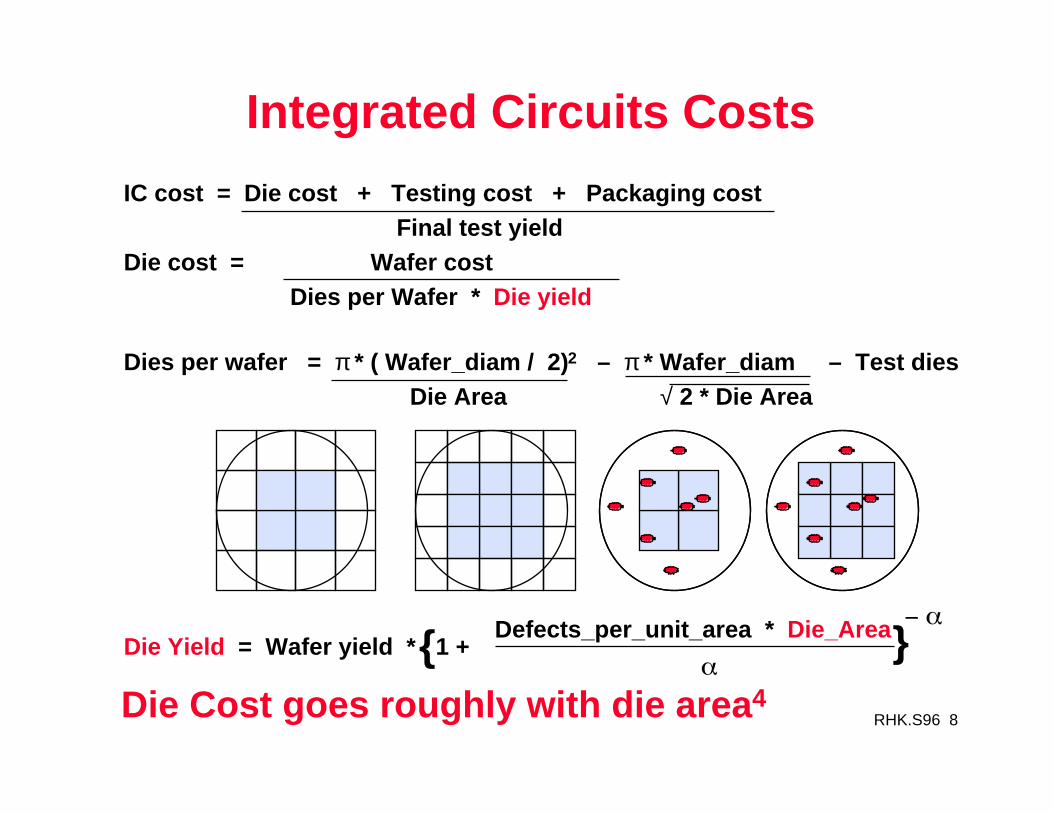
IC cost = Die cost + Testing cost + Packaging cost Final test yieldDie cost = Wafer cost Dies per Wafer * Die yield
Dies per wafer = π * ( Wafer_diam / 2)2 – π * Wafer_diam – Test dies Die Area √ 2 * Die Area
Die Yield = Wafer yield * 1 +
Defects_per_unit_area * Die_Area
Integrated Circuits Costs
Die Cost goes roughly with die area4
{ }

RHK.S96 9
Real World Examples
Chip Metal Line Wafer Defect Area Dies/ Yield Die Cost layers width cost /cm2 mm2 wafer386DX 2 0.90 $900 1.0 43 360 71% $4 486DX2 3 0.80 $1200 1.0 81 181 54% $12 PowerPC 601 4 0.80 $1700 1.3 121 115 28% $53 HP PA 7100 3 0.80 $1300 1.0 196 66 27% $73 DEC Alpha 3 0.70 $1500 1.2 234 53 19% $149 SuperSPARC 3 0.70 $1700 1.6 256 48 13% $272 Pentium 3 0.80 $1500 1.5 296 40 9% $417
– From "Estimating IC Manufacturing Costs,” by Linley Gwennap, Microprocessor Report, August 2, 1993, p. 15
RHK.S96 10
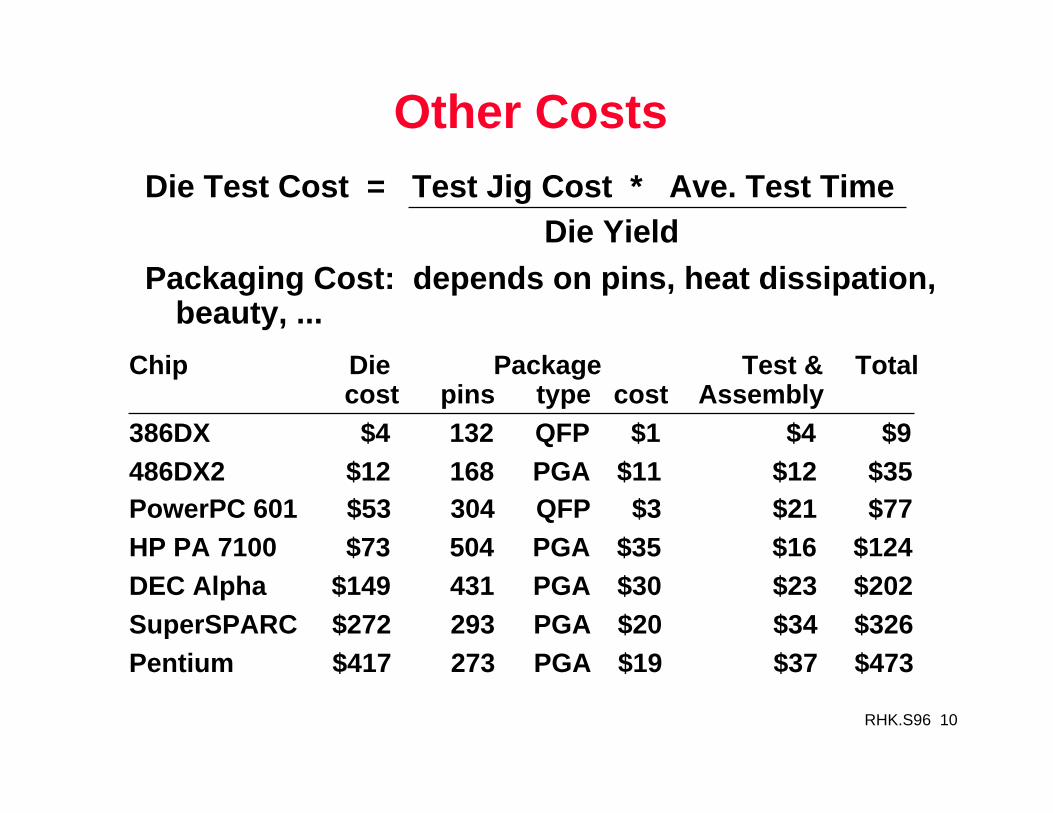
Die Test Cost = Test Jig Cost * Ave. Test Time Die YieldPackaging Cost: depends on pins, heat dissipation,
beauty, ...
Other Costs
Chip Die Package Test & Totalcost pins type cost Assembly
386DX $4 132 QFP $1 $4 $9 486DX2 $12 168 PGA $11 $12 $35 PowerPC 601 $53 304 QFP $3 $21 $77 HP PA 7100 $73 504 PGA $35 $16 $124 DEC Alpha $149 431 PGA $30 $23 $202 SuperSPARC $272 293 PGA $20 $34 $326 Pentium $417 273 PGA $19 $37 $473
RHK.S96 11
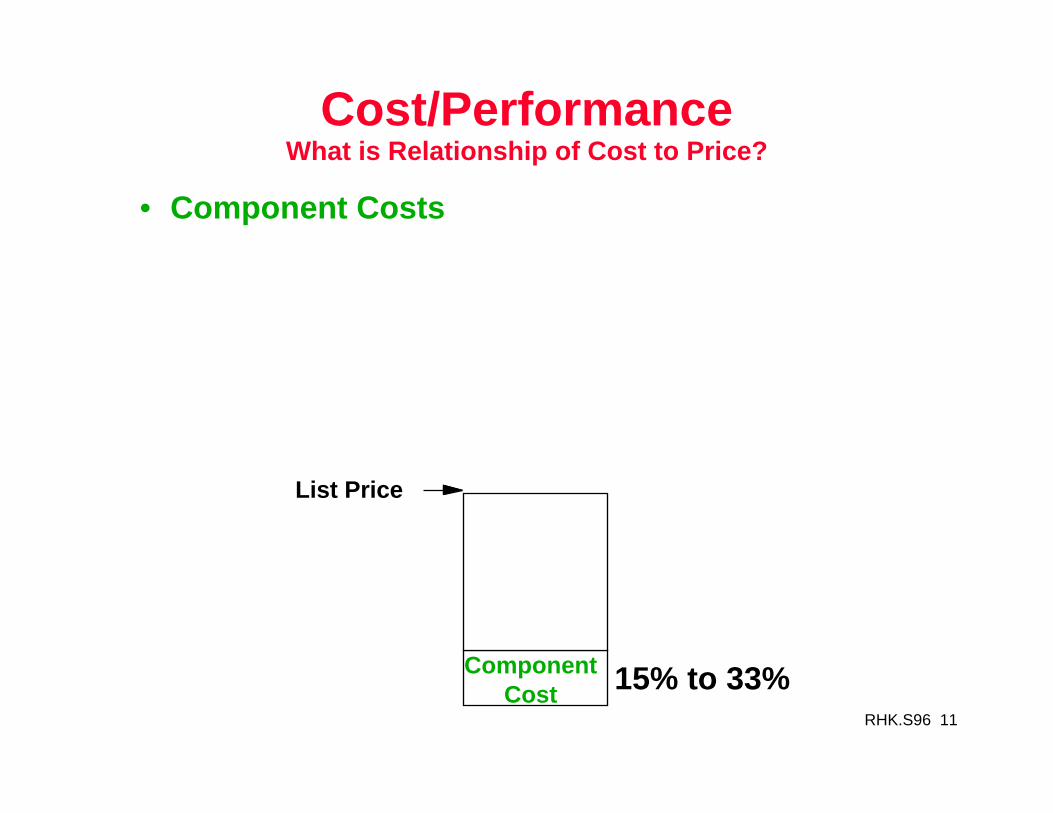
Cost/PerformanceWhat is Relationship of Cost to Price?
• Component Costs
ComponentCost
List Price
15% to 33%

RHK.S96 12
Cost/PerformanceWhat is Relationship of Cost to Price?
• Component Costs• Direct Costs (add 25% to 40%) recurring costs: labor,
purchasing, scrap, warranty
ComponentCost
Direct Cost
List Price
15% to 33%6% to 8%

RHK.S96 13
Cost/PerformanceWhat is Relationship of Cost to Price?
• Component Costs• Direct Costs (add 25% to 40%) recurring costs: labor,
purchasing, scrap, warranty
• Gross Margin (add 82% to 186%) nonrecurring costs: R&D, marketing, sales, equipment maintenance, rental, financing cost, pretax profits, taxes
ComponentCost
Direct Cost
GrossMargin
List Price
15% to 33%6% to 8%
34% to 39%

RHK.S96 14
Cost/PerformanceWhat is Relationship of Cost to Price?
• Component Costs• Direct Costs (add 25% to 40%) recurring costs: labor,
purchasing, scrap, warranty
• Gross Margin (add 82% to 186%) nonrecurring costs: R&D, marketing, sales, equipment maintenance, rental, financing cost, pretax profits, taxes
• Average Discount to get List Price (add 33% to 66%): volume discounts and/or retailer markup
ComponentCost
Direct Cost
GrossMargin
AverageDiscount
Avg. Selling Price
List Price
15% to 33%6% to 8%
34% to 39%
25% to 40%

RHK.S96 15
• Assume purchase 10,000 units
Chip Prices (August 1993)
Chip Area Mfg. Price Multi- Commentmm2 cost plier
386DX 43 $9 $31 3.4 Intense CompetitionIntense Competition486DX2 81 $35 $245 7.0 No CompetitionNo CompetitionPowerPC 601 121 $77 $280 3.6
DEC Alpha 234 $202 $1231 6.1 Recoup R&D?Pentium 296 $473 $965 2.0 Early in shipments

RHK.S96 16
Workstation Costs: $1000 to $3000
• DRAM: 50% to 55%• Color Monitor: 15% to 20%• CPU board: 10% to 15%• Hard disk: 8% to 10%• CPU cabinet: 3% to 5%• Video & other I/O: 3% to 7%• Keyboard, mouse: 1% to 2%
RHK.S96 17
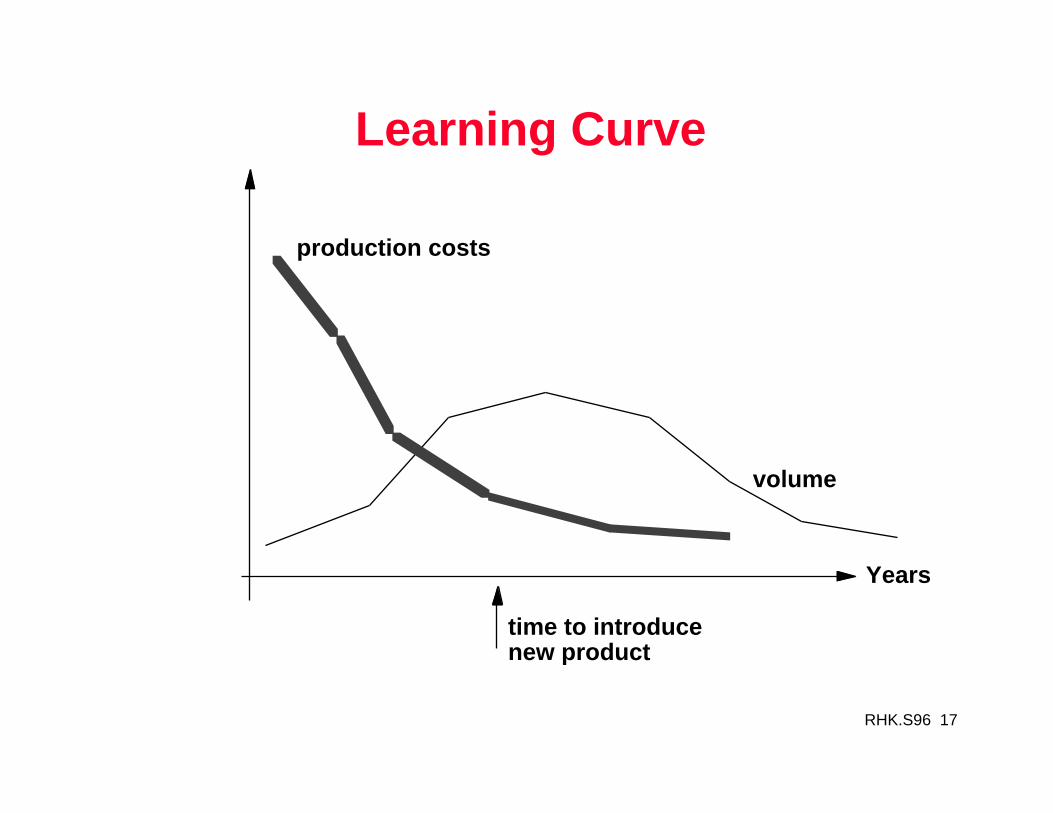
Learning Curve
Years
production costs
volume
time to introducenew product
RHK.S96 18
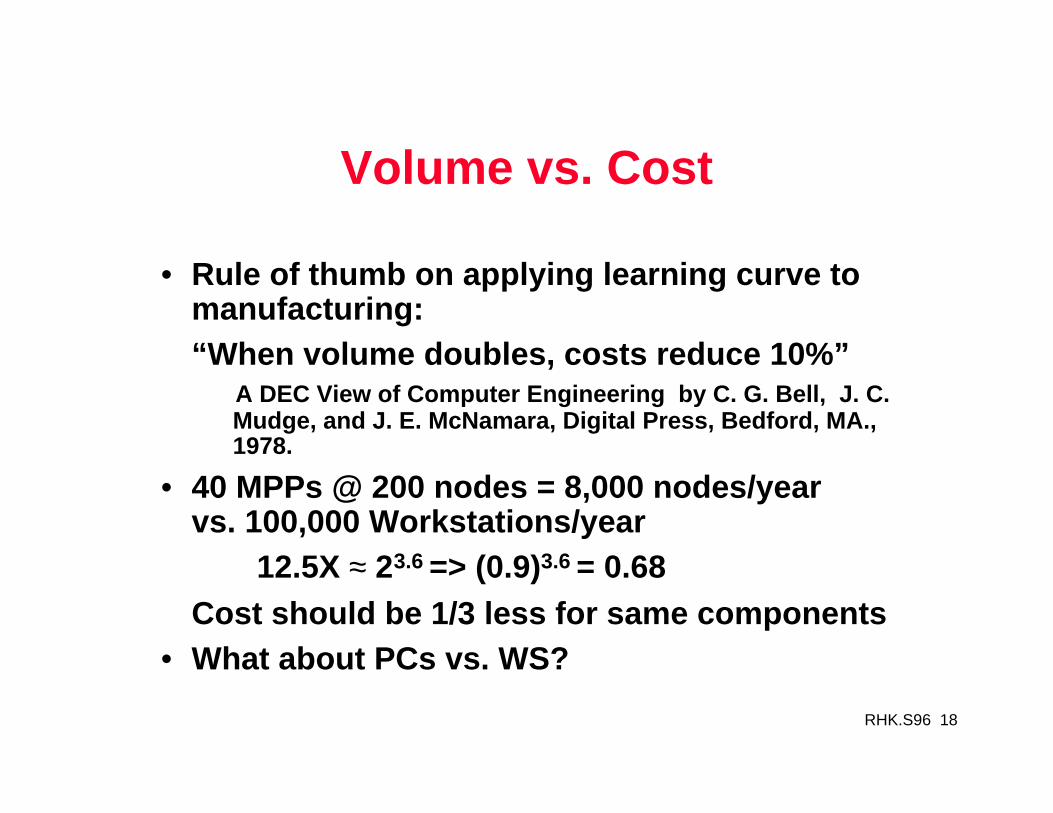
Volume vs. Cost
• Rule of thumb on applying learning curve to manufacturing:“When volume doubles, costs reduce 10%”
A DEC View of Computer Engineering by C. G. Bell, J. C. Mudge, and J. E. McNamara, Digital Press, Bedford, MA., 1978.
• 40 MPPs @ 200 nodes = 8,000 nodes/year vs. 100,000 Workstations/year
12.5X ≈ 23.6 => (0.9)3.6 = 0.68Cost should be 1/3 less for same components
• What about PCs vs. WS?
RHK.S96 19
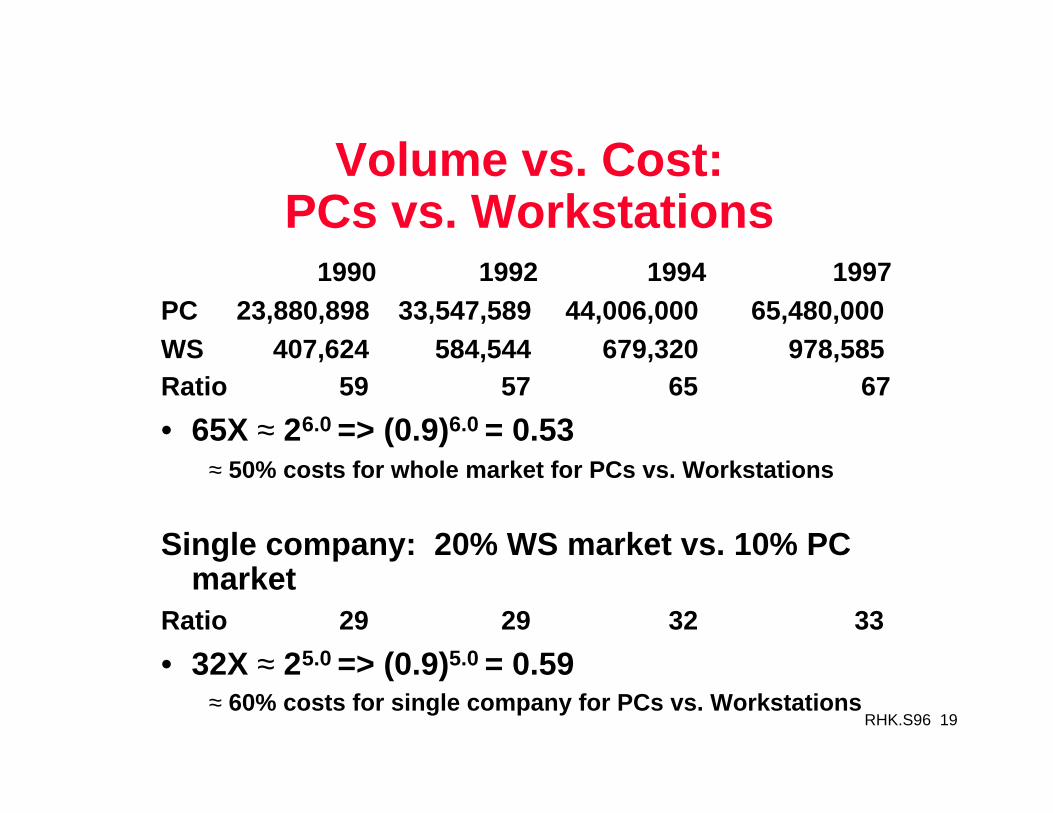
Volume vs. Cost: PCs vs. Workstations
1990 1992 1994 1997PC 23,880,898 33,547,589 44,006,000 65,480,000 WS 407,624 584,544 679,320 978,585 Ratio 59 57 65 67
• 65X ≈ 26.0 => (0.9)6.0 = 0.53≈ 50% costs for whole market for PCs vs. Workstations
Single company: 20% WS market vs. 10% PC market
Ratio 29 29 32 33
• 32X ≈ 25.0 => (0.9)5.0 = 0.59≈ 60% costs for single company for PCs vs. Workstations
RHK.S96 20
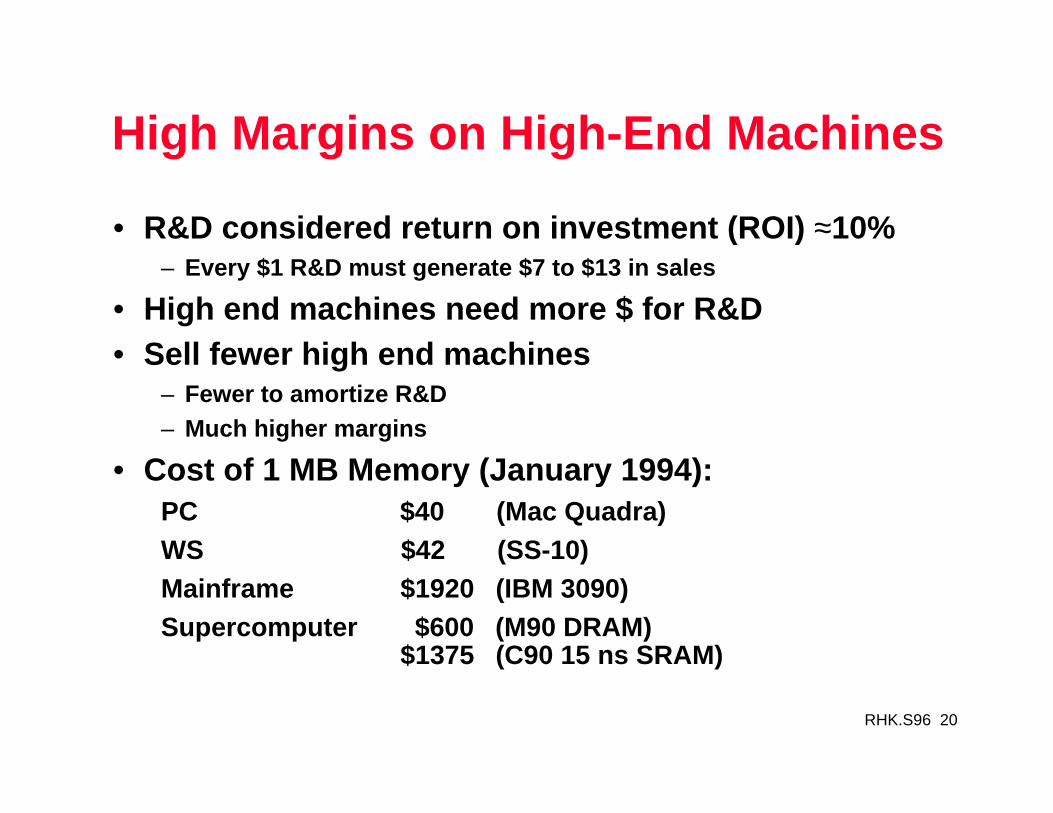
High Margins on High-End Machines
• R&D considered return on investment (ROI) ≈10%– Every $1 R&D must generate $7 to $13 in sales
• High end machines need more $ for R&D• Sell fewer high end machines
– Fewer to amortize R&D– Much higher margins
• Cost of 1 MB Memory (January 1994):PC $40 (Mac Quadra)WS $42 (SS-10)Mainframe $1920 (IBM 3090)Supercomputer $600 (M90 DRAM)
$1375 (C90 15 ns SRAM)

RHK.S96 21
Recouping Development Cost on Low Volume Microprocessors?
• Hennessy says MIPS R4000 cost $30M to develop• Intel rumored to invest $100M on 486• SGI/MIPS sells 300,000 R4000s over product lifetime?• Intel sells 50,000,000 486s?• Intel must get $100M from chips ($2/chip)• SGI/MIPS can get $30M from margin of workstations
vs. chips vs. $100/chip• Alternative: SGI buys chips vs. develops them

RHK.S96 22
Price/PerformanceGross Margin vs. Market Segment
0%
20%
40%
60%
80%
100%
Mini W/S PC
Average Discount
Gross Margin
Direct Costs
Component Costs

RHK.S96 23
Price/PerformanceGross Margin vs. Market Segment
0
1
2
3
4
5
Mini W/S PC
Average Discount
Gross Margin
Direct Costs
Component Costs
4.73.8
1.8
3.52.5
1.5

RHK.S96 24
Impact of Margin Shrink on Society/Computer Industry
• Economy?• Research Labs?• Future Products?• Your jobs?

RHK.S96 25
Information Technology R&DU.S. IT's Biggest R&D Spenders in 1993: Total $29.2 billion
$0.97 B$1.521 B
$1.5301 B
$10.5869 B
$1.761 B
$3.43 B
$4.43 B
IBM AT&T HP DEC
Motorola Intel Xerox Apple
GM-H.E. Texas Instr Unisys Microsoft
Sun Tandem Honeywell 297 other companies
Compaq is #1PC maker in US

RHK.S96 26
Accelerating Pace of Product Development
1991
$127 Billion
36%
29%
35%2+ Years
0-1 Year
1-2 Years
22%
46%
32%
1996
$165 Billion
Product age as % of revenue

RHK.S96 27
Shift in Employment Towards Software and Services
Annual Employment in U.S. IT Industry (1000's of employees)
0
500
1000
1500
2000
2500
'60 '61 '62 '63 '64 '65 '66 '67 '68 '69 '70 '71 '72 '73 '74 '75 '76 '77 '78 '79 '80 '81 '82 '83 '84 '85 '86 '87 '88 '89 '90 '91 '92 '93 '94
Cptr & DP Services
Cptr Bus Equip
Telecom

RHK.S96 28
Long Term R&D InvestmentsTake Time to Payoff
Timesharing
Networking
Redundant Array ofInexpensive Disks
Parallel Computing
MicroElectro Mech.Systems
1965 1970 1975 199019851980 1995
Gov’t Research $1B businessIndustry R & D
Reduced InstructionSet Architecture

RHK.S96 29
US IT Trade Balance(It’s Negative!)
IT Industry Exports and Trade Balance ($, Billions)
-30
-20
-10
0
10
20
30
40
81 82 83 84 85 86 87 88 89 90 91 92 93 94
Exports
Trade Balance