Lecture 3: Capital Flows and the Dutch Disease in the TNT ...
38
Lecture 3: Capital Flows and the Dutch Disease in the TNT model ECON 3235 Economics of LatAm Lecture 3 Fall 2017 Darryl McLeod, Fordham University
Transcript of Lecture 3: Capital Flows and the Dutch Disease in the TNT ...

Lecture 3: Capital Flows and the Dutch Disease in the TNT model
ECON 3235 Economics of LatAmLecture 3 Fall 2017
Darryl McLeod, Fordham University

Real exchange rate management a serious problem in LatAm, now for the Euro zone… • At the end of Chapter 6 Edwards, 2010 argues, “In the story
of Latin American economic reform, then, one variable more than any other plays a crucial role. It is not inflation, wages, or economic growth; it is not privatization or the extent of openness and globalization; it is not even foreign debt. The key variable is the exchange rate, or the value of the local currency-the peso, the bolivar, the quetzal, the real, or the cordoba-in relation to the United States dollar. Repeated mistakes in exchange-rate policy will be singled out as the most important cause behind the region's economic travails, the waning support for modernizing reforms, and the eventual revival of populism during the twenty-first century. Sebastian Edwards. Left Behind: Latin America and the False Promise of PopulismKindle Edition (chapter 6).
• Some good news: with a few exceptions, exchange rate management has improved greatly and region has learned to cope with commodity price instability and “sudden stops” in private capital flows.
Lecture Notes ECON 3235 2

Key exchange rate management challenges for Emerging Market countries
1. Dutch Disease (DD) natural resource booms and busts: Populist spending and public and private capital inflows amplify the boom bust-cycle….
2. Devaluing nominal exchange rate counters DD: but can be inflationary… almost all LatAm countries used “nominal anchors” to stop inflation in 1990s (ABC &M).
3. Capital inflows and Financial liberalization can aggravate DD: CA deficit, followed by capital inflows, real estate boom, more credit expansion, more imports, they collapse of banks and external debt crisis (and inflation) follow… This is the “proto-typical” Rheinhart and Rogoffcrises (see slide 22 below)
Lecture Notes ECON 3235 3

Policy responses to TT shocks or capital flow shifts
Four ways to reduce a CA deficit: (two shift, two move along S&D):1. External devaluation: change “e” the nominal
exchange rate 2. Internal devaluation: change domestic prices–
p inflation or deflation 3. Stabilization policy: shift the demand curve cut
fiscal deficit or raise interest rates (“austerity”)4. Structural Adjustment: supply side, make
exports more competitive, laborLecture Notes ECON 3235 4

Real exchange rate = ep*/p• Inflation adjusted price of dollars or real
exchange rate since ∆q = (∆e + π* - π) • Internal devaluation: p CPI falls (deflation)• External devaluation: e rises, but inflation
may too, “the pass through” problem requires a change in Nominal Anchor from e to π
• In the TNT model the RER is the price of traded over non-traded goods PT/PN where PT = ep* and PN = p
Lecture Notes ECON 3235 5

The full TNT PPF includes community indifference curve: combinations of traded and nontraded goods consumption that
make the population equally happy.
Figure TNT-1: PPF for a small Open EconomyQN, CN
Social or communityIndifference curve
A
qA = - PT/PN wherePT = ep*
QT, CTLecture Notes ECON 3235 6
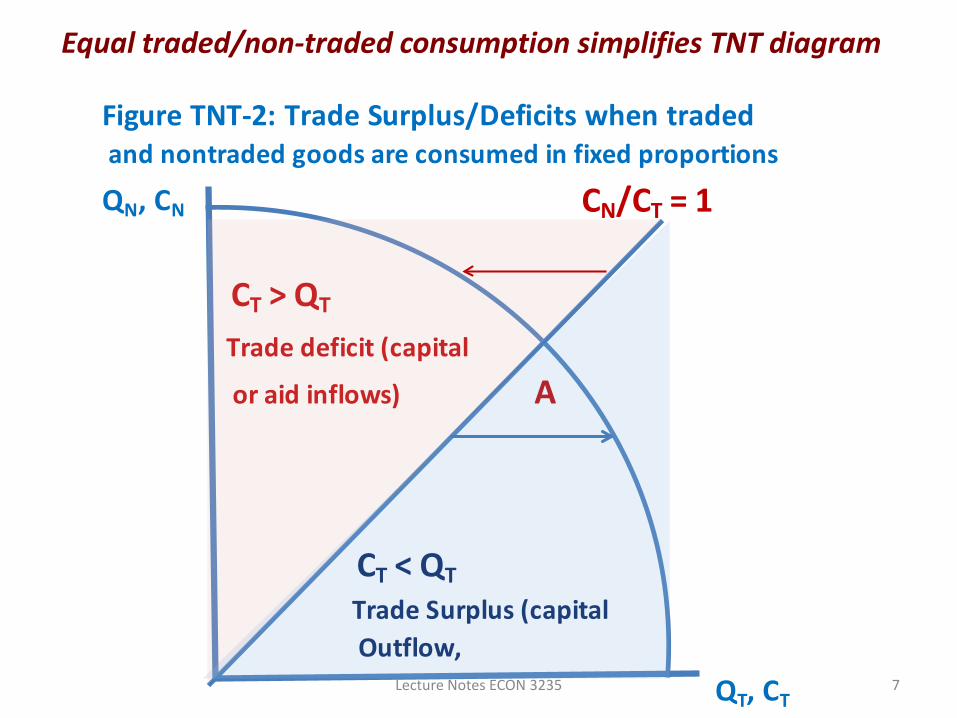
Equal traded/non-traded consumption simplifies TNT diagram
Figure TNT-2: Trade Surplus/Deficits when traded and nontraded goods are consumed in fixed proportions
QN, CN CN/CT = 1
CT > QT
Trade deficit (capital
or aid inflows) A
CT < QT Trade Surplus (capital Outflow,
QT, CTLecture Notes ECON 3235 7

Traded/non-traded consumption path simplifies TNT diagram,at every equilibrium, CNT = QNT (see horizontal lines below)
Lecture Notes ECON 5459 CAP 8
Figure TNT-3: TNT for a small Open EconomyQN, CN CN/CT = 1NT goods CT > QT E B
include Trade deficit: (capital Balanced trade
roads, or aid inflows) CT = QT
real estateservices
etc. CT < QT
Trade/CA surplus: country accumulates reservesor pays off external debt orinvests capital in other ctys.
Traded goods output & consp QT, CT
Slope of ppf is qA = -PT/PN where PT = ep*
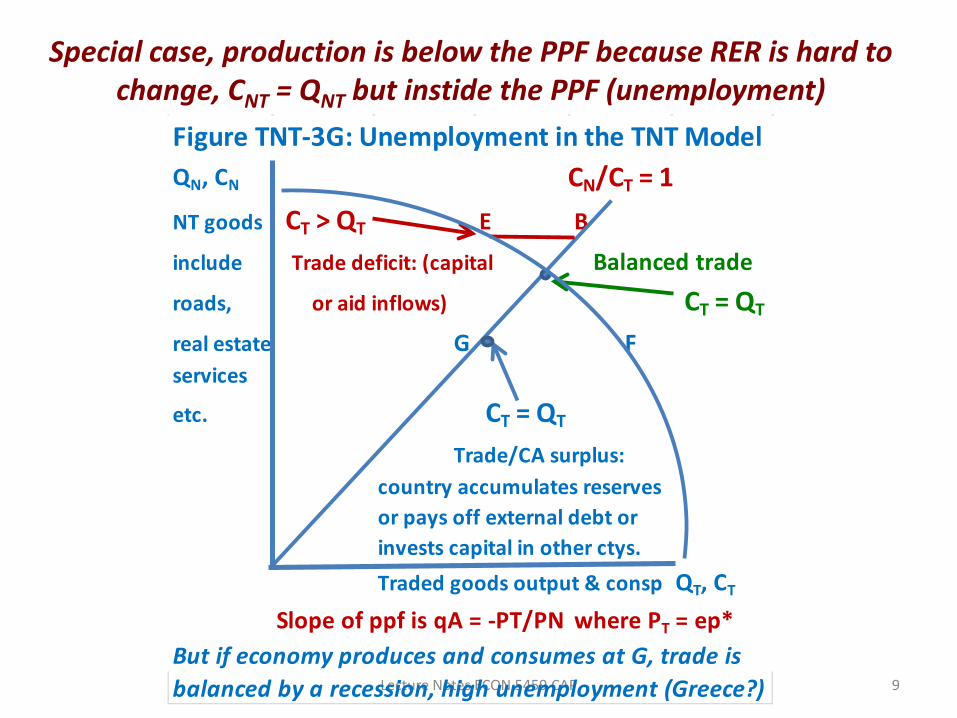
Special case, production is below the PPF because RER is hard to change, CNT = QNT but instide the PPF (unemployment)
Lecture Notes ECON 5459 CAP 9
Figure TNT-3G: Unemployment in the TNT ModelQN, CN CN/CT = 1NT goods CT > QT E B
include Trade deficit: (capital Balanced trade
roads, or aid inflows) CT = QT
real estate G Fservices
etc. CT = QT
Trade/CA surplus: country accumulates reservesor pays off external debt orinvests capital in other ctys. Traded goods output & consp QT, CT
Slope of ppf is qA = -PT/PN where PT = ep*But if economy produces and consumes at G, trade is balanced by a recession, high unemployment (Greece?)

Capital in-flows lead to real estate boom and trade deficit
Figure TNT-4: PPF for a small Open EconomyQN, CN CN/CT = 1non-traded
goods E B
qB RER appreciates
C F
qA = - PT/PN wherePT = ep*
Traded goods QT, CT

Capital inflows always lead to Appreciation of RER
Figure TNT-4: PPF for a small Open EconomyQN, CN CN/CT = 1
E B
A qB RER appreciates
C F
qA = - PT/PN wherePT = ep*
QT, CTLecture Notes ECON 3235 11

The Dutch Disease involves a shift in the RER
Lecture Notes ECON 3235 12

A fixed Traded/non-traded consumption path simplifies TNT diagram: why is B incompatible with A (and q set by A)
Figure 1Nontraded CN/CT
QNGoods
q = PT/PNT
PT = ep*
q
Traded Goods QT
Figure 6.4: The RER changes as you move along the PPFthe real exchange rate, RER or q = PT/PNT where PT = ep*.
A
B
Lecture Notes ECON 3235 13

LT Dutch Disease Solutions
1. Chile’s Fiscal rule: Copper Stabilization fund see Teresa Daban, 2011,
2. Venezuela: redistribution progams… fiscal spending on the poor: but can be inflationary…
3. Flexible exchange rates: sterilization, S-Term capital controls
4. Excess crude funds, flexible fx policy (Uganda and Nigeria?)Capital inflows and Financial liberalization can aggravate DD:
Lecture Notes ECON 3235 14

Chile exchange rate weakens during crisis years, and remains much weaker that it was in 1970
Lecture Notes ECON 3235 15

El Salvador’s RER strengthened since the war years, and continued to do so even after it adopted the U.S. dollar as it’s
currency in 2001, how and why? (recall the formula for the RER)
Lecture Notes ECON 3235 16

USDA computes real exchange rates for all Countries: why?
Lecture Notes ECON 3235 17

USDA computes real exchange rates for all Countries: why?
Lecture Notes ECON 3235 18

The USDA estimates real exchange rates for all Countries: why?
Lecture Notes ECON 3235 19

Argentina experienced two sharp depreciations of its currency
Lecture Notes ECON 3235 20
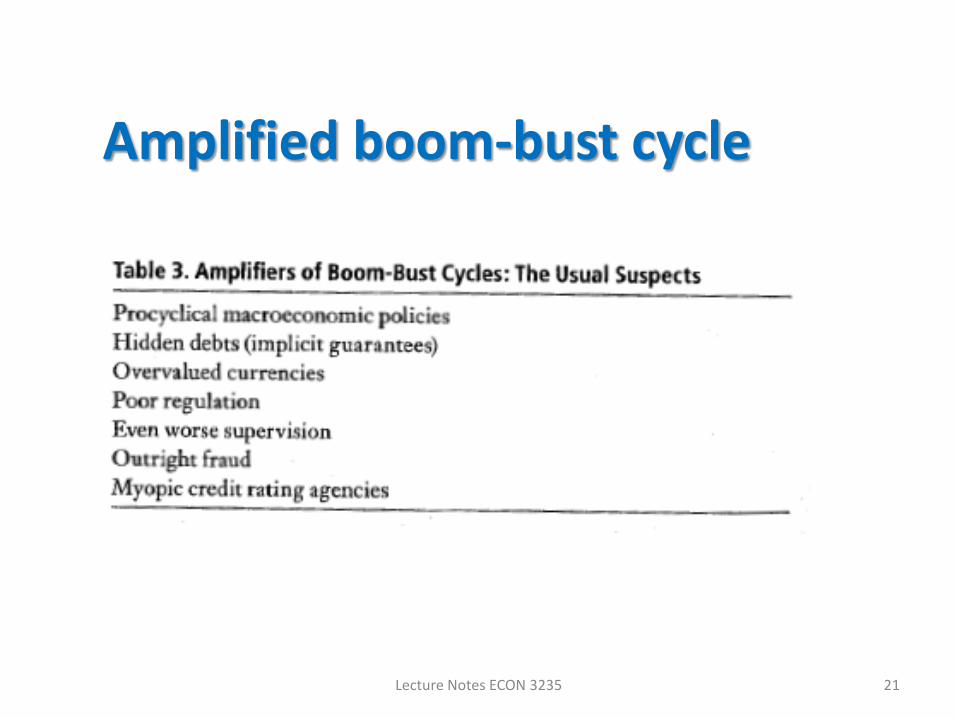
Amplified boom-bust cycle
Lecture Notes ECON 3235 21

Primary deficit
excludes interest payments, a reduction in
inflation reduces deficit, still need primary surplus
to stablize
Lecture Notes ECON 3235 22

Lecture Notes ECON 3235 23

Lecture Notes ECON 3235 24

Lecture Notes ECON 3235 25

Lecture Notes ECON 3235 26

Correlations Gov Spending & growth 1960-1999
procyclical
G always used to be pro-cyclical for most developing countries.
countercyclicall
Adapted from Kaminsky, Reinhart & Vegh, 2004, “When It Rains It Pours”
Pro-cyclical spending
Counter-cyclical spending

28
• Procyclicality has been especially strong in commodity-exporting countries.
• An important development --some developing countries, including commodity producers, were able to break the historic pattern in the most recent decade:– taking advantage of the boom of 2002-2008
• to run budget surpluses & build reserves,
– thereby earning the ability to expand fiscally in the 2008-09 crisis.
– Chile is the outstanding model; • also Botswana, China, Indonesia, & Korea.
The procyclicality of fiscal policy, continued

Correlations between Government & GDP Reversed in many ctys
“Graduation”
In the last decade, about 1/3 developing countries
switched to countercyclical fiscal policy:Negative correlation of G & GDP.
Frankel, Vegh & Vuletin (2011)
procyclicalcountercyclical
Costa Rica!!
Bolivia!!
Ecuador

The Dutch Disease is one component of the NRC
Source: Frankel (2012)
Natural Resource Curse: The size of the primary sector is not correlated positively with GDP growth

* Long-term trends in world commodity prices(Prebisch-Singer hypothesis, 1950. But negative trend has not been borne out.)
* Volatility (e.g., Hausmann & Rigobon, 2003)
* Permanent crowding out of manufacturing (Matsuyama, 1992)
* Unsustainability * Civil war (Collier, 2007…)
* Poor institutions (Auty, Sachs-Warner, Engerman-Sokoloff…), and
* Cyclical Dutch Disease.
Appendix I: The Natural Resource CurseSeven possible channels that some have suggested could lead to sub-standard economic performance:
JF, “The Natural Resource Curse: A Survey,” 2011

Natural resources need not necessarily be a “curse.”
• The aim: to get the economic performanceof a Chile, rather than a Bolivia;
• of an Australia rather than an Argentina
• of a Botswana, rather than a Congo;
• of a Norway, rather than a Venezuela.
What institutions can best avoid the resource pitfalls?

Copyright 2007 Jeffrey Frankel, unless otherwise notedAPI-120 - Macroeconomic Policy Analysis I
Professor Jeffrey Frankel, Kennedy School of Government, Harvard University
• The Dutch Disease & commodity price volatilityare two components of the longer-run NRC.
• Another important source of the NRC:natural resource abundance may be conducive to bad institutions, including rent-seeking & corruption.
• The Engerman-Sokoloff hypothesis(e.g., North America vs. South America):
extraction by mine & plantation => monopoly/authoritarianism/inequality;
=> societies without private incentives, => ill-suited to develop manufacturing & services.

Copyright 2007 Jeffrey Frankel, unless otherwise notedAPI-120 - Macroeconomic Policy Analysis I
Professor Jeffrey Frankel, Kennedy School of Government, Harvard University
Institutional mechanismsto reduce cyclicality of fiscal policy
• Independent central banks, to be ableto resist political pressure to monetize budget deficits;
• Budget rules, to be able to resist pressure to increase in spending overly when revenue is temporarily high;
• Well-managed Sovereign Wealth Funds (SWFs) to insulate accumulated assets from pressure to spend (especially in the case of a depletable natural resource), or from temptation to allocate assets on political grounds.

Institutions to fix the procylicality of fiscal policy in commodity-producing countries: The case of Chile

Poll ratings of Chile’s President over time
Chart source: Eduardo Engel, Christopher Neilson & Rodrigo Valdés, “Fiscal Rules as Social Policy,” Commodities Workshop, World Bank, Sept. 17, 2009
In 2009, the popularity of the Socialist President of Chile Michelle Bachelet rose sharply (both with respect to handling of the economy and overall), to the highest levels since the restoration of democracy 20 years earlier.
More remarkable: the rise in the polls, from very low to very high, came just as the economy moved from rapid growth to slow growth -- not the usual pattern. Why?

And the Finance Minister?: August 2009
Chart source: Eduardo Engel, Christopher Neilson & Rodrigo Valdés, “Fiscal Rules as Social Policy,” Commodities Workshop, World Bank, Sept. 17, 2009
Poll ratings of Chile’s
Presidents and Finance
Ministers
In August 2009, the popularity of the Finance Minister, Andres Velasco,
ranked behind only President Bachelet,
higher than any other minister since democracy. Why?

In 2008, a copper price spike had looked permanent to many.In 2009, the price reverted toward its long run trend.