Lecture 1 30 March, 2010 Department of Pharmaceutical Chemistry...
58
1 Mass Spectrometry and Proteomics Lecture 1 30 March, 2010 Alma L. Burlingame Department of Pharmaceutical Chemistry University of California, San Francisco [email protected]
Transcript of Lecture 1 30 March, 2010 Department of Pharmaceutical Chemistry...
1
Mass Spectrometry and Proteomics
Lecture 1
30 March, 2010
Alma L. Burlingame
Department of Pharmaceutical Chemistry
University of California, San Francisco

2
Course OutlineLectures: 10hrs:
12noon-2pm
Quantificationchemical/metabolic labelinglabel freeH/D exchange/protein turnover
Tuesday, April 13Lecture5
Infomatics for MSpreprocessing - deisotopingsimulated spectra/spectral librariesdatabase search enginesdenovo sequencing algorithms
Friday, April 9Lecture4
Posttranslational modificationsphosphorylationglycosylation/O-GlcNAcubiquitinationmethylation/acetylation - histonescross-linking/other chemical biology methods.
Tuesday, April 6Lecture3
MS based methodology in system biology proteomics - sample preparation gel-based/LC mehods - topdown/bottom up
Microfluidics and MS
Wednesday, March 31Lecture2
Mass Spectrometry Fundamentals: Instrumentation; ion optics, resolution and mass accuracy
Tuesday, March 30Lecture1
TopicDate
3
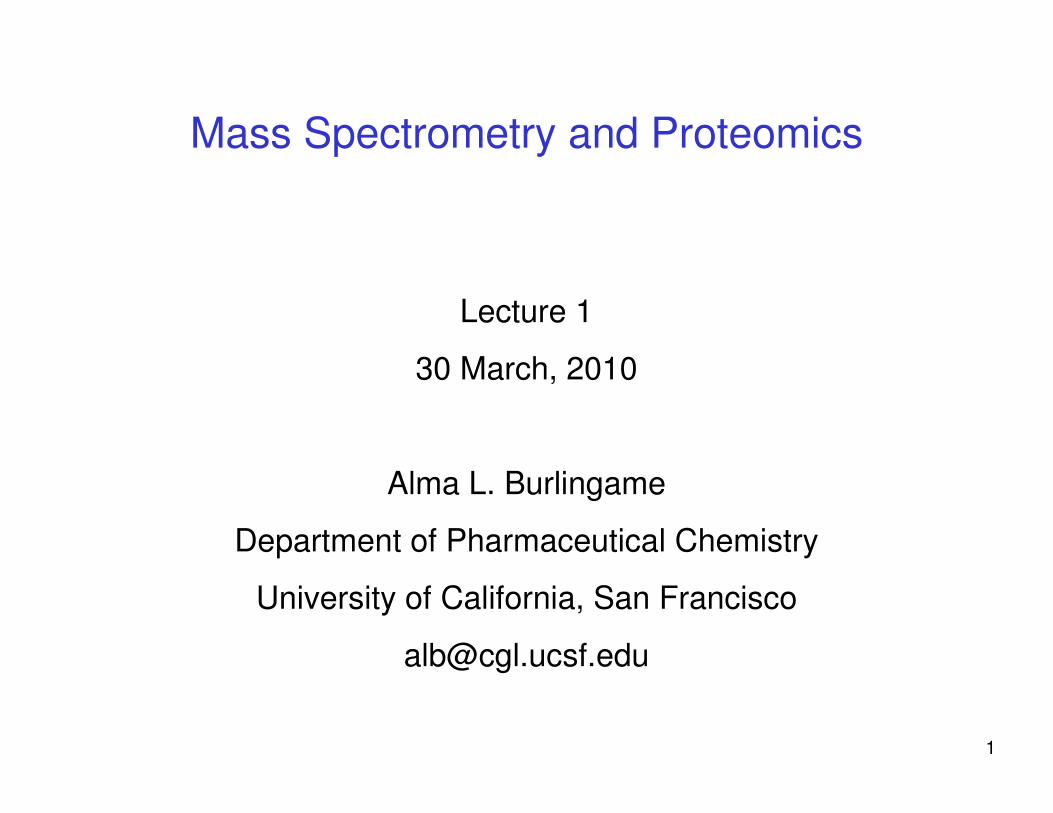
What is Mass Spectrometry?IUPAC Definition: The branch of science dealing with all aspects of mass
spectrometers and the results obtained with these instruments.
My Definition: An analytical instrument that measures the mass-to-charge ratio of charged particles.
Applications:
1. identification
2. Quantification
3. Molecular structure
4. higher-order structure (H/D exchange, cross-link)
5. gas-phase ion chemistry
6. tissue imaging

4
What do we use Mass Spectrometry for in this course?
1. Protein identification, either by direct protein analysis, or by digesting the protein into smaller pieces (peptides), then identifying the peptides.
• Complex mixture; e.g. cell organelle
• Immunoprecipitation of protein of interest
• ID binding partners
2. Identification of post-translational modifications:e.g. phosphorylation, acetylation.
3. Quantifying relative differences in protein/peptide levels between related samples.
4. Quantifying changes in post-translational modifications.
5
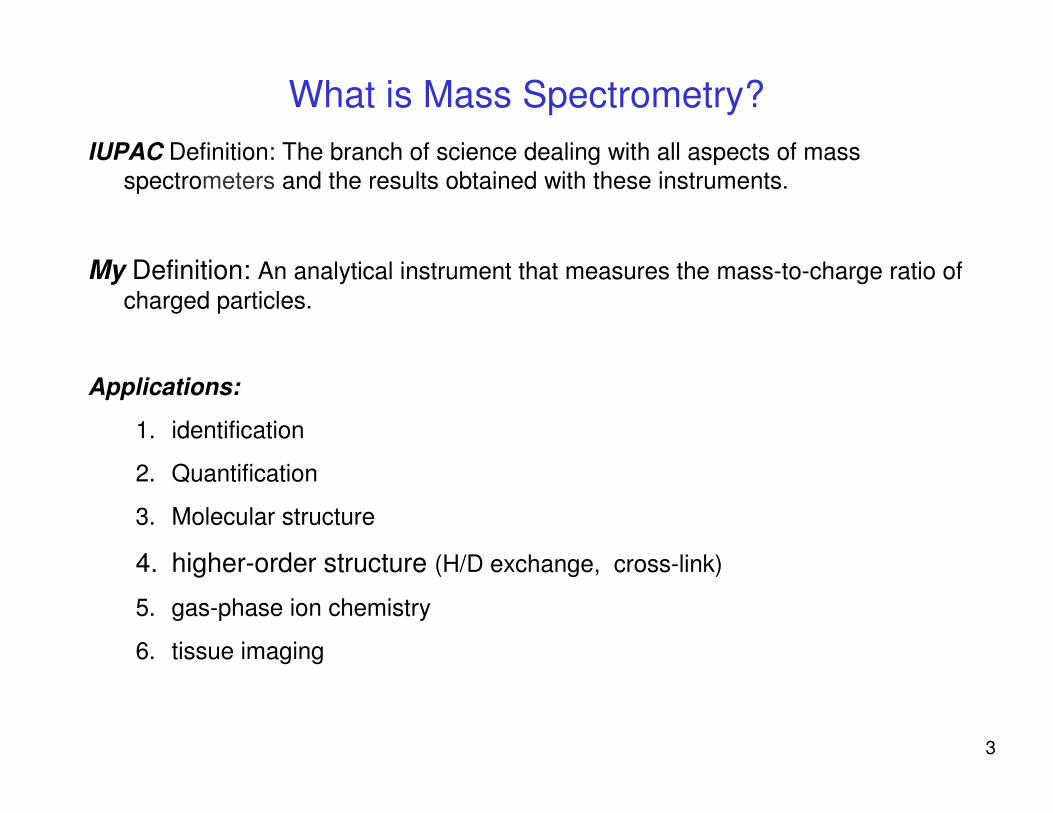
Outline: Lecture 1
• Mass Measurement– Mass definitions– Isotopes– Characteristics of a mass spectrum
• Instrumentation– Ion sources– Fragmentation methods– Mass analyzers– Ion detection methods
6
Isotopes and Mass Measurement

7
.
Mass Definitions
Molecular masses are measured in Daltons (Da) or mass units (u).
One Dalton = 1/12 of the mass of a 12C atom.
Monoisotopic mass = sum of the exact masses of the most abundant isotope of each element present, i.e., 1H=1.007825, 12C=12.000000, 16O=15.994915, etc.
This is the most accurately defined molecular mass and is preferred if a measurement of it can be determined.
Average mass = sum of the averaged masses (“isotope abundant weighted”) of the constituent elements of a given molecule.
The result is a weighted average over all of the naturally occurring isotopes present in the compound. This is the common chemical molecular weight that is used for stoichiometric calculations (H=1.0080, C=12.011, O=15.994, etc.). The average mass cannot be determined as accurately as the monoisotopic mass because of variations in natural isotopic abundances.
The mass to charge ratio (m/z). A quantity formed by dividing the mass (in u) of an ion by its charge number; unit: Thomson or Th.

8
Isotopic Abundances of Common Elements
By coincidence, the most abundant isotope of common elements has the lowest mass.
Isotope NaturalAbundance
1H 1.0078 99.99%2H 2.0141 0.01512C 12 98.8913C 13.0034 1.1114N 14.0031 99.6415N 15.0001 0.3616O 15.9949 99.7617O 16.9991 0.0418O 17.9992 0.2
P 31P 30.9737 10032S 31.9721 9533S 32.9715 0.7634S 33.9679 4.2236S 35.9671 0.02
N
O
S
Element Mass
H
C
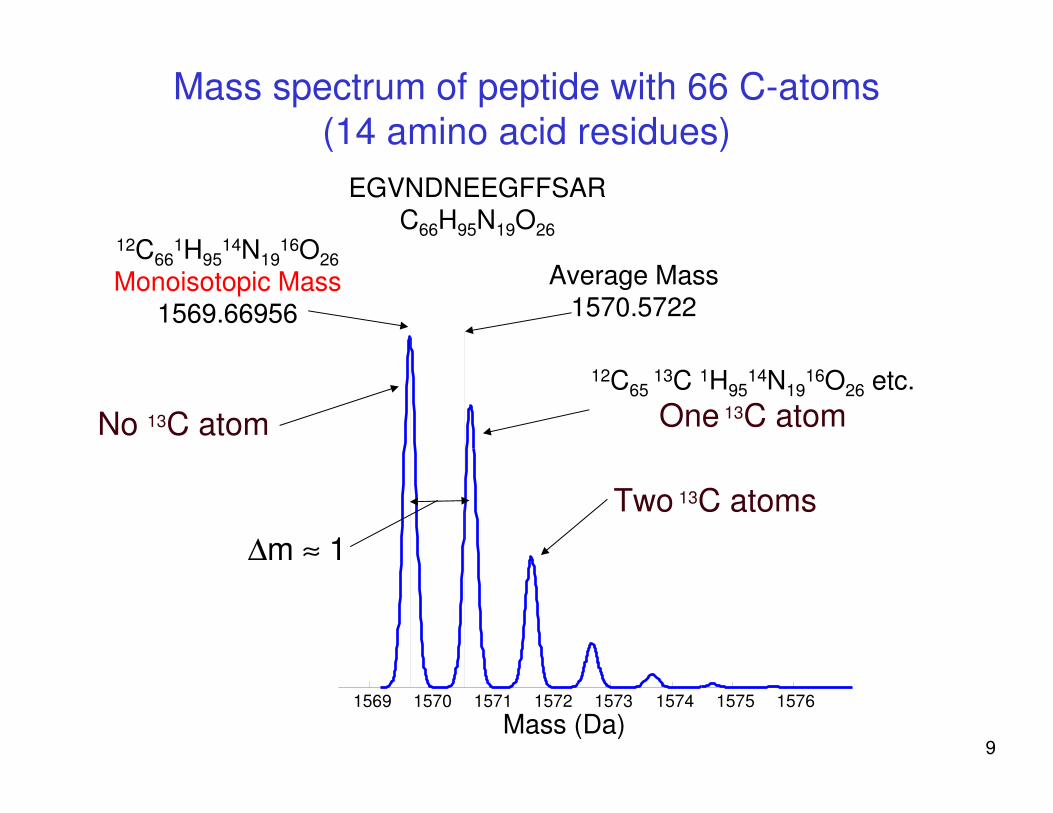
9Mass (Da)
12C661H95
14N1916O26
Monoisotopic Mass1569.66956
Average Mass1570.5722
1569 1570 1571 1572 1573 1574 1575 1576
EGVNDNEEGFFSARC66H95N19O26
No 13C atom
12C65 13C 1H95
14N1916O26 etc.
One 13C atom
Two 13C atoms
Mass spectrum of peptide with 66 C-atoms (14 amino acid residues)
∆m ≈ 1

10
1000 2000 3000 4000 5000 6000
5730 3655 3660 2465 2095 1295
As the number of C-atoms in the molecule increases, the peaks due to higher mass isotopes increase in relative abundance. Data are for a series of peptides.
Isotope Pattern Changes with Mass
m/z
11
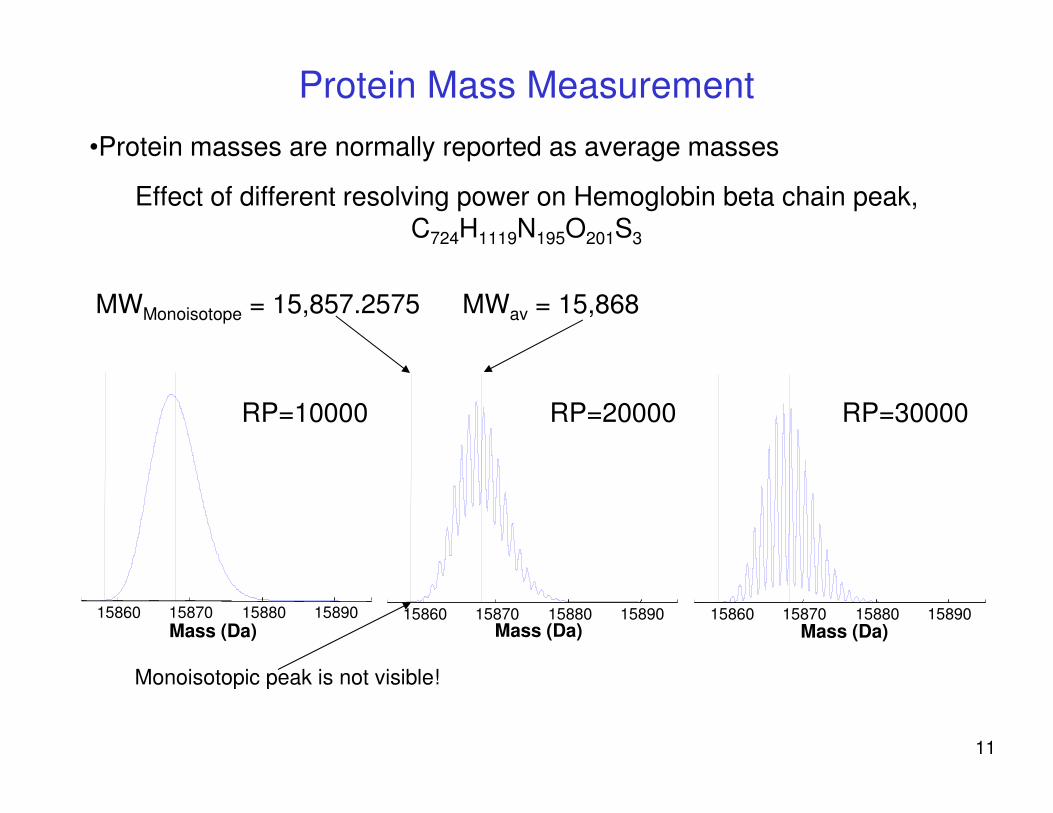
Protein Mass Measurement
Effect of different resolving power on Hemoglobin beta chain peak, C724H1119N195O201S3
•Protein masses are normally reported as average masses
15860 15870 15880 15890 15860 15870 15880 1589015860 15870 15880 15890
RP=10000 RP=20000 RP=30000
Monoisotopic peak is not visible!
MWMonoisotope = 15,857.2575 MWav = 15,868
Mass (Da) Mass (Da) Mass (Da)

12
Information from MS Resolution
A.G. Marshall
13
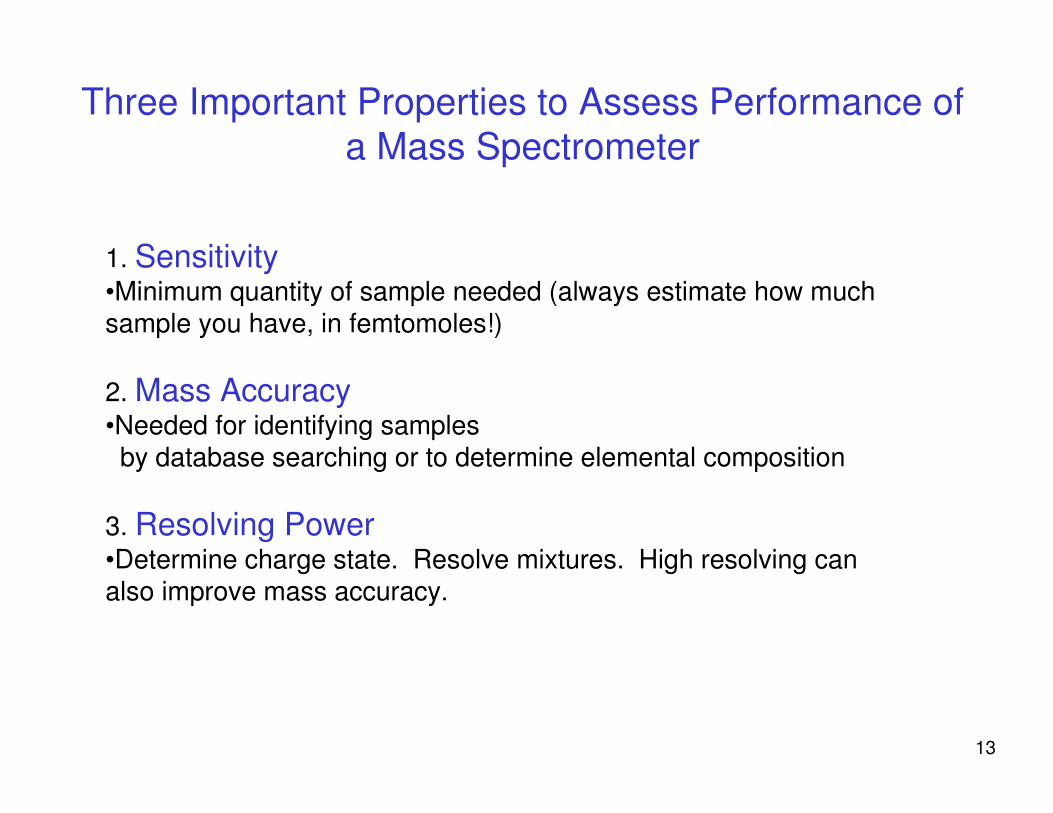
Three Important Properties to Assess Performance of a Mass Spectrometer
1. Sensitivity•Minimum quantity of sample needed (always estimate how much sample you have, in femtomoles!)
2. Mass Accuracy•Needed for identifying samplesby database searching or to determine elemental composition
3. Resolving Power•Determine charge state. Resolve mixtures. High resolving can also improve mass accuracy.

14
Peptide Mass Measurement
Monoisotopic (neutral) mass, M of peptide can be calculated from measuredmonoisotopic mass-to-charge ratio (m/z) and charge state (z) of protonated ion
784 786 788784 786 788 784 786 788784 786 788
RP=3200
m/zm/zm/zm/z
RP=1600RP=800RP=400
m/z: 785.838 785.782 785.853 785.853
M: 1569.661 1569.549 1569.720 1569.720
zMzzmMprotonicmonoisotopicmonoisotop
×−×= )/( , Mproton=1.007276

15
Mass (Measurement) Accuracy
Mass Accuracy or Mass Measurement Error is the difference between the experimental mass (Mexp) and the theoretical value (Mtheo), calculated from elemental composition.
In absolute term, , in Da or milli-Da
In relative term, , unit-less (ppm for high resolution MS)
Example:
Mexp = 1569.684Mtheo= 1569.66956
Mass Measurement Error = 0.014Da or 9.2ppm
theo
theo
M
MMMA
−= exp
theoMMMA −=
exp
http://physics.nist.gov/PhysRefData/Elements/per_noframes.html
16
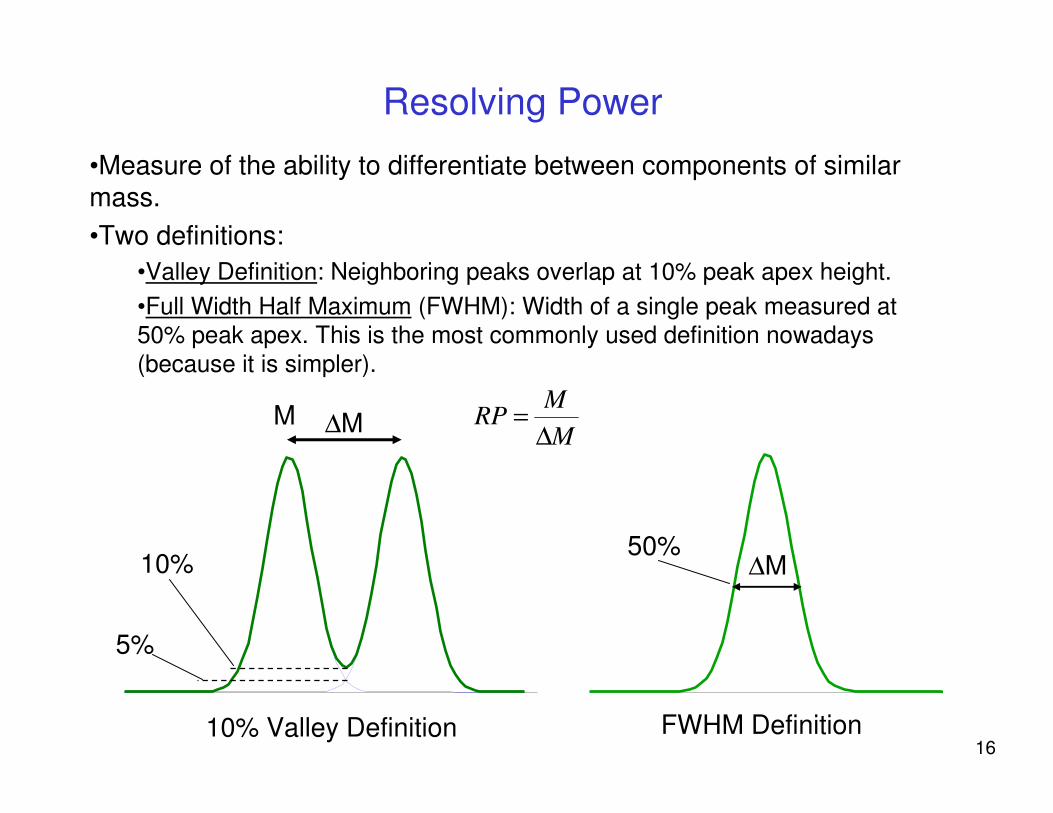
Resolving Power
•Measure of the ability to differentiate between components of similar mass.•Two definitions:
•Valley Definition: Neighboring peaks overlap at 10% peak apex height.•Full Width Half Maximum (FWHM): Width of a single peak measured at 50% peak apex. This is the most commonly used definition nowadays (because it is simpler).
M
MRP
∆=∆MM
5%
10%50%
∆M
10% Valley Definition FWHM Definition

17
Resolution vs Resolving Power
Resolution (Mass) – The smallest mass difference (∆M) between two equal magnitude peaks such that the valley between them is a specified fraction of the peak height.
-IUPAC definition
For most people in the field, mass resolution and mass resolving power are used interchangeably.
18
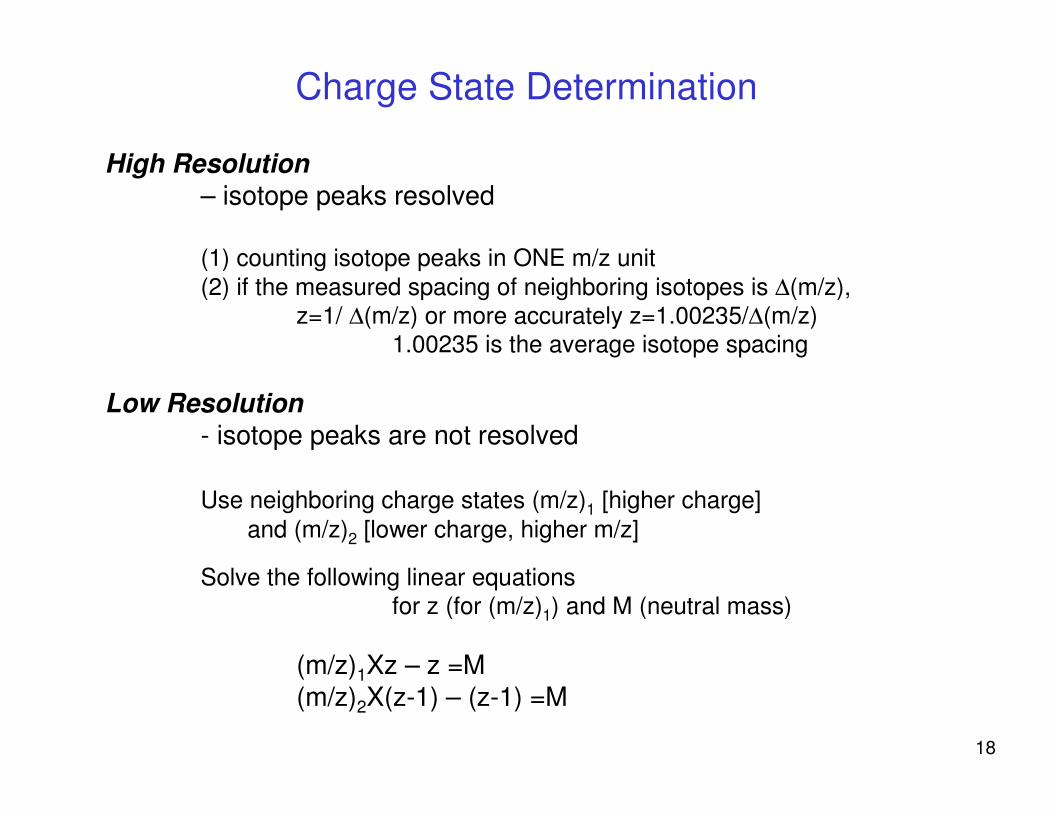
Charge State Determination
High Resolution– isotope peaks resolved
(1) counting isotope peaks in ONE m/z unit(2) if the measured spacing of neighboring isotopes is ∆(m/z),
z=1/ ∆(m/z) or more accurately z=1.00235/∆(m/z) 1.00235 is the average isotope spacing
Low Resolution- isotope peaks are not resolved
Use neighboring charge states (m/z)1 [higher charge] and (m/z)2 [lower charge, higher m/z]
Solve the following linear equations for z (for (m/z)1) and M (neutral mass)
(m/z)1Xz – z =M(m/z)2X(z-1) – (z-1) =M

19
Electrospray Mass Spectrum of Bovine Ubiquitin
700 800 900 1000 1100m/z
779.44+11
856.9681
857.47+10
952.63+9
714.72+12
659.75+13
857 858
+0.1
+0.2
+0.3
+0.4+0.5
+0.6
+0.7
+0.9+0.8
+1.0
Mtheo=8559.6112Mexp =8559.603
Z=+10
858.5857.5

20
Instrumentation

21
Data
System
Mass
spectrumout
Inlet
System
Mass
Analyzer
Ion
SourceDetector
Vacuum envelope
Sample
in
Inlet systems: •HPLC•Simple vacuum lock
Ion sources:
Mass analyzers:
•Electrospray (ESI)
•MALDI
•Time-of-flight (TOF)
•Quadrupole
•Ion trap
•FT-ICR
•Orbitrap
Mass Spectrometer Schematic
22
Ion sources
MALDI & ESI

23
Sinapinic acid α-cyano-4-hydroxycinnamic acid (CHCA) 2,5-dihydroxybenzoic acid (DHB)HO
COOH
OHCH3O
CH3O
HO CH=CH-COOH HO CH=C-COOH
CN
•Analyte is dissolved in solution with excess matrix (>104).
•Sample/matrix mixture is dried on a target and placed in the MS vacuum.
Requirements for a satisfactory matrix:
•It must co-crystallize with typical analyte molecules
•It must absorb radiation at the wavelength of the laser (usually 337 nm)
•To transfer protons to the analyte it should be acidic
Typical successful matrices for UV MALDI are aromatic carboxylic acids.
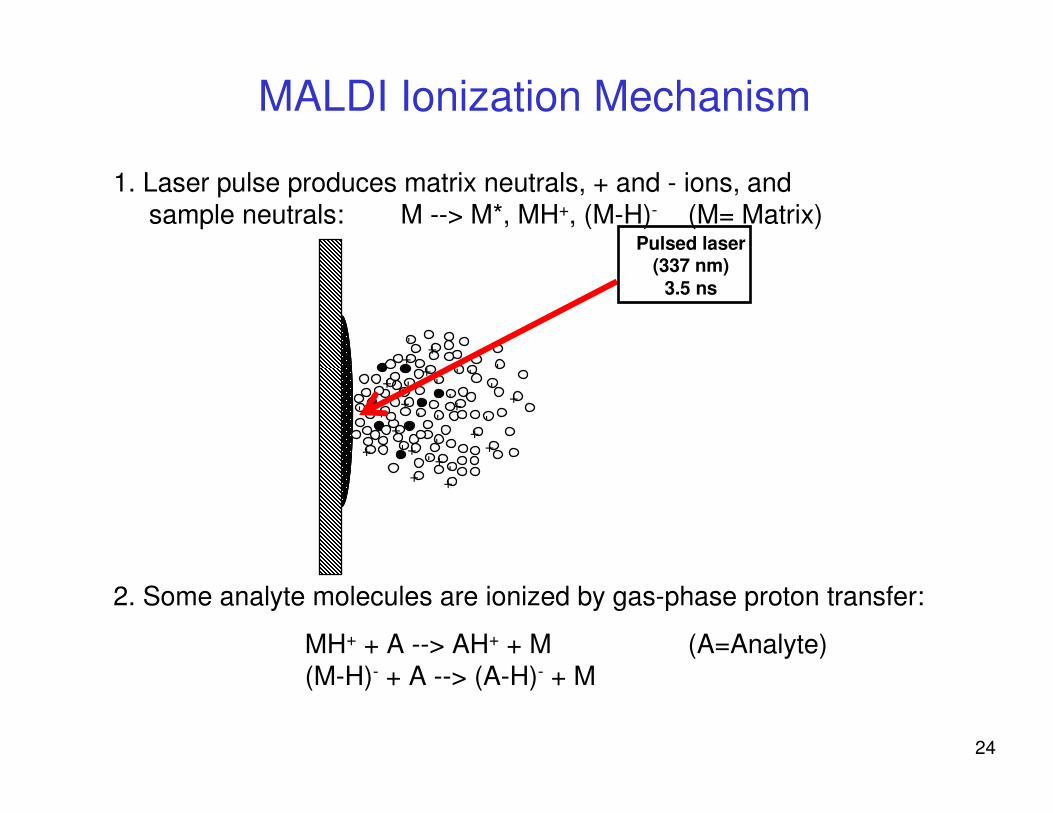
Matrix-Assisted Laser Desorption/Ionization (MALDI)
24
-
+-
++
++
--
--
--
-
--
--
-
-
- ++ +
+ +
+
++
+
++
1. Laser pulse produces matrix neutrals, + and - ions, and sample neutrals: M --> M*, MH+, (M-H)- (M= Matrix)
2. Some analyte molecules are ionized by gas-phase proton transfer:
MH+ + A --> AH+ + M (A=Analyte)(M-H)- + A --> (A-H)- + M
MALDI Ionization Mechanism
Pulsed laser (337 nm)
3.5 ns

25
MALDI Mass Spectrum of Protein Tryptic Digest
m/z
26
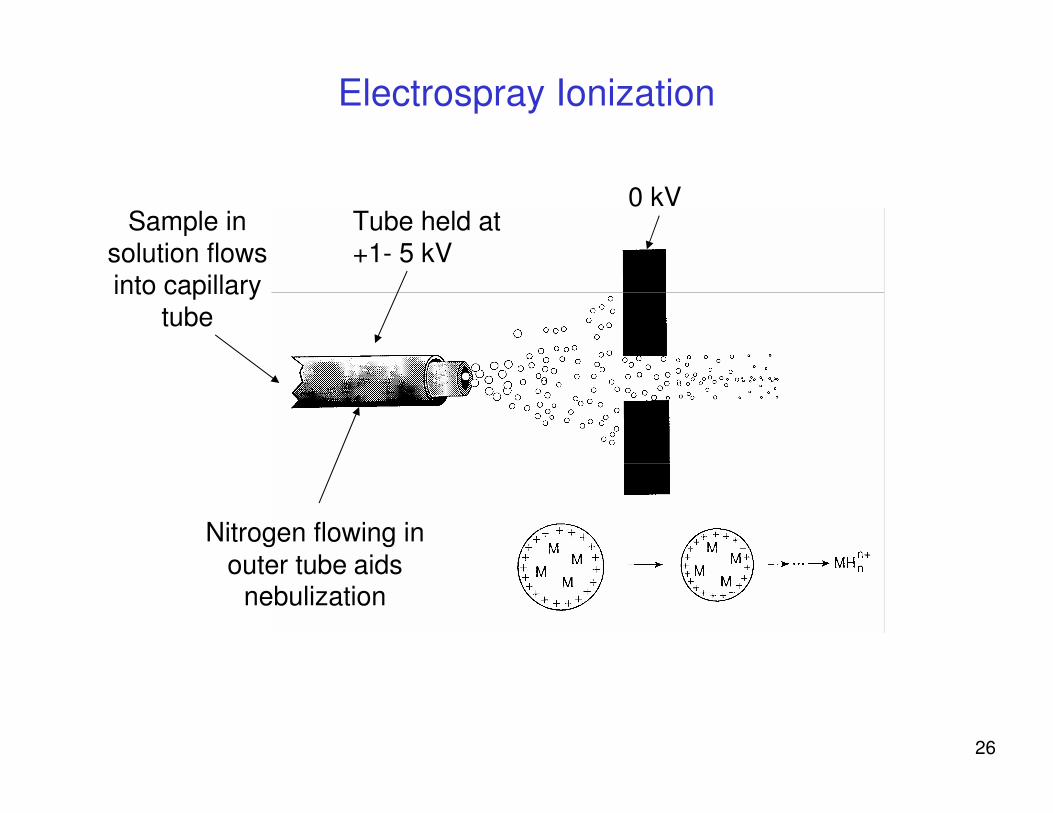
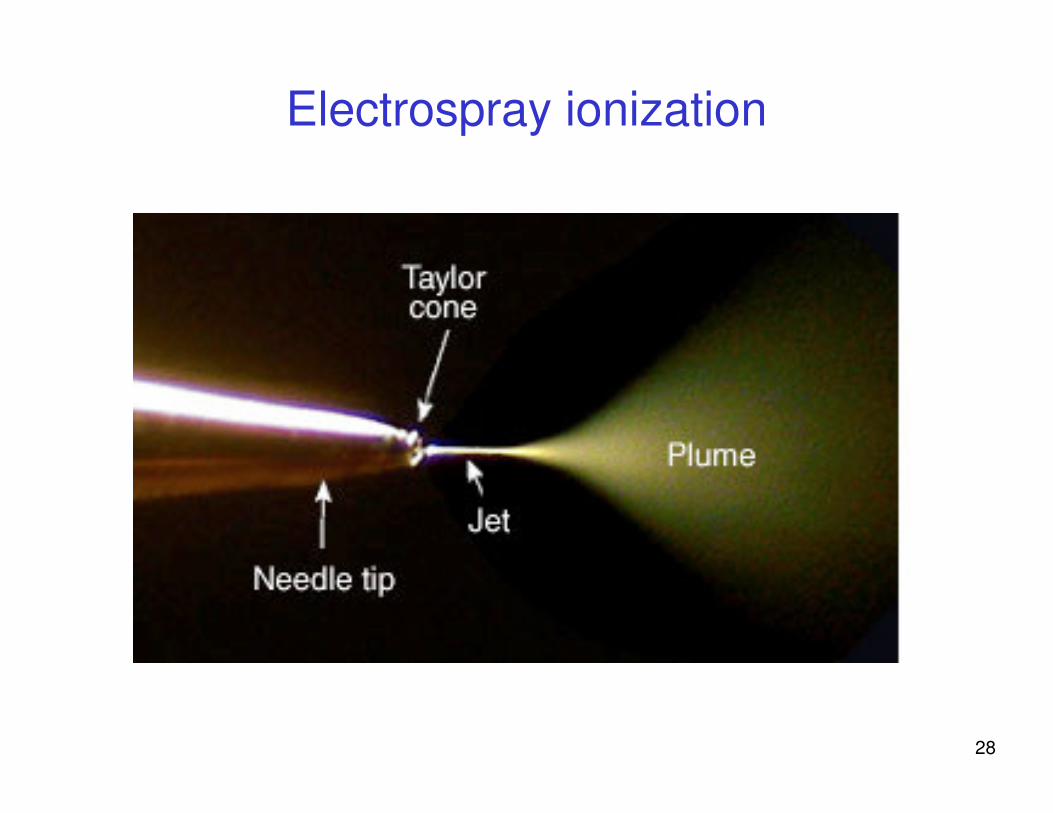
Electrospray Ionization
Sample in solution flows into capillary
tube
Nitrogen flowing in outer tube aids
nebulization
Tube held at +1- 5 kV
0 kV
27
++
++
+
+
++
+ +++
++
+ +++ +
++
+++
+++
++
+
+
++
++
+
+++
+++
+++
MH+
[M+2H]2+
[M+3H]3+
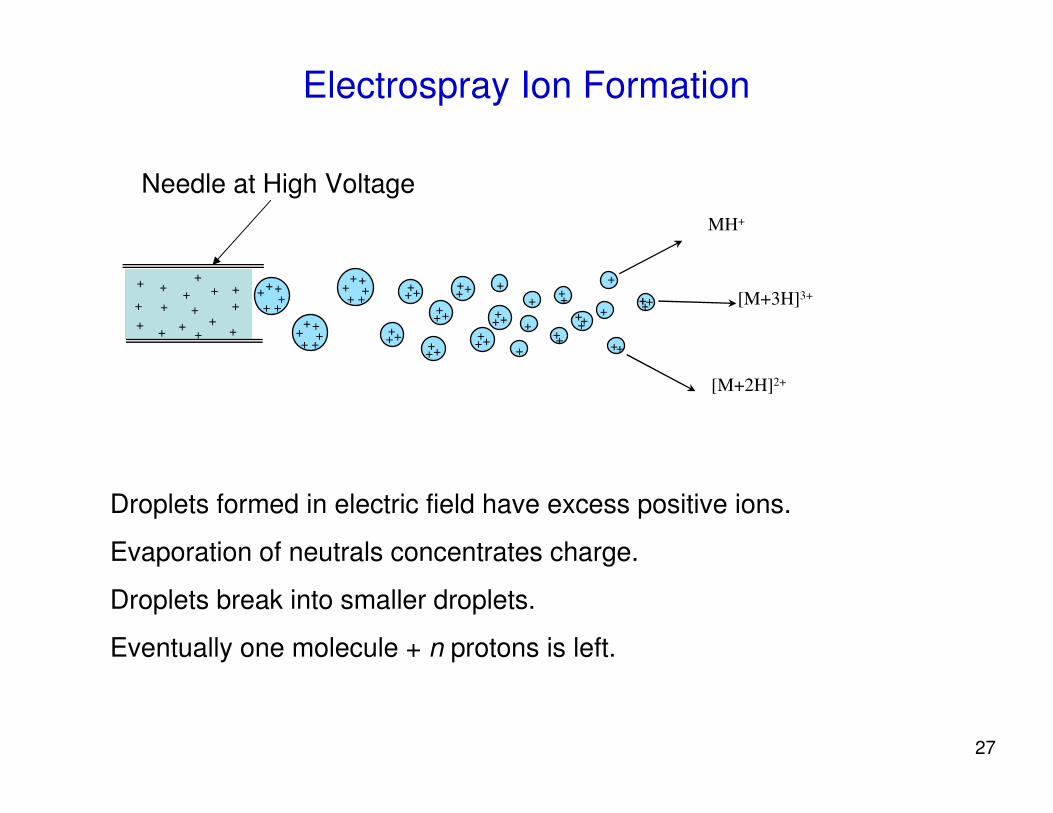
Electrospray Ion Formation
Droplets formed in electric field have excess positive ions.
Evaporation of neutrals concentrates charge.
Droplets break into smaller droplets.
Eventually one molecule + n protons is left.
+
+
+
++++++
++++
Needle at High Voltage
+
+
+++
+++ +
++
+ +++
+
28
Electrospray ionization
29
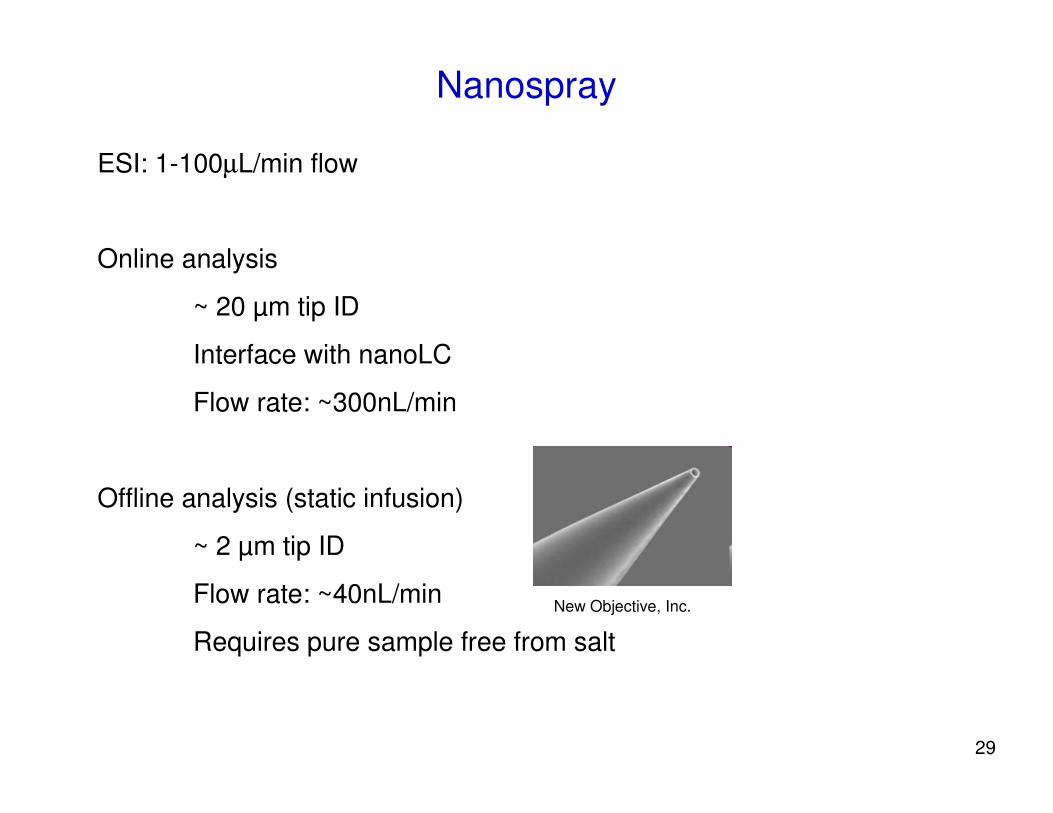
Nanospray
ESI: 1-100µL/min flow
Online analysis
~ 20 µm tip ID
Interface with nanoLC
Flow rate: ~300nL/min
Offline analysis (static infusion)
~ 2 µm tip ID
Flow rate: ~40nL/min
Requires pure sample free from salt
New Objective, Inc.
30
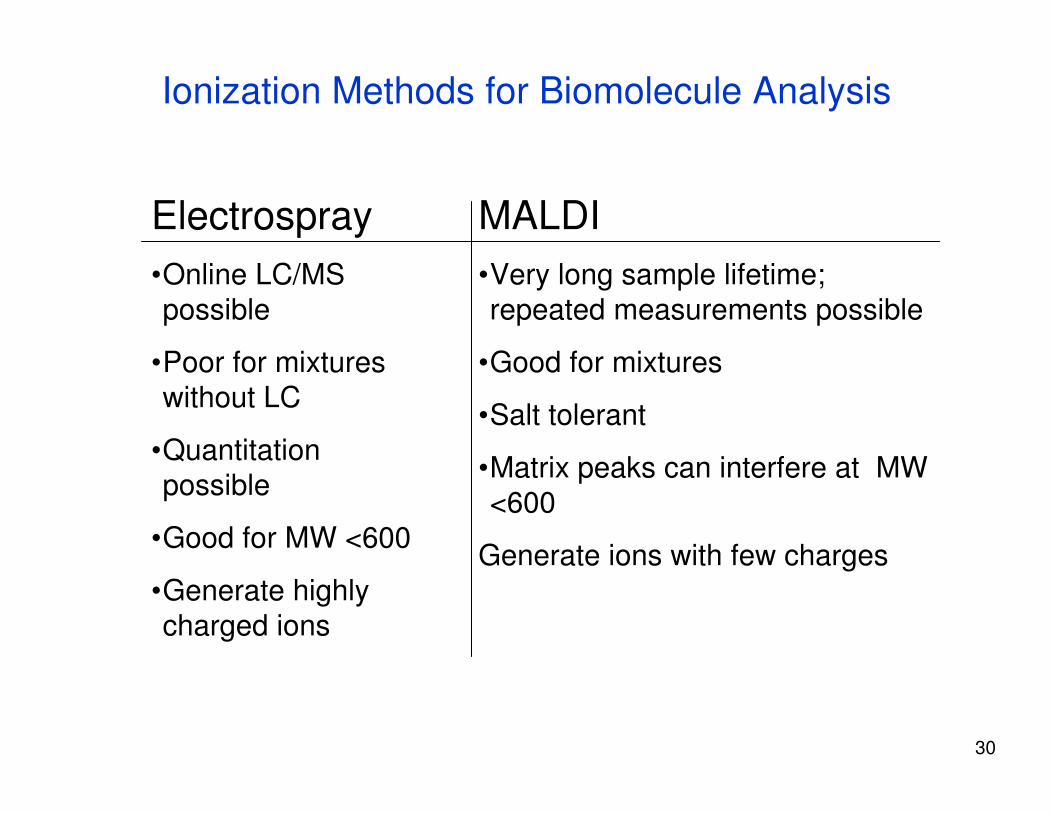
Ionization Methods for Biomolecule Analysis
MALDI•Very long sample lifetime; repeated measurements possible
•Good for mixtures
•Salt tolerant
•Matrix peaks can interfere at MW <600
Generate ions with few charges
Electrospray•Online LC/MS possible
•Poor for mixtures without LC
•Quantitation possible
•Good for MW <600
•Generate highly charged ions

31
Mass analyzers
TOFQuadruploe
Ion Trap
FTICROrbitrap

32
Ion Optics
Einzel lens modeled with SIMION ion optics simulation program (computing electric and magnetic fields and ion trajectories)
http://simion.com/
A device for manipulating ion beams. A mass spectrometer consists of many ion optical components

33
+
+
+
+
Source Drift region (flight tube)
dete
ctor
V
•Ions formed in pulses.
•Measures time for ions to reach the detector.
Time-of-Flight (TOF) Mass Analyzer
2
22
L
Vtzm = or zmt ∝

34
Linear and Reflector TOF Analyzers
Reflector compensates for initial variation in kinetic energy, improving resolving power and mass accuracy.

35
Uses a combination of RF and DC voltages to operate as a mass filter.
•Mass analyzer.•Mass selection device•Ion transport device (RF-only collision cell).
Quadrupole Mass Analyzer/Filter
+ U + V cos ωt
-U - V cos ωt
Randall E. PedderExtrel Application Note
Mass scan and stability diagram
36
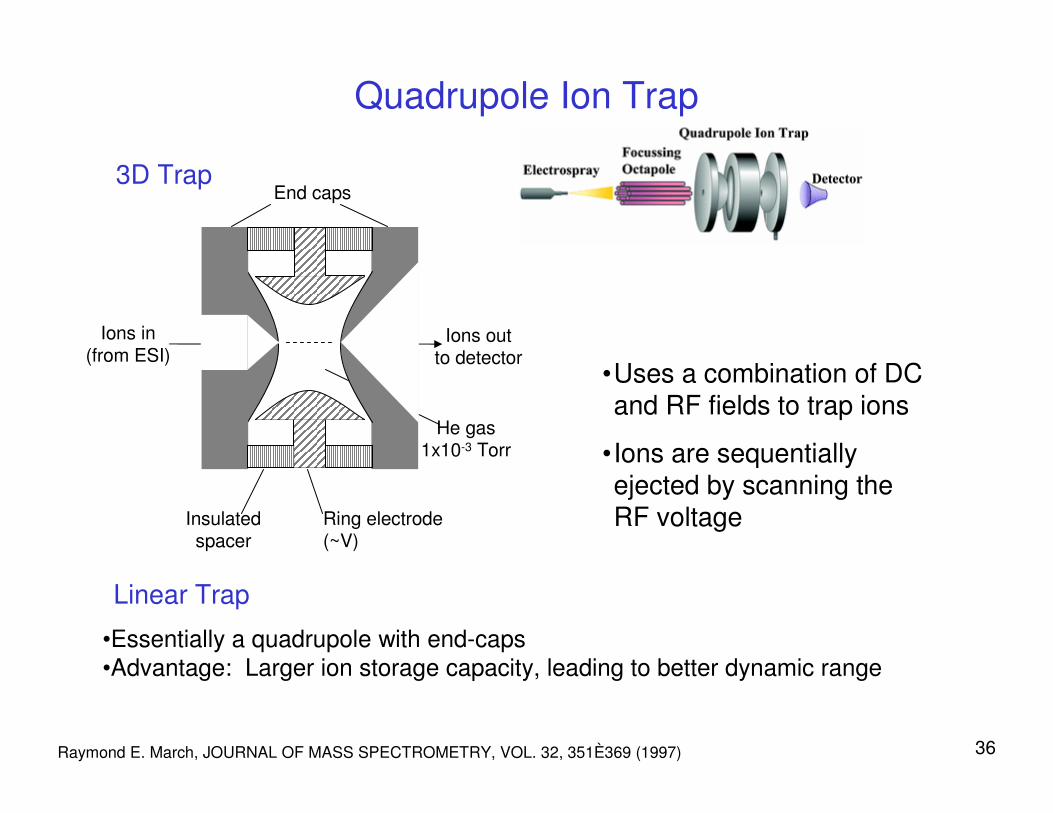
Quadrupole Ion Trap
•Uses a combination of DC and RF fields to trap ions
•Ions are sequentially ejected by scanning the RF voltage
Linear Trap
•Essentially a quadrupole with end-caps•Advantage: Larger ion storage capacity, leading to better dynamic range
Ions in(from ESI)
3D TrapEnd caps
Ions outto detector
Ring electrode (~V)
Insulated spacer
He gas1x10-3 Torr
Raymond E. March, JOURNAL OF MASS SPECTROMETRY, VOL. 32, 351È369 (1997)
37
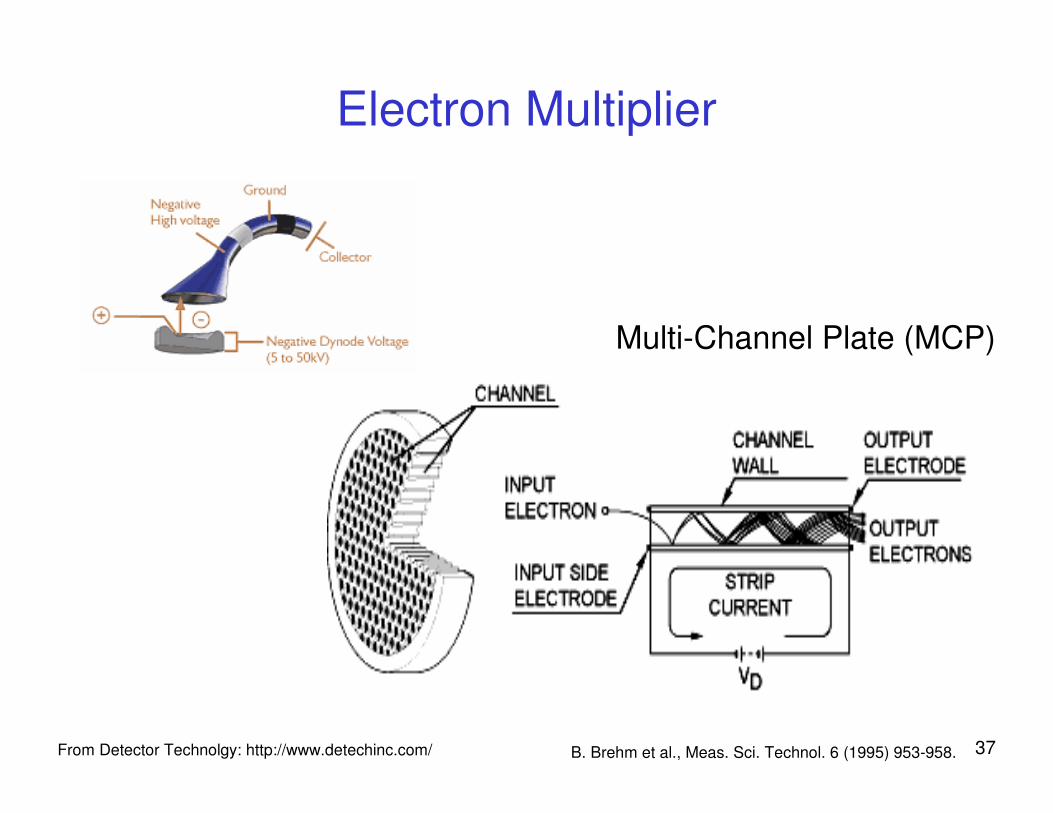
Electron Multiplier
From Detector Technolgy: http://www.detechinc.com/ B. Brehm et al., Meas. Sci. Technol. 6 (1995) 953-958.
Multi-Channel Plate (MCP)
38
B0
Detect++
++
+++
+
+
R C
Excite
+++ + ++
+++
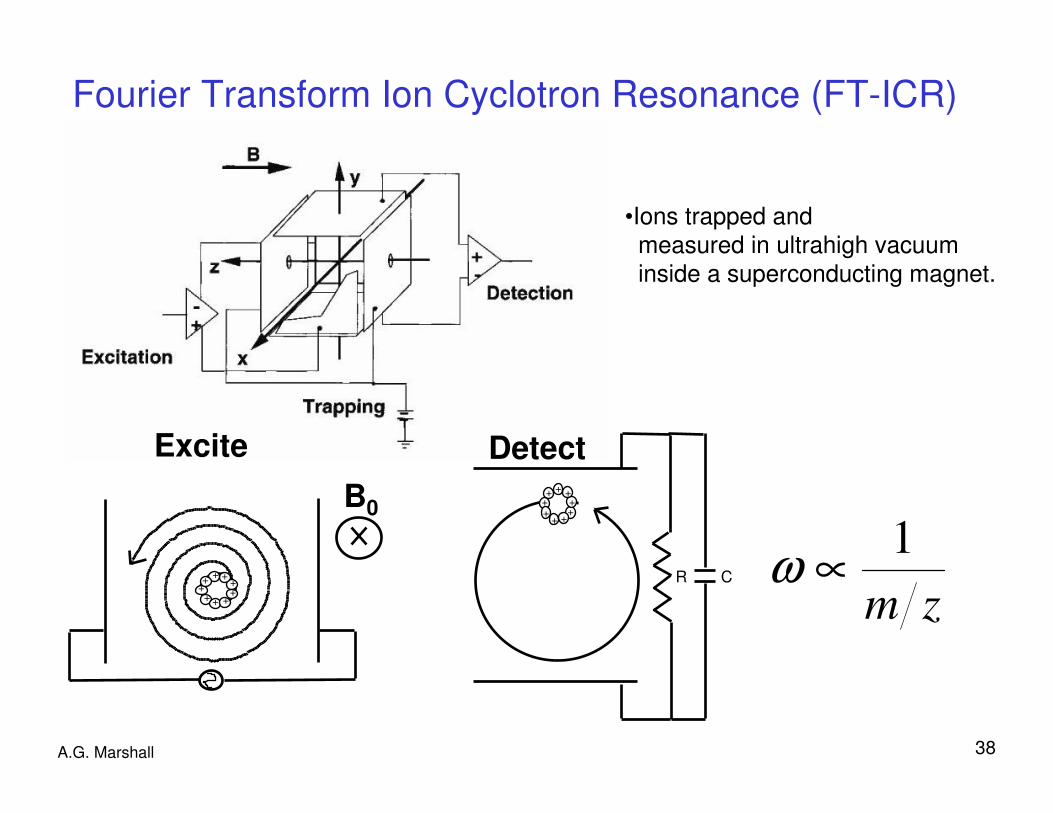
Fourier Transform Ion Cyclotron Resonance (FT-ICR)
•Ions trapped and measured in ultrahigh vacuuminside a superconducting magnet.
A.G. Marshall
zm
1∝ω

39
Differential
Amplifier
FT
100 150 200 250
Frequency (kHz)
7+
8+
10+
11+
12+
9+
600 1000 1400 1800
12+
11+
10+
9+
8+
7+
m/z
Calibration
0
80 240 400
Time (ms)
Image
Current
Bovine
Ubiquitin
10721071
Fourier Transform Ion Detection
A.G. Marshall
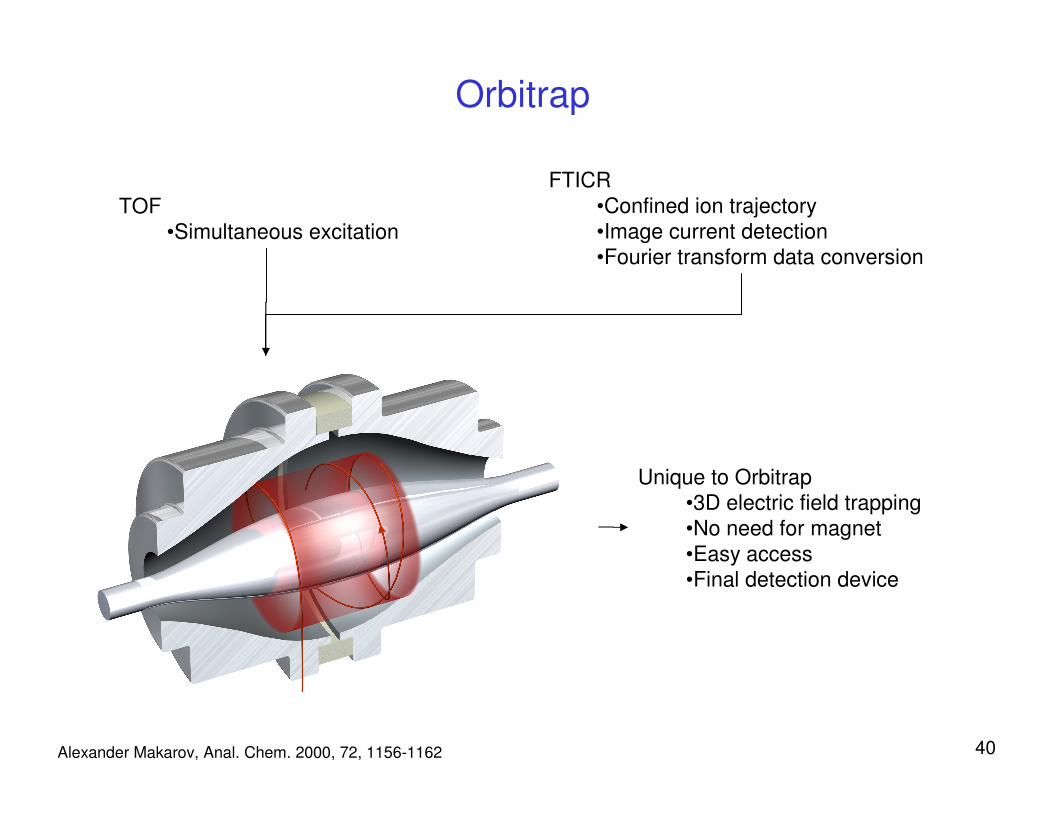
40Alexander Makarov, Anal. Chem. 2000, 72, 1156-1162
Orbitrap
TOF•Simultaneous excitation
FTICR•Confined ion trajectory•Image current detection•Fourier transform data conversion
Unique to Orbitrap•3D electric field trapping•No need for magnet•Easy access•Final detection device
41
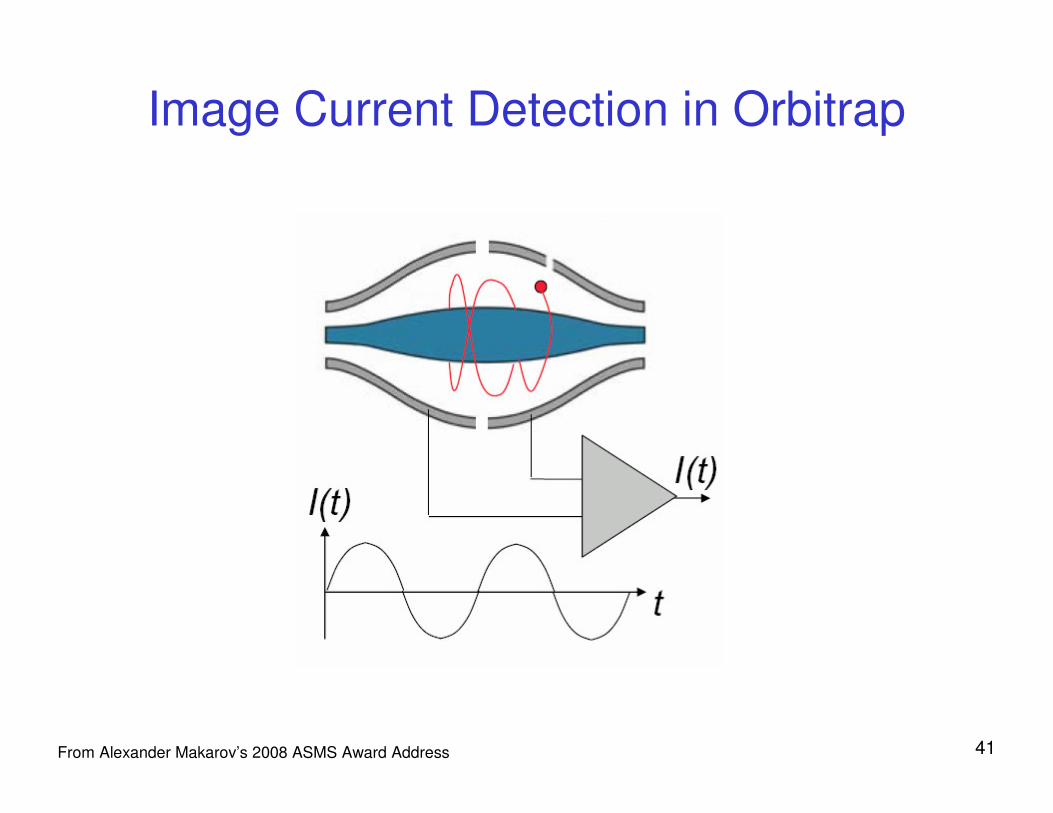
Image Current Detection in Orbitrap
From Alexander Makarov’s 2008 ASMS Award Address
42
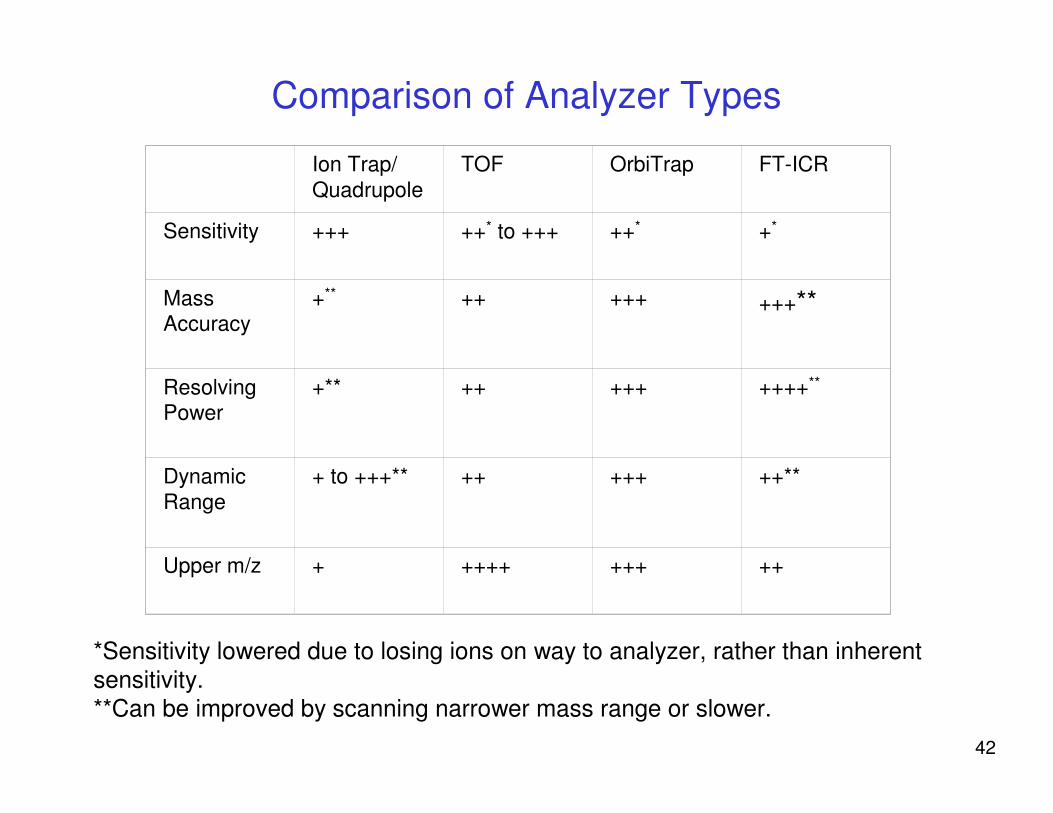
Comparison of Analyzer Types
Ion Trap/Quadrupole
TOF OrbiTrap FT-ICR
Sensitivity +++ ++* to +++ ++* +*
Mass Accuracy
+** ++ +++ +++**
Resolving Power
+** ++ +++ ++++**
Dynamic Range
+ to +++** ++ +++ ++**
Upper m/z + ++++ +++ ++
*Sensitivity lowered due to losing ions on way to analyzer, rather than inherent sensitivity.**Can be improved by scanning narrower mass range or slower.

43
Hybrid/Tandem Instruments
•Combine (1) ion selection, (2) ion dissociation, and (3) mass analyzer devices
•Quadrupoles and ion traps good for selective isolation of precursor ions and for fragmentation (required for MSMS - Topic of Lecture 2)
•Reflectron TOF, FT-ICR, and OrbiTrap have higher mass accuracy and resolving power (high mass accuracy is good for identification – Lecture 4)

44
Ion Isolation
•QuadupoleContinuous ion beam
•Quadrupole ion trapPulsed-mode operation; space charge issue
•SWIFT in FTICRUltrahigh selectivity; only works well in ICR traps
•TOFOnly implemented on TOF/TOF
45
Ion Dissociation
•Collision Induced Dissociation (CID or Collision Activated Dissociation (CAD)
ion traps: off-resonance excitationrf-only multi-poles: higher kinetic energy (HCD) and cascaded CIDTOF/TOF: single collision
•Electron capture dissociation (ECD) and Electron transfer dissociation (ETD)
ECD: FTICR, reagent: electronETD: ion traps, reagent: free radical anion
Other important factors to consider: how product ions are collected and detected

46JBiomolTechniques2005v16p83
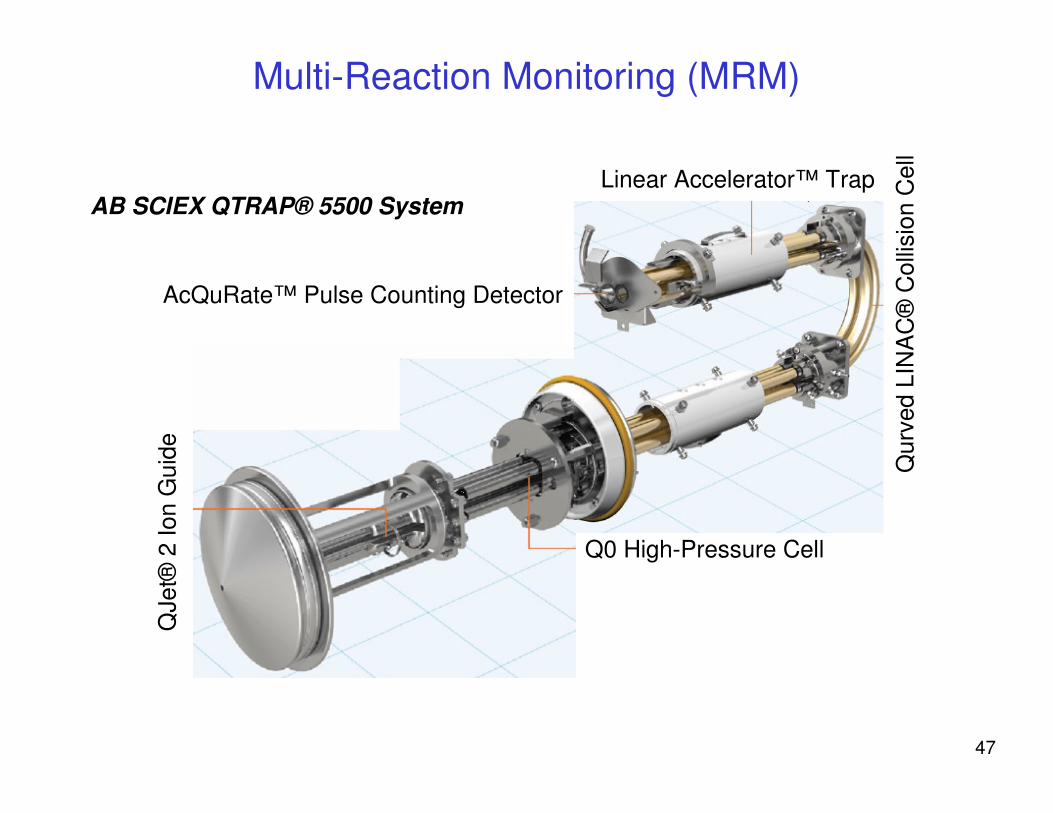
Multi-Reaction Monitoring (MRM)
47
Multi-Reaction Monitoring (MRM)
Linear Accelerator™ Trap
Qur
ved
LIN
AC
®C
ollis
ion
Cel
l
Q0 High-Pressure Cell
QJe
t®2
Ion
Gui
de
AB SCIEX QTRAP® 5500 System
AcQuRate™ Pulse Counting Detector
48
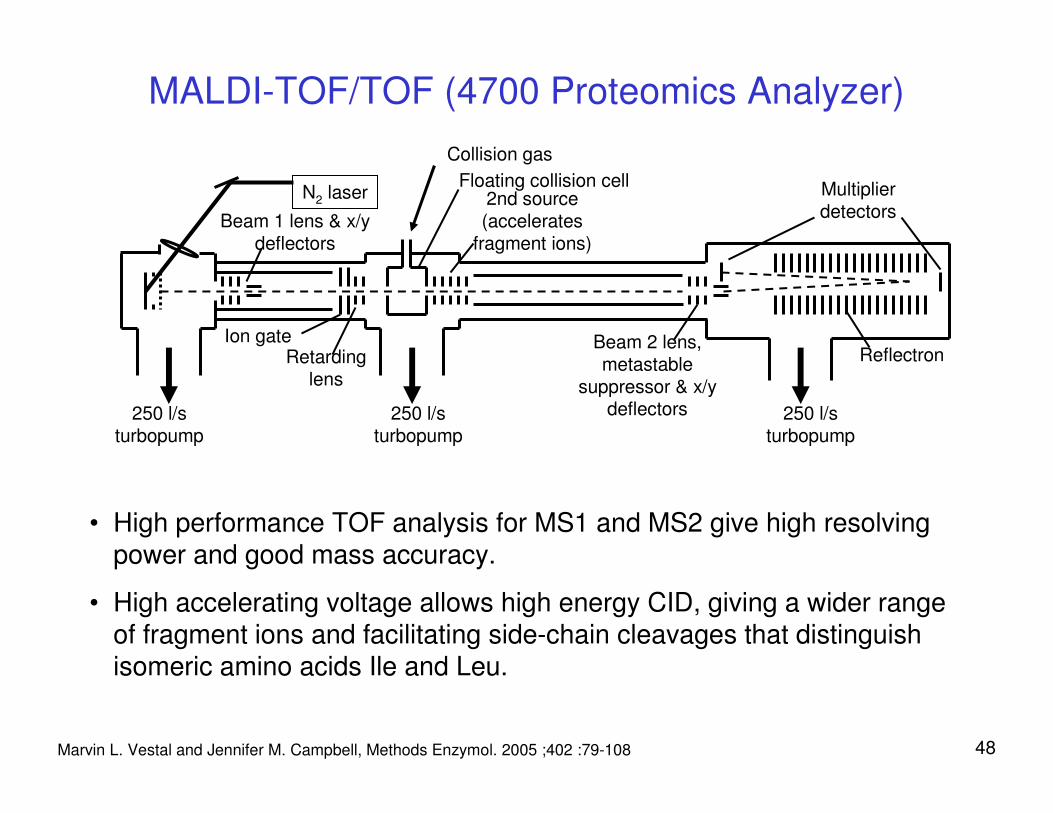
250 l/s turbopump
250 l/s turbopump
250 l/s turbopump
Collision gas
2nd source (accelerates
fragment ions)
Ion gate
Multiplier detectors
Reflectron
Floating collision cellN2 laser
Retarding lens
Beam 1 lens & x/y deflectors
Beam 2 lens, metastable
suppressor & x/y deflectors
MALDI-TOF/TOF (4700 Proteomics Analyzer)
• High performance TOF analysis for MS1 and MS2 give high resolving power and good mass accuracy.
• High accelerating voltage allows high energy CID, giving a wider range of fragment ions and facilitating side-chain cleavages that distinguish isomeric amino acids Ile and Leu.
Marvin L. Vestal and Jennifer M. Campbell, Methods Enzymol. 2005 ;402 :79-108
49
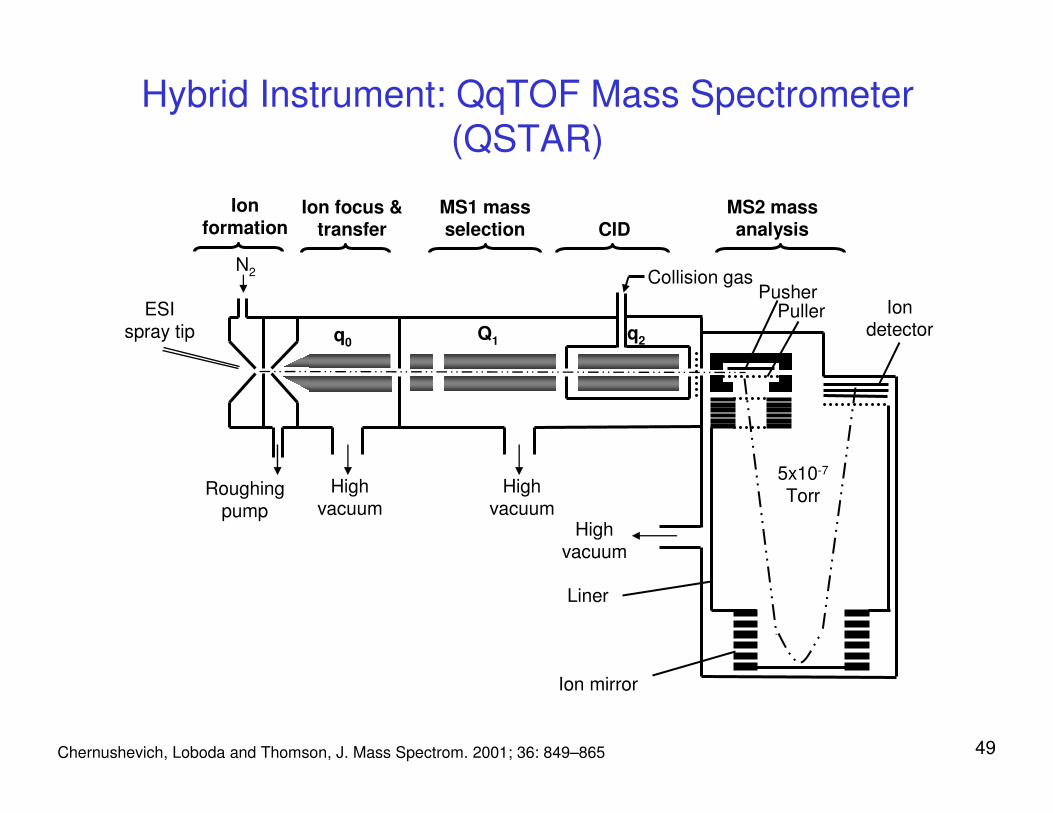
5x10⁻⁷
Torr
Liner
Ion mirror
Ion detector
PusherPuller
Q1 q2
MS1 mass selection CID
Ion focus & transfer
q0
N2
ESIspray tip
Roughing pump
Turbopump
Highvacuum
Highvacuum
Highvacuum
Collision gas
MS2 mass analysis
Ion formation
Hybrid Instrument: QqTOF Mass Spectrometer (QSTAR)
Chernushevich, Loboda and Thomson, J. Mass Spectrom. 2001; 36: 849–865

50
Linear Ion Trap (LTQ) Ion Cyclotron
Linear Ion Trap – FT-ICR (LTQ-FT)
John E. P. Syka, et al, Journal of Proteome Research 2004, 3, 621-62
51
Data Dependent Acquisition
•Data Dependent Scans
MSMS based on intensity ranking of precursor ions
•Dynamic Exclusion
Precursor m/z of previous MSMS are memorized and no MSMS done on them during a defined time period
•Automatic Gain Control (AGC, unique to ion trap)
Control how many ions are scanned – to achieve signal/noise ratio and to minimize space charge effect

52
Scan Sequence of LTQFT
Thermo Application Note: 30046

53
C:\Documents and Settings\...\F9050701 5/7/2009 8:02:10 AM
RT: 0.00 - 58.00
0 5 10 15 20 25 30 35 40 45 50 55
Time (min)
0
50
1000
50
100
Re
lativ
e A
bu
nd
an
ce
46.10
45.5132.81 34.5927.57
36.23 41.6128.63 32.05 46.4526.44 36.9421.61 24.6421.4042.0222.27 46.6618.3317.9110.32 10.699.823.15 4.48 47.672.31 52.76 55.61
45.51
41.0126.44 34.51 41.6127.5721.40 35.0425.56 32.9619.86 39.4724.64 36.23 46.1017.5942.8510.09 10.69 15.829.82 47.673.46 4.48 52.71 54.930.65
NL:7.26E6
TIC M S F9050701
NL:1.14E6Base Peak M S F9050701
F9050701 #2421 RT: 27.65 AV: 1 NL: 2.69E5T: FTMS + p NSI Full ms [310.00-1800.00]
400 500 600 700 800 900 1000 1100 1200 1300 1400 1500 1600 1700 1800
m/z
0
20
40
60
80
100
Re
lativ
e A
bu
nd
an
ce
540.07
621.30505.03
545.03 621.80
463.02 556.06
701.33 1062.11458.23 882.32
629.30
321.17 817.43719.96 1009.05 1596.821083.03 1351.561277.01 1499.601223.87 1653.391420.54 1793.38
F9050701 #2401 RT: 27.43 AV: 1 NL: 9.30E3F: ITMS + c NSI d Full ms2 [email protected] [160.00-1255.00]
200 300 400 500 600 700 800 900 1000 1100 1200
m/z
0
20
40
60
80
100
Re
lativ
e A
bu
nd
an
ce
603.41
487.43
676.32
991.44612.45
566.11 775.37677.44 890.41478.36 490.24251.04 1078.36223.08 776.42 867.10334.13 449.05 996.33375.34 978.21734.17635.20 898.35 1189.391163.51
605 610 615 620 625 630 635 640m/z
621.30
621.80
622.30
629.30
TIC (Total Ion Chromatogram)
Base Peak
Survey Scan
MSMS
LCMSMS on LTQFT

54
Linear Ion Trap - Orbitrap - ETD
AnalChem2006v78p2113
JProteomeRes2008v7p3127
ASMS2006TOBam1035

55
Newest Velos - Orbitrap - ETD
S-lens or ion funnel(MassSpectromRev2010v29p294)
Dual Cell Linear Ion TrapHP cell: ion accumulation and dissociationLP cell: fast detection(ASMS2008WPAA039)
MCP2009v8p2759
56
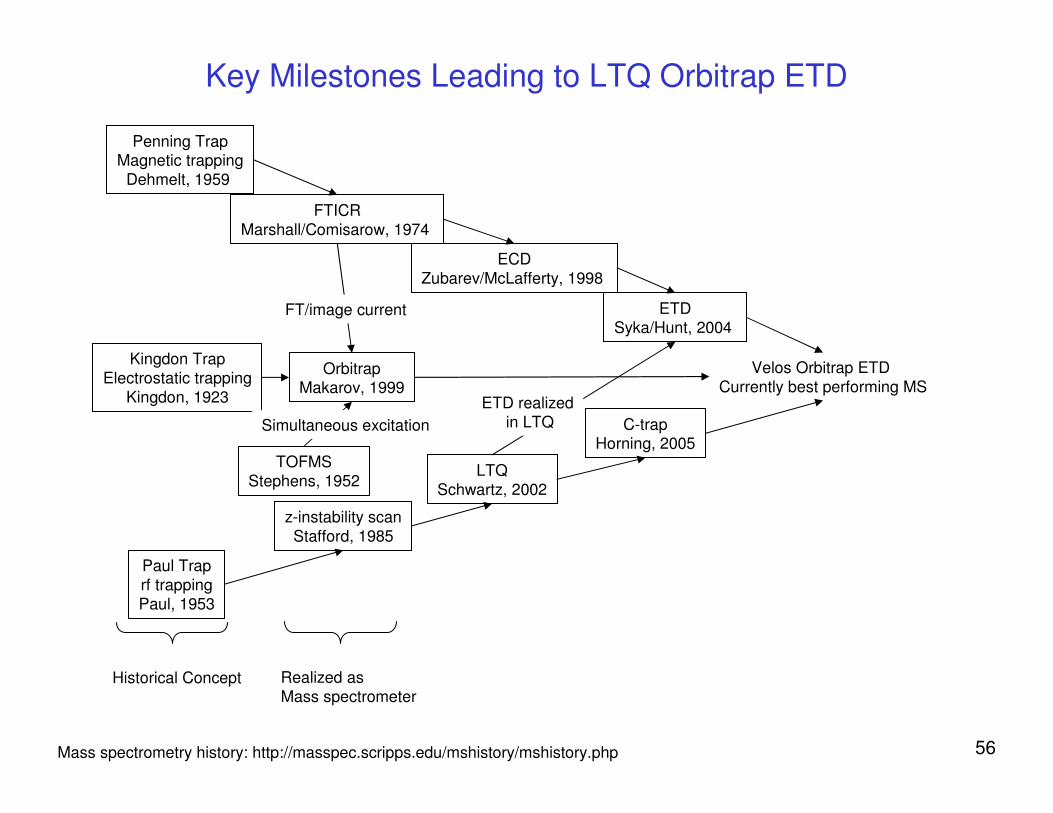
Key Milestones Leading to LTQ Orbitrap ETD
Penning TrapMagnetic trapping
Dehmelt, 1959
FTICRMarshall/Comisarow, 1974
ECDZubarev/McLafferty, 1998
ETDSyka/Hunt, 2004
Kingdon TrapElectrostatic trapping
Kingdon, 1923
Paul Traprf trappingPaul, 1953
z-instability scanStafford, 1985
LTQSchwartz, 2002
OrbitrapMakarov, 1999
C-trapHorning, 2005
Velos Orbitrap ETD Currently best performing MS
Historical Concept Realized asMass spectrometer
FT/image current
ETD realizedin LTQ
TOFMSStephens, 1952
Simultaneous excitation
Mass spectrometry history: http://masspec.scripps.edu/mshistory/mshistory.php
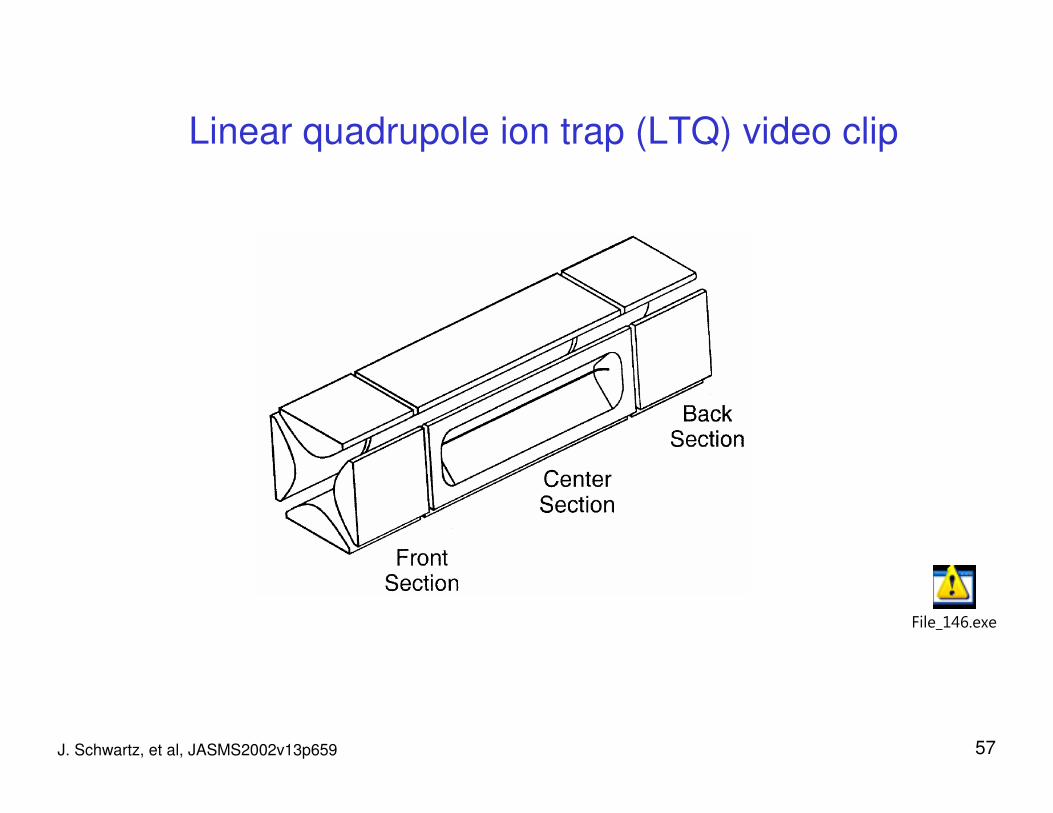
57J. Schwartz, et al, JASMS2002v13p659
Linear quadrupole ion trap (LTQ) video clip
File_146.exe
58
Mass Spectrometry Online Resources
NIH NCRR Mass Spectrometry Facility, UCSF
http://ms-facility.ucsf.edu/
American Society for Mass Spectrometry (ASMS)
http://www.asms.org
Molecular & Cellular Proteomics
http://www.mcponline.org