LECTURE 04C - STATISTICALLY-BASED QUALITY IMPROVEMENT FOR ATTRIBUTES Defects and Defectives; Charts:...
27
LECTURE 04C - STATISTICALLY-BASED QUALITY IMPROVEMENT FOR ATTRIBUTES Defects and Defectives; Charts: p, np, c, u; Selection guide; SJSU Bus. 142 - David Bentley 1
-
Upload
isaac-bates -
Category
Documents
-
view
224 -
download
1
Transcript of LECTURE 04C - STATISTICALLY-BASED QUALITY IMPROVEMENT FOR ATTRIBUTES Defects and Defectives; Charts:...

LECTURE 04C - STATISTICALLY-BASED QUALITY IMPROVEMENT FOR ATTRIBUTES
Defects and Defectives; Charts: p, np, c, u; Selection guide;
SJSU Bus. 142 - David Bentley 1

Topics
SJSU Bus. 142 - David Bentley 2
Generic process for developing attribute charts Understanding attribute charts

Generic process for developing attribute charts – (1)
SJSU Bus. 142 - David Bentley 3
1. Identify Critical Operations2. Identify critical product
characteristics3. Determine whether the product
characteristics is a variable or an attribute

Generic process for developing attribute charts – (2)
SJSU Bus. 142 - David Bentley 4
4. Select the appropriate process chart
5. Establish control limits6. Update the limits when changes
have been made to the process

UNDERSTANDING ATTRIBUTE CHARTS
SJSU Bus. 142 - David Bentley 5

Understanding Attribute Charts
SJSU Bus. 142 - David Bentley 6
Attribute Charts deal with binomial and Poisson processes, not measurements
(Remember: Variable charts deal with normal distributions!)
Think in terms of defects and defectives rather than diameters and widths

Defects
SJSU Bus. 142 - David Bentley 7
A defect is an irregularity or problem with a larger unit.
The larger unit may contain many defects
Defects are countable Example: bent pins on a fluorescent
bulb or pits in painted car door Defects are monitored using c
and u charts

Defectives
SJSU Bus. 142 - David Bentley 8
A defective is a unit that, as a whole, is not acceptable or does not meet performance requirements
Example: fluorescent bulbs which don’t light or the car door
Defectives are monitored using p and np charts

CHARTS FOR DEFECTIVES
Defective units as a whole
SJSU Bus. 142 - David Bentley 9

Proportion or p Charts – (1)
SJSU Bus. 142 - David Bentley 10
A proportion or p chart is a process chart that is used to plot the proportion of items in a sample defective
Also known as fraction nonconforming chart or fraction defective chart or percentage chart
Effective to determine when there has been a shift in the proportion defectives for a particular product or service

Proportion or p Charts – (2)
SJSU Bus. 142 - David Bentley 11
The p chart allows the sample size of each subgroup to be the same or to be different
p chart applications include: Late deliveries Incomplete orders Calls not getting dial tones Accounting transaction errors Parts that do not fit properly

SJSU Bus. 142 - David Bentley 12THE MANAGEMENT AND CONTROL OF QUALITY, 5e, © 2002 South-Western/Thomson LearningTM

SJSU Bus. 142 - David Bentley 13THE MANAGEMENT AND CONTROL OF QUALITY, 5e, © 2002 South-Western/Thomson LearningTM

Number or np Charts
SJSU Bus. 142 - David Bentley 14
The np chart is a graph of the number of defectives in a subgroup
Also known as number nonconforming chart
The np chart requires the sample size of each subgroup be the same
The uses for the np chart are essentially the same as the p chart

SJSU Bus. 142 - David Bentley 15THE MANAGEMENT AND CONTROL OF QUALITY, 5e, © 2002 South-Western/Thomson LearningTM

SJSU Bus. 142 - David Bentley 16THE MANAGEMENT AND CONTROL OF QUALITY, 5e, © 2002 South-Western/Thomson LearningTM

CHARTS FOR DEFECTSCountable non-conformances
SJSU Bus. 142 - David Bentley 17

c Charts
SJSU Bus. 142 - David Bentley 18
The c chart is a graph of the number of defects per unit.
The units must be of the same sample space .. Size, height, length, volume …
Subgroup size is constant (the same) The c chart is used to detect
nonrandom events in the life of a production process

SJSU Bus. 142 - David Bentley 19THE MANAGEMENT AND CONTROL OF QUALITY, 5e, © 2002 South-Western/Thomson LearningTM

SJSU Bus. 142 - David Bentley 20THE MANAGEMENT AND CONTROL OF QUALITY, 5e, © 2002 South-Western/Thomson LearningTM

u Charts
SJSU Bus. 142 - David Bentley 21
The u chart is a graph of the average number of defects per unit.
The units can be of different Sizes, height, length, volume …
Subgroup size is variable (different)

SJSU Bus. 142 - David Bentley 22THE MANAGEMENT AND CONTROL OF QUALITY, 5e, © 2002 South-Western/Thomson LearningTM

SJSU Bus. 142 - David Bentley 23THE MANAGEMENT AND CONTROL OF QUALITY, 5e, © 2002 South-Western/Thomson LearningTM

Summary of Charts for Attributes
• Fraction nonconforming (defective)• p-chart (proportion or percentage chart)• Fixed sample size, or• Variable sample size (units produced varies)
• np-chart for number nonconforming• Fraction x sample size (number in a sample)
• Charts for defects• c-chart (total number of defects/unit)• u-chart (average number of defects/unit)
SJSU Bus. 142 - David Bentley 24THE MANAGEMENT AND CONTROL OF QUALITY, 5e, © 2002 South-Western/Thomson LearningTM (Mod. 10/14/02 DAB)
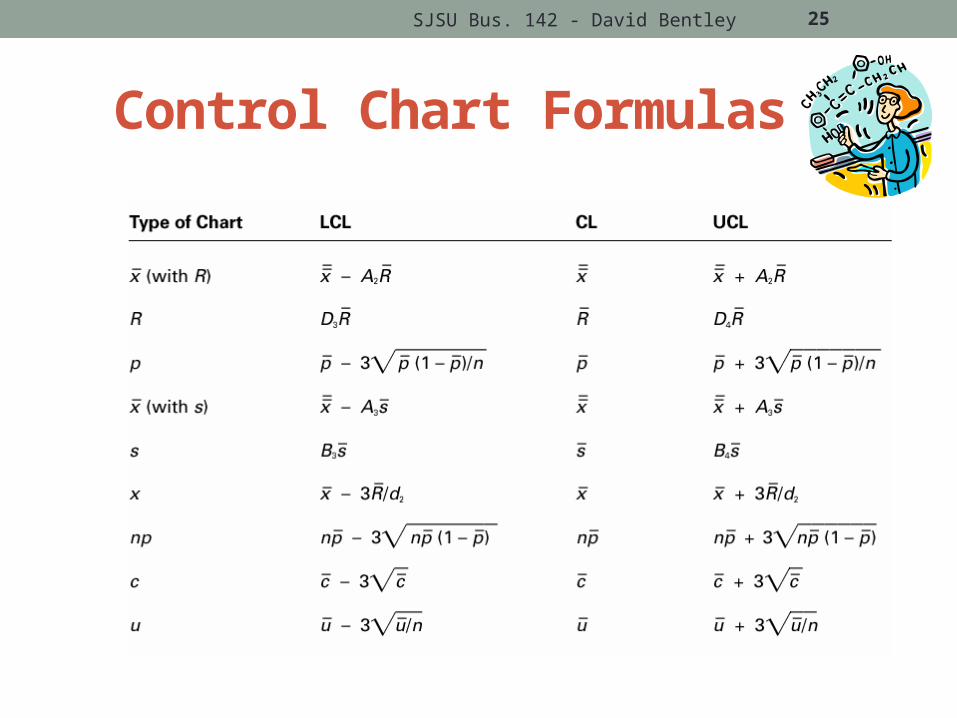
Control Chart Formulas
SJSU Bus. 142 - David Bentley 25

Control Chart Selection
SJSU Bus. 142 - David Bentley 26
Quality Characteristicvariable attribute
n>1?
n>=10 or computer?
x and MRno
yes
x and s
x and Rno
yes
defective defect
constant sample size?
p-chart withvariable samplesize
no
p ornp
yes constantsampling unit?
c u
yes no
THE MANAGEMENT AND CONTROL OF QUALITY, 5e, © 2002 South-Western/Thomson LearningTM

Summary
SJSU Bus. 142 - David Bentley 27
The object of using process charts is to continually improve your processes
As we make changes and improvements… there will be fewer defects and
defectives