Lecture 04: More Process Modelling & Software...
173
– 04 – 2015-05-04 – main – Softwaretechnik / Software-Engineering Lecture 04: More Process Modelling & Software Metrics 2015-05-04 Prof. Dr. Andreas Podelski, Dr. Bernd Westphal Albert-Ludwigs-Universit¨ at Freiburg, Germany
Transcript of Lecture 04: More Process Modelling & Software...

–04–2015-05-04–main
–
Softwaretechnik / Software-Engineering
Lecture 04: More Process Modelling
& Software Metrics
2015-05-04
Prof. Dr. Andreas Podelski, Dr. Bernd Westphal
Albert-Ludwigs-Universitat Freiburg, Germany

Contents & Goals–04–2015-05-04–Sprelim
–
2/91
Last Lecture:
• process, model, process vs. procedure model
• code & fix, waterfall, S/P/E programs, (rapid) protoyping
This Lecture:
• Educational Objectives: Capabilities for following tasks/questions.
• what is evolutionary, incremental, iterative?
• what’s the fundamental idea of the spiral model? where’s the spiral?
• what is the difference between procedure and process model?
• what are the constituting elements of “V-Modell XT”? what project types does it support,what is the consequence? what is tailoring in the context of “V-Modell XT”?
• what are examples of agile process models? what are their principles? describe XP, Scrum
• what is a nominal, . . . , absolute scale? what are their properties?
• which properties make a metric useful?
• what’s the difference between objective, subjective, and pseudo metrics?
• compute LOC, cyclomatic complexity, LCOM, . . . for this software
• Content:
• non-linear procedure models cont’d, process models (V-Modell XT, Scrum, . . . )
• scales, metrics

Non-Linear Procedure Models
–04–2015-05-04–main
–
3/91

Evolutionary and Iterative Development–04–2015-05-04–Sevoinciter–
4/91
Analysis of RequirementsUse on Target System
Defined StepsPreliminary Results Used
Complete Plan
RapidPrototyping
EvolutionaryDevelopment
IterativeDevelopment
IncrementalDevelopment
. . .
yes
to some amount
to a low amount

Evolutionary and Iterative Development–04–2015-05-04–Sevoinciter–
4/91
Analysis of RequirementsUse on Target System
Defined StepsPreliminary Results Used
Complete Plan
RapidPrototyping
EvolutionaryDevelopment
IterativeDevelopment
IncrementalDevelopment
. . .
yes
to some amount
to a low amount
evolutionary software development — an approach which includes evolutions
of the developed software under the influence of practical/field testing. New and
changed requirements are considered by developing the software in sequential steps
of evolution.
Ludewig & Lichter (2013), flw. (Zullighoven, 2005)
iterative software development — software is developed in multiple iterative
steps, all of them planned and controlled. Goal: each iterative step, beginning with
the second, corrects and improves the existing system based on defects detected
during usage. Each iterative steps includes the characteristic activities analyse,
design, code, test. Ludewig & Lichter (2013)

Incremental Development–04–2015-05-04–Sevoinciter–
5/91
Analysis of RequirementsUse on Target System
Defined StepsPreliminary Results Used
Complete Plan
RapidPrototyping
EvolutionaryDevelopment
IterativeDevelopment
IncrementalDevelopment
. . .
incremental software development — The total extension of a system under
development remains open; it is realised in stages of expansion. The first stage is
the core system. Each stage of expansion extends the existing system and is subject
to a separate project. Providing a new stage of expansion typically includes (as with
iterative development) an improvement of the old components.
Ludewig & Lichter (2013)
• Note: (to maximise confusion) IEEE calls our “iterative” incremental:
incremental development — A software development technique in which requirements
definition, design, implementation, and testing occur in an overlapping, iterative (rather
than sequential) manner, resulting in incremental completion of the overall software product.
IEEE 610.12 (1990)
• One difference (in our definitions):
• iterative: steps towards fixed goal,
• incremental: goal extended for each step; next step goals may already be planned.
Examples: operating system releases, short time-to-market (→ continuous integration).

The Spiral Model
–04–2015-05-04–main
–
6/91

Quick Excursion: Risk and Riskvalue–04–2015-05-04–Sspiral–
7/91
risk — a problem, which did not occur yet, but on occurrence threatens important
project goals or results. Whether it will occur, cannot be surely predicted.
Ludewig & Lichter (2013)
riskvalue = p ·K
p: probability of problem occurrence, K: cost in case of problem occurrence.
105
106
107
108
cost in caseof incidence/ e
0.01 0.1 1 10 100 500incidence prob-ability p / 10−3
acceptable risks
inacceptable
risks
extreme
risks
• Avionics requires: “Average Probability per Flight Hour for Catastrophic Failure Conditions of10−9 or ‘Extremely Improbable”’ (AC 25.1309-1).
• “problems with p = 500 · 10−3 = 0.5 are not risks, but environment conditions to be dealt with”

The Spiral Model (Boehm, 1988)–04–2015-05-04–Sspiral–
8/91
Barry W. Boehm
Repeat until end of project (successful completion or failure):
(i) determine the set R of risks threatening the project;if R = ∅, the project is successfully completed
(ii) assign each risk r ∈ R a risk value v(r)
(iii) for the risk r0 with the highest risk value, r0 = max{v(r) | r ∈ R},find a way to eliminate this risk, and go this way;if there is no way to eliminate the risk, stop with project failure
Advantages:
• we know early if the project goal is unreachable,
• knowing that the biggest risks are eliminated gives a good feeling.
Note: risk can by anything; e.g. open technical questions (→ prototype?), but alsolead developer leaving the company (→ invest in documentation), changed marketsituation (→ adapt appropriate features), . . .

Wait, Where’s the Spiral?–04–2015-05-04–Sspiral–
9/91

Wait, Where’s the Spiral?–04–2015-05-04–Sspiral–
9/91
A concrete process using the Spiral Model could look as follows:
t (cost, project progress)
t0 t1 t2 t3
- fix goals, conditions, - risk analysis, - develop and test, - plan next phase,

Wait, Where’s the Spiral?–04–2015-05-04–Sspiral–
9/91
A concrete process using the Spiral Model could look as follows:
t (cost, project progress)
t0 t1 t2 t3
- fix goals, conditions, - risk analysis, - develop and test, - plan next phase,

Process Models
–04–2015-05-04–main
–
10/91

From Procedure to Process Model–04–2015-05-04–Sprocesses
–
11/91
A process model may describe:
• organisation, responsibilities, roles;
• structure and properties of documents;
• methods to be used, e.g. to gather requirements or to check intermediate results
• steps to be conducted during development, their sequential arrangement, theirdependencies (the procedure model);
• project phases, milestones, testing criteria;
• notations and languages;
• tools to be used (in particular for project management).
Process models typically come with their own terminology (to maximiseconfusion?), e.g. what we call artefact is called product in V-Model terminology.
Process models are legion; we will take a closer look onto:
• V-Model XT, (Rational) Unified Process, Cleanroom, Agile (XP, Scrum)

Light vs. Heavyweight Process Models–04–2015-05-04–Sprocesses
–
12/91
• You may hear about “light” and “heavyweight” process models.
• Sometimes, “heaviness” seems to be measured in number of rules. . .
• Sometimes, “heaviness” seems to be related to flexibility, adaptability during aprocess. . .
• “Light” sounds better than “heavy”, so advocates of a certain process model tendto tag theirs “light” and all others “heavy”.
• In the end,
• a process model is too “light” if it doesn’t support you in doing things whichare useful and necessary for your project;
• a process model is too “heavy” if it forces you to do things which are neithernecessary nor useful for your project.
• Thus following (Ludewig and Lichter, 2013), we will not try to assign the followingprocess models to a “weight class”.

Phase Models
–04–2015-05-04–Sprocesses
–
13/91

The Phase Model–04–2015-05-04–Sprocesses
–
14/91
• The project is planned by phases, delimited by well-defined milestones.
• Each phase is assigned a time/cost budget.
• Phases and milestones may be part of the development contract;partial payment when reaching milestones.
• Roles, responsibilities, artefacts defined as needed.
• By definition, there is no iteration of phases.
• But activities may span multiple phases.
• Not uncommon for small projects (few software people, small product size), smallcompanies.

V-Modell XT
–04–2015-05-04–main
–
15/91

–04–2015-05-04–Svxt–
16/91
������������ �����������������
����������

V-Modell XT–04–2015-05-04–Svxt–
17/91
• There are different V-shaped (in a minute) process models,we discuss the (German) “V-Modell”.
• “V-Modell”: developed by company IABG in cooperation with the Federal Officefor Defence Technology and Procurement (‘Bundesministerium fur Verteidigung’),released 1998
• (German) government as customer often requires usage of the V-Modell
• 2012: “V-Modell XT” Version 1.4 (Extreme Tailoring) (V-Modell XT, 2006)

V-Modell XT: Project Types–04–2015-05-04–Svxt–
18/91
projectrole
customer‘Auftraggeber’
developer‘Auftragnehmer’
customer/developer‘Auftragg.’/‘Auftragn.’
customer/developer‘Auftragg.’/‘Auftragn.’
projecttype
system developmentproject (AG)
system developmentproject (AN)
system developmentproject (AG/AN)
introduction andmaintenance of
specific process model
projectsubject
HW system SW system HW-SWsystem/embedded
Systemintegration
introduction andmaintenance of
specific process model
V-Modell XT offers support for four different project types:
• AG: project from the perspective of the customer(create call for bids, choose developer, accept product)
• AN: project from the perspective of the developer(create offer, develop system, hand over system to customer)
• AG/AN: customer and developer from same organisation
• PM: introduction or improvement of a process model
• project type variants:one/more customer; development/improvement/migration; maintenance

V-Modell XT: Terminology–04–2015-05-04–Svxt–
19/91
our course V-Modell XT explanation
role role (‘Rolle’)
activity activity (‘Aktivitat’)
- step (‘Arbeitsschritt’) parts of activities
artefact product (‘Produkt’)
- topic (‘Thema’) parts of products
- discipline (‘Disziplin’) a set of related products and activities
phase project segment (?)(‘Projektabschnitt’)

V-Modell XT: Decision Points–04–2015-05-04–Svxt–
20/91
%''������(��1 �2����� -.&5. ����� �������� ��-.������+��������1 ������

V-Modell XT: The V-World (naja. . . )–04–2015-05-04–Svxt–
21/91
%''������"���� ��.��'������
����� ��

V-Modell XT: Tailoring Instance–04–2015-05-04–Svxt–
22/91
Model
Instance
������,��1 �2����+���&��-.��%��+������� �1 �2����� -.&5. ����� ������

V-Modell XT: Customer/Developer Interface–04–2015-05-04–Svxt–
23/91

V-Modell XT: Roles (a lot!)–04–2015-05-04–Svxt–
24/91
Project Roles:
Anwender
Projektleiter PruferSW-Entwickler
Organisation Roles:

V-Modell XT: Roles (a lot!)–04–2015-05-04–Svxt–
24/91
Project Roles:
Anderungssteuerungsgruppe (Change Control Board), Anderungsverantwortlicher,Anforderungsanalytiker (AG), Anforderungsanalytiker (AN), Anwender, Assessor,
Ausschreibungsverantwortlicher, Datenschutzverantwortlicher,Ergonomieverantwortlicher, Funktionssicherheitsverantwortlicher, HW-Architekt,
HW-Entwickler, Informationssicherheitsverantwortlicher, KM-Administrator,KM-Verantwortlicher, Lenkungsausschuss, Logistikentwickler, Logistikverantwortlicher,
Projektkaufmann, Projektleiter, Projektmanager, Prozessingenieur, Prufer,QS-Verantwortlicher, SW-Architekt, SW-Entwickler, Systemarchitekt,
Systemintegrator, Technischer Autor, Trainer
Organisation Roles:
Akquisiteur, Datenschutzbeauftragter (Organisation), Einkaufer,IT-Sicherheitsbeauftragter (Organisation), Qualitatsmanager

V-Modell XT: Disciplines and Products (even more!)–04–2015-05-04–Svxt–
25/91
%''������"(�������+����&5 �����1 �2���%''������")�������+���������� � ���-����
�&5 �����L ��������

V-Modell XT: Disciplines and Products (even more!)–04–2015-05-04–Svxt–
25/91
%''������"(�������+����&5 �����1 �2���%''������")�������+���������� � ���-����
�&5 �����L ��������

V-Modell XT: Activities (as many?!)–04–2015-05-04–Svxt–
26/91
%''������)��������+��������1 �2���� %''������)#�������+������ � ���-����
�L ��������

V-Modell XT: Activities (as many?!)–04–2015-05-04–Svxt–
26/91
%''������)��������+��������1 �2���� %''������)#�������+������ � ���-����
�L ��������

V-Modell XT: Procedure Building Blocks–04–2015-05-04–Svxt–
27/91
• a discipline comprises one or more product
• a product may be external (‘E’) or initial (‘I’),i.e. created always and exactly once (e.g. project plan)
• a product may consist of topics
• a product may depend on other products
• an activity creates a product and belongs to a discipline
• an activity may consist of steps
• a step works on a topic
• a role may be responsible for a product or contribute
• each product has at most one responsible role

V-Modell XT: Example Building Block–04–2015-05-04–Svxt–
28/91
�����!*���� ��.��'�������76� ���-����SW-Development (‘SW-Entwicklung’)

V-Modell XT: Example Building Block–04–2015-05-04–Svxt–
28/91
�����!*���� ��.��'�������76� ���-����SW-Development (‘SW-Entwicklung’)
vs.coding
. . .
spec. of . . .
programmer

V-Modell XT: Development Strategies–04–2015-05-04–Svxt–
29/91
Recall the idea of the “V shape”:
requirementsfixed
requirementsfixed
acceptanceacceptance
systemspecifiedsystemspecified
systemdeliveredsystemdelivered
architecturedesigned
architecturedesigned
systemintegratedsystem
integrated
modulesdesignedmodulesdesigned
systemrealisedsystemrealised
verification & validation
V-Modell XT mainly supports three strategies to develop a system,i.e. principal sequences between decision points:
• incremental,
• component based,
• prototypical.

V-Modell XT: Development Strategies–04–2015-05-04–Svxt–
30/91
requirementsfixed
requirementsfixed
acceptanceacceptance
systemspecifiedsystemspecified
systemdeliveredsystemdelivered
architecturedesigned
architecturedesigned
systemintegratedsystem
integrated
modulesdesignedmodulesdesigned
systemrealisedsystemrealised
verification & validation
incremental component based prototypical

V-Modell XT: Discussion–04–2015-05-04–Svxt–
31/91
Advantages:
• certain management related building block are part of each project,thus they may receive increased attention of management and developers
• publicly available, can be used free of license costs
• very generic, support for tailoring
• comprehensive, low risk of forgetting things
Disadvantages:
• comprehensive, tries to cover everything; tailoring is supported, but may need high effort
• tailoring is necessary, otherwise a huge amount of useless documents is created
• description/presentation leaves room for improvement
Needs to prove in practice, in particular in small/medium sized enterprises (SME).

Rational Unified Process
–04–2015-05-04–main
–
32/91

Rational Unified Process (RUP)–04–2015-05-04–Srup–
33/91
Exists.
• in contrast to “V-Modell XT”, a commercial product

Agile Process Models
–04–2015-05-04–main
–
34/91

The Agile Manifesto–04–2015-05-04–Sagile–
35/91
“Agile denoting ‘the quality of being agile; readiness for motion; nimbleness,activity, dexterity in motion’ software development methods are attempting tooffer an answer to the eager business community asking for lighter weight alongwith faster and nimbler software development processes. This is especially thecase with the rapidly growing and volatile Internet software industry as well asfor the emerging mobile application environment.” (Abrahamsson et al., 2002)
The Agile Manifesto (2001):
We are uncovering better ways of developing software by doing it andhelping others do it. Through this work we have come to value:
Individuals and interactions over processes and toolsWorking software over comprehensive documentationCustomer collaboration over contract negotiationResponding to change over following a plan
that is, while there is value in the items on the right,we value the items on the left more.

Agile Principles–04–2015-05-04–Sagile–
36/91
• Our highest priority is to satisfy the customer through early and continuous delivery ofvaluable software.
• Welcome changing requirements, even late in development. Agile processes harnesschange for the customers competitive advantage.
• Deliver working software frequently, from a couple of weeks to a couple of months, witha preference to the shorter timescale.
• Business people and developers must work together daily throughout the project.
• Build projects around motivated individuals. Give them the environment and supportthey need, and trust them to get the job done.
• The most efficient and effective method of conveying information to and within adevelopment team is face-to-face conversation.
• Working software is the primary measure of progress.
• Agile processes promote sustainable development. The sponsors, developers, and usersshould be able to maintain a constant pace indefinitely.
• Continuous attention to technical excellence and good design enhances agility.
• Simplicity the art of maximizing the amount of work not done is essential.
• The best architectures, requirements, and designs emerge from self-organizing teams.
• At regular intervals, the team reflects on how to become more effective, then tunes andadjusts its behavior accordingly.

Similarities of Agiles Process Models–04–2015-05-04–Sagile–
37/91
• iterative; cycles of a few weeks, at most three months,
• require work in small groups (6–8 people),
• dislike the idea of large, comprehensive documentation (radical or withrestrictions),
• consider the customer important;recommend or request customer’s presence in the project,
• dislike dogmatic rules.
(Ludewig and Lichter, 2013)

Extreme Programming (XP)
–04–2015-05-04–Sagile–
38/91

Extreme Programming (XP) (Beck, 1999)–04–2015-05-04–Sagile–
39/91
XP values:
• simplicity, feedback, communication, courage, respect.
XP practices:
• management
• integral team(including customer)
• planning game(→ Delphi method)
• short release cycles
• stand-up meetings
• assess in hindsight
• team:
• joint responsibility forthe code
• coding conventions
• acceptable workload
• central metaphor
• continuous integration
• programming
• test driven development
• refactoring
• simple design
• pair programming
. . .
✘
coding
. . .
tests for . . .spec. of . . .
programmerprogrammer

Scrum
–04–2015-05-04–Sagile–
40/91

Scrum–04–2015-05-04–Sagile–
41/91
• first published 1995 (Schwaber, 1995), based on ideas of Takeuchi and Nonaka
• inspired by Rugby: get the ball in a scrum, then sprint to score
• role-based; iterative and incremental;in contrast to XP no techniques proposed/required

Scrum–04–2015-05-04–Sagile–
41/91
• first published 1995 (Schwaber, 1995), based on ideas of Takeuchi and Nonaka
• inspired by Rugby: get the ball in a scrum, then sprint to score
• role-based; iterative and incremental;in contrast to XP no techniques proposed/required
Three roles:
• product owner: • scrum team: • scrum master:

Scrum–04–2015-05-04–Sagile–
41/91
• first published 1995 (Schwaber, 1995), based on ideas of Takeuchi and Nonaka
• inspired by Rugby: get the ball in a scrum, then sprint to score
• role-based; iterative and incremental;in contrast to XP no techniques proposed/required
Three roles:
• product owner:
• representative ofcustomer,
• maintains requirementsin the product backlog,
• plans and decides whichrequirement(s) to realisein next sprint,
• (passive) participant ofdaily scrum,
• assesses results ofsprints
• scrum team: • scrum master:

Scrum–04–2015-05-04–Sagile–
41/91
• first published 1995 (Schwaber, 1995), based on ideas of Takeuchi and Nonaka
• inspired by Rugby: get the ball in a scrum, then sprint to score
• role-based; iterative and incremental;in contrast to XP no techniques proposed/required
Three roles:
• product owner:
• representative ofcustomer,
• maintains requirementsin the product backlog,
• plans and decides whichrequirement(s) to realisein next sprint,
• (passive) participant ofdaily scrum,
• assesses results ofsprints
• scrum team:
• members capable ofdeveloping autonomously,
• decides how and howmany requirements torealise in next sprint,
• distribution of tasksself-organised, teamdecides who does whatwhen,
• environment needs tosupport communicationand cooperation, e.g. byspatial locality
• scrum master:
• helps to conduct scrum theright way,
• looks for adherence toprocess and rules,
• ensures that the team isnot disturbed fromoutside,
• moderates daily scrum,responsible for keepingproduct backlogup-to-date,
• should be able to assesstechniques and approaches

Scrum Documents–04–2015-05-04–Sagile–
42/91
• product backlog
• comprises all requirements to be realised,
• priority and effort estimation forrequirements,
• collects tasks to be conducted,
• maintained by product owner
• release plan
• based on initial version of productbacklog,
• how many sprints, which majorrequirements in which sprint,
• release-burndown report
• see sprint-burndown report
• sprint backlog
• requirements to be realised in nextspring, taken from product backlog,
• more precise estimations,
• daily update (tasks done, new tasks, newestimations)
• sprint-burndown report
• completed/open tasks from sprintbacklog,
• should decrease linearly, otherwiseremove tasks from sprint backlog,
• sprint report
• which requirements have (not) beenrealised in last sprint,
• description of obstacles/problems duringsprint

Scrum Process–04–2015-05-04–Sagile–
43/91
ProductBacklog
sprintplanning
releaseplanning
Release Plan
Release Burn.
Sprint Backlog sprint
realisationdaily scrum
SprintBurndown
reviewretrospective Sprint Report
requirementsworkshop
ProductIncrement
• daily scrum:
• daily meeting, 15 min.
• discuss progress, synchronise day plan, discuss and document new obstacles
• team members, scrum master, product owner (if possible)
• sprint: at most 30 days, usually shorter (initially longer)
• sprint review: assess amount and quality of realisations; product owner accepts results
• sprint retrospective: assess how well the scrum process was implemented; identifyactions for improvement (if necessary)

Scrum: Discussion–04–2015-05-04–Sagile–
44/91
• has been used in many projects, experience in majority positive
• team size bigger 7–10 may need scrum of scrums
• competent product owner necessary for success
• success depends on motivation, competence, and communication skills of teammembers
• team members responsible for planning, and for adhering to process and rules, thusintensive learning and experience necessary
• can (as other process models) be combined with techniques from XP

Software and Process Metrics
–04–2015-05-04–main
–
45/91

Software and Process Metrics–04–2015-05-04–Smetricintro–
46/91
• To systematically compare and improve industrial products, we need toprecisely describe and assess the products and the process of creation.
• This common practice for many material good, e.g. cars
• fuel consumption,
• size of trunk,
• fixed costs per year,
• time needed to change headlight’s light bulb,
• clearance (accuracy of fit and gaps of, e.g., doors)
• . . .
Note: all these key figures are models of products — they reduce everything butthe aspect they are interested in.
• Less common practice for immaterial goods like Software.
• It should be — (objective) measures are central to engineering approaches.
• Yet: it’s not that easy for software.

Excursion: Scales
–04–2015-05-04–main
–
47/91

Scales and Types of Scales–04–2015-05-04–Sscales–
48/91
• measuring maps elements from a set A to a scale M :
m : A → M
• we distinguish
(i) nominal scale
• operations: = (and 6=)
(ii) ordinal scale
• operations: =, </> (with transitivity), min/max, percentiles (e.g. median)
(iii) interval scale (with units)
• operations: =, <, >, min/max, percentiles, ∆
(iv) rational scale (with units)
• operations: =, <, >, min/max, percentiles, ∆, proportion, 0
(v) absolute scale
• a rational scale where M comprises the key figures itself

Nominal Scale–04–2015-05-04–Sscales–
49/91
m : A → M
• operations: = (and 6=)
• that is, there is no (natural) order between elements of M ,
• the lexicographic order can be imposed, but is not related to measured information(thus not natural).
• general example:
• nationality, gender, car manufacturer, geographic direction, . . .
• Autobahn number, train number, . . .
• software engineering example:
• programming laguage
•

Ordinal Scale–04–2015-05-04–Sscales–
50/91
m : A → M
• operations: =, <, >, min/max, percentiles (e.g. median)
• there is a (natural) order between elements of M , but no (natural) notion ofdistance or average
• general example:
• strongly agree > agree > disagree > strongly disagree
• administrative ranks: Chancellor > Minister
• ranking list, leaderboard:finishing number tells us who was, e.g. faster, than who; but nothing about howmuch faster 1st was than 2nd
• types of scales, . . .
• software engineering example:
• CMMI scale (maturity levels 1 to 5)
•

Interval Scale–04–2015-05-04–Sscales–
51/91
m : A → M
• operations: =, <, >, min/max, percentiles, ∆
• there’s a (natural) notion of difference ∆ : M ×M → R,
• but no (natural) 0
•
• general example:
• temperature in Celsius (no zero),
• year dates,two persons, born B1, B2, died D1, D2 (all dates beyond, say, 1900) — if∆(B1, D1) = ∆(B2, D2), they reached the same age
• software engineering example:
• time of check-in in revision control system,
•

Rational Scale–04–2015-05-04–Sscales–
52/91
m : A → M
• operations: =, <, >, min/max, percentiles, ∆, proportion, 0
• the (natural) zero induces a meaning for proportion m1/m2
• general example:
• age (“twice as old”), finishing time, weight, pressure, . . .
• price, speed, distance from Freiburg, . . .
• software engineering example:
• runtime of a program for certain inputs,
•

Absolute Scale–04–2015-05-04–Sscales–
53/91
m : A → M
• M = N0,
• a rational scale where M comprises the key figures itself
• absolute scale has median, but in general not an average in the scale.
• general example:
• seats in a bus, number of public holidays, number of inhabitants of a country, . . .
• “average number of children per family: 1.203” – what is a 0.203-child? theabsolute scale has been viewed as a rational scale, makes sense for certainpurposes
• software engineering example:
• number of known errors,
•

Communicating Figures
–04–2015-05-04–Sscales–
54/91

Median and Box-Plots–04–2015-05-04–Sscales–
55/91
M1 M2 M3 M4 M5
LOC 127 213 152 139 13297
• arithmetic average: 2785.6
• median: 127, 139, 152, 213, 13297

Median and Box-Plots–04–2015-05-04–Sscales–
55/91
M1 M2 M3 M4 M5
LOC 127 213 152 139 13297
• arithmetic average: 2785.6
• median: 127, 139, 152, 213, 13297
• a boxplot visualises 5 aspects of data at once(whiskers sometimes defined differently, with “outliers”):
100% (maximum)
75% (3rd quartile)
50% (median)
25% (1st quartile)
0% (minimum)
40.000
30.000
20.000
10.000
median: 2,078
average: 7,033.027
LOC lecture’s *.tex files

Software Metrics
–04–2015-05-04–main
–
56/91

Software Metrics–04–2015-05-04–Smetrics
–
57/91
metric — A quantitative measure of the degree to which a system, compo-nent, or process posesses a given attribute.See: quality metric. IEEE 610.12 (1990)

Software Metrics–04–2015-05-04–Smetrics
–
57/91
metric — A quantitative measure of the degree to which a system, compo-nent, or process posesses a given attribute.See: quality metric. IEEE 610.12 (1990)
quality metric — (1) A quantitative measure of the degree to which an itempossesses a given quality attribute.(2) A function whose inputs are software data and whose output is a singlenumerical value that can be interpreted as the degree to which the softwarepossesses a given quality attribute. IEEE 610.12 (1990)

Recall: Metric Space [math.]–04–2015-05-04–Smetrics
–
58/91
Definition. [Metric Space] LetX be a set. A function d : X×X → R
is called metric on X if and only if, for each x, y, x ∈ X,
(i) d(x, y) ≥ 0 (non-negative)
(ii) d(x, y) = 0 ⇐⇒ x = y (identity of indiscernibles)
(iii) d(x, y) = d(y, x) (symmetry)
(iv) d(x, z) ≤ d(x, y) + d(y, z) (triangle inequality)
(X, d) is called metric space.

Software Metrics: Motivation and Goals–04–2015-05-04–Smetrics
–
59/91
Important motivations and goals for using software metrics:
• Support decisions
• Quantify experience, progress, etc.
• Assess the quality of products and processes
• Predict cost/effort, etc.

Software Metrics: Motivation and Goals–04–2015-05-04–Smetrics
–
59/91
Important motivations and goals for using software metrics:
• Support decisions
• Quantify experience, progress, etc.
• Assess the quality of products and processes
• Predict cost/effort, etc.
Metrics can be used:
• descriptive or prescriptive:
• “the current average LOC per module is N” vs. “a prodecure must not have more thenN parameters”
• a descriptive metric can be diagnostic or prognostic:
• “the current average LOC per module is N” vs. “the expected test effort is N hours”
• Note: prescriptive and prognostic are different things.
• Examples for diagnostic/guiding use:
• measure time spent per procedure before starting “optimisations”,
• focus testing effort accordingly, e.g. guided cyclomatic complexity,
• develop measures indicating architecture problems, (analyse,) then focus re-factoring

Requirements on Useful Metrics–04–2015-05-04–Smetrics
–
60/91
Definition. A thing which is subject to the application of a metric is calledproband. The value m(P ) yielded by a given metric m on a proband Pis called valuation yield (‘Bewertung’) of P .

Requirements on Useful Metrics–04–2015-05-04–Smetrics
–
60/91
Definition. A thing which is subject to the application of a metric is calledproband. The value m(P ) yielded by a given metric m on a proband Pis called valuation yield (‘Bewertung’) of P .
In order to be useful, a (software) metric should be:
• differentiated
• comparable
• reproducible
• available
• relevant
• economical
• plausible
• robust

Requirements on Useful Metrics–04–2015-05-04–Smetrics
–
60/91
Definition. A thing which is subject to the application of a metric is calledproband. The value m(P ) yielded by a given metric m on a proband Pis called valuation yield (‘Bewertung’) of P .
In order to be useful, a (software) metric should be:
• differentiated – worst case: same valuation for all probands
• comparable – ordinal scale, better: rational (or absolute) scale
• reproducible – multiple applications of a metric to the same proband should yieldthe same valuation
• available – valuation yields need to be in place when needed
• relevant – wrt. overall needs
• economical – worst case: doing the project gives a perfect estimatio of duration,but is expensive;irrelevant metrics are not economical (if not available for free)
• plausible – (→ pseudo-metric)
• robust – developers cannot arbitrarily manipulate the yield; antonym: subvertible

Requirements on Useful Metrics: Examples–04–2015-05-04–Smetrics
–
61/91
characteristic(‘Merkmal’)
positive example negative example
differentiated
comparable
reproducible
available
relevant
economical
plausible
robust
(Ludewig and Lichter, 2013)

Requirements on Useful Metrics: Examples–04–2015-05-04–Smetrics
–
61/91
characteristic(‘Merkmal’)
positive example negative example
differentiated program length in LOC CMM/CMMI level below 2
comparable
reproducible
available
relevant
economical
plausible
robust
(Ludewig and Lichter, 2013)

Requirements on Useful Metrics: Examples–04–2015-05-04–Smetrics
–
61/91
characteristic(‘Merkmal’)
positive example negative example
differentiated program length in LOC CMM/CMMI level below 2
comparable cyclomatic complexity review (text)
reproducible memory consumption grade assigned by inspector
available number of developers number of errors in thecode (not only known ones)
relevant expected development cost;number of errors
number of subclasses(NOC)
economical number of discovered errorsin code
highly detailed timekeeping
plausible cost estimation followingCOCOMO (to a certainamount)
cyclomatic complexity of aprogram with pointeroperations
robust grading by experts almost all pseudo-metrics
(Ludewig and Lichter, 2013)

Software Metrics: Blessing and Curse–04–2015-05-04–Smetrics
–
62/91
Application domains for software metrics:
• Cost metrics (including duration)
• Error metrics
• Volume/Size metrics
• Quality metrics

Software Metrics: Blessing and Curse–04–2015-05-04–Smetrics
–
62/91
Application domains for software metrics:
• Cost metrics (including duration)
• Error metrics
• Volume/Size metrics
• Quality metrics
Being good wrt. to a certain metricis in general not an asset on its own.In particular critical: pseudo-metrics for quality (→ in a minute).

Kinds of Metrics
–04–2015-05-04–main
–
63/91

Kinds of Metrics: ISO/IEC 15939:2011–04–2015-05-04–Smetrickinds–
64/91
base measure — measure defined in terms of an attribute and the methodfor quantifying it. ISO/IEC 15939 (2011)
Examples:
• lines of code, hours spent on testing, . . .
•
derived measure — measure that is defined as a function of two or morevalues of base measures. ISO/IEC 15939 (2011)
Examples:
• average/median lines of code, productivity (lines per hour), . . .
•

Kinds of Metrics: by Measurement Procedure–04–2015-05-04–Smetrickinds–
65/91
objective metric subjective metric pseudo metric
Procedure
Advantages
Disadvan-tages
Example,general
Example inSoftwareEngineering
Usually usedfor
(Ludewig and Lichter, 2013)

Kinds of Metrics: by Measurement Procedure–04–2015-05-04–Smetrickinds–
65/91
objective metric subjective metric pseudo metric
Procedure measurement,counting, poss.normed
Advantages exact, reproducible,can be obtainedautomatically
Disadvan-tages
not always relevant,often subvertable, nointerpretation
Example,general
body height, airpressure
Example inSoftwareEngineering
size in LOC or NCSI;number of (known)bugs
Usually usedfor
collection of simplebase measures
(Ludewig and Lichter, 2013)

Kinds of Metrics: by Measurement Procedure–04–2015-05-04–Smetrickinds–
65/91
objective metric subjective metric pseudo metric
Procedure measurement,counting, poss.normed
review by inspector,verbal or by givenscale
Advantages exact, reproducible,can be obtainedautomatically
not subvertable,plausible results,applicable to complexcharacteristics
Disadvan-tages
not always relevant,often subvertable, nointerpretation
assessment costly,quality of resultsdepends on inspector
Example,general
body height, airpressure
health condition,weather condition(“bad weather”)
Example inSoftwareEngineering
size in LOC or NCSI;number of (known)bugs
usability; severenessof an error
Usually usedfor
collection of simplebase measures
quality assessment;error weighting
(Ludewig and Lichter, 2013)

Kinds of Metrics: by Measurement Procedure–04–2015-05-04–Smetrickinds–
65/91
objective metric subjective metric pseudo metric
Procedure measurement,counting, poss.normed
review by inspector,verbal or by givenscale
computation (based onmeasurements orassessment)
Advantages exact, reproducible,can be obtainedautomatically
not subvertable,plausible results,applicable to complexcharacteristics
yields relevant, directlyusable statement on notdirectly visiblecharacteristics
Disadvan-tages
not always relevant,often subvertable, nointerpretation
assessment costly,quality of resultsdepends on inspector
hard to comprehend,pseudo-objective
Example,general
body height, airpressure
health condition,weather condition(“bad weather”)
body mass index (BMI),weather forecast for thenext day
Example inSoftwareEngineering
size in LOC or NCSI;number of (known)bugs
usability; severenessof an error
productivity; costestimation followingCOCOMO
Usually usedfor
collection of simplebase measures
quality assessment;error weighting
predictions (costestimation); overallassessments
(Ludewig and Lichter, 2013)

Some Objective Metrics, Base Measures–04–2015-05-04–Smetrickinds–
66/91
dimension name unit measurement procedure
size of group,department,etc.
headcount – number of filled positions (rounded on0.1); part-time positions rounded on0.01
program size – LOCtot number of lines in total
net programsize
– LOCne number of non-empty lines
code size – LOCpars number of lines with not only commentsand non-printable
deliveredprogram size
– DLOCtot,DLOCne,DLOCpars
like LOC, only code (as source orcompiled) given to customer
number ofunits
unit-count – number of units, as defined for versioncontrol
(Ludewig and Lichter, 2013)
• Note: who measures when?

Assessment of Subjective Metrics–04–2015-05-04–Smetrickinds–
67/91
kind ofassessment
example problems countermeasures
Statement “Thespecificationis available.”
Assessment “The moduleis coded in aclever way.”
Grading “Readabilityis graded4.0.”
(Ludewig and Lichter, 2013)

Assessment of Subjective Metrics–04–2015-05-04–Smetrickinds–
67/91
kind ofassessment
example problems countermeasures
Statement “Thespecificationis available.”
Terms areambiguous,conclusions arehardly possible.
Allow only certain statements,characterise them precisely.
Assessment “The moduleis coded in aclever way.”
No basis forcomparisons.
Only offer particular outcomes,put them on an (at leastordinal) scale.
Grading “Readabilityis graded4.0.”
Subjective,grading notreproducible.
Define criteria for grades; giveexamples how to grade
(Ludewig and Lichter, 2013)

Some Subjective Metrics–04–2015-05-04–Smetrickinds–
68/91
• Norm ConformanceConsidering (all or some of)
• size of units (modules etc.)
• labelling
• naming of identifiers
• design (layout)
• separation of literals
• style of comments
• Locality
• use of parameters
• information hiding
• local flow of control
• design of interfaces
• Readability
• data types
• structure of control flow
• comments
• Testability
• test driver
• test data
• preparation for test evaluation
• diagnostic components
• dynamic consistency checks
• Typing
• type differentiation
• type restriction
(Ludewig and Lichter, 2013)

Practical Use of Grading-based Metrics–04–2015-05-04–Smetrickinds–
69/91
• Grading by human inspectors can be used to construct sophisticatedgrading schemes, see (Ludewig and Lichter, 2013).
• Premises for their practical application:
• Goals and priorities are fixed and known (communicated).
• Consequences of the assessment are clear and known.
• Accepted inspectors are fixed.
• The inspectors practiced on existing examples.
• Results of the first try are not over-estimated, procedure is improvedbefore results becoming effective.
• Also experienced developers work as inspectors.
• Criteria and weights are regularly checked and adjusted if needed.

Pseudo-Metrics
–04–2015-05-04–main
–
70/91

Pseudo-Metrics–04–2015-05-04–Spseudo–
71/91
Some of the most interesting aspects of software development projectsare hard or impossible to measure directly, e.g.:
• is the documentation sufficient and well usable?
• how much effort is needed until completion?
• how is the productivity of my software people?
• how maintainable is the software?
• do all modules do appropriate error handling?
Due to high relevance, people want to measure despite the difficulty in measuring.Two main approaches:
diffe
rent
iate
dco
mpa
rabl
ere
prod
ucib
leav
aila
ble
relev
ant
econ
omic
alpl
ausib
lero
bust
Expert review,grading
(✔) (✔) (✘) (✔) ✔! (✘) ✔ ✔
Pseudo-metrics,derived measures
✔ ✔ ✔ ✔ ✔! ✔ ✘ ✘

Pseudo-Metrics Cont’d–04–2015-05-04–Spseudo–
72/91
Note: not every derived measure is a pseudo-metric:
• average lines of code per module: derived, not pseudo→ we really measure average LOC per module.
• use average lines of code per module to measure maintainability: derived, pseudo→ we don’t really measure maintainability;average-LOC is only interpreted as maintainability.
Not robust, easily subvertible (see exercises).
Example: productivity (derived).
• Team T develops software S with LOC N = 817 in t = 310h.
• Define productivity as p = N/t, here: ca. 2.64 LOC/h.
• Pseudo-metric: measure performance, efficiency, quality, . . . of teams byproductivity (as defined above).
• team may write
x
:=
y
+
z;
instead of x := y + z;
→ 5-time productivity increase, real efficiency actually decreased.

Pseudo-Metrics Cont’d–04–2015-05-04–Spseudo–
73/91
• Still, pseudo-metrics can be useful if there is a correlation with few false positivesand false negatives between valuation yields and the property to be measured:
valuation yieldlow high
quality
high
false positive
×
true positive
× ×
× × ×
× ×
low
true negative
× ×
×
× ×
false negative
×
× ×
• Which may strongly depend on context information:
• if everybody adheres to a certain coding style,LOC says “lines of code in this style” — this may be a useful measure.

McCabe Complexity–04–2015-05-04–Spseudo–
74/91
complexity — (1) The degree to which a system or component has a designor implementation that is difficult to understand and verify. Contrast with:simplicity.(2) Pertaining to any of a set of structure-based metrics that measure theattribute in (1). IEEE 610.12 (1990)
Definition. [Cyclomatic Number [graph theory]] Let G = (V,E) be a graphcomprising vertices V and edges E.The cyclomatic number of G is defined as
v(G) = |E| − |V |+ 1.
Intuition: minimum number of edges to be removed to make G cycle free.

McCabe Complexity Cont’d–04–2015-05-04–Spseudo–
75/91
Definition. [Cyclomatic Complexity [McCabe, 1976]] Let G = (V,E) be theControl Flow Graph of program P .Then the cyclomatic complexity of P is defined as v(P ) = |E|−|V |+pwhere p is the number of entry or exit points.

McCabe Complexity Cont’d–04–2015-05-04–Spseudo–
75/91
Definition. [Cyclomatic Complexity [McCabe, 1976]] Let G = (V,E) be theControl Flow Graph of program P .Then the cyclomatic complexity of P is defined as v(P ) = |E|−|V |+pwhere p is the number of entry or exit points.
1 vo id i n s e r t i o n S o r t ( i n t [ ] a r r a y ) {2 f o r ( i n t i = 2 ; i < a r r a y . l e n g t h ; i++) {3 tmp = a r r a y [ i ] ;4 a r r a y [ 0 ] = tmp ;5 i n t j = i ;6 whi l e ( j > 0 && tmp < a r r a y [ j −1]) {7 a r r a y [ j ] = a r r a y [ j −1] ;8 j−−;9 }
10 a r r a y [ j ] = tmp ;11 }12 }
Number of edges: |E| = 11Number of nodes: |V | = 6 + 2 + 2 = 10External connections: p = 2
→ v(P ) = 11− 10 + 2 = 3
1
2
3
4
5
8
7
6
10
Entry
Exit

McCabe Complexity Cont’d–04–2015-05-04–Spseudo–
75/91
Definition. [Cyclomatic Complexity [McCabe, 1976]] Let G = (V,E) be theControl Flow Graph of program P .Then the cyclomatic complexity of P is defined as v(P ) = |E|−|V |+pwhere p is the number of entry or exit points.
• Intuition: number of paths, number ofdecision points.
• Interval scale (not absolute, no zerodue to p > 0); easy to compute
• Somewhat independent fromprogramming language.
• Plausibility: doesn’t consider data.
• Plausibility: nesting is harder tounderstand than sequencing.
• Prescriptive use: “For each procedure,either limit cyclomatic complexity to[agreed-upon limit] or provide writtenexplanation of why limit exceeded.”
1
2
3
4
5
8
7
6
10
Entry
Exit
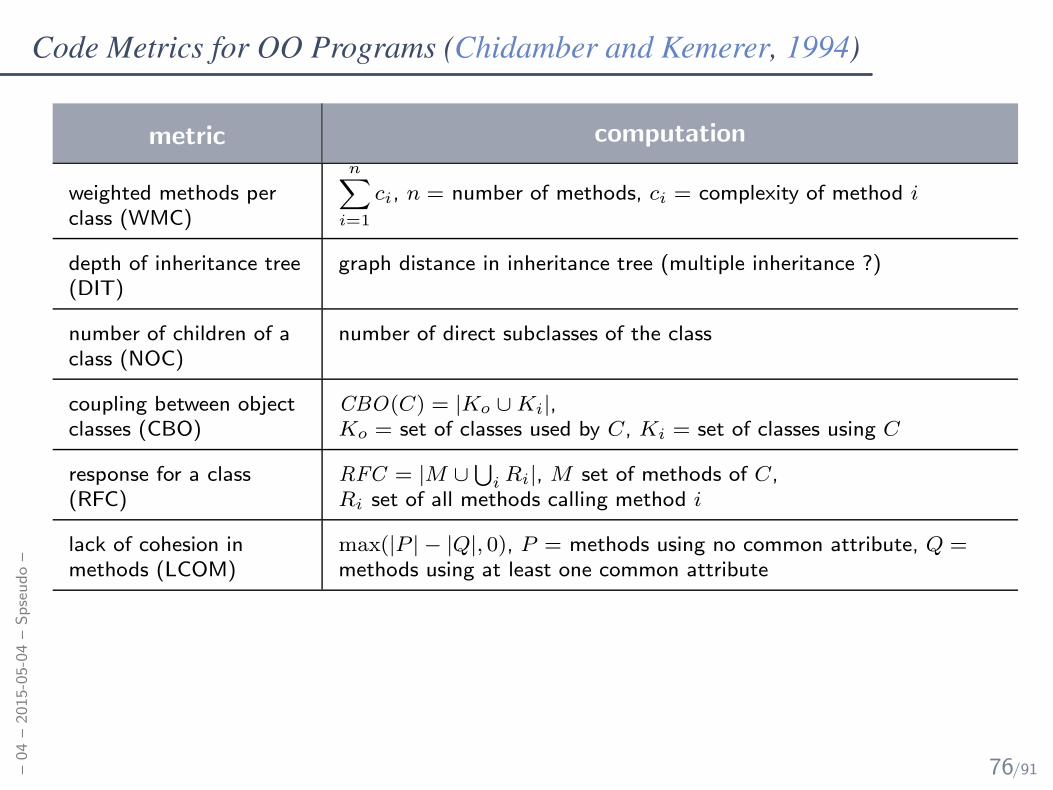
Code Metrics for OO Programs (Chidamber and Kemerer, 1994)–04–2015-05-04–Spseudo–
76/91
metric computation
weighted methods perclass (WMC)
n∑
i=1
ci, n = number of methods, ci = complexity of method i
depth of inheritance tree(DIT)
graph distance in inheritance tree (multiple inheritance ?)
number of children of aclass (NOC)
number of direct subclasses of the class
coupling between objectclasses (CBO)
CBO(C) = |Ko ∪Ki|,Ko = set of classes used by C, Ki = set of classes using C
response for a class(RFC)
RFC = |M ∪⋃
iRi|, M set of methods of C,
Ri set of all methods calling method i
lack of cohesion inmethods (LCOM)
max(|P | − |Q|, 0), P = methods using no common attribute, Q =methods using at least one common attribute
• objective metrics: DIT, NOC, CBO; pseudo-metrics: WMC, RFC, LCOM
. . . there seems to be angreement that it is far more important to focus onempirical validation (or refutation) of the proposed metrics than to proposenew ones, . . . (Kan, 2003)

Goal-Question-Metric
–04–2015-05-04–main
–
77/91

“TankerSummitEurope”
vonworld24in
der
Wikipedia
aufDeutsch.LizenziertunterCCBY-SA
3.0
uber
Wikim
edia
Commons-
http://commons.wikim
edia.org/wiki/File:TankerSummitEurope.JP
G#/media/File:TankerSummitEurope.JP
G
–04–2015-05-04–Sgqm
–
78/91

Goal-Question-Metric (Basili and Weiss, 1984)–04–2015-05-04–Sgqm
–
79/91
The three steps of GQM:
(i) Define the goals relevant for a project or an organisation.
(ii) From each goal, derive questions which need to be answered to check whetherthe goal is reached.
(iii) For each question, choose (or develop) metrics which contribute to findinganswers.
Note: we usually want to optimise wrt. goals, not wrt. metrics.
Development of pseudo-metrics:
(i) Identify aspect to be represented.
(ii) Devise a model the aspect.
(iii) Fix a scale for the metric.
(iv) Develop a definition of the pseudo-metric, how to compute the metric.
(v) Develop base measures for all parameters of the definition.
(vi) Apply and improve the metric.

Now, Which Metric Should We Use?–04–2015-05-04–Sgqm
–
80/91
It is often useful to collect some basic measures before they are actually required, inparticular if collection is cheap:
• size
• of newly created and changed code,
• of separate documentation,
• effort
• for coding, review, testing, verification, fixing, maintenance, . . .
• for restructuring (preventive maintenance), . . .
• errors
• at least errors found during quality assurance, and errors reported by customer
• for recurring problems causing significant effort:is there a (pseudo-)metric which correlates with the problem?
Measures derived from the above basic measures:
• error rate per release, error density (errors per LOC),
• average effort for error detection and correction,
• . . .
If in doubt, use the simpler measure.

Now, Which Metric Should We Use?–04–2015-05-04–Sgqm
–
80/91
It is often useful to collect some basic measures before they are actually required, inparticular if collection is cheap:
• size
• of newly created and changed code,
• of separate documentation,
• effort
• for coding, review, testing, verification, fixing, maintenance, . . .
• for restructuring (preventive maintenance), . . .
• errors
• at least errors found during quality assurance, and errors reported by customer
• for recurring problems causing significant effort:is there a (pseudo-)metric which correlates with the problem?
Measures derived from the above basic measures:
• error rate per release, error density (errors per LOC),
• average effort for error detection and correction,
• . . .
If in doubt, use the simpler measure.LOC and changed lines over time (obtained by statsvn(1).

Process Metrics
–04–2015-05-04–main
–
81/91

Assessment and Improvement of the Process–04–2015-05-04–Sprocm
et–
82/91
• For material goods:quality of the production process influences product quality.
• Idea: specify abstract criteria (metrics)to determine good production processes (e.g., to choose manufacturer).

Assessment and Improvement of the Process–04–2015-05-04–Sprocm
et–
82/91
• For material goods:quality of the production process influences product quality.
• Idea: specify abstract criteria (metrics)to determine good production processes (e.g., to choose manufacturer).
• Again: a good process does not stop us from creating bad products, but(the hope is, that) it is less likely, i.e. there is a correlation:
process qualitylow high
product
quality high
false positive
×
true positive
× ×
× × ×
× ×
low
true negative
× ×
×
× ×
false negative
×
× ×
• Industry in general (production!):ISO 9001, ISO/TS 16949 (automotive), . . .
• Software industry (development!): CMM(I), SPICE

–04–2015-05-04–Sprocm
et–
83/91
�
�
�
�
&00,��IRU�'HYHORSPHQW��9HUVLRQ�����
&00,�'(9��9����
&00,�3URGXFW�7HDP�
�
Improving processes for developing better products and services
1RYHPEHU������
7(&+1,&$/�5(3257�
&08�6(,������75�����(6&�75����������
�
6RIWZDUH�(QJLQHHULQJ�3URFHVV�0DQDJHPHQW�3URJUDP�8QOLPLWHG�GLVWULEXWLRQ�VXEMHFW�WR�WKH�FRS\ULJKW��
�
KWWS���ZZZ�VHL�FPX�HGX�

CMMI–04–2015-05-04–Sprocm
et–
84/91
• 1991: Capability Maturity Model (CMM), DoD/SEI/CMU; superseded by
• 1997: Capability Maturity Model Integration (CMMI) (Team, 2010);constellations: CMMI-DEV (development), CMMI-ACQ (acquisition), CMMI-SRV (service)

CMMI–04–2015-05-04–Sprocm
et–
84/91
• 1991: Capability Maturity Model (CMM), DoD/SEI/CMU; superseded by
• 1997: Capability Maturity Model Integration (CMMI) (Team, 2010);constellations: CMMI-DEV (development), CMMI-ACQ (acquisition), CMMI-SRV (service)
• Goals:
• applicable to all organisations which develop software,
• make strengths and weaknesses of the real process visible, to point out ways forimprovement,
• neutral wrt. technology employed in project,
• levels: higher levels have lower levels as premise,
• be consistent with ISO 15504 (SPICE)
• Assumptions:
• better defined, described, and planned processes have higher maturity,
• higher maturity levels require statistical control to support continuous improvement,
• higher maturity level yields:
• better time/cost/quality prediction;
• lower risk to miss project goals;
• higher quality of products.

CMMI Levels–04–2015-05-04–Sprocm
et–
85/91
level level name process areas
1 initial -
2 managed REQM, PP, PMC, MA, PPQA, CM, SAM
3 defined + RD, TS, PI, VER, VAL, OPF, OPD, OT,IPM, RSKM, DAR
4quantitatively
managed+ OPP, QPM
5 optimising + OID, CAR

CMMI Levels–04–2015-05-04–Sprocm
et–
85/91
level level name process areas
1 initial -
2 managed REQM, PP, PMC, MA, PPQA, CM, SAM
3 defined + RD, TS, PI, VER, VAL, OPF, OPD, OT,IPM, RSKM, DAR
4quantitatively
managed+ OPP, QPM
5 optimising + OID, CAR
• initial – the process is not consciously designed, just evolved (need not be bad!)

CMMI Levels–04–2015-05-04–Sprocm
et–
85/91
level level name process areas
1 initial -
2 managed REQM, PP, PMC, MA, PPQA, CM, SAM
3 defined + RD, TS, PI, VER, VAL, OPF, OPD, OT,IPM, RSKM, DAR
4quantitatively
managed+ OPP, QPM
5 optimising + OID, CAR
• managed (formerly: repeatable) – important areas of software developmentorganised and prescribed to responsible people; each project may have own process
• Areas: requirements management (REQM), project planning (PP), projectmonitoring and control (PMC), measurement and analysis (MA), Process andProduct Quality Assurance (PPQA), configuration management (CM), supplieragreement management (SAM)

CMMI Levels–04–2015-05-04–Sprocm
et–
85/91
level level name process areas
1 initial -
2 managed REQM, PP, PMC, MA, PPQA, CM, SAM
3 defined + RD, TS, PI, VER, VAL, OPF, OPD, OT,IPM, RSKM, DAR
4quantitatively
managed+ OPP, QPM
5 optimising + OID, CAR
• defined – all projects of an organisation follow a unified scheme; standard processis defined, documented, and used; tailoring for projects.
• Areas: requirements development (RD), technical solution (TS), productintegration (PI), verification (VER), validation (VAL), organisational process focus(OPF), organisational process definition (OPD), organisational training (OT),integrated project management (IPM), risk management (RSKM), decisionanalysis and resolution (DAR)

CMMI Levels–04–2015-05-04–Sprocm
et–
85/91
level level name process areas
1 initial -
2 managed REQM, PP, PMC, MA, PPQA, CM, SAM
3 defined + RD, TS, PI, VER, VAL, OPF, OPD, OT,IPM, RSKM, DAR
4quantitatively
managed+ OPP, QPM
5 optimising + OID, CAR
• quantitatively managed – unified metrics enable people to detect problems earlyand take countermeasures.
• Areas: organisational process performance (OPP), quantitative projectmanagement (QPM)

CMMI Levels–04–2015-05-04–Sprocm
et–
85/91
level level name process areas
1 initial -
2 managed REQM, PP, PMC, MA, PPQA, CM, SAM
3 defined + RD, TS, PI, VER, VAL, OPF, OPD, OT,IPM, RSKM, DAR
4quantitatively
managed+ OPP, QPM
5 optimising + OID, CAR
• optimising – errors and problems are analysed systematically, to avoid them in thefuture; process organisation/techniques change accordingly
• Areas: organisational innovation and deployment (OID), causal analysis andresolution (CAR)

CMMI General/Specific Goals and Practices–04–2015-05-04–Sprocm
et–
86/91
• CMMI certificates can be obtained via a so-called appraisal
• there are three levels of review methods A, B, C; A most thorough (and expensive)

CMMI General/Specific Goals and Practices–04–2015-05-04–Sprocm
et–
86/91
• CMMI certificates can be obtained via a so-called appraisal
• there are three levels of review methods A, B, C; A most thorough (and expensive)
• a certificate authority checks, to what amount generic goals GG.1, . . . , GG.3 withtheir generic practices are reached.Example: GG.2 (for level 2) includes
• GG 2.1: create strategy for planning and installation of process
• GG 2.2: plan the process
• GG 2.3: allocate reources
• . . .
• each area, like RD, has specific goals and specific practices, sometimes per levelExample: RD (requirements development) includes
• SG 1: develop customer requirements
• SG 2: develop product requirements
• SG 3: analyse and validate requirements
• that is, to reach CMMI level 2, an organisation has to reach GG.1, GG.2, and inparticular for area RD SG 1 and SG 2.

CMMI Statistics–04–2015-05-04–Sprocm
et–
87/91
%oforgan
isations
10.1
7%
0.9
1%
32.1
5%
46.8
7%
2.0
0% 7
.90%
7.1
8%
0.9
5%
25.9
9%
59.7
4%
1.4
2%
4.7
3%
5.7
5%
0.3
6%
23.1
3%
64.6
6%
1.5
1%
4.6
0%
4.2
1%
0.2
2%
22.8
6%
63.7
2%
2.7
6%
6.2
4%
1.6
9%
1.3
3%
20.6
3%
67.1
3%
2.1
4% 7
.07%
1.5
3%
1.3
9%
17.8
8%
70.6
3%
1.4
6% 7
.10%
1.2
2%
1.0
3%
15.9
1%
71.7
8%
2.6
9% 7.3
8%
0.6
7%
1.3
4%
16.4
4%
67.7
9%
4.7
0% 9.0
6%
Not Given Initial Managed Defined Quantitatively Managed Optimizing
2007 (1101 Appraisals)
2008 (1058 Appraisals)
2009 (1392 Appraisals)
2010 (1378 Appraisals)
2011 (1357 Appraisals)
2012 (1437 Appraisals)
2013 (1559 Appraisals)
2014 (298 Appraisals)
CMMI levelStatistics on achieved CMMI maturity levels
(Source: SEI, Jan. 1, 2007 – Mar. 31, 2014)
• Note: appearance in the statistics is voluntary.

CMMI: Discussion–04–2015-05-04–Sprocm
et–
88/91
• in CMMI, e.g. area RD requires that requirements are analysed, but does not statehow — there are examples, but no particular techniques or approaches
• CMMI as such is not a process model in the sense of the course
• CMMI certificate is required by certain (U.S) government customers; may guideselection of sub-contractors (a certificate at least proves that they think abouttheir process)
• CMMI can serve as an inspiration for important aspects of process models wrt.product quality
• Criticism:
• CMM(I) assumptions are based on experience in specific projects; may not be presentfor all kinds of software,
• CMMI certification applies to one particular state of process management; changedprocesses may require new (expensive) appraisal, in this sense CMMI may hinderinnovation,
• CMMI levels are chosen somewhat arbitrarily; “why is an area in level N and notalready in level N − 1?”

SPICE / ISO 15504–04–2015-05-04–Sprocm
et–
89/91
• Software Process Improvement and Capability Determination
• ideas similar to CMM(I): maturity levels, assessment, certificates
• european development, standardised in ISO/IEC 15504 (2003)
• maturity levels: 0 (incomplete), . . . , 5 (optimizing); SPICE 0 corresponds toCMMI 1
• provides “process reference models” (in particular specific ones for automotive,aerospace, etc.)
• Literature: (Hormann et al., 2006)

References
–04–2015-05-04–main
–
90/91

References–04–2015-05-04–main
–
91/91
Abrahamsson, P., Salo, O., Ronkainen, J., and Warsta, J. (2002). Agile software development methods. review and analysis. TechnicalReport 478.
Basili, V. R. and Weiss, D. M. (1984). A methodology for collecting valid software engineering data. IEEE Transactions of Software
Engineering, 10(6):728–738.
Beck, K. (1999). Extreme Programming Explained – Embrace Change. Addison-Wesley.
Boehm, B. W. (1988). A spiral model of software development and enhancement. IEEE Computer, 21(5):61–72.
Chidamber, S. R. and Kemerer, C. F. (1994). A metrics suite for object oriented design. IEEE Transactions on Software Engineering,20(6):476–493.
Hormann, K., Dittmann, L., Hindel, B., and Muller, M. (2006). SPICE in der Praxis: Interpretationshilfe fur Anwender und Assessoren.dpunkt.verlag.
IEEE (1990). IEEE Standard Glossary of Software Engineering Terminology. Std 610.12-1990.
ISO/IEC (2011). Information technology Software engineering Software measurement process. 15939:2011.
Kan, S. H. (2003). Metrics and models in Software Quality Engineering. Addison-Wesley, 2nd edition.
Ludewig, J. and Lichter, H. (2013). Software Engineering. dpunkt.verlag, 3. edition.
Schwaber, K. (1995). SCRUM development process. In Sutherland, J. et al., editors, Business Object Design and Implementation,
OOPSLA’95 Workshop Proceedings. Springer-Verlag.
Team, C. P. (2010). Cmmi for development, version 1.3. Technical Report ESC-TR-2010-033, CMU/SEI.
V-Modell XT (2006). V-Modell XT. Version 1.4.
Zullighoven, H. (2005). Object-Oriented Construction Handbook - Developing Application-Oriented Software with the Tools and Materials
Approach. dpunkt.verlag/Morgan Kaufmann.